
Combined Application of Lime and a Nitrification Inhibitor (3,4-Dimethylpyrazole Phosphate) Markedly Decreased Nitrous Oxide Emissions from an Acid Soil

 ,
,  ,
,  and
and
Abstract
:1. Introduction
2. Materials and Methods
2.1. Soil Collection and Preparation
2.2. Lime, DMPP Coated Urea (ENTEC), and Copper Sulphate
2.3. Pre-Incubation and pH Adjustment
2.4. Experimental Design
2.5. Gas Sampling and Measurement
2.6. Destructive Soil Sampling and Analysis
2.7. Statistical Analysis
3. Results
3.1. Soil pH
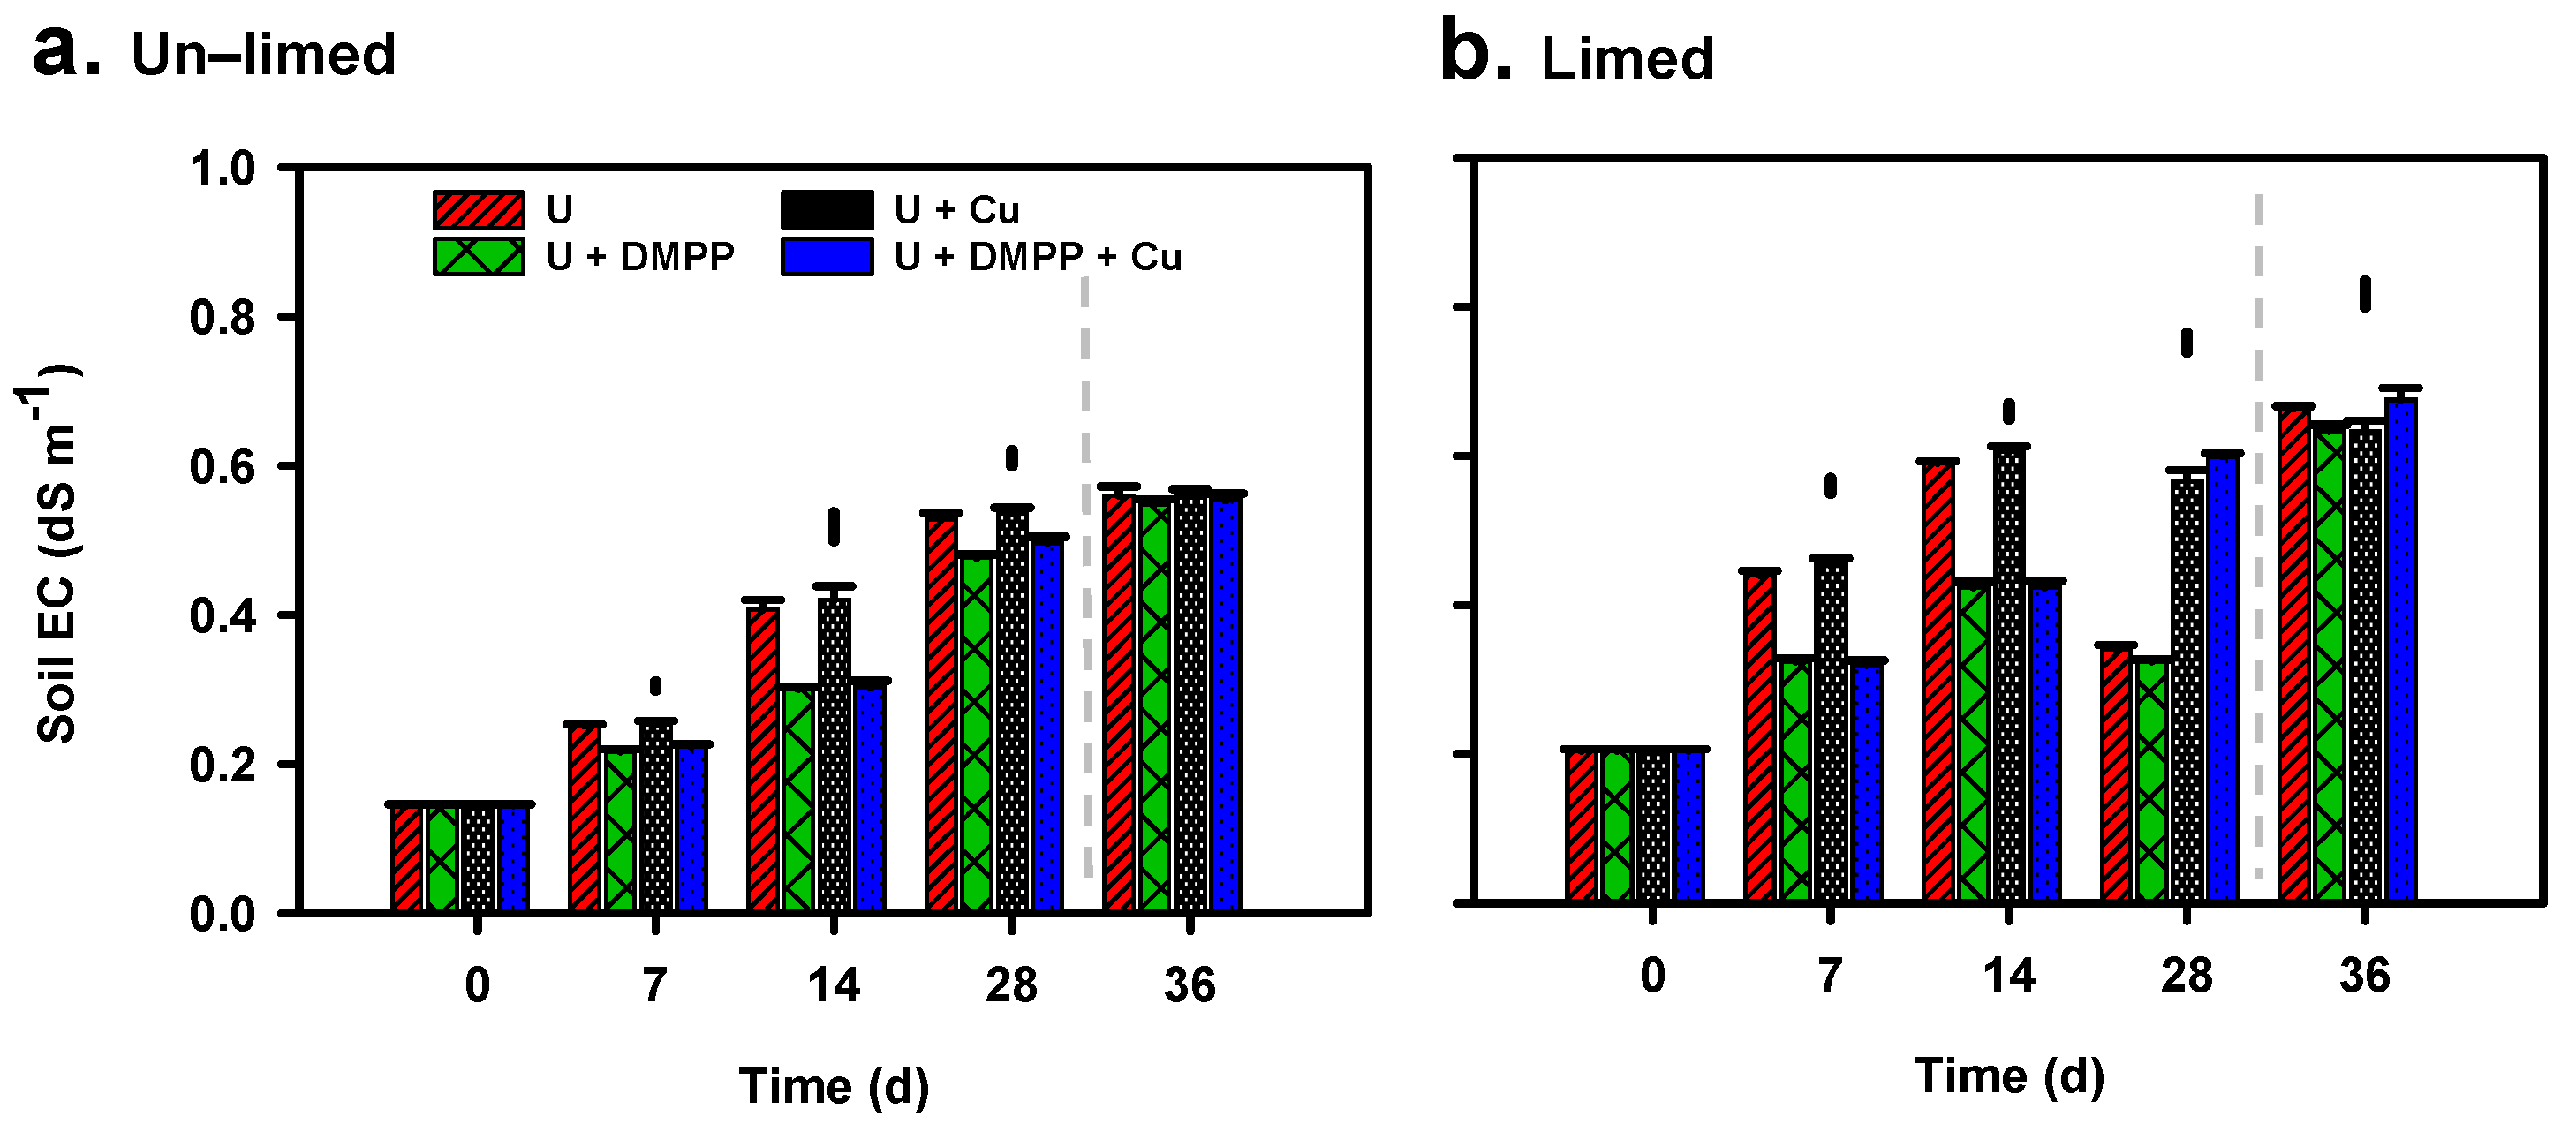
3.2. Soil EC
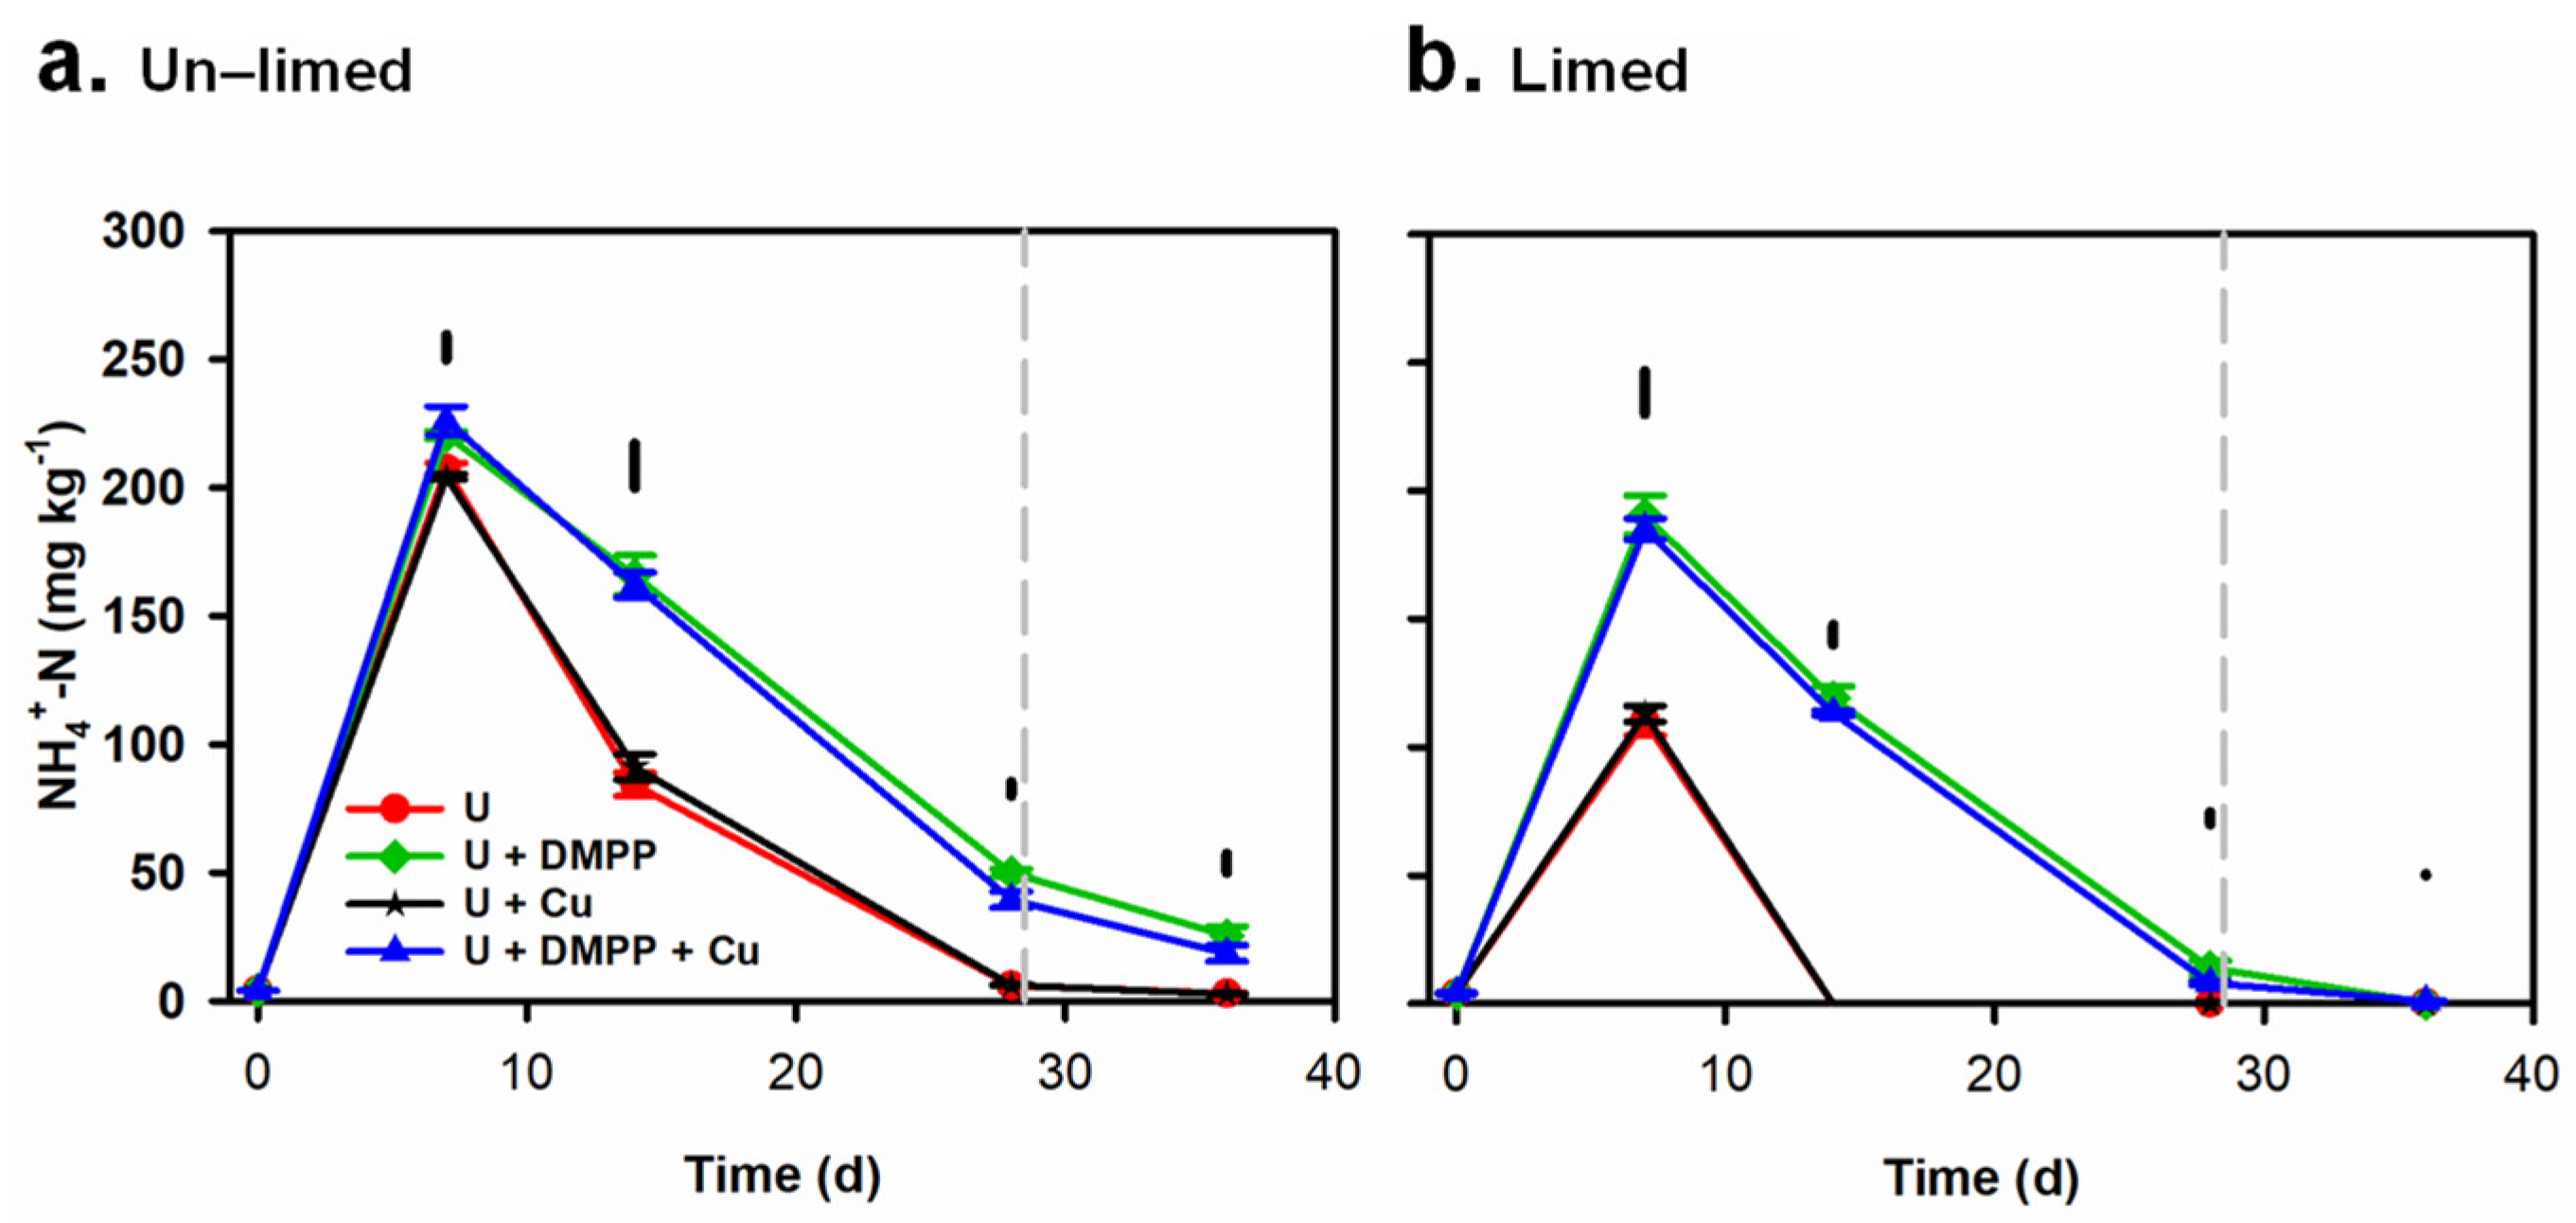
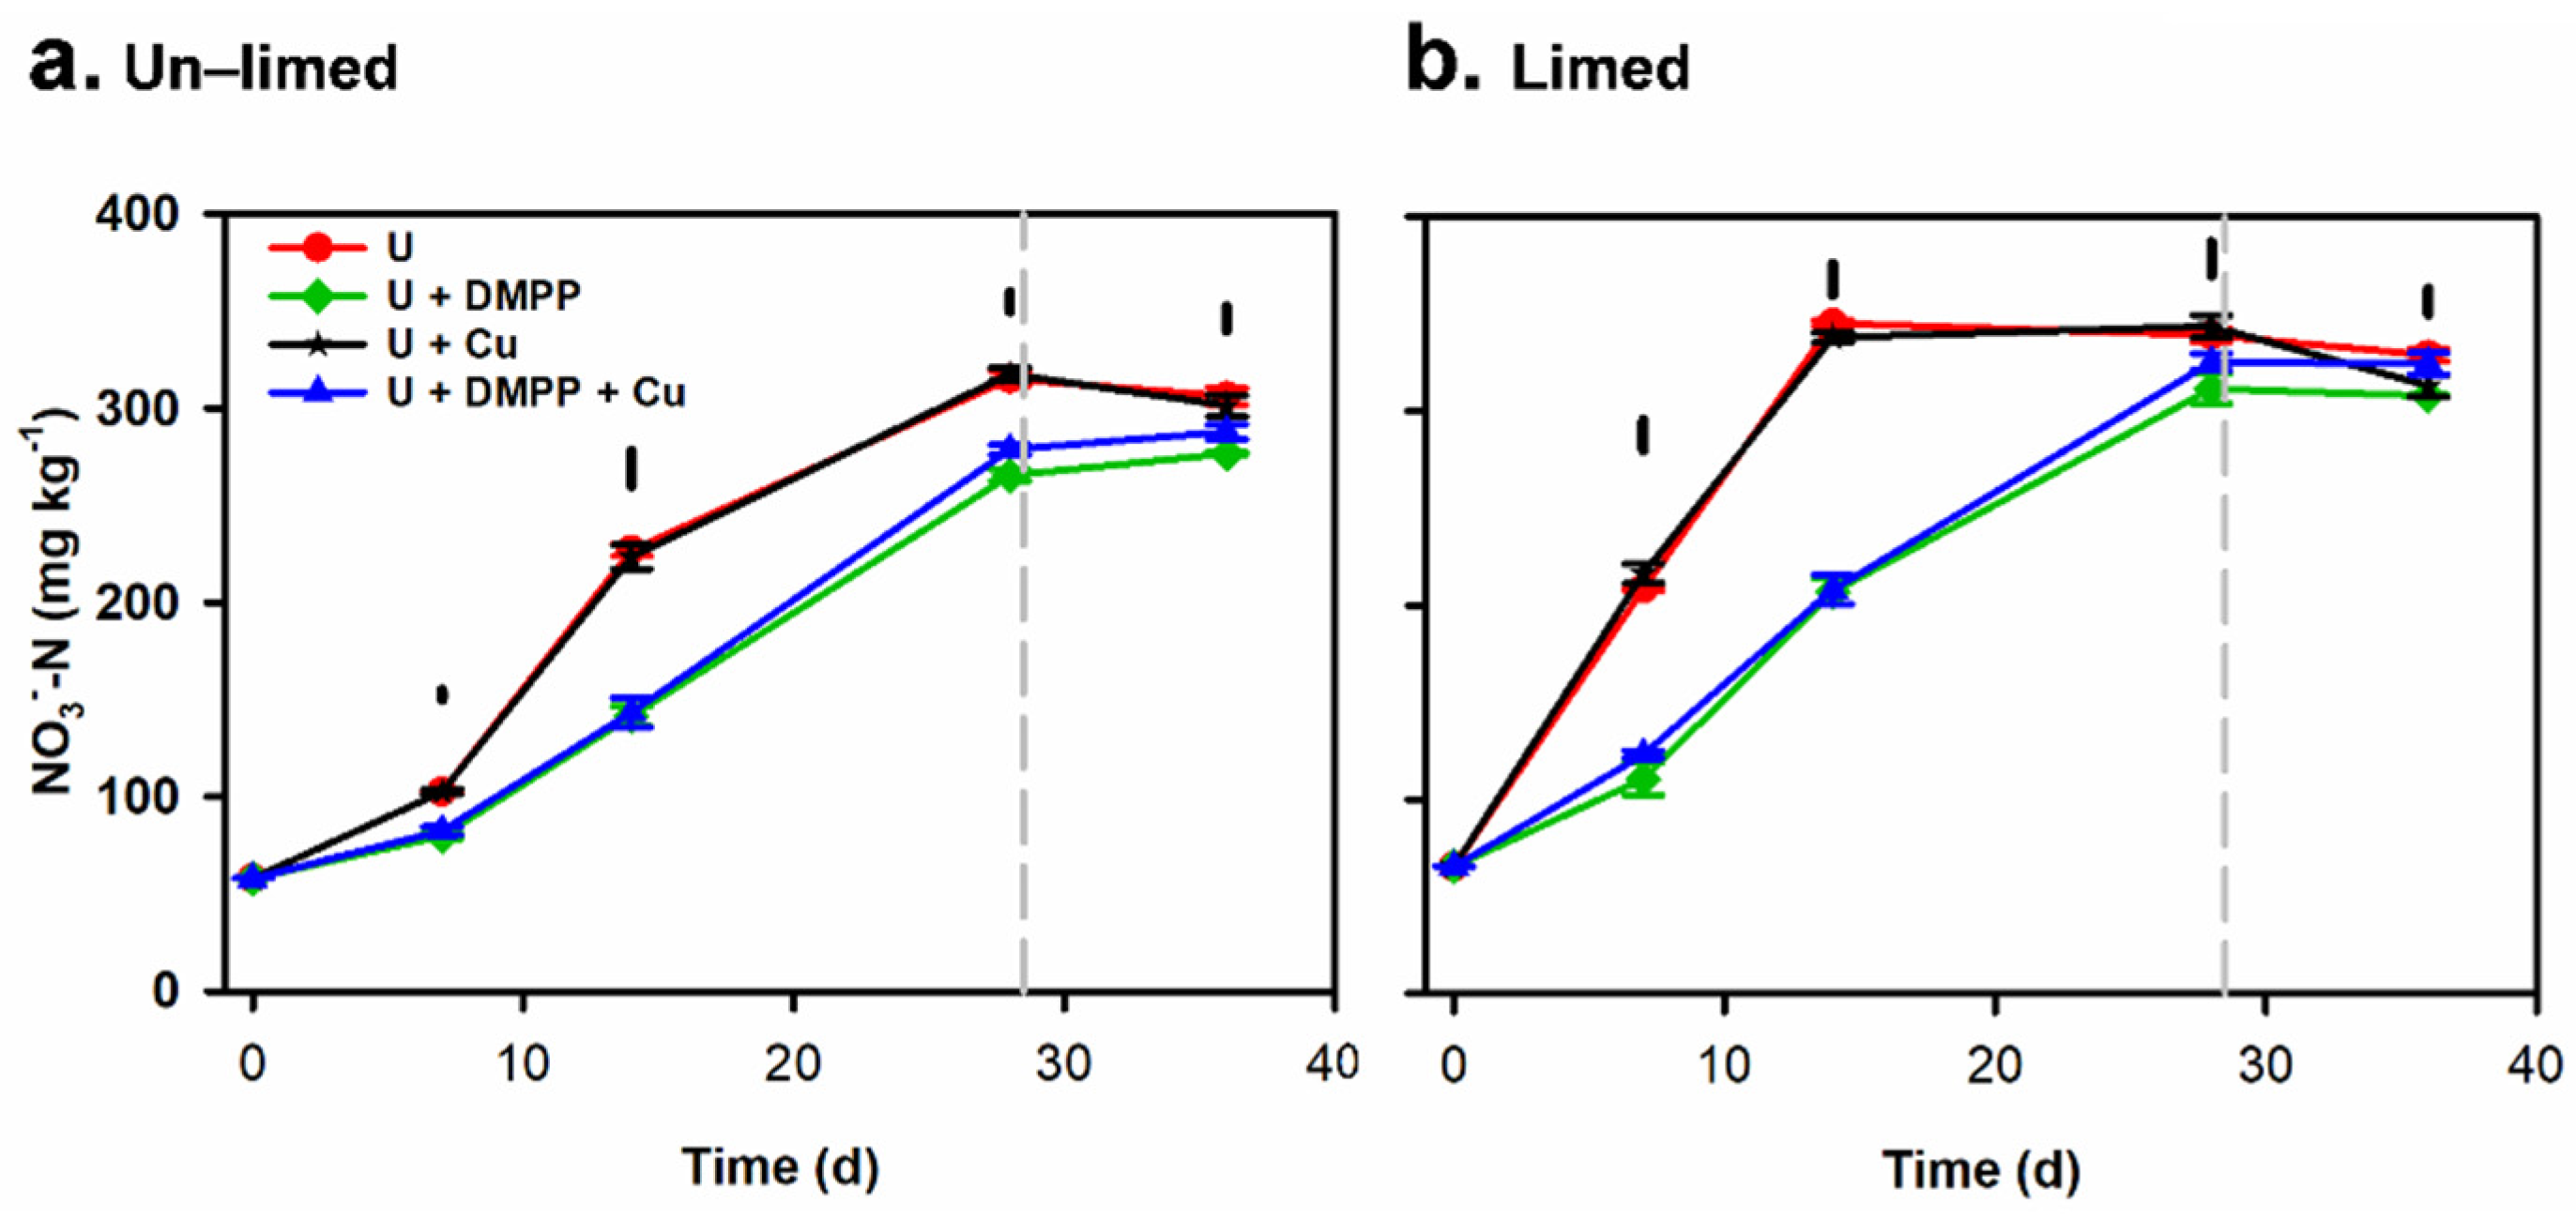
3.3. Changes in Soil Mineral N (NH4+ N and NO3−–N) Concentrations in Soil
3.4. Net Nitrification and Net Mineralisation Rates
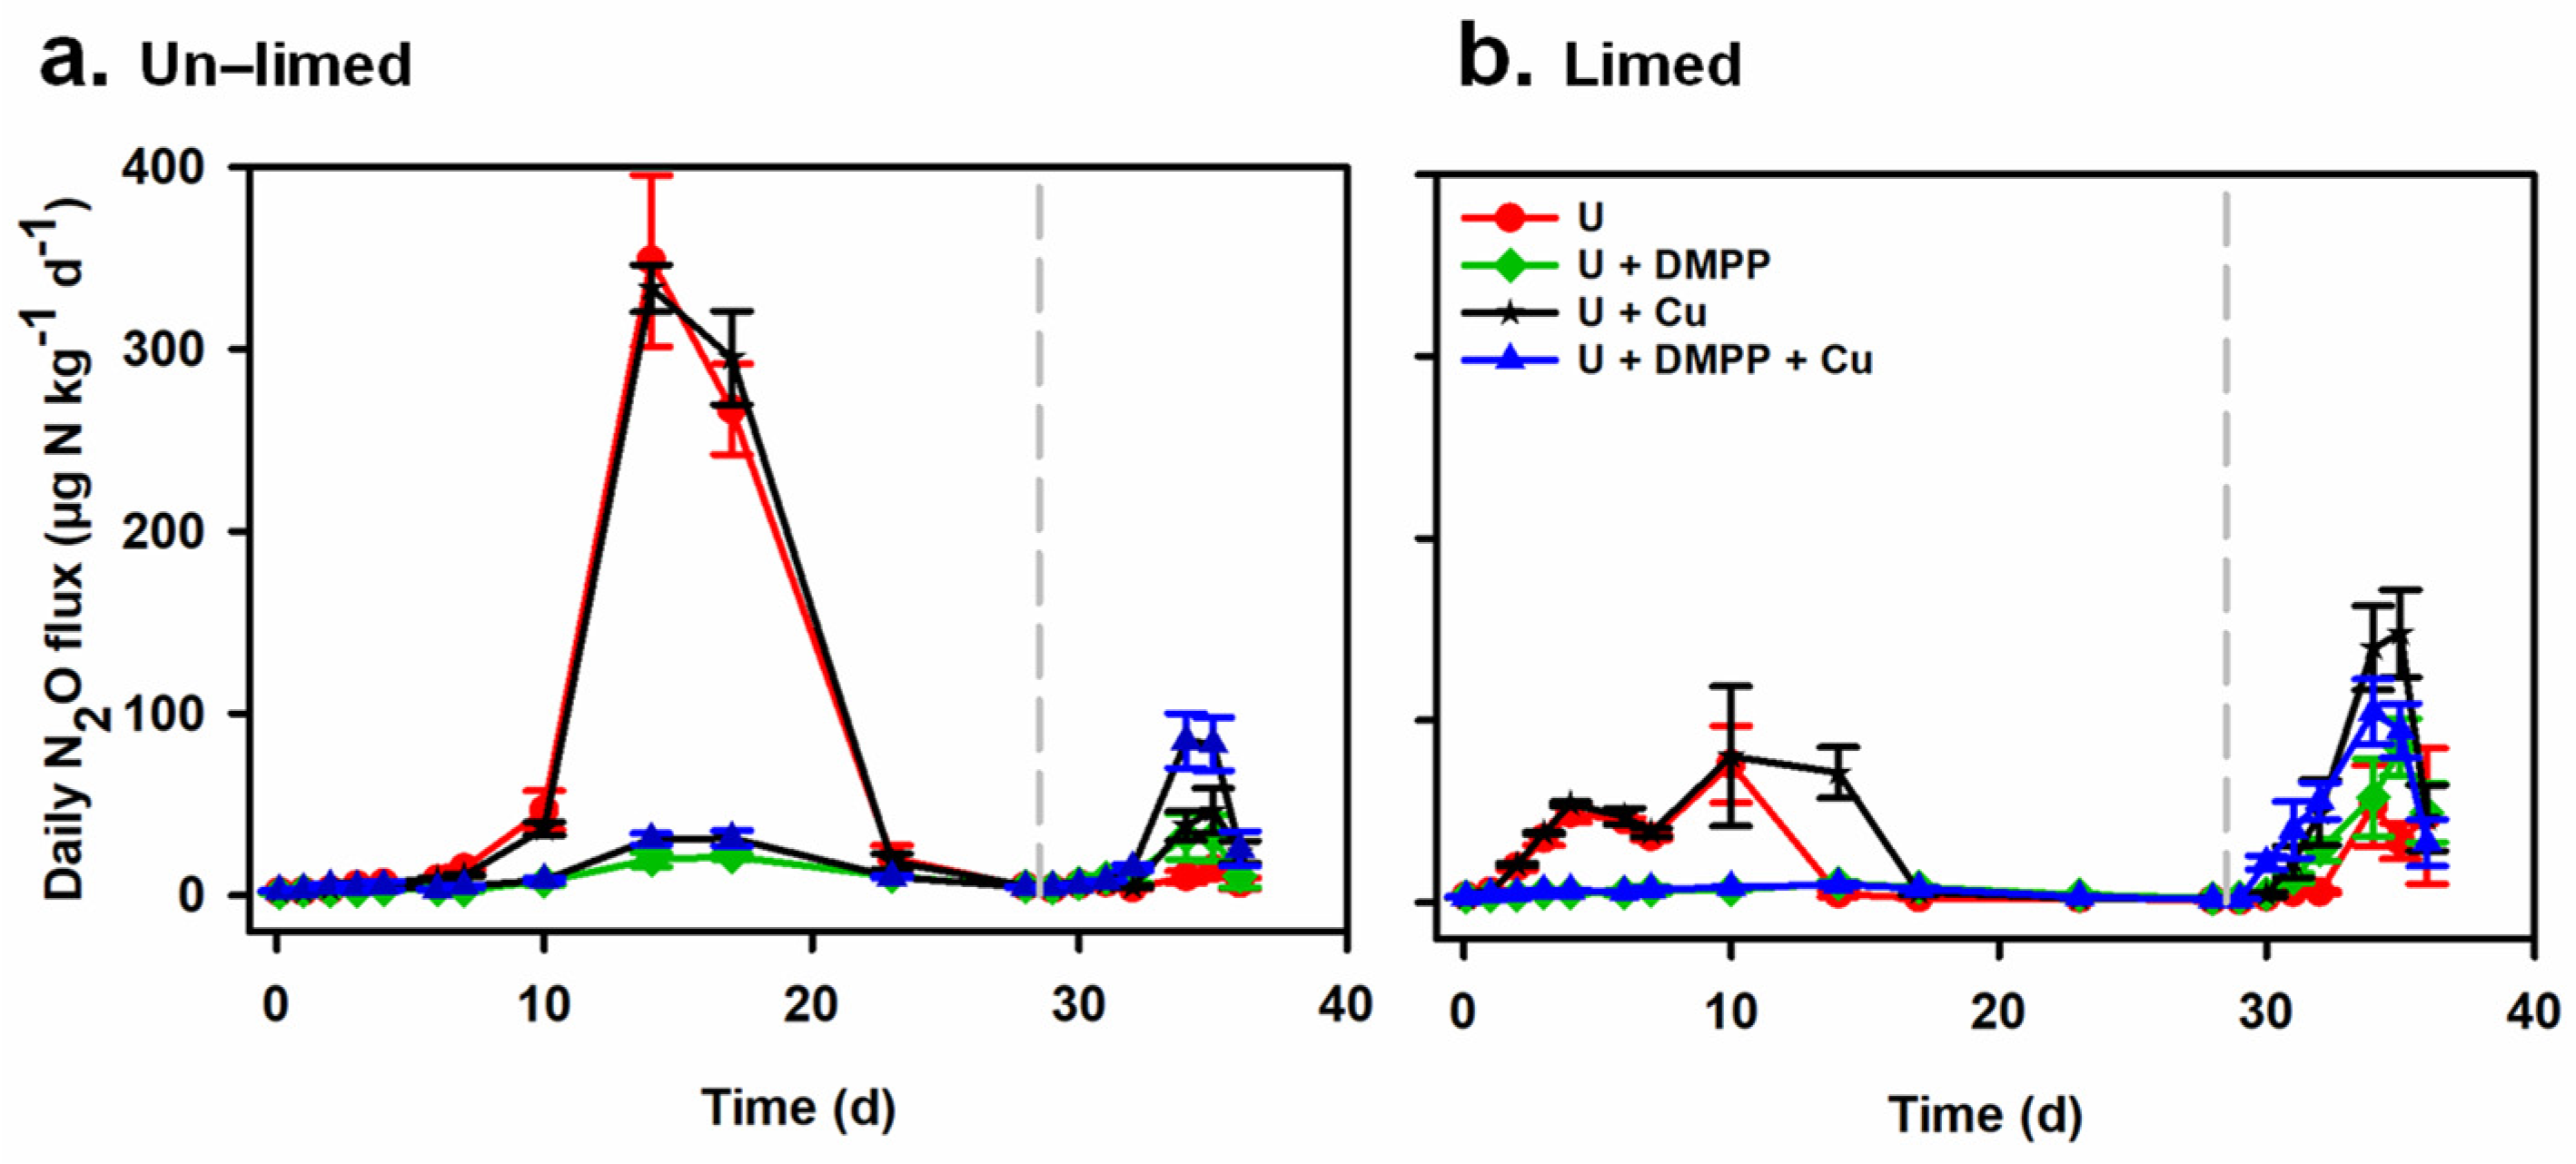
3.5. Nitrous Oxide Emissions
3.6. Correlation Analysis
4. Discussion
4.1. Co-Application of DMPP with Urea to an Acidic Soil Markedly Decreases Nitrous Oxide Emissions
4.2. Lime Application to an Acidic Soil also Reduces Nitrous Oxide Emissions
4.3. Ineffectiveness of Cu on N2O Emissions
5. Conclusions
Supplementary Materials
Author Contributions
Funding
Data Availability Statement
Acknowledgments
Conflicts of Interest
References
- IPCC. Synthesis Report. Contribution of Working Groups I, II and III to the Fifth Assessment Report of the Intergovernmental Panel on Climate Change; IPCC: Geneva, Switzerland, 2014; p. 151. [Google Scholar]
- Tian, H.; Yang, J.; Xu, R.; Lu, C.; Canadell, J.G.; Davidson, E.A.; Jackson, R.B.; Arneth, A.; Chang, J.; Ciais, P.; et al. Global soil nitrous oxide emissions since the preindustrial era estimated by an ensemble of terrestrial biosphere models: Magnitude, attribution, and uncertainty. Glob. Chang. Biol. 2019, 25, 640–659. [Google Scholar] [CrossRef] [PubMed] [Green Version]
- Tian, H.; Xu, R.; Canadell, J.G.; Thompson, R.L.; Winiwarter, W.; Suntharalingam, P.; Davidson, E.A.; Ciais, P.; Jackson, R.B.; Janssens-Maenhout, G.; et al. A comprehensive quantification of global nitrous oxide sources and sinks. Nature 2020, 586, 248–256. [Google Scholar] [CrossRef] [PubMed]
- Hu, H.-W.; Chen, D.; He, J.-Z. Microbial regulation of terrestrial nitrous oxide formation: Understanding the biological pathways for prediction of emission rates. FEMS Microbiol. Rev. 2015, 39, 729–749. [Google Scholar] [CrossRef]
- Zhang, J.; Lan, T.; Müller, C.; Cai, Z. Dissimilatory nitrate reduction to ammonium (DNRA) plays an important role in soil nitrogen conservation in neutral and alkaline but not acidic rice soil. J. Soils Sediments 2015, 15, 523–531. [Google Scholar] [CrossRef]
- Granli, T.; Bøckman, O.C. Nitrous oxide (N2O) emissions from soils in warm climates. Fertil. Res. 1995, 42, 159–163. [Google Scholar] [CrossRef]
- Linn, D.M.; Doran, J.W. Effect of water-filled pore space on carbon dioxide and nitrous oxide production in tilled and nontilled Soils. Soil Sci. Soc. Am. J. 1984, 48, 1267–1272. [Google Scholar] [CrossRef] [Green Version]
- Bremner, J.M. Sources of nitrous oxide in soils. Nutr. Cycl. Agroecosyst. 1997, 49, 7–16. [Google Scholar] [CrossRef]
- Stevens, R.J.; Laughlin, R.J. Measurement of nitrous oxide and di-nitrogen emissions from agricultural soils. Nutr. Cycl. Agroecosyst. 1998, 52, 131–139. [Google Scholar] [CrossRef]
- Khalil, K.; Mary, B.; Renault, P. Nitrous oxide production by nitrification and denitrification in soil aggregates as affected by O2 concentration. Soil Biol. Biochem. 2004, 36, 687–699. [Google Scholar] [CrossRef]
- Firestone, M.K.; Davidson, E.A. Microbiological basis of NO and N2O production and consumption in soil. Exch. Trace Gases Between Terr. Ecosyst. Atmos. 1989, 47, 7–21. [Google Scholar]
- Harris, E.; Diaz-Pines, E.; Stoll, E.; Schloter, M.; Schulz, S.; Duffner, C.; Li, K.; Moore, K.L.; Ingrisch, J.; Reinthaler, D.; et al. Denitrifying pathways dominate nitrous oxide emissions from managed grassland during drought and rewetting. Sci. Adv. 2021, 7, eabb7118. [Google Scholar] [CrossRef] [PubMed]
- Hofstra, N.; Bouwman, A.F. Denitrification in agricultural soils: Summarizing published data and estimating global annual rates. Nutr. Cycl. Agroecosyst. 2005, 72, 267–278. [Google Scholar] [CrossRef]
- Davidson, E.A.; Swank, W.T. Environmental parameters regulating gaseous nitrogen losses from two forested ecosystems via nitrification and denitrification. Appl. Environ. Microbiol. 1986, 52, 1287. [Google Scholar] [CrossRef] [PubMed] [Green Version]
- Huang, T.; Gao, B.; Hu, X.-K.; Lu, X.; Well, R.; Christie, P.; Bakken, L.R.; Ju, X.-T. Ammonia-oxidation as an engine to generate nitrous oxide in an intensively managed calcareous Fluvo-aquic soil. Sci. Rep. 2014, 4, 3950. [Google Scholar] [CrossRef] [PubMed]
- Mørkved, P.T.; Dörsch, P.; Bakken, L.R. The N2O product ratio of nitrification and its dependence on long-term changes in soil pH. Soil Biol. Biochem. 2007, 39, 2048–2057. [Google Scholar] [CrossRef]
- Hu, H.-W.; Zhang, L.-M.; Dai, Y.; Di, H.-J.; He, J.-Z. pH-dependent distribution of soil ammonia oxidizers across a large geographical scale as revealed by high-throughput pyrosequencing. J. Soils Sediments 2013, 13, 1439–1449. [Google Scholar] [CrossRef]
- He, J.-Z.; Shen, J.-P.; Zhang, L.-M.; Zhu, Y.-G.; Zheng, Y.-M.; Xu, M.-G.; Di, H. Quantitative analyses of the abundance and composition of ammonia-oxidizing bacteria and ammonia-oxidizing archaea of a Chinese upland red soil under long-term fertilization practices. Environ. Microbiol. 2007, 9, 2364–2374. [Google Scholar] [CrossRef]
- Shen, J.-p.; Zhang, L.-m.; Zhu, Y.-g.; Zhang, J.-b.; He, J.-z. Abundance and composition of ammonia-oxidizing bacteria and ammonia-oxidizing archaea communities of an alkaline sandy loam. Environ. Microbiol. 2008, 10, 1601–1611. [Google Scholar] [CrossRef]
- Guo, J.H.; Liu, X.J.; Zhang, Y.; Shen, J.L.; Han, W.X.; Zhang, W.F.; Christie, P.; Goulding, K.W.T.; Vitousek, P.M.; Zhang, F.S. Significant acidification in major Chinese croplands. Science 2010, 327, 1008. [Google Scholar] [CrossRef] [Green Version]
- Goulding, K.W.T. Soil acidification and the importance of liming agricultural soils with particular reference to the United Kingdom. Soil Use Manag. 2016, 32, 390–399. [Google Scholar] [CrossRef]
- Kirchmann, H.; Witter, E. Ammonia volatilization during aerobic and anaerobic manure decomposition. Plant Soil 1989, 115, 35–41. [Google Scholar] [CrossRef]
- Thangarajan, R.; Bolan, N.S.; Tian, G.; Naidu, R.; Kunhikrishnan, A. Role of organic amendment application on greenhouse gas emission from soil. Sci. Total Environ. 2013, 465, 72–96. [Google Scholar] [CrossRef] [PubMed]
- ŠImek, M.; Cooper, J.E. The influence of soil pH on denitrification: Progress towards the understanding of this interaction over the last 50 years. Eur. J. Soil Sci. 2002, 53, 345–354. [Google Scholar] [CrossRef]
- Barton, L.; Gleeson, D.B.; Maccarone, L.D.; Zúñiga, L.P.; Murphy, D.V. Is liming soil a strategy for mitigating nitrous oxide emissions from semi-arid soils? Soil Biol. Biochem. 2013, 62, 28–35. [Google Scholar] [CrossRef]
- Feng, K.; Yan, F.; Hütsch, B.W.; Schubert, S. Nitrous oxide emission as affected by liming an acidic mineral soil used for arable agriculture. Nutr. Cycl. Agroecosyst. 2003, 67, 283–292. [Google Scholar] [CrossRef]
- van Cleemput, O. Subsoils: Chemo-and biological denitrification, N2O and N2 emissions. Nutr. Cycl. Agroecosyst. 1998, 52, 187–194. [Google Scholar] [CrossRef]
- Martikainen, P.J. Nitrous oxide emission associated with autotrophic ammonium oxidation in acid coniferous forest soil. Appl. Environ. Microbiol. 1985, 50, 1519. [Google Scholar] [CrossRef] [Green Version]
- Clough, T.J.; Kelliher, F.M.; Sherlock, R.R.; Ford, C.D. Lime and soil moisture effects on nitrous oxide emissions from a urine patch. Soil Sci. Soc. Am. J. 2004, 68, 1600–1609. [Google Scholar] [CrossRef] [Green Version]
- Vallis, I.; Catchpoole, V.; Hughes, R.; Myers, R.; Ridge, D.; Weier, K. Recovery in plants and soils of 15N applied as subsurface bands of urea to sugarcane. Aust. J. Agric. Res. 1996, 47, 355–370. [Google Scholar] [CrossRef]
- Prasertsak, P.; Freney, J.R.; Denmead, O.T.; Saffigna, P.G.; Prove, B.G.; Reghenzani, J.R. Effect of fertilizer placement on nitrogen loss from sugarcane in tropical Queensland. Nutr. Cycl. Agroecosyst. 2002, 62, 229–239. [Google Scholar] [CrossRef]
- Prasad, R.; Power, J.F. Nitrification inhibitors for agriculture, health, and the environment. In Advances in Agronomy; Sparks, D.L., Ed.; Academic Press: Cambridge, MA, USA, 1995; Volume 54, pp. 233–281. [Google Scholar]
- Weiske, A.; Benckiser, G.; Herbert, T.; Ottow, J. Influence of the nitrification inhibitor 3,4-dimethylpyrazole phosphate (DMPP) in comparison to dicyandiamide (DCD) on nitrous oxide emissions, carbon dioxide fluxes and methane oxidation during 3 years of repeated application in field experiments. Biol. Fertil. Soils 2001, 34, 109–117. [Google Scholar] [CrossRef]
- Li, H.; Liang, X.; Chen, Y.; Lian, Y.; Tian, G.; Ni, W. Effect of nitrification inhibitor DMPP on nitrogen leaching, nitrifying organisms, and enzyme activities in a rice-oilseed rape cropping system. J. Environ. Sci. 2008, 20, 149–155. [Google Scholar] [CrossRef]
- Di, H.J.; Cameron, K.C.; Shen, J.P.; Winefield, C.S.; O’Callaghan, M.; Bowatte, S.; He, J.Z. Nitrification driven by bacteria and not archaea in nitrogen-rich grassland soils. Nat. Geosci. 2009, 2, 621–624. [Google Scholar] [CrossRef]
- Gubry-Rangin, C.; Nicol, G.W.; Prosser, J.I. Archaea rather than bacteria control nitrification in two agricultural acidic soils. FEMS Microbiol. Ecol. 2010, 74, 566–574. [Google Scholar] [CrossRef] [PubMed] [Green Version]
- Barth, G.; von Tucher, S.; Schmidhalter, U. Influence of soil parameters on the effect of 3,4-dimethylpyrazole-phosphate as a nitrification inhibitor. Biol. Fertil. Soils 2001, 34, 98–102. [Google Scholar] [CrossRef]
- Subbarao, G.V.; Ito, O.; Sahrawat, K.L.; Berry, W.L.; Nakahara, K.; Ishikawa, T.; Watanabe, T.; Suenaga, K.; Rondon, M.; Rao, I.M. Scope and strategies for regulation of nitrification in agricultural systems—Challenges and opportunities. Crit. Rev. Plant Sci. 2006, 25, 303–335. [Google Scholar] [CrossRef] [Green Version]
- Barth, G.; Von Tucher, S.; Schmidhalter, U. Effectiveness of 3, 4-dimethylpyrazole phosphate as nitriflcation inhibitor in soil as influenced by inhibitor concentration, application form, and soil matric potential. Pedosphere 2008, 18, 378–385. [Google Scholar] [CrossRef]
- Huang, Y.; Li, Y.; Yao, H. Nitrate enhances N 2 O emission more than ammonium in a highly acidic soil. J. Soils Sediments 2014, 14, 146–154. [Google Scholar] [CrossRef]
- Zhang, M.; Wang, W.; Tang, L.; Heenan, M.; Xu, Z. Effects of nitrification inhibitor and herbicides on nitrification, nitrite and nitrate consumptions and nitrous oxide emission in an Australian sugarcane soil. Biol. Fertil. Soils 2018, 54, 697–706. [Google Scholar] [CrossRef]
- Wang, W.; Salter, B.; Reeves, S.; Brieffies, T.; Perna, J. Nitrous oxide emissions from a sugarcane soil under different fallow and nitrogen fertiliser management regimes. In Proceedings of the Australian Society of Sugar Cane Technologists, Palm Cove, Australia, 1–4 May 2012; pp. 1–8. [Google Scholar]
- Xue, Y.; Wu, Z.-J.; Zhang, L.; Gong, P.; Dong, X.-X.; Nie, Y.-X. Inhibitory effect of DMPP on soil nitrification as affected by soil moisture content, pH and organic matter. Chin. J. Appl. Ecol. 2012, 23, 2663–2669. [Google Scholar]
- Kaveney, B.; Condon, J.; Doran, G.; Galea, F.; Rigg, J. The distribution of soil nitrifiers and efficacy of 3,4-dimethylpyrazole phosphate changes with soil depth and calcium carbonate application. Soil Biol. Biochem. 2020, 150, 108009. [Google Scholar] [CrossRef]
- Signor, D.; Cerri, C.E.P. Nitrous oxide emissions in agricultural soils: A review. Pesqui. Agropecu. Trop. 2013, 43, 322–338. [Google Scholar] [CrossRef]
- Thomson, A.J.; Giannopoulos, G.; Pretty, J.; Baggs, E.M.; Richardson, D.J. Biological sources and sinks of nitrous oxide and strategies to mitigate emissions. Philos. Trans. R. Soc. Lond. B Biol. Sci. 2012, 367, 1157–1168. [Google Scholar] [CrossRef] [Green Version]
- Shen, W.; Xue, H.; Gao, N.; Shiratori, Y.; Kamiya, T.; Fujiwara, T.; Isobe, K.; Senoo, K. Effects of copper on nitrous oxide (N2O) reduction in denitrifiers and N2O emissions from agricultural soils. Biol. Fertil. Soils 2020, 56, 39–51. [Google Scholar] [CrossRef]
- Richardson, D.; Felgate, H.; Watmough, N.; Thomson, A.; Baggs, E. Mitigating release of the potent greenhouse gas N2O from the nitrogen cycle—Could enzymic regulation hold the key? Trends Biotechnol. 2009, 27, 388–397. [Google Scholar] [CrossRef]
- Felgate, H.; Giannopoulos, G.; Sullivan, M.J.; Gates, A.J.; Clarke, T.A.; Baggs, E.; Rowley, G.; Richardson, D.J. The impact of copper, nitrate and carbon status on the emission of nitrous oxide by two species of bacteria with biochemically distinct denitrification pathways. Environ. Microbiol. 2012, 14, 1788–1800. [Google Scholar] [CrossRef]
- Granger, J.; Ward, B.B. Accumulation of nitrogen oxides in copper-limited cultures of denitrifying bacteria. Limnol. Oceanogr. 2003, 48, 313–318. [Google Scholar] [CrossRef]
- Isbell, R. The Australian Soil Classification; CSIRO Publishing: Clayton, Australia, 2016. [Google Scholar]
- Rayment, G.E.; Lyons, D.J. Soil Chemical Methods: Australasia; CSIRO Publishing: Melbourne, Australia, 2011. [Google Scholar]
- Choudhary, M.I.; Shalaby, A.A.; Al-Omran, A.M. Water holding capacity and evaporation of calcareous soils as affected by four synthetic polymers. Commun. Soil Sci. Plant Anal. 1995, 26, 2205–2215. [Google Scholar] [CrossRef]
- Wang, W.J.; Dalal, R.C.; Moody, P.W.; Smith, C.J. Relationships of soil respiration to microbial biomass, substrate availability and clay content. Soil Biol. Biochem. 2003, 35, 273–284. [Google Scholar] [CrossRef]
- Lan, T.; Han, Y.; Roelcke, M.; Nieder, R.; Cai, Z. Processes leading to N2O and NO emissions from two different Chinese soils under different soil moisture contents. Plant Soil 2013, 371, 611–627. [Google Scholar] [CrossRef]
- Vargas, V.P.; Cantarella, H.; Martins, A.A.; Soares, J.R.; do Carmo, J.B.; de Andrade, C.A. Sugarcane crop residue increases N2O and CO2 emissions under high soil moisture conditions. Sugar Tech. 2014, 16, 174–179. [Google Scholar] [CrossRef]
- Wang, L.; Cai, Z. Nitrous oxide production at different soil moisture contents in an arable soil in China. Soil Sci. Plant Nutr. 2008, 54, 786–793. [Google Scholar] [CrossRef]
- Janke, C.K.; Moody, P.; Bell, M.J. Three-dimensional dynamics of nitrogen from banded enhanced efficiency fertilizers. Nutr. Cycl. Agroecosyst. 2020. [Google Scholar] [CrossRef]
- Calcino, D.; Schroeder, B.; Panitz, J.; Hurney, A.; Skocaj, D.; Wood, A.; Salter, B. Australian Sugarcane Nutrition Manual; Sugar Research Australia: Indooroopilly, Australia, 2018; p. 114. Available online: https://sugarresearch.com.au/sugar_files/2017/02/GCM2307-Sugar-Research-Australia-Publication-Layout-F-Web.pdf (accessed on 23 February 2022).
- Dunn, L. Lime-requirement determination of soils by means of titration curves. Soil Sci. 1943, 56, 341–352. [Google Scholar] [CrossRef]
- Wu, J.; Brookes, P.C.; Jenkinson, D.S. Evidence for the use of a control in the fumigation-incubation method for measuring microbial biomass carbon in soil. Soil Biol. Biochem. 1996, 28, 511–518. [Google Scholar] [CrossRef]
- Mkhabela, M.S.; Gordon, R.; Burton, D.; Madani, A.; Hart, W. Effect of lime, dicyandiamide and soil water content on ammonia and nitrous oxide emissions following application of liquid hog manure to a marshland soil. Plant Soil 2006, 284, 351–361. [Google Scholar] [CrossRef]
- Hütsch, B.W.; Wang, X.; Feng, K.; Yan, F.; Schubert, S. Nitrous oxide emission as affected by changes in soil water content and nitrogen fertilization. J. Plant Nutr. Soil Sci. 1999, 162, 607–613. [Google Scholar] [CrossRef]
- STAR. Biometrics and Breeding Informatics, Version 2.0.1. PBGB Division. International Rice Research Institute: Los Baños, Philippines, 2014.
- SigmaPlot, Version 14.5; Systat Software Inc.: San Jose, CA, USA, 2020.
- IPCC. Guidelines for National Greenhouse Gas Inventories; Institute for Global Environmental Strategies: Geneva, Switzerland, 2006; p. 54. [Google Scholar]
- Weslien, P.; Kasimir Klemedtsson, Å.; Börjesson, G.; Klemedtsson, L. Strong pH influence on N2O and CH4 fluxes from forested organic soils. Eur. J. Soil Sci. 2009, 60, 311–320. [Google Scholar] [CrossRef]
- Liu, B.; Mørkved, P.T.; Frostegård, Å.; Bakken, L.R. Denitrification gene pools, transcription and kinetics of NO, N2O and N2 production as affected by soil pH. FEMS Microbiol. Ecol. 2010, 72, 407–417. [Google Scholar] [CrossRef] [Green Version]
- Qu, Z.; Wang, J.; Almøy, T.; Bakken, L.R. Excessive use of nitrogen in Chinese agriculture results in high N2O/(N2O + N2) product ratio of denitrification, primarily due to acidification of the soils. Glob. Chang. Biol. 2014, 20, 1685–1698. [Google Scholar] [CrossRef] [Green Version]
- Zerulla, W.; Barth, T.; Dressel, J.; Erhardt, K.; Horchler von Locquenghien, K.; Pasda, G.; Rädle, M.; Wissemeier, A. 3,4-Dimethylpyrazole phosphate (DMPP)—A new nitrification inhibitor for agriculture and horticulture. Biol. Fertil. Soils 2001, 34, 79–84. [Google Scholar] [CrossRef]
- Mukhtar, H.; Lin, Y.-P. Soil nitrification potential influences the performance of nitrification inhibitors DCD and DMPP in cropped and non-cropped soils. Agronomy 2019, 9, 599. [Google Scholar] [CrossRef] [Green Version]
- Gilsanz, C.; Báez, D.; Misselbrook, T.H.; Dhanoa, M.S.; Cárdenas, L.M. Development of emission factors and efficiency of two nitrification inhibitors, DCD and DMPP. Agric. Ecosyst. Environ. 2016, 216, 1–8. [Google Scholar] [CrossRef]
- Zhu, G.; Ju, X.; Zhang, J.; Müller, C.; Rees, R.M.; Thorman, R.E.; Sylvester-Bradley, R. Effects of the nitrification inhibitor DMPP (3,4-dimethylpyrazole phosphate) on gross N transformation rates and N2O emissions. Biol. Fertil. Soils 2019, 55, 603–615. [Google Scholar] [CrossRef]
- Scheer, C.; Rowlings, D.W.; De Antoni Migliorati, M.; Lester, D.W.; Bell, M.J.; Grace, P.R. Effect of enhanced efficiency fertilisers on nitrous oxide emissions in a sub-tropical cereal cropping system. Soil Res. 2016, 54, 544–551. [Google Scholar] [CrossRef] [Green Version]
- De Antoni Migliorati, M.; Scheer, C.; Grace, P.R.; Rowlings, D.W.; Bell, M.; McGree, J. Influence of different nitrogen rates and DMPP nitrification inhibitor on annual N2O emissions from a subtropical wheat–maize cropping system. Agric. Ecosyst. Environ. 2014, 186, 33–43. [Google Scholar] [CrossRef] [Green Version]
- Yan, N.; Marschner, P.; Cao, W.; Zuo, C.; Qin, W. Influence of salinity and water content on soil microorganisms. Int. Soil Water Conserv. Res. 2015, 3, 316–323. [Google Scholar] [CrossRef] [Green Version]
- Puttanna, K.; Gowda, N.M.N.; Rao, E.V.S.P. Evaluation of nitrification inhibitors for use under tropical conditions. Commun. Soil Sci. Plant Anal. 1999, 30, 519–524. [Google Scholar] [CrossRef]
- Rose, T.J.; Morris, S.G.; Quin, P.; Kearney, L.J.; Kimber, S.; Van Zwieten, L. The nitrification inhibitor DMPP applied to subtropical rice has an inconsistent effect on nitrous oxide emissions. Soil Res. 2017, 55, 547–552. [Google Scholar] [CrossRef]
- Khaliq, M.A.; Tarin, M.W.K.; Jingxia, G.; Yanhui, C.; Guo, W. Soil liming effects on CH4, N2O emission and Cd, Pb accumulation in upland and paddy rice. Environ. Pollut. 2019, 248, 408–420. [Google Scholar] [CrossRef]
- Yan, D.; Wang, Q.; Mao, L.; Ma, T.; Li, Y.; Ouyang, C.; Guo, M.; Cao, A. Interaction between nitrification, denitrification and nitrous oxide production in fumigated soils. Atmos. Environ. 2015, 103, 82–86. [Google Scholar] [CrossRef]


| Treatment | Net Nitrification Rates (mg N kg−1 Soil d−1) | Net Mineralisation Rates (mg N kg−1 Soil d−1) | |||
|---|---|---|---|---|---|
| 0–28 d (55% WHC) | 28–36 d (90% WHC) | 0–28 d (55% WHC) | 28–36 d (90% WHC) | ||
| Un-limed | U | 9.19 ± 0.38 Ab | −1.13 ± 0.78 Aa | 9.26 ± 0.22 Aa | −1.52 ± 0.81 Aa |
| U + DMPP | 7.41 ±0.47 Cb | 1.41 ± 0.47 Aa | 9.05 ± 0.56 Aa | −1.66 ± 0.48 Aa | |
| U + Cu | 9.27 ± 0.62 Ab | −2.03 ± 0.91 Aa | 9.35 ± 0.27 Aa | −2.47 ± 0.90 Aa | |
| U + DMPP + Cu | 7.88 ± 0.38 Bb | 1.15 ± 0.49 Aa | 9.15 ± 0.55 Aa | −1.47 ± 0.60 Aa | |
| Limed | U | 9.78 ± 0.14 Aa | −1.30 ± 0.13 Aa | 9.64 ± 0.18 Aa | −1.29 ± 0.13 Aa |
| U + DMPP | 8.79 ± 0.74 Ca | −0.46 ± 1.00 Aa | 9.14 ± 0.80 Aa | −2.16 ± 1.05 Aa | |
| U + Cu | 9.94 ± 0.59 Aa | −3.83 ± 1.23 Aa | 9.40 ± 0.57 Aa | −3.83 ± 1.23 Aa | |
| U + DMPP + Cu | 9.28 ± 0.35 Ba | −0.10 ± 0.86 Aa | 9.43 ± 0.47 Aa | −0.99 ± 0.80 Aa | |
| p-values | Lime | <0.001 | NS | NS | NS |
| Urea, DMPP, Cu | <0.001 | <0.001 | 0.02 | NS | |
| Lime × urea × DMPP × Cu | 0.007 | NS | NS | NS | |
| Treatment | Cumulative N2O Emissions (µg N kg−1 Soil) | ||
|---|---|---|---|
| 0–28 d (55% WHC) | 28–36 d (90% WHC) | ||
| Un-limed (pH 5.1) | U | 2778 ± 296 Aa | 47 ± 8.0 Aa |
| U + DMPP | 288.0 ± 19 Ba | 103 ± 32 Aa | |
| U + Cu | 2803 ± 154 Aa | 109 ± 20 Aa | |
| U + DMPP + Cu | 387.0 ± 31 Ba | 210 ± 31 Aa | |
| Limed (pH 6.9) | U | 582 ± 84 Ab | 110 ± 25 Aa |
| U + DMPP | 170 ± 8.0 Ba | 200 ± 38 Aa | |
| U + Cu | 867 ± 97 Ab | 389 ± 80 Aa | |
| U + DMPP + Cu | 169 ± 9.0 Ba | 349 ± 9.0 Aa | |
| Mean of un-limed treatments (pH 5.1) | 1564 ± 125 a | 117 ± 23 b | |
| Mean of limed treatments (pH 6.9) | 447.0 ± 49.3 b | 262 ± 50 a | |
| p-values | Lime | <0.001 | 0.002 |
| Urea, DMPP, Cu | <0.001 | <0.001 | |
| Lime × urea × DMPP × Cu | <0.001 | NS | |
| Variables | N2O | Soil pH | Soil EC | NH4+–N | NO3−–N | Net nitrification | Net mineralisation | N2O | Soil pH | Soil EC | NH4 +–N | NO3−–N | Net nitrification | Net mineralisation |
|---|---|---|---|---|---|---|---|---|---|---|---|---|---|---|
| Un-limed soil | 0–28 d (55% WHC) | 28–36 d (90% WHC) | ||||||||||||
| N2O | − | − | ||||||||||||
| Soil pH | −0.95 ns | − | −0.45 ns | − | ||||||||||
| Soil EC | 0.99 ** | −0.93 ns | − | −0.56 ns | 0.95 ns | − | ||||||||
| NH4+–N | −0.99 ** | 0.95 * | −0.99 ** | − | 0.49 ns | −0.99 ** | −0.99 ** | − | ||||||
| NO3−–N | 0.99 ** | −0.95 * | 0.99 ** | −0.99 ** | − | −0.46 ns | 0.99 ns | 0.94 ns | −0.98 ** | − | ||||
| Net nitrification | 0.99 ** | −0.95 * | 0.99 ** | −0.99 ** | 0.99 ** | − | 0.53 ns | −0.91 * | −0.99 ** | 0.96 ns | −0.89 ns | − | ||
| Net mineralisation | 0.94 ns | −0.79 ns | 0.97 * | −0.94 ns | 0.94 ns | 0.94 ns | − | 0.15 ns | −0.35 ns | −0.58 ns | 0.48 ns | −0.31 ns | 0.69 ns | − |
| Limed soil | ||||||||||||||
| N2O | − | − | ||||||||||||
| Soil pH | −0.81 ns | − | 0.99 ** | − | ||||||||||
| Soil EC | 0.85 ns | −0.59 ns | − | −0.13 ns | −0.01 ns | − | ||||||||
| NH4+−N | −0.93 * | 0.96 * | −0.76 ns | − | 0.21 ns | 0.33 ns | 0.75 ns | − | ||||||
| NO3−−N | 0.94 ns | −0.96 * | 0.79 ns | −0.99 ** | − | −0.29 ns | −0.19 ns | 0.89 ns | 0.36 ns | − | ||||
| Net nitrification | 0.93 ns | −0.96 * | 0.76 ns | −0.99 ** | 0.99 ** | − | −0.41 ns | −0.31 ns | 0.58 ns | 0.76 ns | 0.25 ns | − | ||
| Net mineralisation | 0.91 ns | −0.97 * | 0.75 | −0.99 ** | 0.99 ** | 0.99 ** | − | −0.48 ns | −0.37 ns | 0.86 ns | 0.73 ns | 0.67 ns | 0.88 ns | − |
Publisher’s Note: MDPI stays neutral with regard to jurisdictional claims in published maps and institutional affiliations. |
© 2022 by the authors. Licensee MDPI, Basel, Switzerland. This article is an open access article distributed under the terms and conditions of the Creative Commons Attribution (CC BY) license (https://creativecommons.org/licenses/by/4.0/).
Share and Cite
Das, S.; Wang, W.; Reeves, S.; Dalal, R.C.; Dang, Y.P.; Kopittke, P.M. Combined Application of Lime and a Nitrification Inhibitor (3,4-Dimethylpyrazole Phosphate) Markedly Decreased Nitrous Oxide Emissions from an Acid Soil. Agronomy 2022, 12, 1040. https://doi.org/10.3390/agronomy12051040
Das S, Wang W, Reeves S, Dalal RC, Dang YP, Kopittke PM. Combined Application of Lime and a Nitrification Inhibitor (3,4-Dimethylpyrazole Phosphate) Markedly Decreased Nitrous Oxide Emissions from an Acid Soil. Agronomy. 2022; 12(5):1040. https://doi.org/10.3390/agronomy12051040
Chicago/Turabian StyleDas, Shilpi, Weijin Wang, Steven Reeves, Ram C. Dalal, Yash P. Dang, and Peter M. Kopittke. 2022. "Combined Application of Lime and a Nitrification Inhibitor (3,4-Dimethylpyrazole Phosphate) Markedly Decreased Nitrous Oxide Emissions from an Acid Soil" Agronomy 12, no. 5: 1040. https://doi.org/10.3390/agronomy12051040
APA StyleDas, S., Wang, W., Reeves, S., Dalal, R. C., Dang, Y. P., & Kopittke, P. M. (2022). Combined Application of Lime and a Nitrification Inhibitor (3,4-Dimethylpyrazole Phosphate) Markedly Decreased Nitrous Oxide Emissions from an Acid Soil. Agronomy, 12(5), 1040. https://doi.org/10.3390/agronomy12051040