Article

Evaluation of Biochemical and Physiological Changes in Sweet Corn Seeds under Natural Aging and Artificial Accelerated Aging

Guangdong Provincial Key Laboratory of Plant Molecular Breeding, South China Agricultural University, Guangzhou 510642, China
*
Author to whom correspondence should be addressed.
These authors contributed equally to this work.
Agronomy 2022, 12(5), 1028; https://doi.org/10.3390/agronomy12051028
Submission received: 1 March 2022 / Revised: 21 April 2022 / Accepted: 21 April 2022 / Published: 25 April 2022

Abstract

:
Sweet corn seeds are sensitive to storage due to their low starch content and poor seed vigor. Therefore, it is important to understand their physiological and biochemical behavior during storage to prolong their longevity and prevent the loss of vigor. The purpose of this study was to elucidate the physiological and biochemical changes in sweet corn seeds during storage. Artificial accelerated aging and natural aging were applied to 19 inbred lines. We found that GP, GR and VI decreased as aging proceeded. The physiological and biochemical characteristics of seeds three days after artificial aging (AA3d) and eight months after natural aging (NA8M) were evaluated. The contents of GA, ABA, and malondialdehyde and amylase activity in AA3d and NA8M seeds showed significant differences among the lines, while the total protein and total starch content showed nonsignificant or small differences. We found significant differences among the lines and a nonsignificant difference between AA3d and NA8M seeds in the activity of antioxidant enzymes. A correlation analysis showed that the germination rate was significantly negatively correlated with the ABA content in AA3d seeds, while SOD was positively correlated with GR and GI in NA8M seeds. This study provides a useful catalog of physiological and biochemical changes in sweet corn seeds, offering insights for the future genetic improvement of sweet corn’s storage tolerance.

1. Introduction

Sweet corn (Zea mays L. Saccharata Sturt), the homozygote of one or a few recessive starch biosynthetic gene(s), contains a small amount of starch in ripen seeds [1]. Such features inhibit the vitality of seeds, which is thus unsuitable for seed storage [2]. Seed aging or deterioration occurs with long-term storage even under controlled storage conditions. Aged seeds lose viability and vigor and show low germination potential (GP), germination rate (GR), germination index (GI) and vigor index (VI) and increased sensitivity to stress upon germination. In addition, seeds deterioration manifests as irreversible metabolic and cellular changes, such as reduced antioxidant capacity, plasma membrane damage, depletion of nutrient storage and destruction of genetic materials [3].
Relative humidity (RH) and temperature are the two key environmental factors directly affecting seed aging [4]. In general, the actual moisture content of seeds during dry storage is 5–10% [5]. An increase in relative humidity leads to an increased seed moisture content, which subsequently leads to accelerated seed aging [6]. High humidity decreases mitochondrial antioxidants’ contents in imbibed oat seeds, promoting the destruction of mitochondrial ultrastructure during the aging process [7]. As we know, seed vigor is maintained well at 5–14% moisture content. When the seed moisture content is >14%, the level of respiration increases, and fungi reduce seed vigor more rapidly [8,9]. However, even when seeds are stored at a low moisture content, seed vigor decreases at a high storage temperature. High temperatures lead to the increase of seed respiration rate and endogenous chemical reactions, leading to accelerated seed aging [10]. Seed viability decreases by 50% for an increase of 5 °C in the temperature range of 0–5 °C, but when the temperature drops below 0 °C, many biochemical reactions associated with seed deterioration would not occur [11]. Since the natural aging process takes several months or years, researchers tested the seed aging performance at high relative humidity (80–100% RH) and temperature (35–45 °C), i.e., under artificial accelerated aging. Artificial accelerated aging induces physiological and biochemical changes in plant seeds, reducing seed vigor in several days [12,13,14]. The quantity and quality of total soluble proteins decreased during the seed ageing, and the protein profiles appeared altered [15]. A negative significant correlation between seed germination and total sugar was observed in sweet corn [16]. Changes of total protein and starch content appeared in seed aging assays.
Imbalances in intracellular reactive oxygen species (ROS) homeostasis and consequent oxidative damage are associated with a loss of seed viability [17,18]. During seed aging, there is an accumulation of ROS, such as 1O2, O2•−, H2O2 and OH, which are highly active and toxic and can destroy cell membranes, nucleic acids, proteins, carbohydrates and lipids, causing irreversible damage to the cell [19,20]. Plants are rich in antioxidant enzymes that eliminate excess ROS and maintain a balance between ROS and antioxidants. These antioxidant enzymes include superoxide dismutase (SOD), catalase (CAT), ascorbate peroxidase, glutathione peroxidase, peroxidase (POD), peroxiredoxin, monodehydroascorbate reductase, dehydroascorbate reductase and glutathione reductase [19,21]. SOD has three isoforms in plants (Mn-SOD, Fe-SOD and Cu, Zn-SOD) that inhibit lipid peroxidation and catalyze the dismutation of the superoxide radicals (O2•−) into O2 and H2O2 [22]. H2O2 is reduced to H2O by CAT or ascorbate peroxidase, two important enzymes in the ascorbate–glutathione (AsA-GSH) cycle. In addition, glutathione peroxidase, monodehydroascorbate reductase, dehydroascorbate reductase and glutathione reductase act on the AsA–GSH cycle to regulate the physiological responses of the electron transport chain in oat embryos during seed aging [23]. Monodehydroascorbate reductase and dehydroascorbate reductase play more important roles than glutathione reductase in ascorbate regeneration in aged oat seeds during imbibition [7]. Peroxides or hydrogen peroxide can also be scavenged by peroxiredoxin, a ubiquitous family of antioxidant enzymes, whose expression is related to the manner of seed maturation [24].
Though artificial aging also decreased seed vigor, it does not completely mimic natural aging. Previous studies showed that physiological parameters of naturally aged seeds were more sensitive than those of seeds subjected to artificial accelerated aging, and protein degradation in Phaseolus vulgaris seeds after artificial and natural aging was different [25]. In contrast, protein abundance, oxidation patterns of the seed proteome and translational capacity in both artificially and naturally aged seeds revealed common features when comparing artificially and naturally aged Arabidopsis seeds [4]. The mature sweet corn seed shrinks, showing light grain weight and low vigor. However, the physiological and biochemical changes under natural aging and artificial accelerated aging in sweet corn have not been identified. Understanding the behavior of seeds during storage is important to take measures to ensure seed quality and longevity. In this study, we used natural aging and artificial accelerated aging to treat sweet corn seeds and evaluated the biochemical and physiological changes occurring in these seeds during storage. Our findings will help to store sweet corn seeds more appropriately.

2. Materials and Methods

2.1. Seeds

An association population constructed using 140 sweet corn inbred lines and their genotypes were identified by illumina MaizeSNP50. Nineteen sweet corn inbred lines with genetic differences (K6, K10, K11, K15, K51, K63, K76, K95, K99, K107, K108, K109, K114, K116, K118, K122, K128, K129 and K139) were selected from the association population and were cultivated at the Zengcheng Teaching and Scientific Research Field of South China Agricultural University in the autumn of 2019 (Tables S1–S3). Harvested seeds were dried under the sunlight for four days to remove initial moisture; the seed water content of the 19 lines decreased to less than 14%. Seed batches were divided into three groups. Fresh seeds were used as the control group, and the other two groups were separately used for natural aging and artificial accelerated aging. The naturally aged seeds were packed in polyethylene bags and stored at room temperature for 4 months (NA4m), 6 months (NA6m) and 8 months (NA8m). The artificially aged seeds were placed in a seed aging chamber (LH-150S, Shanghai Qixin, Shanghai, China) at a temperature of 41 °C and high relative moisture of 100% [26], and the aging times were 0 days (AA0d), 3 days (AA3d) and 6 days (AA6d).

2.2. Germination Assay

Germination assays were carried out according to Zhu et al. [26] in an incubator (25 °C, 16 h light/8 h dark, Ningbo Laifu, China) with three replicates. We placed 25 seeds per replicate in germination boxes on a sand layer of 4 cm moistened with distilled water and covered with 2 cm of sand. Germination potential, germination rate, germination index and vigor index were calculated according to Guan et al. [27]. The germination potential was calculated as the germination rate on the fourth day. The germination rate was calculated using the formula: germination rate = n/N × 100%, where n is the total number of germination seeds, and N is the total number of seeds. The germination index was calculated with the formula: germination index = ΣGt/Dt, where the Dt is the germination time, and Gt is the number of germinated seeds at that time. The vigor index was calculated with the formula: vigor index = germination index × SW, where SW is the seedling fresh weight on the eighth day.

2.3. Measurements of Physiological and Biochemical Indictors

Seeds aged 0.1–0.3 g were rinsed with low-temperature phosphate buffer, dried on filter paper, weighed accurately and placed into 5 mL homogenate tubes containing 0.9–2.7 mL phosphate buffer (Seed (g)/buffer (mL) = 1:9). The seeds were shredded in an ice bath and ground with a homogenizer (10,000–15,000 r/min). The supernatant was collected after centrifugation at room temperature for 10–15 min, 3000 r/min. Kits were used to detect the activity of antioxidant enzymes such as CAT, POD and SOD, i.e., Plant Catalase Extraction Kit (ZK-L0424, Ziker Co. Ltd., Shenzhen, China), Plant Peroxidase Extraction Kit (ZK-L0423, Ziker Co. Ltd., Shenzhen, China) and Plant Superoxide dismutase Extraction Kit (ZK-L0426, Ziker Co. Ltd., Shenzhen, China). The activity of lipoxygenase (LOX) and amylase (AMS) was detected by the Plant LOX Kit (ZK-P7487, Ziker Co. Ltd., Shenzhen, China) and Plant AMS Kit (ZK-P6291, Ziker Co. Ltd., Shenzhen, China). The content of GA and ABA was determined using the Plant GA ELISA Kit (ZK-P6293, Ziker Co. Ltd., Shenzhen, China) and the Plant ABA ELISA Kit (ZK-P6243, Ziker Co. Ltd., Shenzhen, China). The MDA content was determined according to the protocol of the Plant Malondialdehyde ELISA Kit (ZK-P7111, Ziker Co. Ltd., Shenzhen, China) based on the thiobarbituric acid method. The content of total starch and total protein was measured by anthrone colorimetry and the BCA method using the Starch Assay ELISA Kit (ZIKER181, Ziker Co. Ltd., Shenzhen, China) and the BCA protein Assay ELISA Kit (ZIKER314, Ziker Co. Ltd., Shenzhen, China), respectively. The detection assays were according to the manufacturers’ protocols of the ELISA Kits, and all Kits were purchased from Shenzhen Ziker Biological Technology Co., Ltd., Shenzhen, China.

2.4. Statistical Analysis

The normality and homogeneity of variance of the data were determined by the Shapiro–Wilk test and the hovtest, respectively. T-tests were used for the assumption tests for the four seed vigor indexes and physiological indexes with three replicates. Variance analysis and Duncan’s test were used to determine the statistical significance. The results were considered statistically significant if p ≤ 0.05 (*), 0.01 (**) and 0.001 (***). A correlation analysis between AA3d and NA8M was performed, and Pearson’s correlation coefficients were calculated. All statistical analyses were performed by SAS (version 8.0, SAS Inc., Cary, NC, USA). The visualization of the correlation matrix was performed by R package Corrplot [28].

3. Results

3.1. Evaluation of Seed Vigor

To evaluate the vigor of the sweet corn seed, 19 inbred lines with genetic differences (K6, K10, K11, K15, K51, K63, K76, K95, K99, K107, K108, K109, K114, K116, K118, K122, K128, K129 and K139) were selected and subjected to both natural and artificial aging. Four seed vigor parameters (GP, GR, GI and VI) of these 19 sweet corn inbred lines were determined after three days (AA3d) and six days of artificial aging (AA6d) and four months (NA4M), six months (NA6M) and eight months of natural aging (NA8M). The results showed that all four seed vigor parameters at AA3d and AA6d were reduced significantly compared with the control values (Figure 1). GP, GR and GI of NA2M showed no significant differences, and VI was slightly higher than that of the control at the 0.05 level, which might be due to the post-maturation effect induced by a low temperature during the period of storage (from mid-December to mid-January). In addition, the four vigor indexes of NA6M and NA8M seeds decreased significantly, and GP, GR, GI and VI were 22.79%, 55.58%, 3.17 and 14.45, respectively for NA8M seeds (Table 1). The lowest values of GP, GR, GI and VI were determined at AA6d and were 13.89%, 30.63%, 1.18 and 3.42, respectively. In brief, the seed vigor indexes significantly decreased with the increase of the aging time during artificial aging and natural aging and decreased faster with artificial accelerated aging than with natural aging.
A variance analysis was carried out for GP, GR, GI and VI for all treated seeds. The results indicated that the variance components among different aging treatments and among inbred lines and the interaction between different aging treatments and inbred lines reached a significant difference at the level of 0.01 (Table 1). Multiple comparison results suggested that the values of the three germination parameters (GP, GR and GI) were the highest in non-treated seeds or NA4M-treated seeds, and the vigor index was the highest in NA4M-treated seeds. The GP of AA3d-treated seeds was significantly higher than that of NA8M-treated seeds, while the GI showed an opposite trend. There was no significant difference between AA3d- and NA8M-treated seeds for the parameters GR and VI, as indicated by the same lowercase letters ‘c’ and ‘d’, respectively.

3.2. Evaluation of Phytohormones Changes under Aging Treatment

Since the seed vigor indicators of AA3d and NA8M were relatively consistent, we compared these two treatments to figure out putative differences between natural aging and artificial accelerated aging. GA and ABA have been characterized as an activator and a repressor of seed germination in many plants, respectively. Thus, we determined the GA and ABA content in the seeds subjected to AA3d and NA8M treatments. The GA and ABA content in the 19 inbred lines showed different accumulation profiles depending on the aging treatment (Figure 2). Significant changes were found between AA3d- and NA8M-treated seeds in most sweet corn inbred lines. Although the GA content in five inbred lines (K10, K107, K109, K116 and K122) showed no significant difference between natural aging and artificial aging, most inbred lines showed a higher GA content in naturally aged seeds. In addition, the K95 and K129 lines showed a decreased GA content in naturally aged seeds. Furthermore, only two inbred lines (K114 and K139) showed no significantly different ABA content when comparing seeds subjected to natural aging and artificial accelerated aging. The ABA content in nine inbred lines (K6, K10, K11, K63, K107, K108, K118, K128 and K129) was higher in naturally aged samples, while eight inbred lines (K15, K51, K76, K95, K99, K109, K116 and K122) showed lower ABA accumulation after natural aging treatment. These results revealed that the changes of GA and ABA content were not identical under artificial accelerated aging and natural aging.

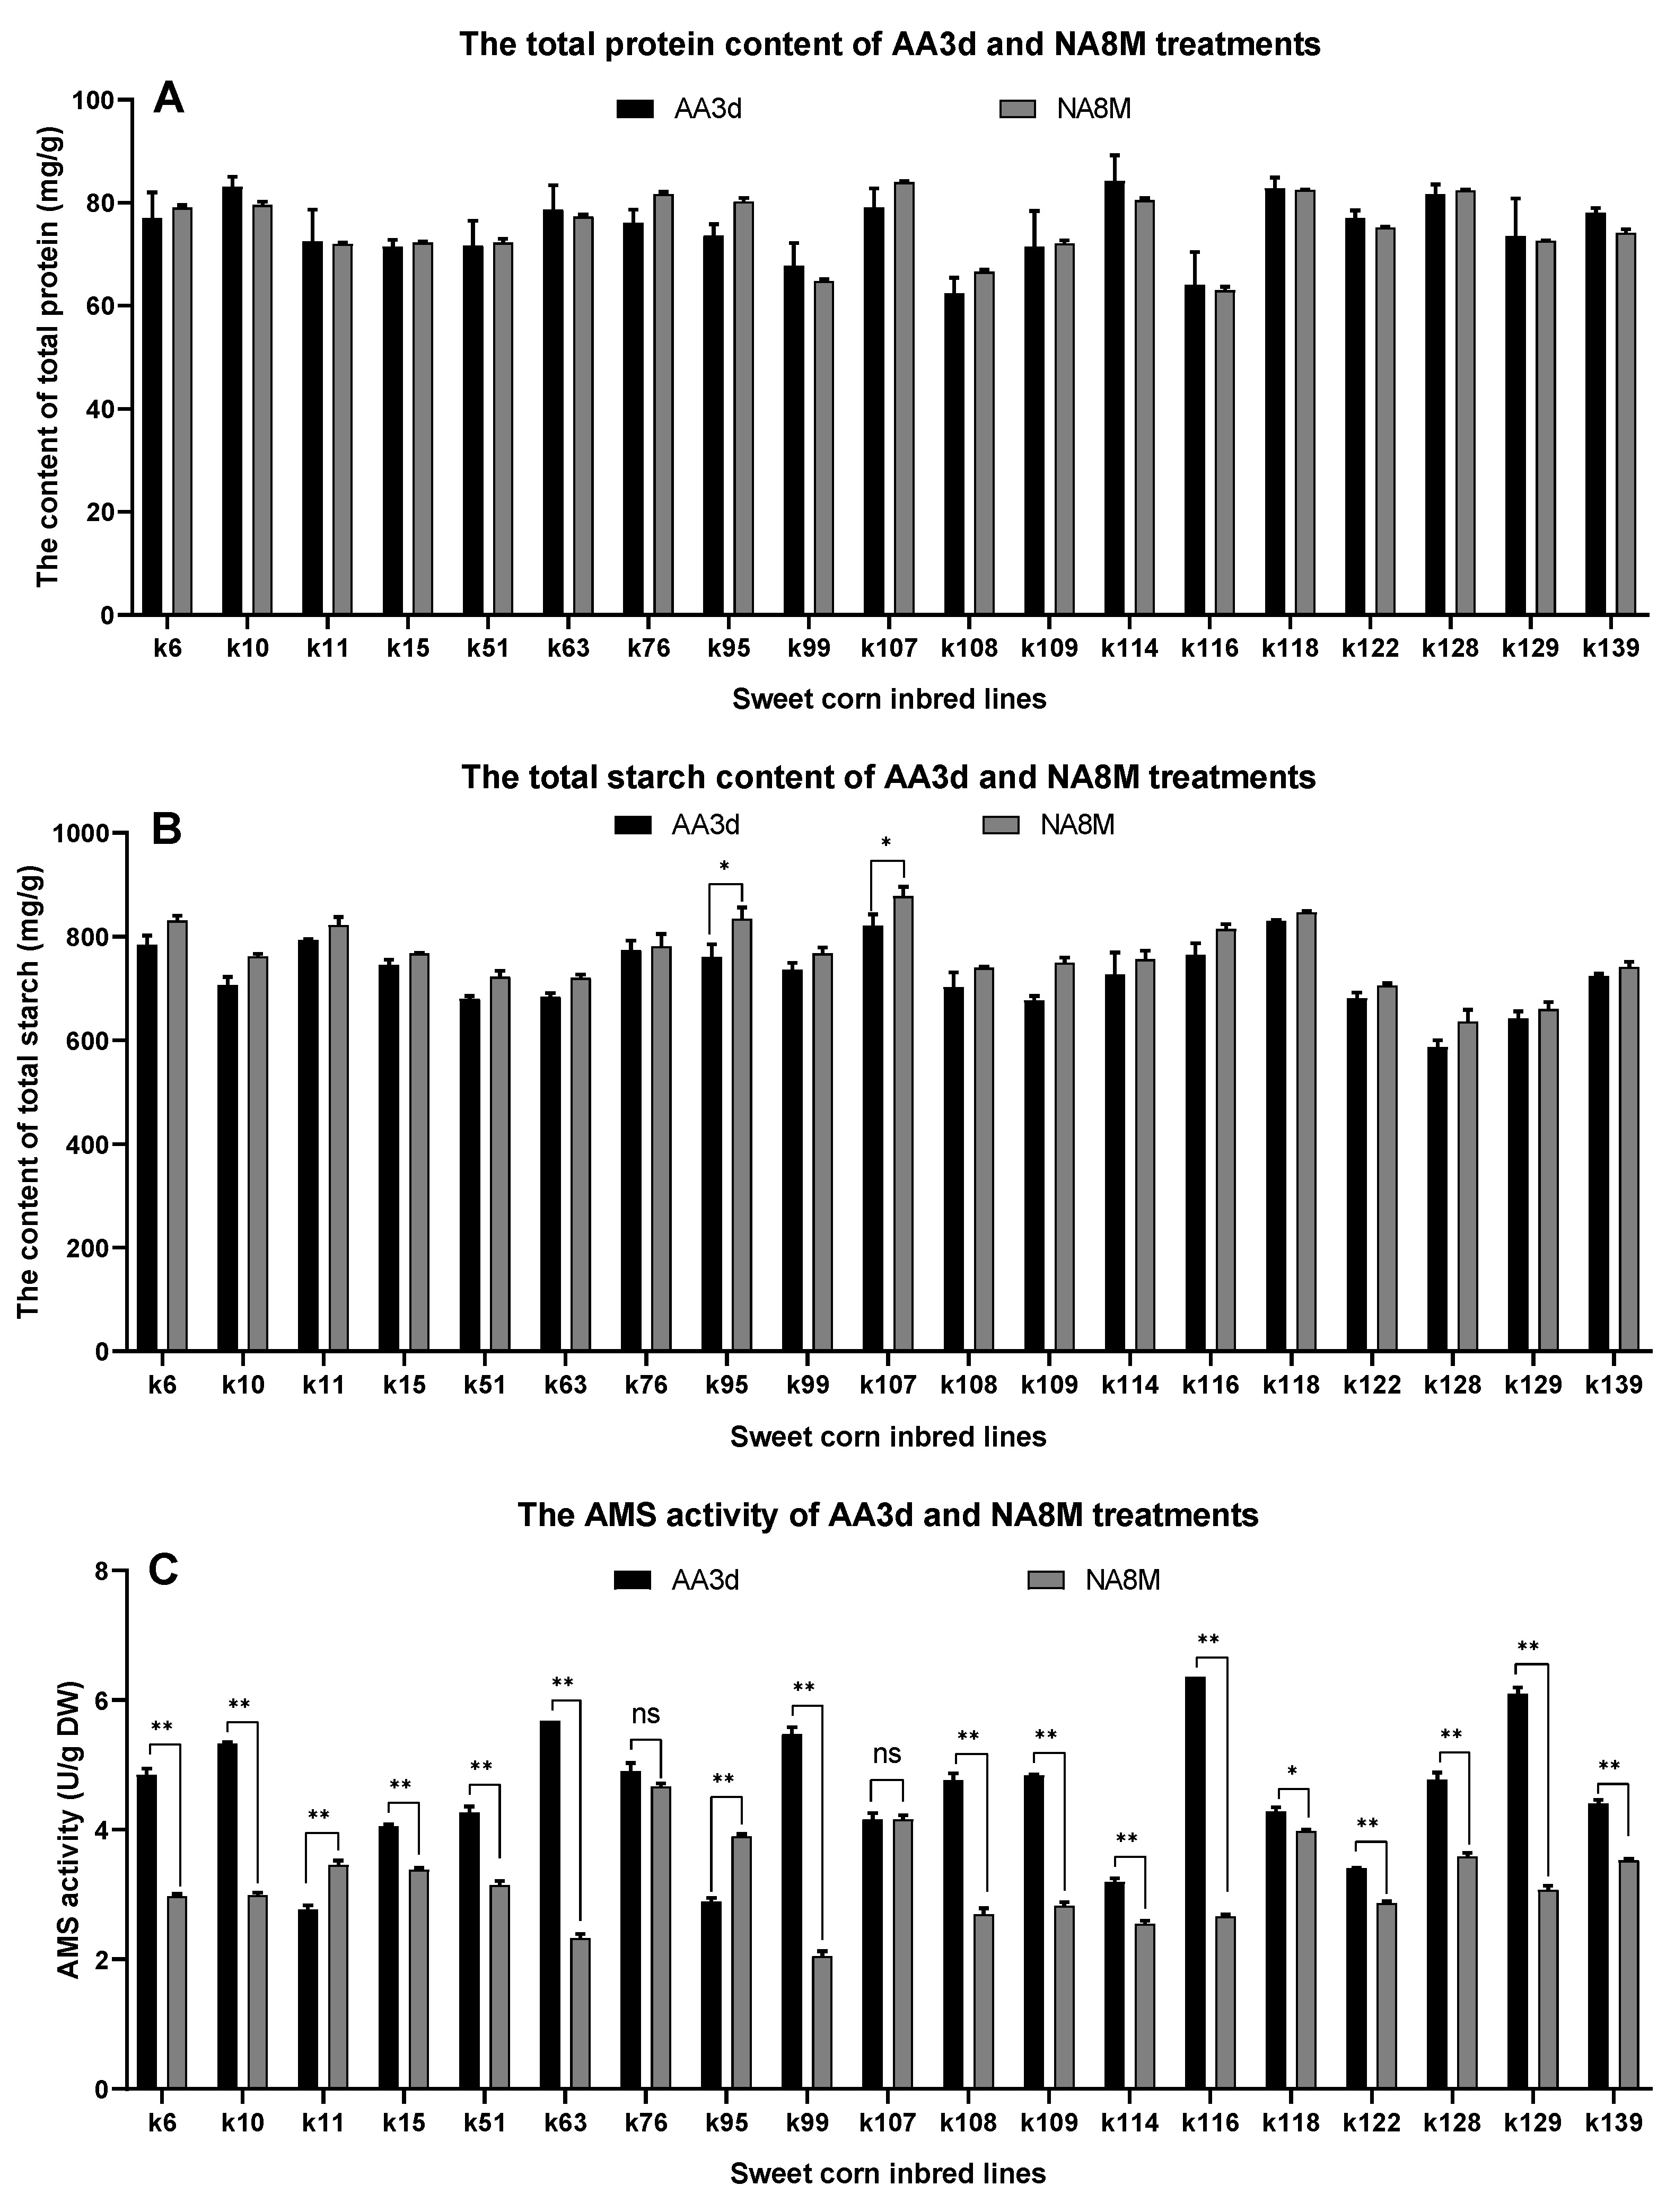
3.3. Evaluation of Total Protein and Total Starch Content under Aging

Total protein content, total starch content and amylase activity were determined in samples subjected to different aging treatments. The results showed that there were no significant differences between AA3d- and NA8M-treated seeds in total protein content (Figure 3A). Except for K95 and K107 inbred lines, the total starch content of the inbred lines showed no significant changes between artificial aging and natural aging (Figure 3B). However, amylase activity in these 19 inbred lines changed depending on the aging treatment. A non-significant difference was only detected in the inbred lines K76 and K107. Amylase activity was significantly higher in seeds subjected to artificial accelerated aging for most of inbred lines (p ≤ 0.05 or p ≤ 0.01), whereas the opposite trend was found for the inbred lines K11 and K95 (Figure 3C). These results revealed that naturally aged and artificially aged seeds exhibited different levels of amylase activity.

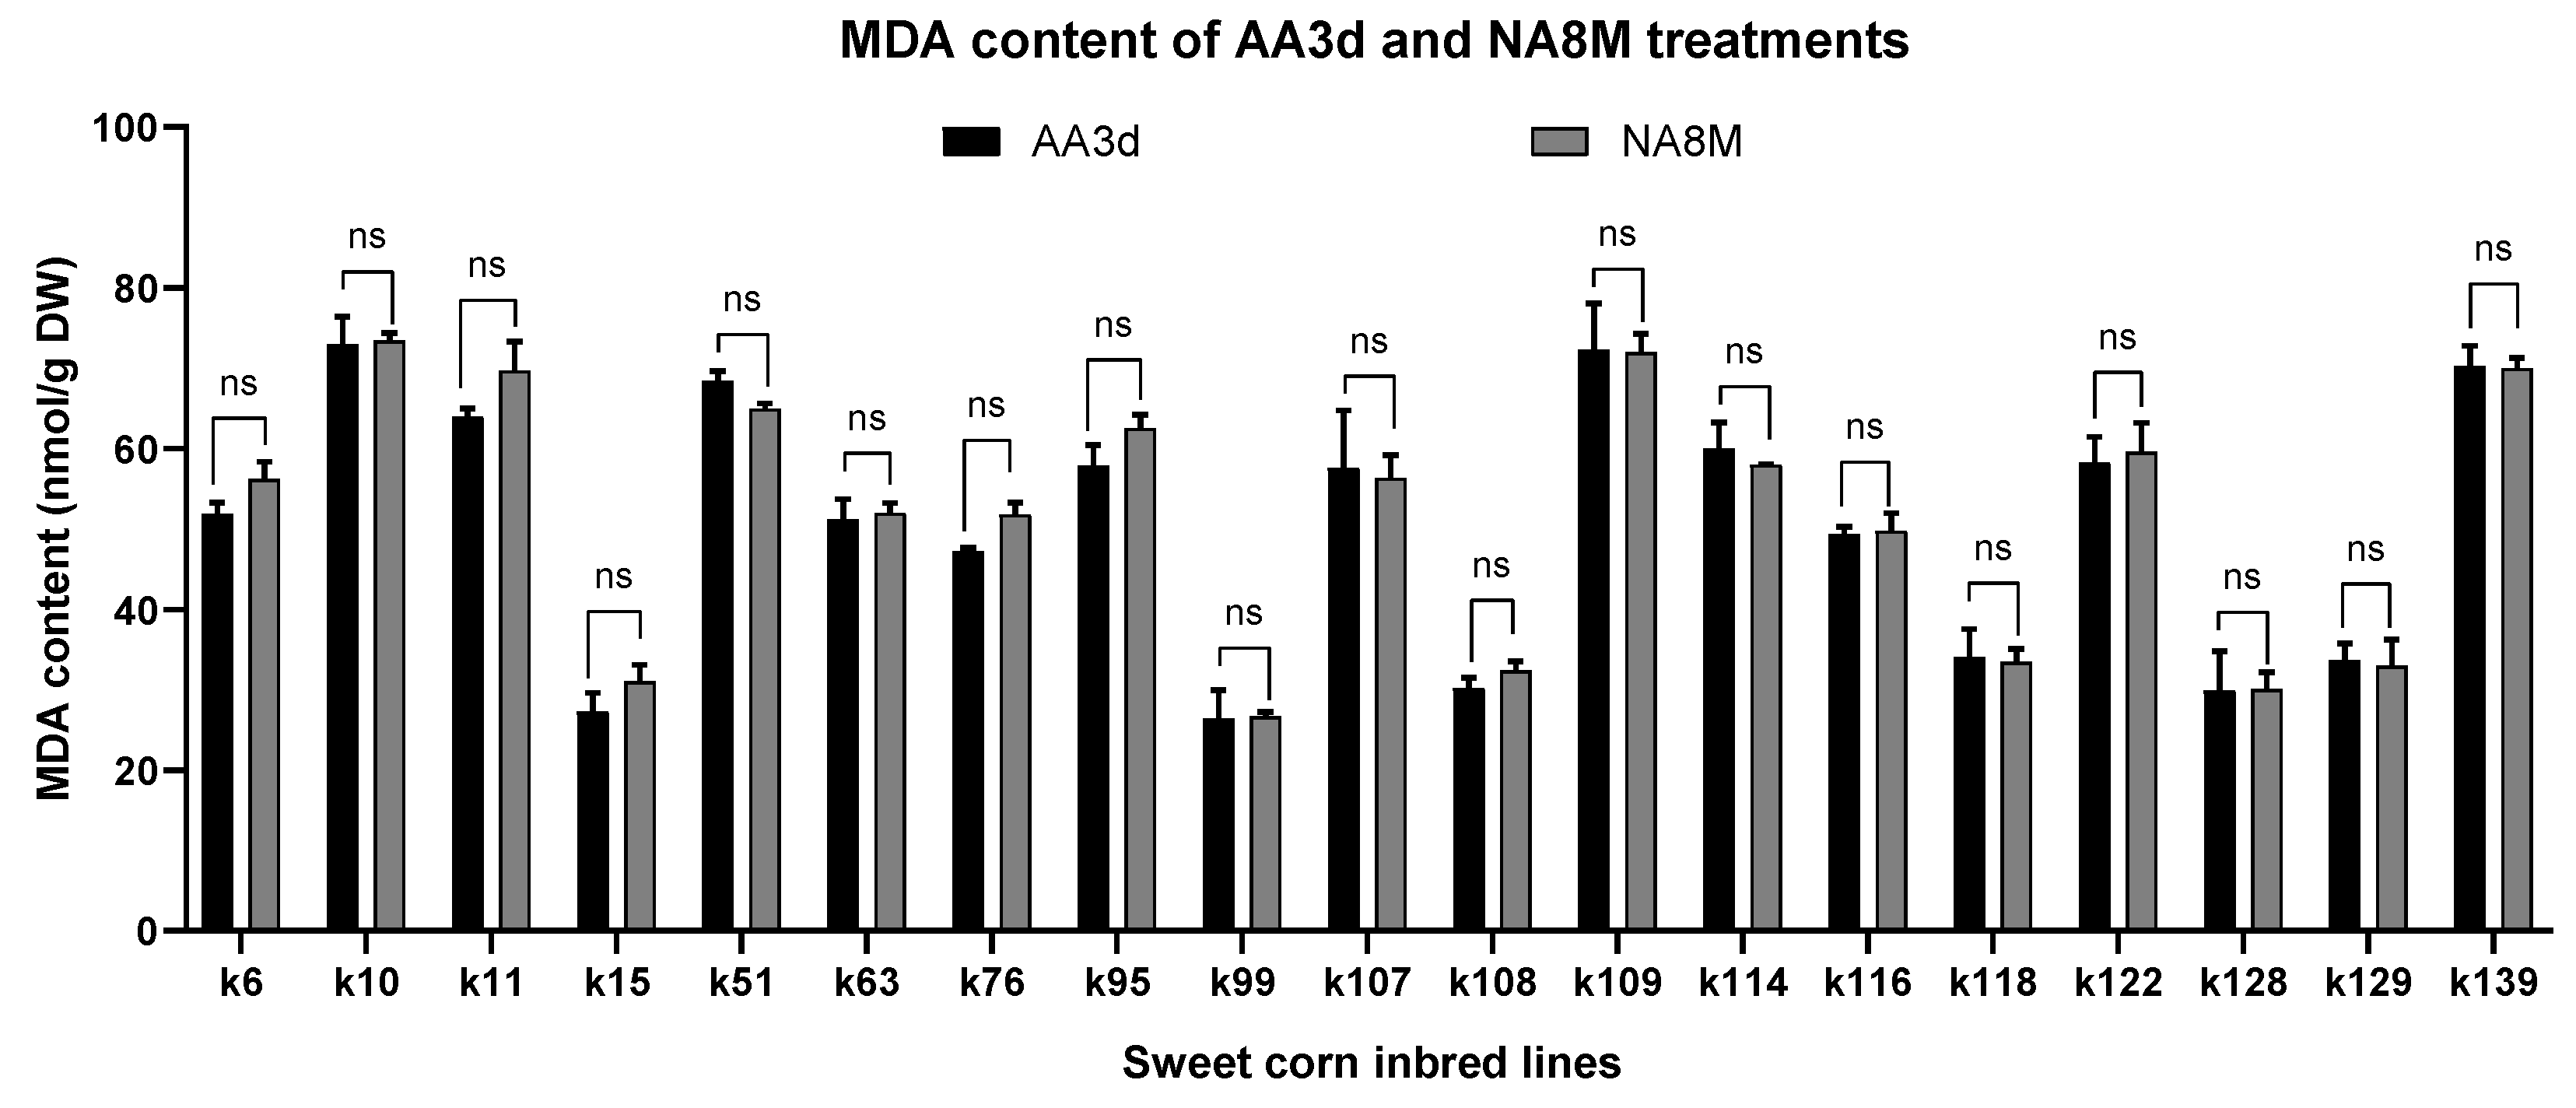
3.4. Evaluation of Lipid Peroxidation

The MDA (malondialdehyde) content was measured to estimate the lipid peroxidation level of sweet corn seeds. The mean content of MDA in AA3d- and NA8M-treated seeds of the 19 inbred lines was 50.66 and 51.74 nmol/g*DW, respectively, with close coefficient of variation values (Table 2). They were significantly correlated, as shown by the correlation coefficient of 0.9878, which indicated that the accumulation pattern of MDA in AA3d- and NA8M-treated seeds was similar. The AA3d and NA8M treatments did not cause significant differences in MDA content in the seeds of each inbred line (Figure 4). The MDA content in different inbred lines was significantly different, while there were no significant correlations between MDA content and germination potential, germination rate, germination index and vigor index (Figure 5).

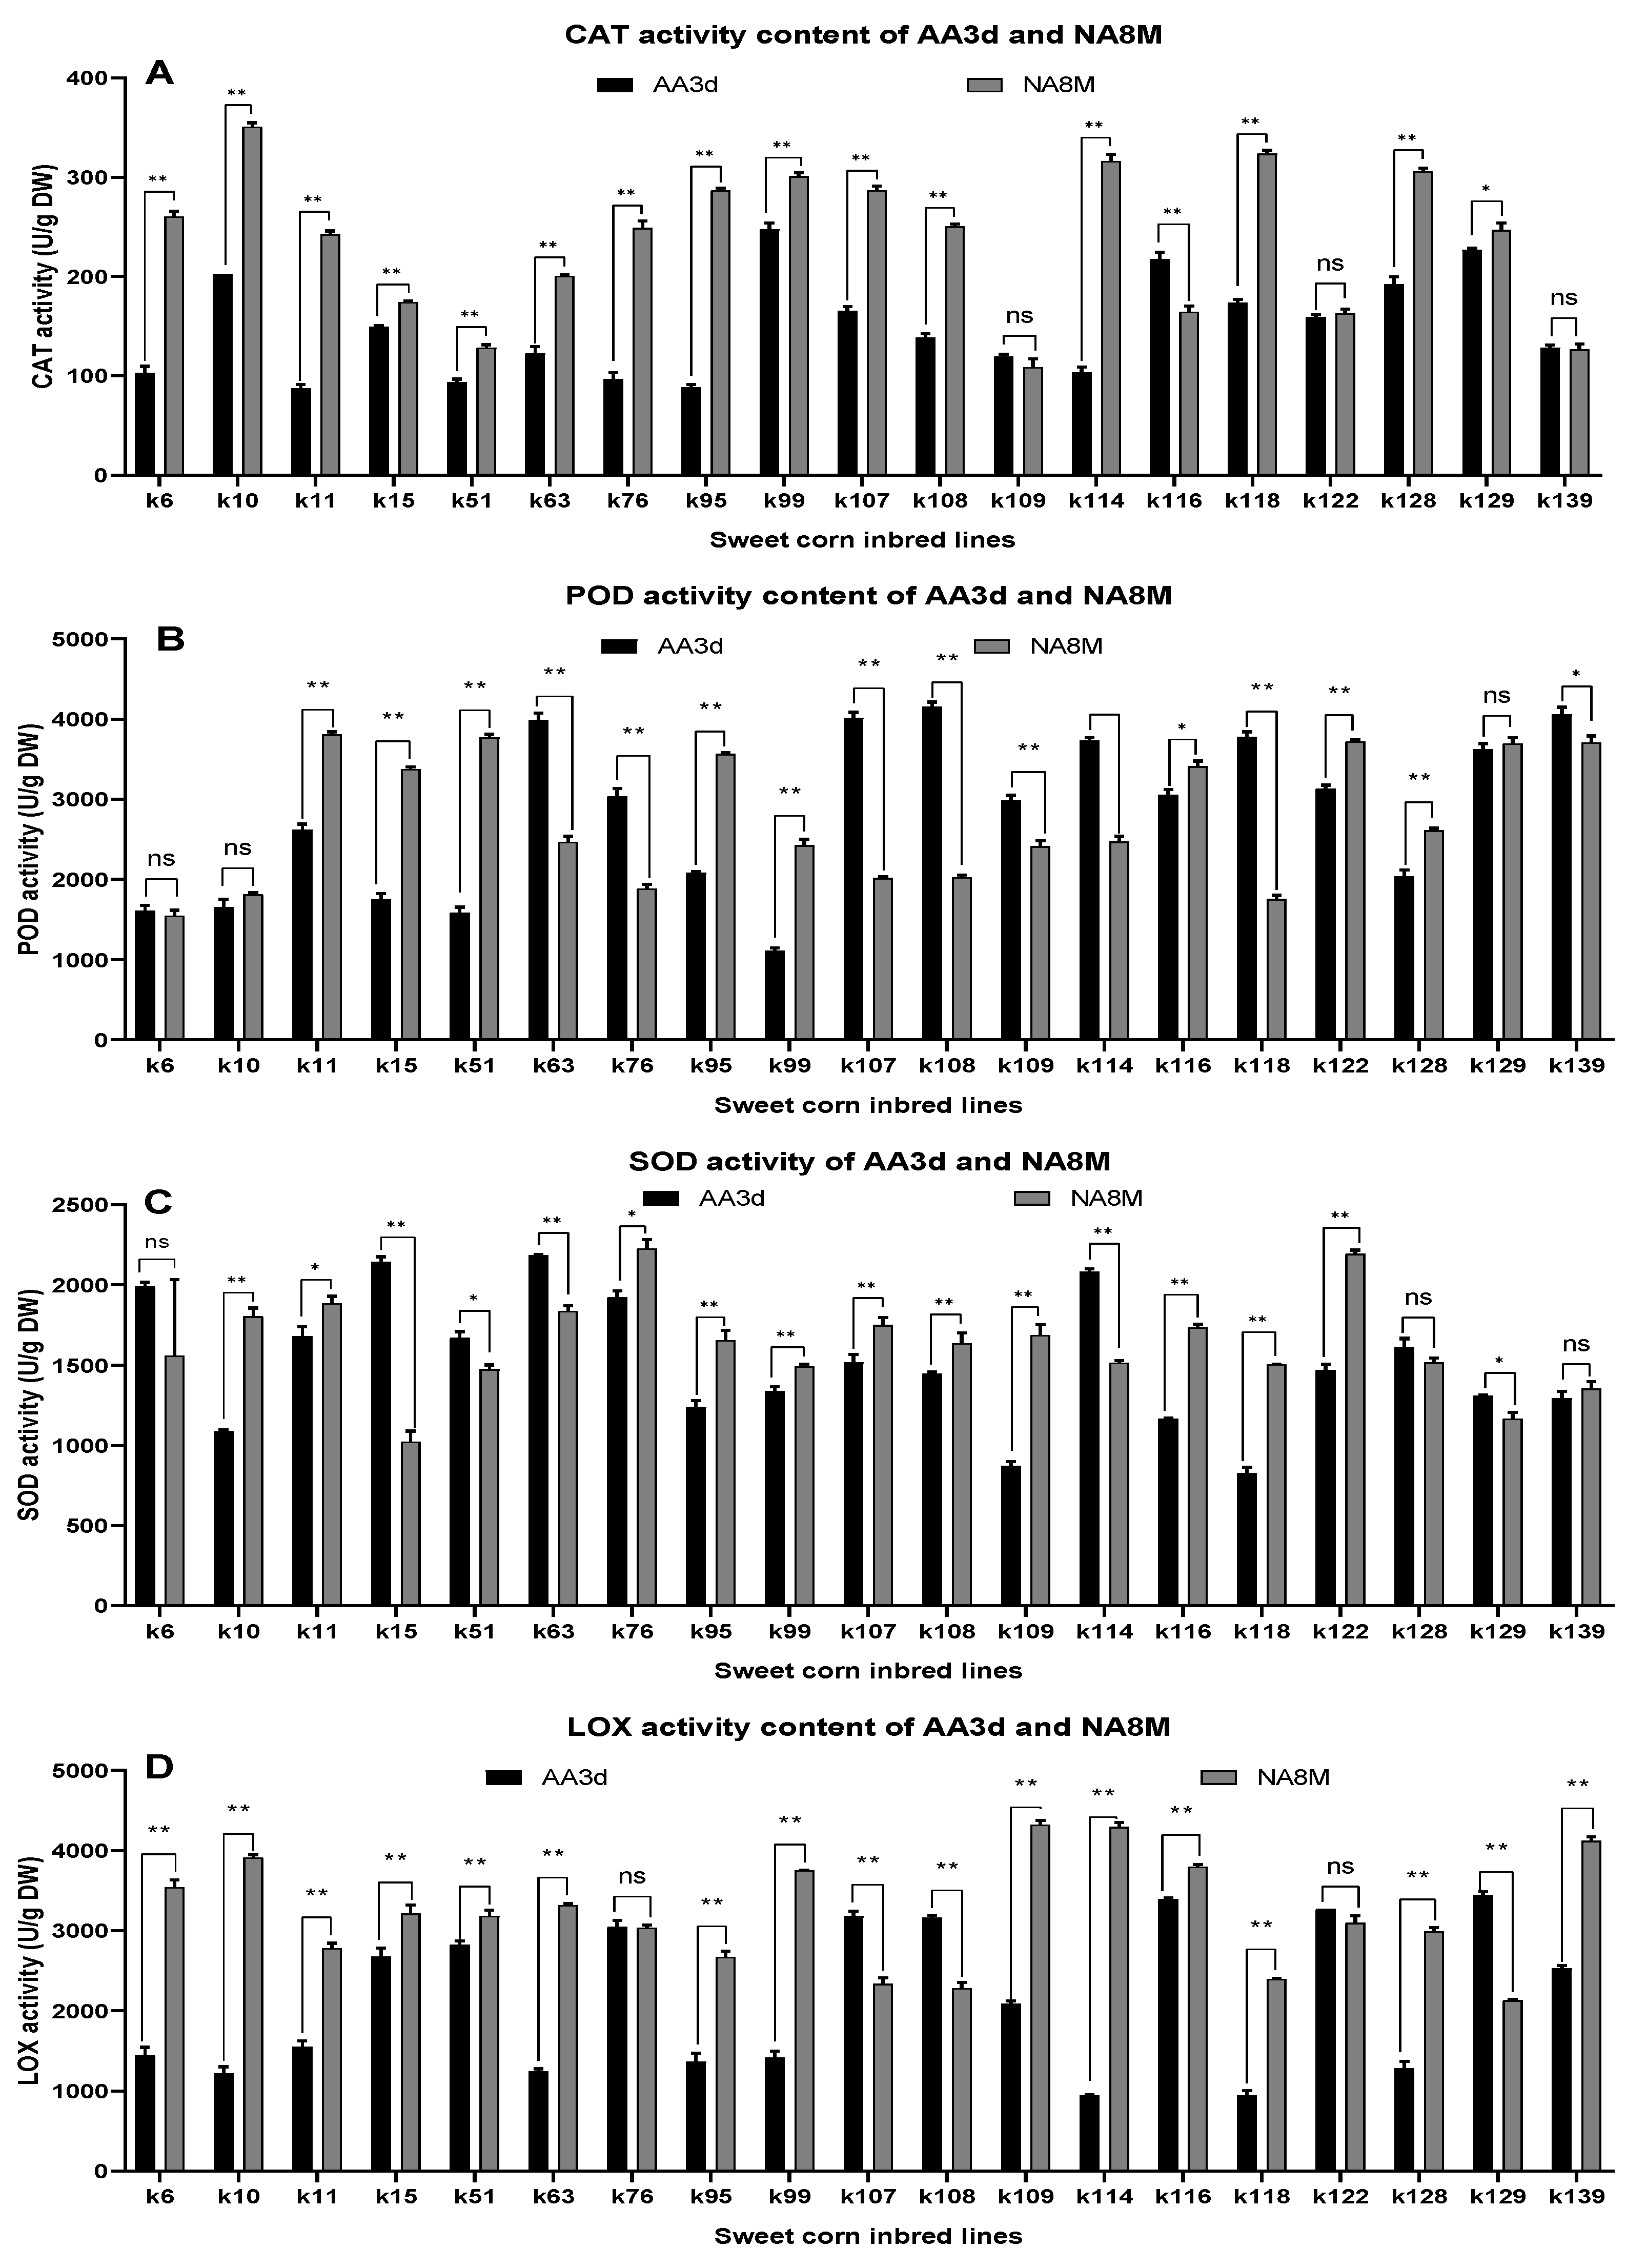
3.5. Evaluation of the Activity of Antioxidant Enzymes

The activities of the antioxidant enzymes CAT, POD, SOD and LOX were determined in AA3d and NA8M seeds (Table 3 and Figure 5). The mean activities of CAT, POD, SOD and LOX in the 19 sweet corn lines at AA3d were 148.35, 2844.66, 1518.63 and 2158.24 U/g DW, respectively. The mean activities of CAT, POD, SOD and LOX in 19 sweet corn lines at NA8M were 236.26, 2764.92, 1632.43 and 3219.39 U/g DW, respectively. There were no significant differences in CAT, POD, SOD and LOX activities between artificial aging and natural aging (Table 3). ANOVA results revealed that the variance components of inbred lines, different treatments and their interaction were significantly different at the level of 0.01.
Antioxidant enzymes and lipoxygenase activities were also compared in seeds subjected to artificial aging and natural aging (Figure 5). CAT activity in 16 of the 19 lines showed significant or extremely significant differences between AA3d and NA8M, but no significant difference was found for the lines K109, K122 and K139. Among the 16 lines, 15 inbred lines showed higher CAT activity under natural aging treatment; K116 showed an opposite behavior. The difference of POD activity between artificial aging and natural aging was significant or extremely significant in 15 inbred lines; there was no significant difference only in K6, K10 and K129. Among the 15 lines, 8 showed higher POD activity under artificial aging treatment. The analysis of SOD activity indicated that 16 lines showed significant differences between artificial aging and natural aging; this was not observed for K6, K128 and K139. Among the 16 lines, most inbred lines showed significantly higher SOD activity after natural aging than after artificial aging; this was not observed for K15, K51, K63, K114 and K129. The analysis of LOX activity showed that 17 of the 19 lines showed significant or extremely significant differences between artificial aging and natural aging, whereas nonsignificant differences were found for K76 and K122. As for the remaining 17 lines, the activity of LOX was higher after natural aging than after artificial aging in 14 lines; this was not observed forK107, K108 and K129.

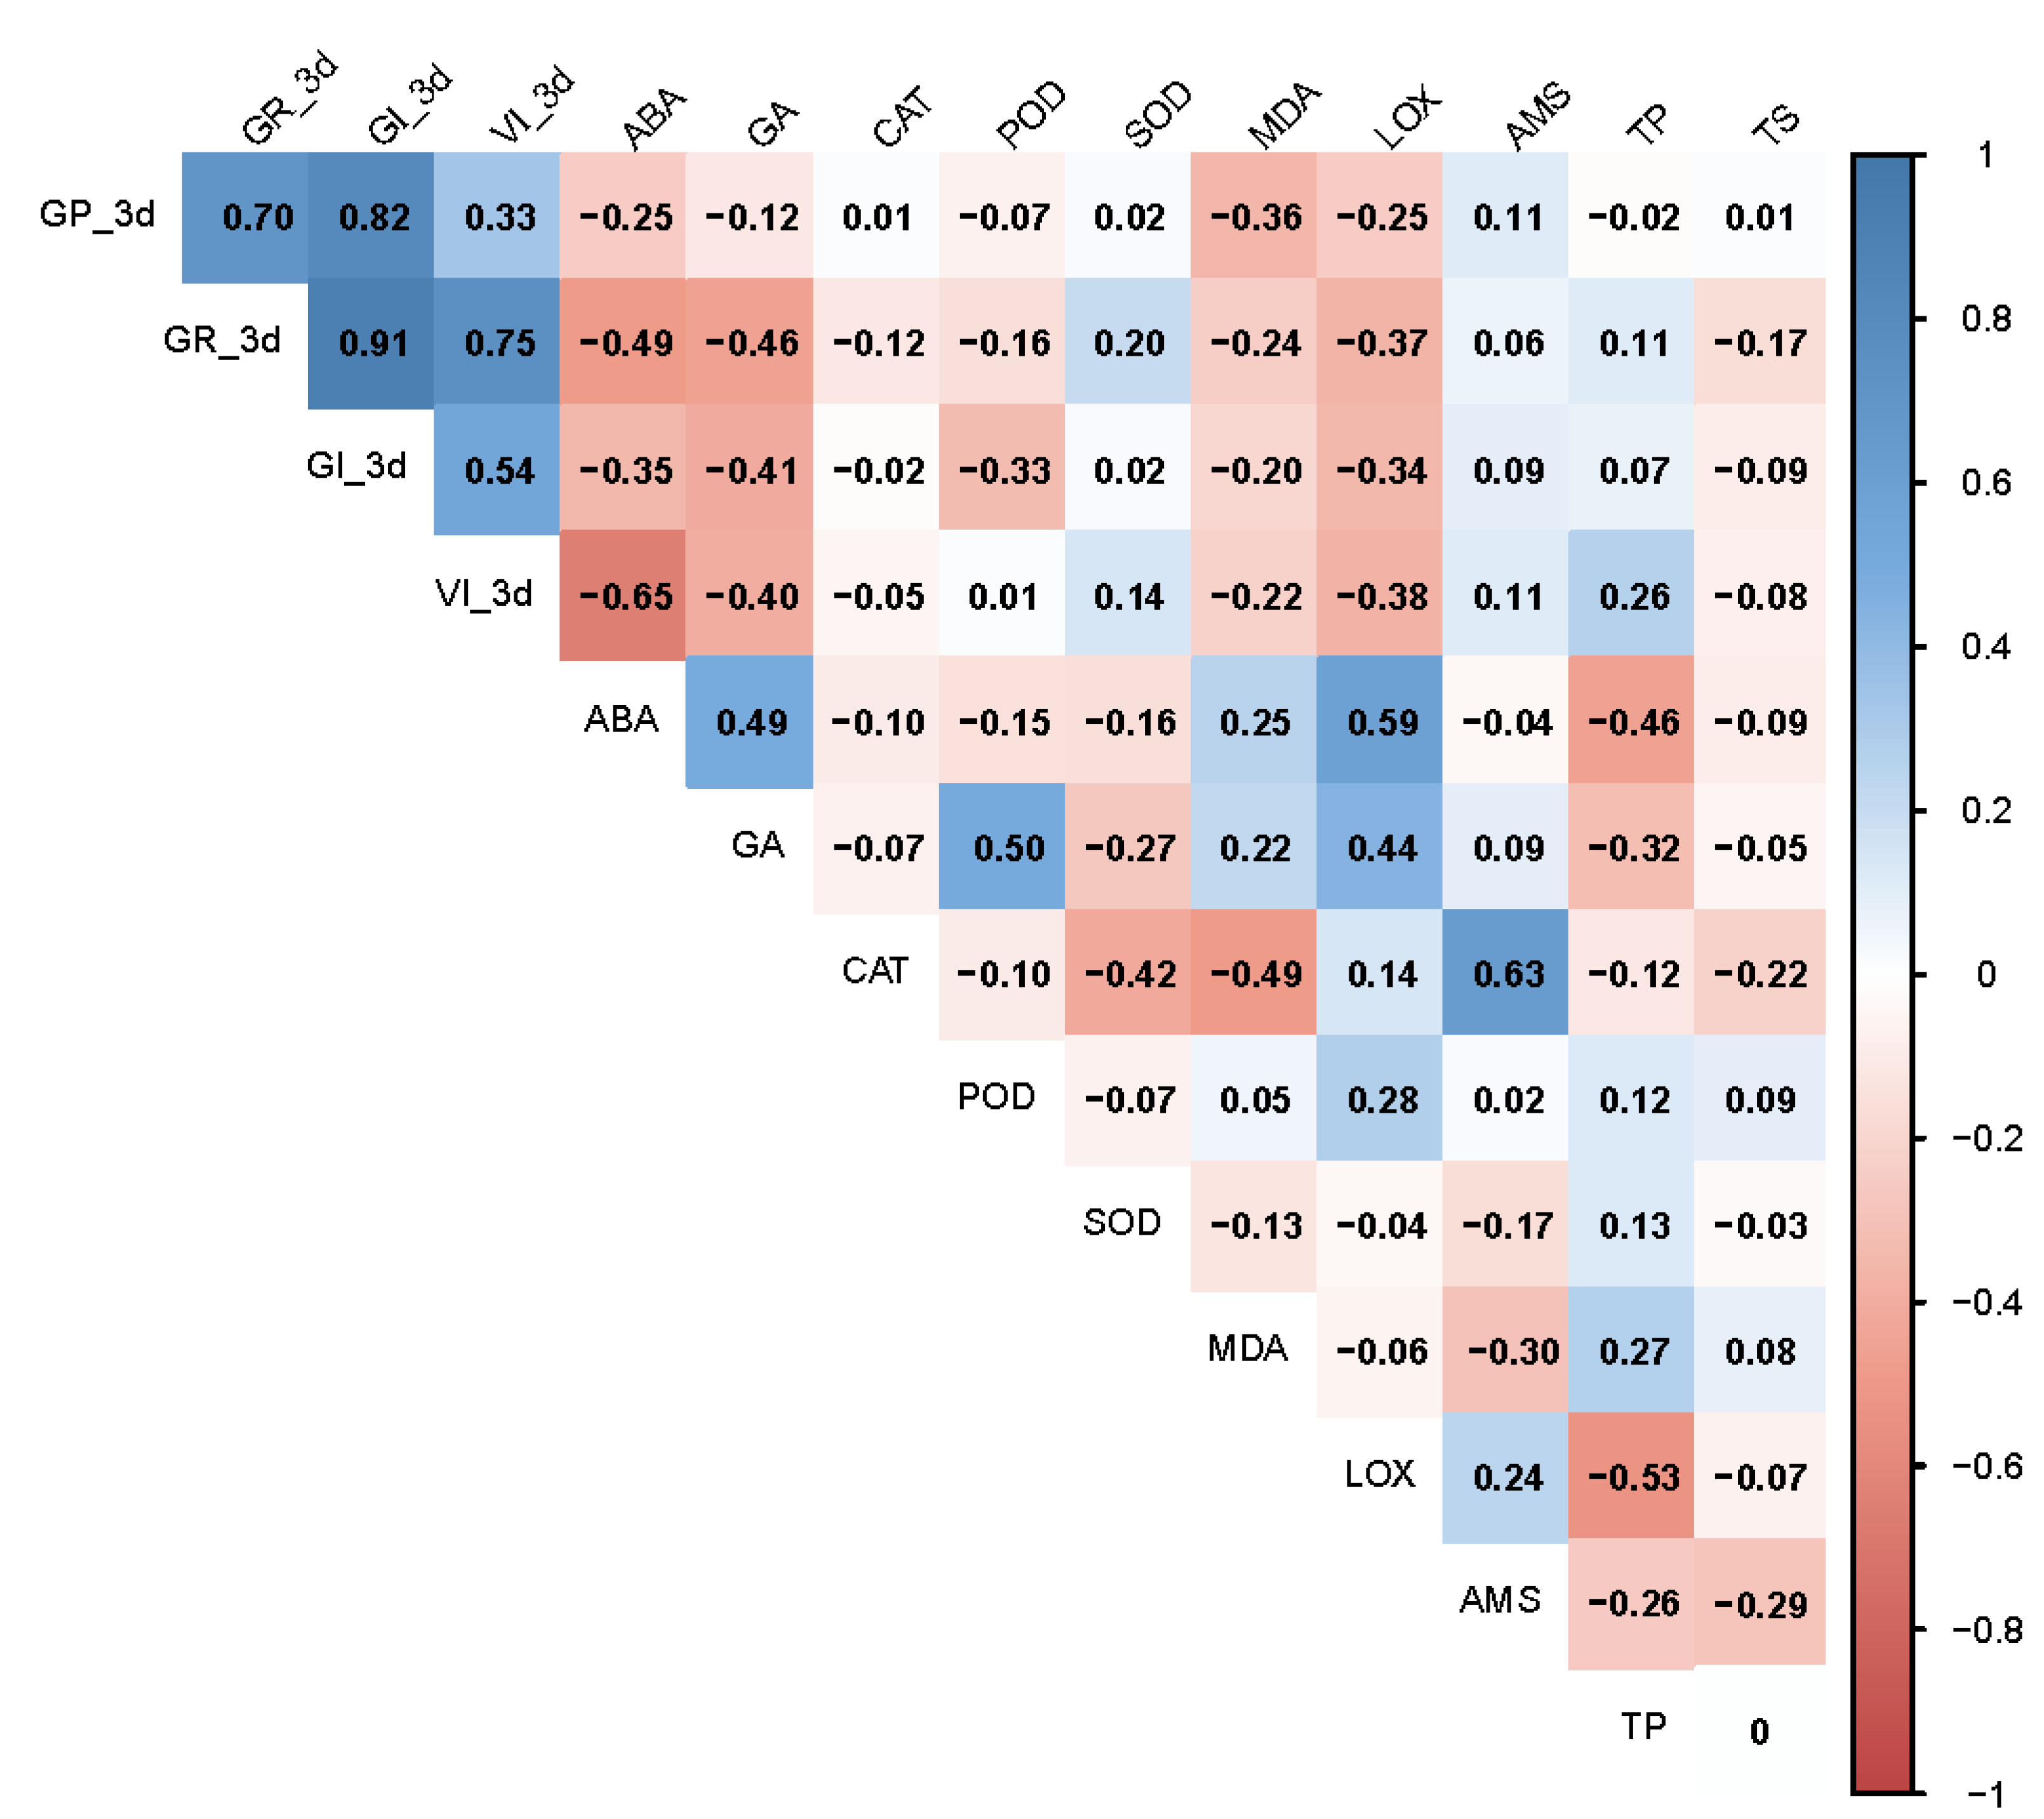
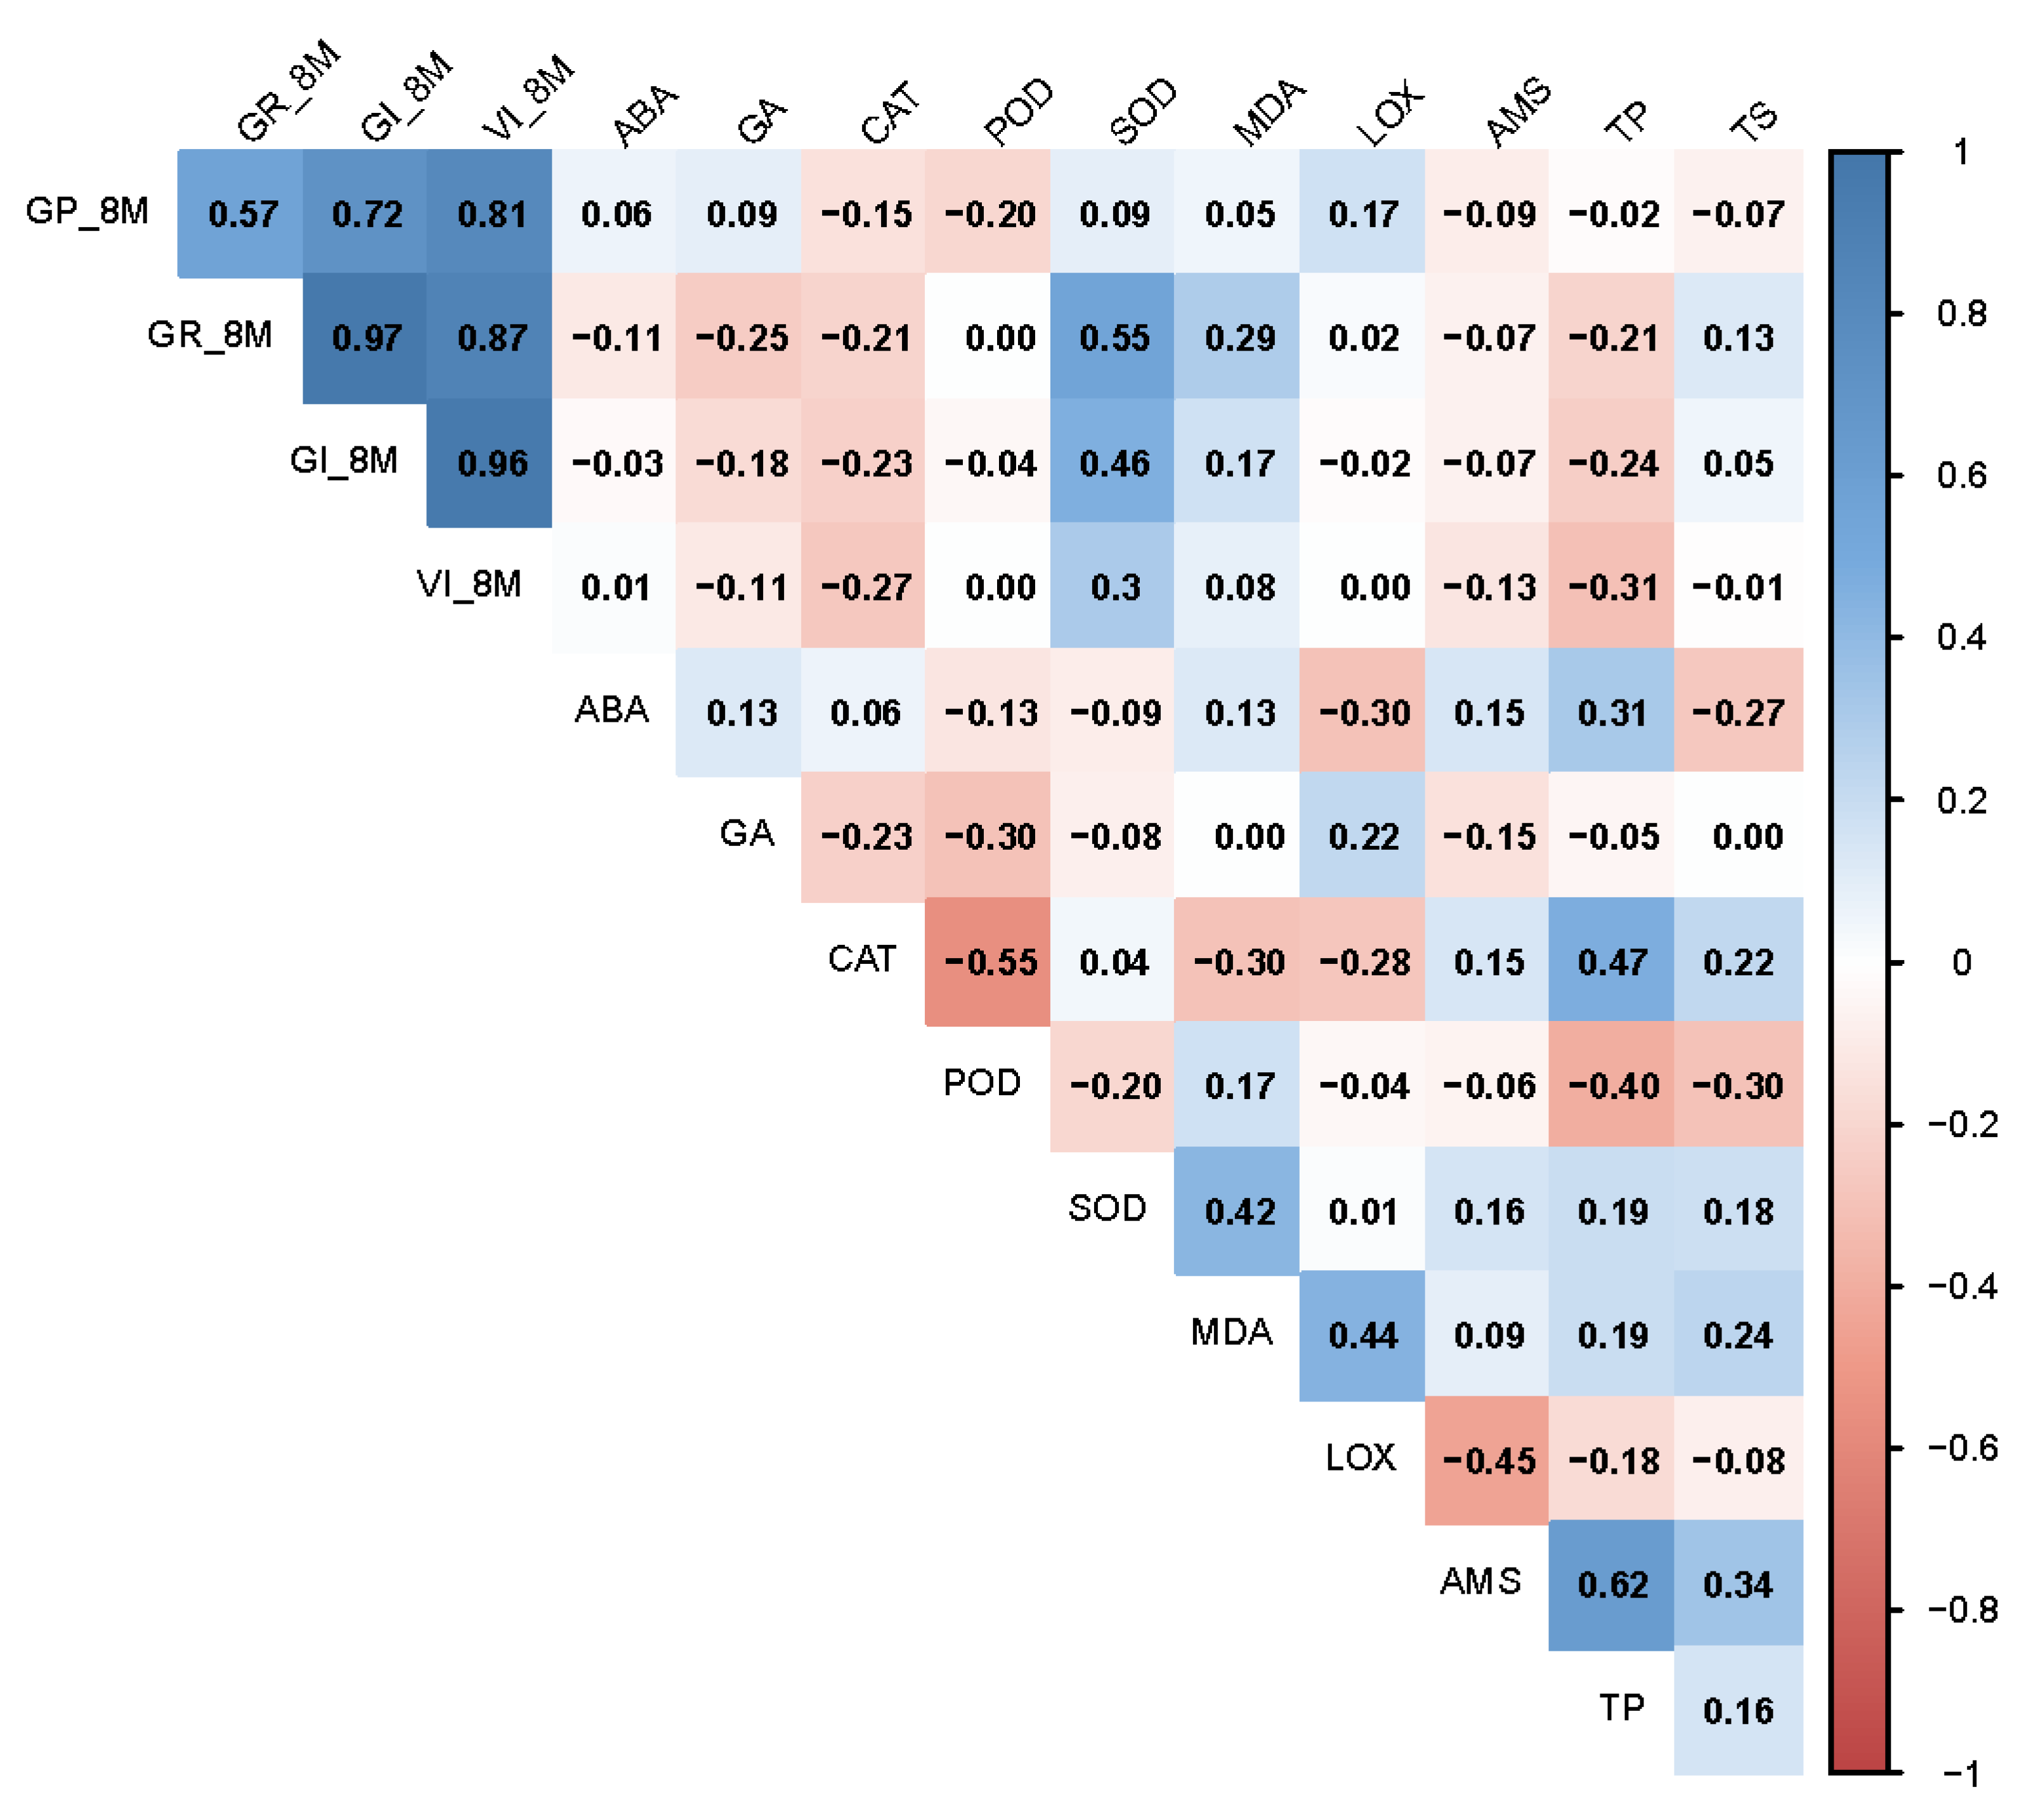
3.6. Correlation of Seed Vigor Indexes and Physiological Indexes in Artificially Aged Seeds

The correlation between 4 seed vigor indexes and 10 biochemical indexes was determined after artificial aging (Figure 6). The seed vigor parameters showed significant or extremely significantly correlation, with the exception of GR and VI. The correlation analysis among 10 biochemical indexes showed that ABA was significantly positively correlated with GA, extremely significantly positively correlated with LOX, and significantly negatively correlated with TP. GA was significantly positively correlated with POD, and CAT was significantly negatively correlated with MDA and positively correlated with AMS. LOX was negatively correlated with TP. The correlation analysis of 4 seed vigor indexes and 10 biochemical indexes showed that GR was negatively correlated with ABA, GR and GA. This result implies that the germination of artificial aged seeds might be negatively regulated by the ABA and GA content.

3.7. Correlation of Seed Vigor Indexes and Physiological Indexes in Naturally Aged Seeds

The correlation between 4 seed vigor indexes and 10 biochemical indexes was also determined for naturally aged seeds (Figure 7). The seed vigor parameters were significantly or extremely significantly correlated with each other. The correlation analysis among 10 biochemical indexes showed that CAT was significantly negatively correlated with POD and positively correlated with TP. AMS was significantly positively correlated with TP. The correlation analysis of 4 seed vigor and 10 biochemical indexes showed that SOD was positively correlated with GR and GI, indicating that SOD activity mainly affects the germination of naturally aged sweet corn seeds.

4. Discussion

Natural aging is the most direct way to study the storage tolerance of seeds. However, it does not allow the rapid identification of seed storage tolerance because it requires long times [29]. For this reason, artificial aging is an alternative way that saves time and is commonly used in the study of seed storage tolerance. Artificial aging has been widely used in seed deterioration assays monitoring seeds in relative high moisture and temperature conditions. It has been reported that artificial aging and natural aging lead to similar results [25,30,31]. Both natural aging and artificial aging were shown to increase MDA content, the level of hydrogen peroxide and electrolyte leakage in seeds of Jatropha curcas [32]. However, the identification of artificial aging for seed storage tolerance is controversial for certain plant seeds. Rajjou et al. reported that similar events occur in Arabidopsis seeds during artificial and natural aging, including increased protein oxidation (carbonylation), loss of functional properties of seed proteins and enzymes and/or their enhanced susceptibility toward proteolysis [4]. However, some studies have also shown that there are significant differences between artificial aging and natural aging, which are controlled by different genes [33,34]. Different QTLs (qSSnj-2-1 and qSSn-2-2) were detected only after artificial aging, indicating that artificial treatments do not thoroughly mimic the deterioration processes occurring in conventional storage conditions [35]. In this study, we determined the basic physiological and biochemical phenotypes of sweet corn seeds under both natural aging and artificial aging. We found that seed vigor indexes were primarily affected by ABA and GA content under artificial aging, while SOD was the main factor affecting seed vigor in naturally aged sweet corn seeds.
GP, GR, GI and VI are essential indicators reflecting seed vigor. In this study, the seed vigor indicators significantly decreased with the increase of the aging time during artificial aging and natural aging. During natural aging, the declining trend of seed vigor indicators was not constant, but a slow decline occurred in the early stage, followed by a rapid decline, consistent with the changes observed in artificially aged seeds (Figure 1). This result is similar to previous findings in aged soybean seeds [36], and the rate of the decline of seed vigor indicators was related to temperature and humidity during natural aging. In addition, our results showed significant differences in several biochemical indicators, such as AMS activity and ABA and GA content, between artificial accelerated aging and natural aging (Figure 2 and Figure 3), indicating that different aging mechanisms were activated during natural aging and artificial aging. For natural aging, both GR and GI were positively correlated with the SOD activity (Figure 7). A previous study showed that the GR significantly increased in tobacco seeds from lines overexpressing the Cu/Zn-SOD genes compared to wildtype seeds after two years of dried storage at room temperature [37], which is consistent with our results. SOD might act on the removal of ROS and alleviate their harmful effects during seed aging. These results indicate that improving SOD activity might be an efficient strategy to extend seed longevity and prevent the genetic and physiological loss of seed vigor.
ABA is involved in seed development, maturation and primary germination, as well as in post-germination seedling growth [38]. Sunflower seeds with a high ABA content exhibited reduced seed vigor under high drying temperatures during storage [39]. In our study, ABA content was negatively correlated with seed vigor in sweet corn seeds under artificial aging (Figure 6). In addition to ABA, GA has shown to affect seed dormancy and germination in maize [40]. Seeds from wild-type plants treated with GA and from a quintuple DELLA mutant with constitutive GA signaling were more tolerant to aging, confirming the role of GA in seed aging and seed longevity [41]. Our results showed that GA content was significantly correlated with seed vigor in sweet corn seeds under artificial aging (Figure 6). These results indicate that ABA and GA play important roles in seed vigor under artificial aging in sweet corn, differently from what observed with natural aging. It could be that the ABA and GA content changed faster in seeds subjected to artificial accelerated aging than in those under natural aging. However, we still cannot explain the reason why GA was negatively correlated with seed vigor under artificial accelerated aging in sweet corn (Figure 6).
Previous studies showed that lipid peroxidation is the first event in the aging process [42], and there are also reports that lipid peroxidation and destruction of cell membranes mediated by free radicals are the main damage in the aging process of seeds [43]. In our study, LOX activity showed changes when comparing natural aging and artificial aging (Figure 5), but MDA, the end-product of lipid peroxidation, showed non-significantly changes between these two treatments (Figure 4). These results demonstrate that MDA reacts with biomacromolecules resulting in cell membrane damage during the two seed aging treatments, but its regulation mechanisms in natural aging and artificial aging might be different. In summary, the improvement of the activity of antioxidative enzymes and the increase in ABA content contribute to the aging resistance of sweet corn seeds.

Supplementary Materials

The following supporting information can be downloaded at: https://www.mdpi.com/article/10.3390/agronomy12051028/s1, Table S1: The pedigree of the 19 lines; Table S2: The GP and GR of the 19 lines; Table S3: The GI and VI of the 19 lines.

Author Contributions

F.F. and B.W. designed the experiments, and F.F. obtained funding for the research. B.W. and R.Y. contributed to compiling and analyzing the data and wrote the manuscript. Z.J. and H.Z. (Huaxing Zhang) conducted the statistical analysis. W.Z. and H.Z. (Huihui Zhang) performed the experimental analyses. All authors have read and agreed to the published version of the manuscript.

Funding

National Natural Science Foundation of China (31871713).

Institutional Review Board Statement

Not applicable.

Informed Consent Statement

Not applicable.

Data Availability Statement

Not applicable.

Conflicts of Interest

The authors declare no conflict of interest.

References

  1. Hallauer, A.R. Specialty Corns, 2nd ed.; CRC Press: Boca Raton, FL, USA, 2000. [Google Scholar]
  2. Fan, L.; Yan, Q. Research progress on the causes of low seed vigor and seed treatment technology of sweet corn. Chin. Agric. Sci. Bull. 1996, 12, 24–26. [Google Scholar]
  3. Mcdonald, M.B. Seed deterioration: Physiology, repair and assessment. Seed Sci. Technol. 1999, 27, 177–237. [Google Scholar] [CrossRef]
  4. Rajjou, L.; Lovigny, Y.; Groot, S.P.; Belghazi, M.; Job, C.; Job, D. Proteome-wide characterization of seed aging in Arabidopsis: A comparison between artificial and natural aging protocols. Plant Physiol. 2008, 148, 620–641. [Google Scholar] [CrossRef] [Green Version]
  5. Baskin, C.C.; Baskin, J.M. Breaking Seed Dormancy during Dry Storage: A Useful Tool or Major Problem for Successful Restoration via Direct Seeding? Plants 2020, 9, 636. [Google Scholar] [CrossRef]
  6. Kameswara Rao, N.; Dulloo, M.E.; Engels, J.M.M. A review of factors that influence the production of quality seed for long-term conservation in genebanks. Genet. Resour. Crop Evol. 2017, 64, 1061–1074. [Google Scholar] [CrossRef]
  7. Xia, F.; Wang, X.; Li, M.; Mao, P. Mitochondrial structural and antioxidant system responses to aging in oat (Avena sativa L.) seeds with different moisture contents. Plant Physiol. Biochem. 2015, 94, 122–129. [Google Scholar] [CrossRef]
  8. Ellis, R.H.; Hong, T.D. Temperature sensitivity of the low-moisture-content limit to negative seed longevity--moisture content relationships in hermetic storage. Ann. Bot. 2006, 97, 785–791. [Google Scholar] [CrossRef] [Green Version]
  9. Li, X.Z.; Simpson, W.R.; Song, M.L.; Bao, G.S.; Niu, X.L.; Zhang, Z.H.; Xu, H.F.; Liu, X.; Li, Y.L.; Li, C.J. Effects of seed moisture content and Epichloe endophyte on germination and physiology of Achnatherum inebrians. S. Afr. J. Bot. 2020, 134, 407–414. [Google Scholar] [CrossRef]
  10. Filho, C.H.; Goneli, A.; Masetto, T.E.; Martins, E.; Oba, G.C. The effect of drying temperatures and storage of seeds on the growth of soybean seedlings. J. Seed 2016, 38, 287–295. [Google Scholar] [CrossRef] [Green Version]
  11. Harrington, J.F. Seed Storage and Longevity; Kozlowski, T.T., Ed.; Seed Biology; Academic Press: New York, NY, USA, 1972; Volume III, pp. 145–245. [Google Scholar]
  12. Jiang, F.L.; Bo, L.P.; Xu, J.J.; Wu, Z. Changes in respiration and structure of non-heading Chinese cabbage seeds during gradual artificial aging. Sci. Hortic.-Amst. 2018, 238, 14–22. [Google Scholar] [CrossRef]
  13. Nigam, M.; Mishra, A.P.; Salehi, B.; Kumar, M.; Sahrifi-Rad, M.; Coviello, E.; Iriti, M.; Sharifi-Rad, J. Accelerated ageing induces physiological and biochemical changes in tomato seeds involving MAPK pathways. Sci. Hortic.-Amst. 2019, 248, 20–28. [Google Scholar] [CrossRef]
  14. Xia, F.; Chen, L.; Sun, Y.; Mao, P. Relationships between ultrastructure of embryo cells and biochemical variations during ageing of oat (Avena sativa L.) seeds with different moisture content. Acta Physiol. Plant 2015, 37, 1825. [Google Scholar] [CrossRef]
  15. Radha, B.N.; Channakeshava, B.C.; Hullur, N.; Pandurange, G.; Bhanuprakash, K.; Ramachandrappa, B.K.; Munirajappa, R. Effect of seed ageing on protein quality and quantity in maize. Int. J. Bioassays 2014, 3, 1708–1713. [Google Scholar]
  16. Pairochteerakul, P.; Jothityangkoon, D.; Ketthaisong, D.; Simla, S.; Lertrat, K.; Suriharn, B. Seed Germination in Relation to Total Sugar and Starch in Endosperm Mutant of Sweet Corn Genotypes. Agronomy 2018, 8, 299. [Google Scholar] [CrossRef] [Green Version]
  17. Morscher, F.; Kranner, I.; Arc, E.; Bailly, C.; Roach, T. Glutathione redox state, tocochromanols, fatty acids, antioxidant enzymes and protein carbonylation in sunflower seed embryos associated with after-ripening and ageing. Ann. Bot. 2015, 116, 669–678. [Google Scholar] [CrossRef] [Green Version]
  18. Sano, N.; Rajjou, L.; North, H.M.; Debeaujon, I.; Marion-Poll, A.; Seo, M. Staying Alive: Molecular Aspects of Seed Longevity. Plant Cell Physiol. 2016, 57, 660–674. [Google Scholar] [CrossRef] [Green Version]
  19. Gill, S.S.; Tuteja, N. Reactive oxygen species and antioxidant machinery in abiotic stress tolerance in crop plants. Plant Physiol. Biochem. 2010, 48, 909–930. [Google Scholar] [CrossRef]
  20. Sharma, P.; Jha, A.B.; Dubey, R.S.; Pessarakli, M.; Polle, A. Reactive Oxygen Species, Oxidative Damage, and Antioxidative Defense Mechanism in Plants under Stressful Conditions. J. Bot. 2012, 2012, 217037. [Google Scholar] [CrossRef] [Green Version]
  21. Mittler, R. ROS Are Good. Trends Plant Sci. 2017, 22, 11–19. [Google Scholar] [CrossRef] [Green Version]
  22. Meitha, K.; Pramesti, Y.; Suhandono, S. Reactive Oxygen Species and Antioxidants in Postharvest Vegetables and Fruits. Int. J. Food Sci. 2020, 2020, 8817778. [Google Scholar] [CrossRef]
  23. Cheng, H.; Ma, X.; Jia, S.; Li, M.; Mao, P. Transcriptomic analysis reveals the changes of energy production and AsA-GSH cycle in oat embryos during seed ageing. Plant Physiol. Biochem. 2020, 153, 40–52. [Google Scholar] [CrossRef]
  24. Aalen, R.B. Peroxiredoxin antioxidants in seed physiology. Seed Sci. Res. 1999, 9, 285–295. [Google Scholar] [CrossRef]
  25. Machado Neto, N.; Custodio, C.; Takaki, M. Evaluation of naturally and artificially aged seeds of Phaseolus vulgaris L. Seed Sci. Technol. 2001, 29, 137–149. [Google Scholar] [CrossRef]
  26. Zhu, Y.; Xia, L.; Zhu, S.; Liu, J.; Yang, R.; Wang, Q.; Li, X.; Feng, F. Changes of vigor, physiological characteristics and genetic diversities of artificially aged sweet corn seeds. J. South China Agric. Univ. 2018, 39, 25–30. [Google Scholar]
  27. Guan, Y.J.; Hu, J.; Wang, Z.F.; Zhu, S.J.; Wang, J.C.; Knapp, A. Time series regression analysis between changes in kernel size and seed vigor during developmental stage of sh2 sweet corn (Zea mays L.) seeds. Sci. Hortic.-Amst. 2013, 154, 25–30. [Google Scholar] [CrossRef]
  28. Friendly, M. Corrgrams: Exploratory displays for correlation matrices. Am. Stat. 2002, 56, 316–324. [Google Scholar] [CrossRef]
  29. Zhang, Y.; Teng, B.; Wu, J.; Wu, Y.; Xuan, H.; Zhu, X. Study on Accelerated Aging Test of Rice Seeds with High Temperature and Humidity. J. Chin. Cereals Oils Assoc. 2010, 25, 8–12. [Google Scholar]
  30. Kapoor, N.; Arya, A.; Siddqui, A.; Kumar, H.; Amir, A. Physiological and Biochemical Changes During Seed Deterioration in Aged Seeds of Rice (Oryza sativa L.). Am. J. Plant Physiol. 2011, 6, 28–35. [Google Scholar] [CrossRef] [Green Version]
  31. Basra, S.M.A.; Ahmad, N.; Khan, M.M.; Iqbal, N.; Cheema, M.A. Assessment of cottonseed deterioration during accelerated ageing. Seed Sci. Technol. 2003, 31, 531–540. [Google Scholar] [CrossRef]
  32. Suresh, A.; Shah, N.; Kotecha, M.; Robin, P. Evaluation of biochemical and physiological changes in seeds of Jatropha curcas L. Under natural aging, accelerated aging and saturated salt accelerated aging. Sci. Hortic.-Amst. 2019, 255, 21–29. [Google Scholar] [CrossRef]
  33. Giurizatto, M.; Ferrarese-Filho, O.; Ferrarese, M.; Dias, A.; Gonçalves, M.; Cardoso, C. α-Tocopherol levels in natural and artificial aging of soybean seeds. Acta Scientiarum. Agron. 2012, 34, 339–343. [Google Scholar] [CrossRef]
  34. Priestley, D.A.; Leopold, A.C. Lipid changes during natural aging of soybean seeds. Physiol. Plant. 1983, 59, 467–470. [Google Scholar] [CrossRef]
  35. Lin, Q.; Wang, W.; Ren, Y.; Jiang, Y.; Sun, A.; Qian, Y.; Zhang, Y.; He, N.; Hang, N.T.; Liu, Z.; et al. Genetic dissection of seed storability using two different populations with a same parent rice cultivar N22. Breed Sci. 2015, 65, 411–419. [Google Scholar] [CrossRef] [Green Version]
  36. Gao, H.; Man, Q.; Pan, J.; Lei, Y.; Yu, H.; Wu, M.; Zhang, W.; Liu, L. Differences in Properties of Seed Vigor Between Artificially and Naturally Aged Soybean Seeds. Seed 2015, 34, 14–18. [Google Scholar]
  37. Lee, Y.P.; Baek, K.; Lee, H.; Kwak, S.; Bang, J.; Kwon, S. Tobacco seeds simultaneously over-expressing Cu/Zn-superoxide dismutase and ascorbate peroxidase display enhanced seed longevity and germination rates under stress conditions. J. Exp. Bot. 2010, 61, 2499–2506. [Google Scholar] [CrossRef] [Green Version]
  38. Ali, F.; Qanmber, G.; Li, F.; Wang, Z. Updated role of ABA in seed maturation, dormancy, and germination. J. Adv. Res. 2022, 35, 199–214. [Google Scholar] [CrossRef]
  39. Huang, Y.; Lu, M.; Wu, H.; Zhao, T.; Wu, P.; Cao, D. High Drying Temperature Accelerates Sunflower Seed Deterioration by Regulating the Fatty Acid Metabolism, Glycometabolism, and Abscisic Acid/Gibberellin Balance. Front. Plant Sci. 2021, 12, 628251. [Google Scholar] [CrossRef]
  40. Xue, X.; Du, S.; Jiao, F.; Xi, M.; Wang, A.; Xu, H.; Jiao, Q.; Zhang, X.; Jiang, H.; Chen, J.; et al. The regulatory network behind maize seed germination: Effects of temperature, water, phytohormones, and nutrients. Crop J. 2021, 9, 718–724. [Google Scholar] [CrossRef]
  41. Bueso, E.; Muñoz-Bertomeu, J.; Campos, F.; Brunaud, V.; Martínez, L.; Sayas, E.; Ballester, P.; Yenush, L.; Serrano, R. ARABIDOPSIS THALIANA HOMEOBOX25 uncovers a role for Gibberellins in seed longevity. Plant Physiol. 2014, 164, 999–1010. [Google Scholar] [CrossRef] [Green Version]
  42. Ebone, L.A.; Caverzan, A.; Chavarria, G. Physiologic alterations in orthodox seeds due to deterioration processes. Plant Physiol. Biochem. 2019, 145, 34–42. [Google Scholar] [CrossRef]
  43. Fu, Y.B.; Ahmed, Z.; Diederichsen, A. Towards a better monitoring of seed ageing under ex situ seed conservation. Conserv. Physiol. 2015, 3, v26. [Google Scholar] [CrossRef] [Green Version]
Figure 1. Estimation of seed vigor indexes of sweet corn. Values are mean ± SE. ((A), Germination potential. (B), germination rate. (C), germination index. (D), vigor index). ‘ns’, *** indicate p > 0.05 and p ≤ 0.001, respectively, as compared to Control.
Agronomy 12 01028 g001
Figure 2. Comparative analysis of GA and ABA content between AA3d and NA8M seeds in 19 sweet corn lines. (A) GA content of AA3d- and NA8M-treated seeds. (B) ABA content of AA3d- and NA8M-treated seeds. ‘ns’ and ** indicate p > 0.05 and p ≤ 0.01 by t-test, respectively.
Agronomy 12 01028 g002
Figure 3. Comparative analysis of total protein content, total starch content and amylase activity in AA3d- and NA8M-treated seed from 19 sweet corn lines. (A) Total protein content of AA3d- and NA8M-treated seeds. (B) Total starch content of AA3d- and NA8M-treated seeds. (C) Amylase activity of AA3d- and NA8M-treated seeds. No label indicates no significant difference between AA3d and NA6M in A and B. ‘ns’, * and ** indicate p > 0.05, p ≤ 0.05 and p ≤ 0.01, respectively.
Agronomy 12 01028 g003
Figure 4. Comparative analysis of MDA content between AA3d and NA8M seeds in 19 sweet corn lines. ‘ns’ corresponds to p > 0.05.
Agronomy 12 01028 g004
Figure 5. Comparative analysis of CAT, POD, SOD and LOX activities in AA3d and NA8M seeds in 19 sweet corn lines. ‘ns’, * and ** indicate p > 0.05, p ≤ 0.05 and p ≤ 0.01, respectively. (A), (B), (C) and (D) indicate the CAT, POD, SOD and LOX activities of AA3d and NA8M, respectively.
Agronomy 12 01028 g005
Figure 6. Correlation analysis of seed vigor indexes and physiological indexes in seeds subjected to artificial aging.
Agronomy 12 01028 g006
Figure 7. Correlation analysis of seed vigor indexes and physiological indexes in seeds subjected to natural aging.
Agronomy 12 01028 g007
Table 1. Phenotypic performance and variance components of four seed vigor traits in 19 sweet corn lines.
Germination Potential (%)Germination Rate (%)Germination IndexVigor Index
meanControl61.84 ± 3.61 a90.84 ± 1.75 a5.10 ± 0.21 a36.69 ± 2.49 b
AA3d31.16 ± 3.94 c60.53 ± 4.80 c2.15 ± 0.19 d11.81 ± 1.25 d
AA6d13.89 ± 3.09 e30.63 ± 5.54 d1.18 ± 0.23 e3.42 ± 0.88 e
NA4M67.61 ± 4.14 a88.11 ± 2.61 a5.25 ± 0.18 a39.64 ± 2.68 a
NA6M52.42 ± 6.75 b76.00 ± 4.62 b4.51 ± 0.34 b28.18 ± 3.53 c
NA8M22.79 ± 4.77 d55.58 ± 5.64 c3.17 ± 0.39 c14.45 ± 3.21 d
Variance componentinbred lines2210.00 **2045.00 **8.36 **714.00 **
treatments18,495.00 **19,683.00 **106.10 **8134.00 **
Interaction497.50 **477.20 **1.66 **150.10 **
Different lowercase letters indicate significance of the mean values at the 0.05 level. ** indicates the significant at the level of 0.01.
Table 2. Correlation analysis for MDA content between AA3d and NA8M treatment.
TreatmentsMaxMinMeanCoefficient of VariationCorrelation Coefficient
AA3d72.9126.4050.660.320.9878 **
NA8M73.4426.6951.740.31
** indicate significant at the level of p ≤ 0.01.
Table 3. Comparison and variance analysis of CAT, POD, SOD, LOX activity and MDA content after AA3d and NA8M treatments.
TraitsMeanVariance Component
AA3dNA8MInbred LinesTreatmentsInteraction
CAT activity148.35 ± 49.91236.26 ± 72.98 (ns)9945.00 **146,819.00 **6037.00 **
POD activity2844.66 ± 998.952764.92 ± 804.67 (ns)1,598,798.00 **120,800.00 **1,767,739.00 **
SOD activity1518.63 ± 404.841632.42 ± 315.21 (ns)254,752.00 **245,995.00 **255,639.00 **
LOX activity2158.24 ± 920.673219.39 ± 681.86 (ns)966,162.00 **21,395,065.00 **1,715,268.00 **
‘ns’ and ** indicates p > 0.05 and p < 0.01 level, respectively. Mean values are mean ± SE.
Publisher’s Note: MDPI stays neutral with regard to jurisdictional claims in published maps and institutional affiliations.

