Article

Long-Term Field and Horticultural Crops Intensification in Semiarid Regions Influence the Soil Physiobiochemical Properties and Nutrients Status

1
Department of Soil Science, Punjab Agricultural University, Ludhiana 141004, India
2
Borlaug Institute for South Asia (BISA-CIMMYT), New Delhi 110012, India
3
Department of Agronomy, SardarVallabhbhai Patel University of Agriculture and Technology, Meerut 250110, India
4
Department of Soil Science & Agricultural Chemistry, SardarVallabhbhai Patel University of Agriculture and Technology, Meerut 250110, India
5
Department of Agronomy, Dr. Rajendra Prasad Central Agricultural University, Pusa 848125, India
6
Animal Production Research Institute, Dr. Rajendra Prasad Central Agricultural University, Pusa 848125, India
7
Department of Biology, College of Science, Taif University, P.O. Box 11099, Taif 21944, Saudi Arabia
8
Clinical Laboratory Sciences Department, Turabah University College, Taif University, 21995, Saudi Arabia
9
Department of Agronomy, Bangladesh Wheat and Maize Research Institute, Dinajpur 5200, Bangladesh
*
Authors to whom correspondence should be addressed.
Agronomy 2022, 12(5), 1010; https://doi.org/10.3390/agronomy12051010
Submission received: 16 October 2021 / Revised: 7 December 2021 / Accepted: 16 April 2022 / Published: 23 April 2022
(This article belongs to the Special Issue Land Management Impacts on Soil Properties and Soil Erosion Processes)

Abstract

:
The study was conducted to assess the long-term effects of predominant land uses on physicochemical properties, nutrient status and their interactions in soils of south-western Punjab representing the semi-arid soils of India. From each site, soil samples of three predominant land use viz. croplands, horticultural lands and uncultivated lands were collected from 0–15, 15–30, 30–60 and 60–90 cm depths. Soils of both croplands and horticultural lands were classified as sandy loam whereas uncultivated lands showed loamy sand texture with relatively higher pH, electrical conductivity (EC) and bulk density (Bd). Greater soil organic carbon (SOC), available nitrogen (N), phosphorus (P) and micronutrients (Zn, Cu, Fe and Mn) in horticulture might be due to the higher addition of OC and mineral nutrients through the decomposition of leaf litterfall and root deposits over their removal from soils while long-term use of potassic fertilizer raised the available K contents in croplands. Profile study up to 90 cm depicted the largest sequestration of 74.89 Mg C ha−1 under orchards which was 40 and 70% higher than croplands and uncultivated lands respectively. Significant variability in water-stable aggregates (WSA) (R2 = 0.5843, p < 0.05) and mean weighted diameter (MWD) (R2 = 0.6497, p < 0.01) with SOC indicated better soil stability in horticulture due to the presence of higher SOC. Positive relations of soil available micronutrients with SOC and finer soil particles were supported by the results of correlation, Principal component analysis and dendrogram indicating horticulture as a potent source of available micronutrients. An overall superiority of horticultural land use over the other two land uses in terms of nutrient status and soil stability suggests its inclusion as a positive strategy that could be taken into account in policymaking for maintaining productivity along with the sustainability of the concerned land degradation prone area.

1. Introduction

Soil is one of the most important non-renewable natural resources and keeping it healthy and productive is of utmost importance as it is the abode of terrestrial lives [1] and plays a vital role in agriculture. Soil quality may be defined as the capability of soils to boost the growth and development of plants as well as to maintain sustainability and productivity of the environment [2]. Soils of good quality are also efficient to prevent erosion and degradation and help in the mitigation of water and air pollution along with the promotion of plant growth. Therefore, assessment of soil quality is essential to establish a sustainable environment as well as an agricultural system. This information is also of great interest to the scientists as well as national agencies and policymakers for suitable adaptation and modification of land use and soil management practices to combat climate change along with soil sustainability.
A sustainable system is capable of maintaining or improving the quality of the lithosphere, hydrosphere and atmosphere [3]. In recent years keeping the environment sustainable has become a serious concern due to the continuous degradation of natural resources. Land-use changes due to anthropogenic activities are credible reasons behind land degradation which has become a considerable concern worldwide as it is the origin of several serious problems including hunger and poverty [4]. The pressure on the agricultural production system has been rising with the increase in population and socio-economic needs which ultimately results in unplanned land-use changes. Therefore, the selection of balanced land use is essential to meet these demands along with keeping the soil fertility optimum. Various agricultural land uses play pivotal roles in influencing the quality of soil by impacting various soil physicochemical parameters and also affect the supply and dynamics of nutrients [5]. Deforestation and conversion of natural vegetation into intensive cultivation results in alteration in soil reactions which largely affects the mobility and availability of several nutrients.
Soil organic carbon (SOC) is a pivotal factor that regulates the physical as well as chemical qualities of soil and maintains productivity as well as sustainability on a long-term basis [6]. Tree-based land uses usually have been found more efficient in soil C sequestration because of larger canopy cover, the continuous addition of OM in the form of leaf litters and various depositions from roots and the providence of a favourable environment for microbial growth [7]. Reduction of SOC due to the conversion of forests, orchards and grasslands into croplands were also noticed which in turn alters the soil physical and chemical qualities also [8]. Tillage practices, use of heavy machineries and continuous crop removal of nutrients under intensive cultivation are responsible for the deterioration of soil physical properties as well as nutrient status [5]. Different land uses both directly and indirectly by changing soil reactions, biomass and OM input influence the availability and distribution of several macro- as well as micro-nutrients to an appreciable amount [9].
Although the effect of land uses and management practices on soil quality is a widely studied issue around the globe periodic and improved assessment of soil quality and health is highly needed to attain knowledge regarding present soil condition as well as to keep the soil productive for a long run [10]. Selection of suitable land use can also improve the soil health and quality along with its maintenance [1]. Thus, elucidation of the impacts of land uses on soil health and quality, in the long run, is complex but indispensable from the regional to the global stage. The customary practices of the present study were performed in the semi-arid India, precisely the south-western plains of Punjab renowned as the centre of the green revolution of India and have its great agricultural importance. Similar to the various parts of the world, one of the customary practices of the studied is intensive cultivation along with the burning of crop residues which accelerates the process of land degradation as well as deterioration of soil fertility. We hypothesise those changes in agricultural land uses on a long-term basis affect various physical and chemical properties of soil which directly or indirectly alter nutrient availability, fertility and sustainability of soils. To address this hypothesis, the objectives of this study were to (i) assess major soil physicochemical parameters and soil nutrient contents under three mainland uses (croplands, horticultural lands and uncultivated lands) (Figures S1 and S2) and to compare them for 90 cm soil profile at four different depths (i.e., 0–15, 15–30, 30–60, 60–90 cm) (ii) find out the interrelations among different physicochemical properties and availability of soil macro and micronutrients and (iii) investigate the overall influence of land uses on soil quality, health and sustainability for inclusion of suitable land use to sustain quality and future productivity of soils of the intensively cultivated studied area. The findings of the research would be effective to understand the present status of soil physicochemical properties which in turn would be helpful for the policymakers to include potential land-use systems for the sustenance of soil as well as environmental quality and health.

2. Materials and Methods

2.1. Sampling Sites

Three sites were selected viz. Dhanaula (30°18′ N, 75°27′ E), located in Barnala district; Bhucho (30°15′ N, 75°03′ E) and Phul (30°19′ N, 75°14′ E), located in Bathinda district of the state Punjab (Figures S1 and S2; Table 1). The studied area could be classified as agro-ecological subregion 2.3 of India and as a semi-arid subtropical region with a mean temperature ranging from 4 °C (winter) to 45 °C (summer). The area receives about 400–500 mm of rainfall annually and most of which (around 75%) during the monsoon (July to September). From each site, soil samples were collected from three predominant land uses viz., croplands, horticultural lands and uncultivated lands (Table 1).
The selected land uses were of more than 10 years of prevalence so that a decade long prominent effects of land use on soil could be observed. Cotton-wheat cropping system was selected in the case of croplands. Samples under the horticultural lands were taken from 10–20 years old Guava (Psidium guajava) and Kinnow (Citrus reticulata Blanco) orchards. These lands were mainly under croplands in the early days and afterwards conversion of croplands into horticultural lands was done due to the rising economic values of fruits. The lands that were earlier under cultivation but abandoned for at least past 10 years were selected as uncultivated lands for the study. In most cases the arable lands were abandoned due to displacement of landowners or proprietary issues regarding the lands. Such lands were mainly covered with herbaceous weeds (viz., Cynodon dactylon, Cyperus rotundus, Cleome viscosa, Parthenium hysterophorus, etc.). Though it is difficult to gather accurate historical information regarding the studied land uses which is a limitation of this study, but the collection of reasonable information from local farmers and present owners of the land has been made. Such systematic and similar traits (i.e., presence of all three land uses with specifically mentioned cropping systems) were maintained during the selection of studied sites (Table 1). The soils of Dhanaula, Bhucho and Phul fall under Typic Ustochrepts, Ustochreptic Camborthids and Ustic Torripsamments, respectively [11]. Variations in nutrient input in soils under different studied land uses due to dissimilar management practices regarding fertilizer and manure application is another important factor in the present study (Table 2) [12,13,14,15]. However, these variations have also taken into consideration during the study.

2.2. Sampling and Analysis of Soils

Collections of soil samples were made from three random spots under each particular land-uses from 0–15, 15–30, 30–60 and 60–90 cm depths with the help of an auger, moved to the laboratory in polythene bags and air-dried. Elico-glass electrode pH meter was used for determining soil pH from 1:2 soil:water suspension using the method proposed by Jackson [16] while electrical conductivity (EC) was measured after suspension overnight using Elico conductivity meter. Soil texture characterization was made through the study of the distribution of particle sizes in which international pipette method [17] was followed. Measurement of soil bulk density (Bd) was done following core sampling method with the help of metallic cores having 5 cm inner diameter and 7 cm length. The wet sieving method [18] was used to measure the distribution of aggregates which is expressed in terms of water-stable aggregate (<0.25 mm) percentage (WSA). The mean weighted diameter (MWD) of aggregates was calculated using the formula:
MWD ( mm ) = Σ i = 1 n X i W i / Σ i = 1 n W i
where, n is the number of fractions, Xi is the mean diameter (mm) of the sieve size class and Wi is the weight of soil (g) retained on the ith sieve.
To estimate soil organic carbon content rapid titration method [19] was employed. The values of SOC percentage and Bd were used to compute SOC stock following the formula:
SOC stock (Mg ha−1) = SOC (%) × BD (Mg m−3) × Soil depth (m) × 100
The Alkaline-permanganate method [20] was followed to measure nitrogen availability (kg ha−1) in soils. The procedure proposed by Olsen et al. [21] was followed to estimate available phosphorus (kg ha−1) in soils. Potassium availability (kg ha−1) was determined using Flame Photometer [22] after extracting the soil samples with neutral normal ammonium acetate. Availability of soil micronutrients i.e., iron (Fe), manganese (Mn), zinc (Zn) and copper (Cu) were estimated through diethylene triamine pentaacetic acid (DTPA) (0.005 M DTPA + 0.01 M CaCl2 + 0.1 M TEA buffer adjusted to pH 7.30) extraction method [23] using an atomic absorption spectrophotometer (AAS) (Varian Techtron Model ABQ 775).

2.3. Statistical Analyses

The software SPSS (Ver. 23.0) was used to analyze the collected data following the randomized block design (RBD) and Tukey’s Post Hoc Test. Correlation and regression were also performed to observe interrelations between studied parameters. The performance of different land uses was analyzed by Principal Component Analysis (PCA). The biplot analysis help to determine which land-use system performed well for a particular soil property in south-western Punjab, India. The statistical significance was tested using the Bertlette test at p < 0.05. To test the degree of similarity and disparity among different land uses, cluster analysis was performed using straight line distance among observed variables and variable space. The closer points on Dendrogram illustrate the closeness in the relationship.

3. Results and Discussion

3.1. Soil Physicochemical Properties

All three studied land uses were found slightly alkaline and non-saline (Table 3). Depth-wise increase in pH was noted under horticultural and uncultivated lands resembling the findings of Bhunia et al. [24] while no specific order was observed in the case of EC. The pH of the soils of horticulture was lowest than the other two land uses which might be due to a negative correlation between SOC and soil pH which was observed in our study (Table 3). Leaf litterfall for a longer period of time and deposition of root exudates might be the reason behind the OC build-up as well as alleviation of soil acidity in surface and deeper soil layers respectively [25]. Exhaustion of basic cations by plant uptake and leaching along with the production of organic acids due to microbial oxidation could be the reason behind lower the pH under croplands over uncultivated lands [26].
Long term fertilization with mineral N-source such as urea is another vital factor and is responsible for lowering the soil pH [27]. Besides this, the mixing of upper soil layers due to tillage leads to the rise in accumulation of carbonate contents which in turn is responsible for the rise in pH under cropland as compared to horticultural land [5]. As the studied area is mainly under Aridisols, higher evaporative demand, particularly in the case of croplands and uncultivated lands, facilitates the accumulation of salts near the surface soil and formation of the calcic horizon which ultimately leads to higher EC soil [28]. The highest observed EC value in surface soils of croplands might be due to the addition of various salts through fertilizer application. Conversely, the overall EC value of croplands up to 90 cm was comparatively less than uncultivated lands may be due to the gradual movement of salts to the deeper layers with irrigation water [29].
The overall soil texture of the studied area was sandy loam irrespective of depths while only the surface layers of uncultivated lands exhibit loamy sand soil texture. The maximum amount of sands was observed under uncultivated lands followed by croplands and horticultural lands along with the studied profile (in all four layers) (Table 3). Conversely, an order of horticultural lands > croplands > uncultivated lands were observed along the depths in case of silt as well as clay contents. The overall soil texture of the studied area was sandy loam while loamy sand soil was observed in surface layers of uncultivated lands. Higher sand contents and lower fine particles (silt and clay) under cultivated lands than in orchards suggest an indication of land degradation which conforms with the findings of Tellen and Yerima [30]. This may be attributed to segregation and loss of silt and clay due to agronomic management practices such as tillage, harrowing etc. Again the rising amount of silt and clay with depth might be due to the illuviation of finer particles in deeper layers. Overgrazing, lack of vegetative cover, the erosional effect of rain and poor structure are associated with uncultivated lands which ultimately imparts the loamy sand texture. Though recent land uses are the main drivers of soil properties but previous uses of lands also influence soil properties to a great extent. Despite of exhibiting sandy loam texture the soils of uncultivated land also contained higher sand particles in deeper layers as compared to the rest two land uses, which might probably be due to previous exhaustive use of land as croplands. However, a lack of proof and accurate information regarding the past uses of such abandoned lands is a limitation of the present study.
The range of soil Bd varied between 1.39 and 1.76 Mg m−3 which falls in the usual range of Bd (1.40–1.75 Mg m−3) of coarse-textured soils of semi-arid regions [31]. Greater Bd was observed in croplands which might be due to compaction of soils as a result of different agricultural practices and the use of farm equipment [32]. Lower Bd under horticulture than other land uses was due to higher input of organic matter (OM) as an inverse relationship between Bd and SOC was noted. Enhancement in the Bd with an increase in depth was also observed in our research which might be attributed to the continuous rise in compaction due to the weight of the overlying soil and lowering of soil OM content along with the profile [33]. Higher Bd under uncultivated lands was due to higher sand fractions, low SOC contents, less soil disturbance and compaction by grazing animals for years.
On comparing both WSA and MWD, the highest value was recorded under horticulture, followed by croplands and uncultivated lands. Tillage operations and other cultivation practices were responsible for the mechanical breakdown of soil aggregates in croplands while the lower aggregate stability in uncultivated lands might be due to the impact of raindrops, overgrazing and harvest traffic that disrupts the aggregates and causes erosion too [34]. Additionally, cultivation is the credible reason behind SOC depletion which ultimately leads to the deterioration of aggregate stability in croplands [29]. Conversely, leaf litter-fall and rhizodeposition under orchards facilitate SOC build-up as well as improve microbial habitat and activity which in turn enhances soil aggregation [29]. The rise in soil aggregation was noted in the sub-surface layer (15–30 cm) both in terms of WSA and MWD irrespective of land uses which might be due to an additional supply of SOC through rhizodeposition of exudates and root decomposition along with higher clay content and less disturbance as compared to plough layer [35].

3.2. Soil Organic Carbon (SOC) Concentration, SOC Stocks and Soil Organic Matter (SOM)

Mean SOC concentration and soil organic matter (SOM) was found highest under horticultural lands followed by croplands and uncultivated lands along with the profile (Table 4 and Table 5).
In each layer up to 60 cm depth, significant differences were noted among land uses regarding SOC content whereas croplands and uncultivated lands were statistically similar at 60–90 cm soil depth. Similar to our findings, a depth-wise decrease in SOC contents was also observed by different researchers [36], while Pathak and Reddy [6] observed a gradual reduction in SOC concentration up to 40 cm depth followed by an increase in 40–100 cm depths. The greater amount of SOC content and SOM under orchards might be due to long-term additional application of OM in the form of manures, lesser soil disturbance, minimal C removal and higher biomass addition into the soil through deposition of root exudates and fall of leaf litters [36]. Intensive tillage and mechanical disturbances generally facilitate the breakdown of OM and loss of SOC under croplands as compared to orchards [36] but the addition of C in soils as external sources during manures and fertilizers application [37] is the reason behind the upliftment of C content in croplands than that of uncultivated lands. Though the addition of OM through external sources augments SOC [38], loss of a significant portion (around 71%) of the applied C has also been noted [39] in semi-arid climates which ultimately results in the stabilization of C in agricultural soils in a notably lower degree. Figure 1a depicts that the SOC stock of the studied 90 cm deep soil profile was maximum under horticultural lands (74.89 Mg ha−1) while croplands (53.87 Mg ha−1) and uncultivated lands (43.72 Mg ha−1) exhibited about 40 and 70% lower values of SOC stock respectively. No significant differences were observed between croplands and uncultivated lands in terms of SOC stock of 90 cm deeply studied profile. All studied land uses showed a common trait of greater SOC stocks in lower soil depths which was significantly prominent in horticultural lands (Figure 1b).
In Punjab, Dhaliwal et al. [40] observed in-situ burning of about 15% of wheat straw residues after mechanical harvesting during field preparation for the next crop which is a vital reason behind the deterioration of SOC, soil nutrient status as well as soil health under cultivation of cereal crops [7]. Lack of shades could be an additional cause that hastens soil C loss in croplands and uncultivated lands over horticulture as elevated temperature increases SOC oxidation rate [40]. Lower SOC stock in surface soils of uncultivated lands might be due to erosion due to lesser canopy cover and overgrazing while enhanced SOC stock in lower soil depths might be attributed to long-term OC build-up through the accumulation of decayed products and derivatives of roots of shrubs, grasses and several other natural vegetation. The degree of C sequestration also depends upon the quality of C inputs, in which case soils under orchards were marked as more potent than most other land uses [41].

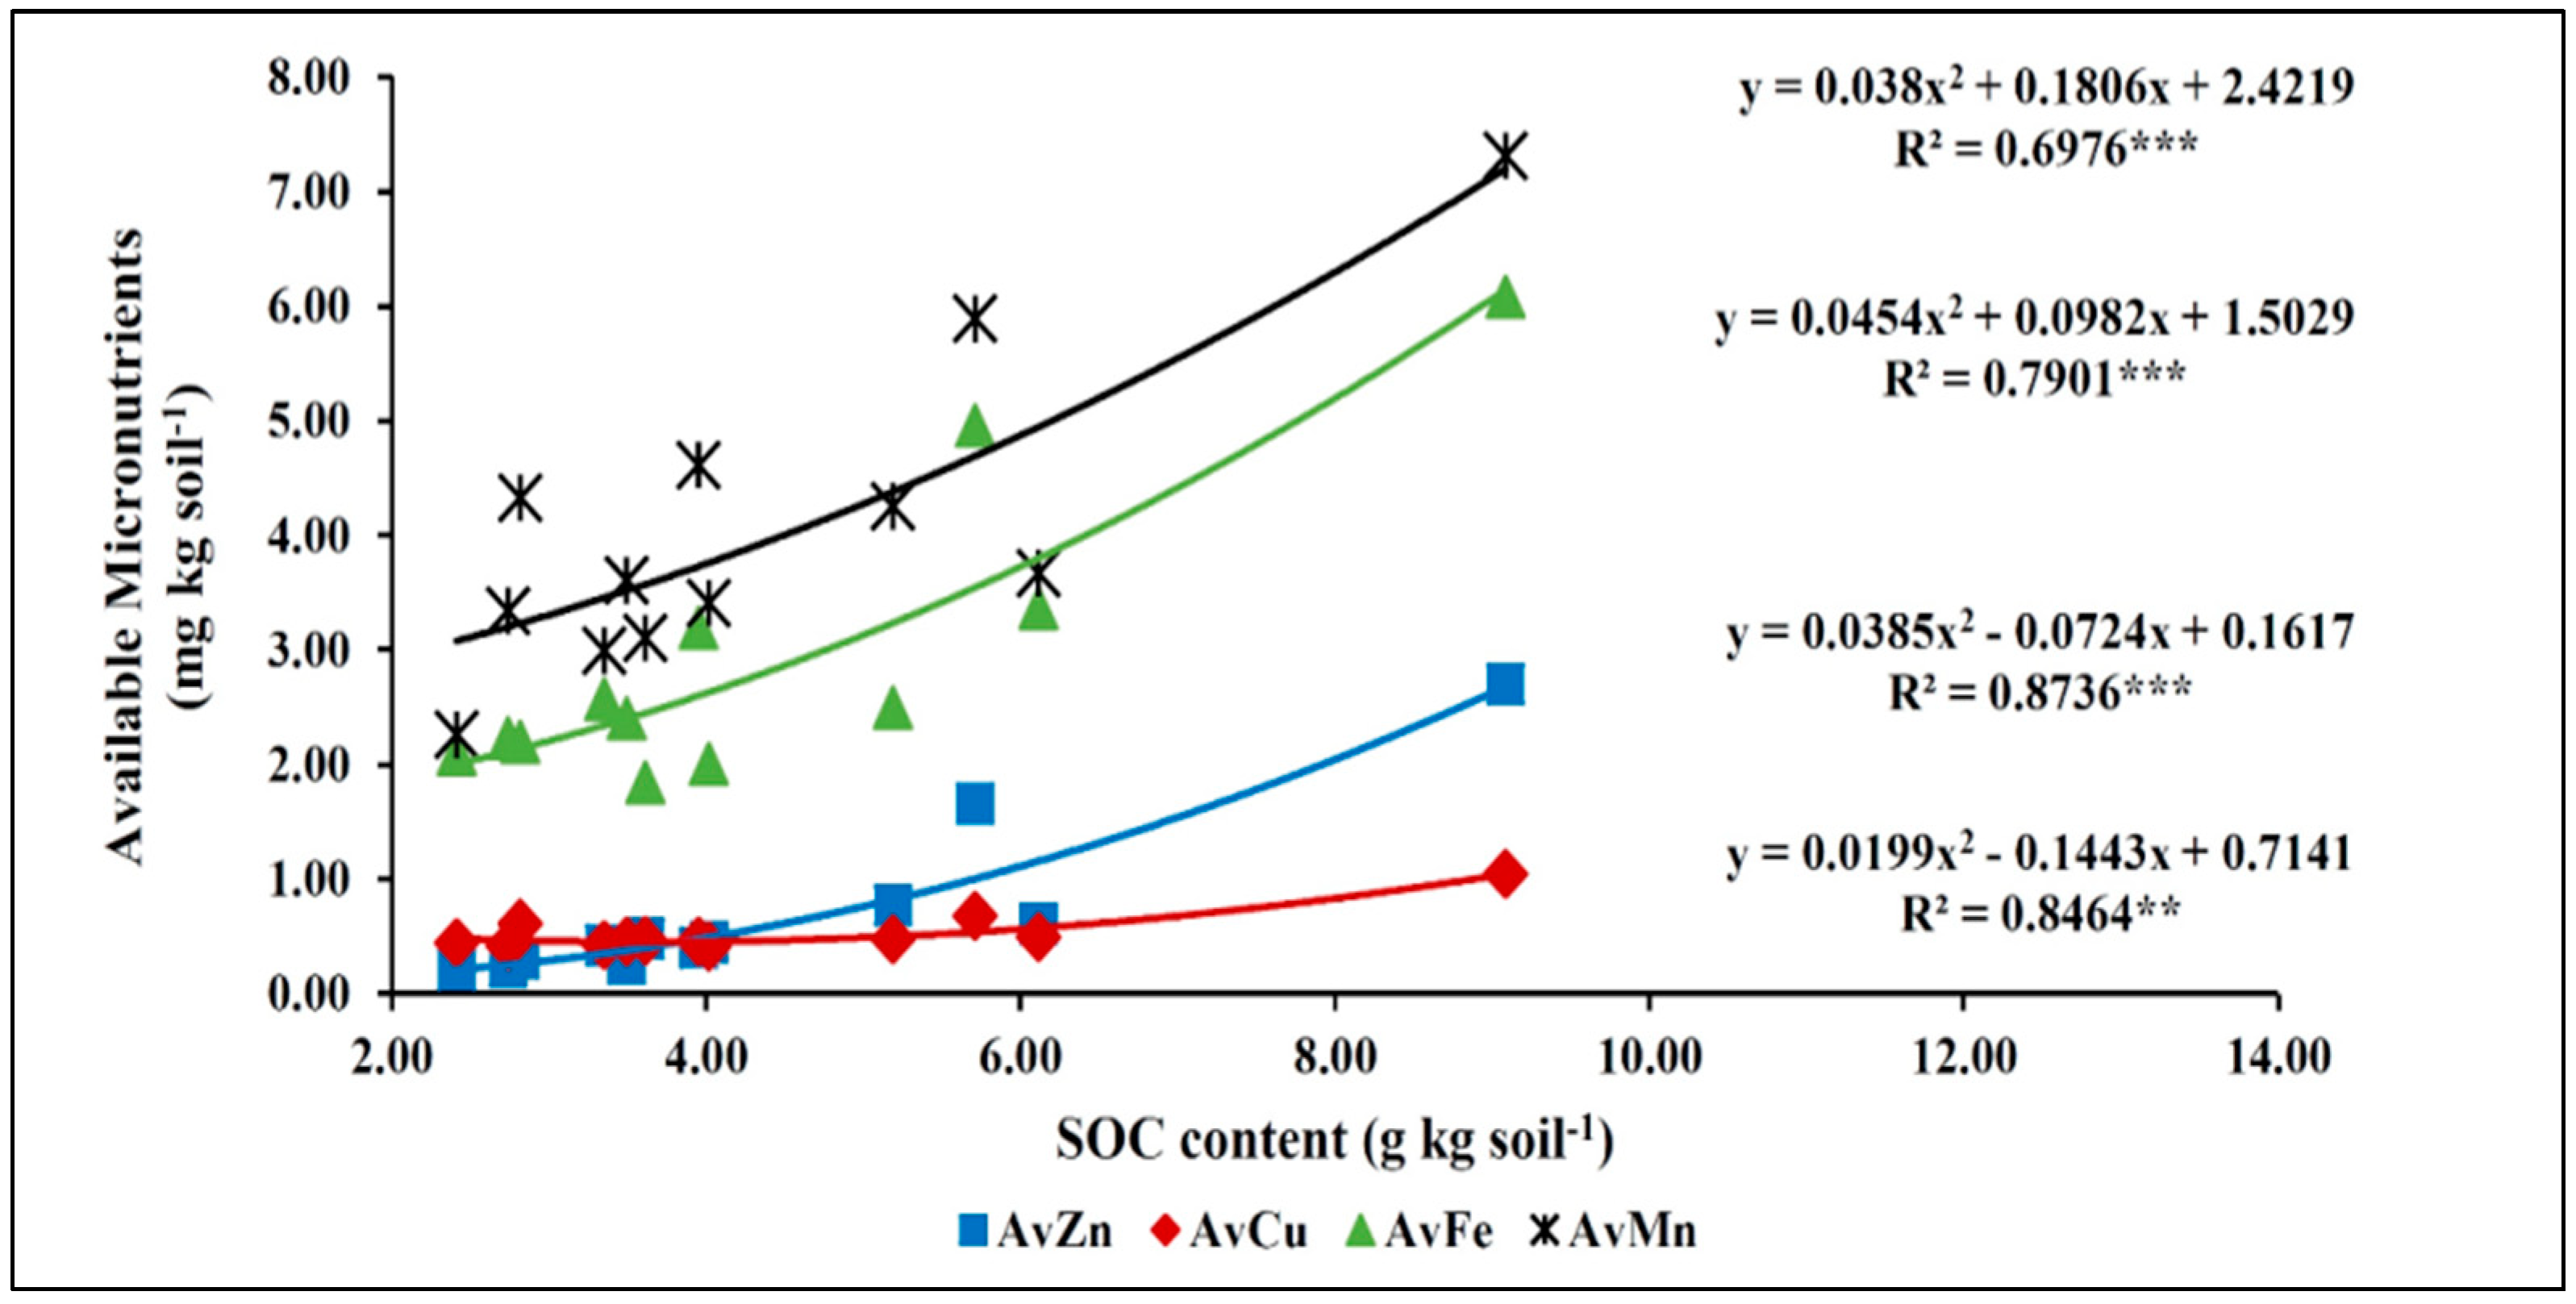
3.3. Available Nutrient Status (N, P, K and DTPA-Extractable Zn, Cu, Fe, Mn)

The studied area was found deficient in soil N availability indicating a steady order of horticultural lands > croplands > uncultivated lands with distinct significant differences in upper soil layers (0–15 and 15–30 cm) (Table 4). On comparing weighted mean values the N availability under uncultivated lands was significantly lower (50.41 kg ha−1) than that of horticultural lands (71.43 kg ha−1) and croplands (70.73 kg ha−1) (Table 5).
Both the croplands as well as horticultural lands were supplied with an appreciable amount of N through mineral fertilizer (Table 2). But higher OM addition through manuring, greater organic input in the form of root derivatives and leaf litterfall under orchards might augment N mineralization whereas exposure of soil to air facilitates microbial oxidation of SOC which eventually lessens the availability of N under cultivation [27] as SOC and soil N availability exhibited a positive relationship (Table S1). Less vegetation cover under croplands as compared to horticulture facilitates loss of N due to rainfall and irrigation eventually resulting in appreciable accumulation of N in deeper layers of croplands after being leached from the surface. Again, unlike croplands and orchards, no additional input of mineral N, continuous removal by weeds, weathering and land degradation could be the reason behind the least available N content under uncultivated lands as compared to the rest two studied land uses.
An order of croplands > horticulture > uncultivated lands was noted both in the uppermost and deepest studied layers (Table 4) whereas a different trend of horticulture > croplands > uncultivated lands was observed in 15–30 and 30–60 cm soil depths. On a weighted mean basis, the highest P availability was recorded under horticulture (15.73 kg ha−1) followed by croplands (15.22 kg ha−1) and uncultivated lands (8.07 kg ha−1). Higher P content in the case of horticulture may be due to the presence of fine-textured soils coupled with the significant addition of OM in soils through manure application, leaf litterfall and root deposition [42]. Organic acids liberated during OM decomposition may complex or chelate Fe, Al, Mg and Ca ions and prevent them from reacting with phosphate ions which improves the P availability in horticulture. Better P availability in surface soils under croplands over the other two land uses might be due to the result of continuous application of phosphatic fertilizers as well as organic manures that increase the availability and accumulation of P in the soil [27]. Similar to N and K, no external application of P is a reason behind the least P availability in soils under uncultivated lands. Accumulation of carbonate in coarse-textured soils of uncultivated lands also enhanced P sorption which eventually reduced the P availability [43].
Irrespective of depths soil K availability mostly followed a trend of croplands > horticultural lands > uncultivated lands (Table 4 and Table 5). Long term application of potassic fertilizers might have increased available K in cropland (Table 2). Relatively greater K availability in soils under orchards over uncultivated lands might be because of the application of K fertilizers under guava cultivation, the addition of a significant amount of organic matter as manure which enhances the SOC content especially in surface soils along with leaf-litter fall and root deposition, the liberation of bound K during decomposition of added organic matters and leaf litters and solubilisation of insoluble K. Lesser K availability in soils under uncultivated lands might be due to no external addition of elemental K as well as due to leaching losses and degradation of soil [44].
Mostly a gradual trend of horticultural lands > croplands > uncultivated lands was found in the case of all four micronutrient availability which was more pronounced at the upper layers. Statistical similarities were found between croplands and uncultivated land uses at soil depths of 0–15 and 15–30 cm (Table 4) while in the case of Cu, Fe and Mn availability no significant differences were recorded among the land uses while comparing their weighted average (Table 5). Under uncultivated lands, the accumulation of micronutrients in deeper layers was a notable trait and was pronounced in 30–60 cm soil depth. Greater micronutrient concentrations were recorded in horticultural lands and croplands than in uncultivated lands which conforms to some other findings also [44,45,46]. Rich micronutrient availability in horticulture could be attributed to relatively lower pH, finer soil texture, and more OM inputs through applying a bulk amount of organics as manure and litterfall which also encourages microbial activity. The SOC content greatly affects micronutrient availability as it influences oxidation and precipitation of micronutrients into their unavailable forms and serves as a source of chelating agents that forms soluble complexes of micronutrients that would be available to plants [47]. Exogenous OM addition through regular fertilizers and manures application under croplands results in better micronutrients availability [48]. Application of micronutrients under wheat, cotton, guava and kinnow cultivation to avoid decreases due to micronutrient deficiency [12,13,14,15] could also be considered as a secondary factor behind better micronutrient availability in soils of croplands and orchards. Contrarily, continuous crop removal, intensive cultivation and soil disturbances offset micronutrient concentrations under cropland as compared to horticulture causing a widespread deficiency in available Fe under cultivation. Poor micronutrient availability in soils of uncultivated lands might be for poor texture, lower clay contents and erosional loss. The gradual decrease in DTPA-extractable micronutrients along the depth was observed almost under all three land uses. Generally due to biological cycling nutrients move upwards as some proportion of nutrients uptaken by plants are moved aboveground and again added to the soil surface as litterfall [49]. Root distribution and rooting depth also influence the micronutrient profile significantly [50].

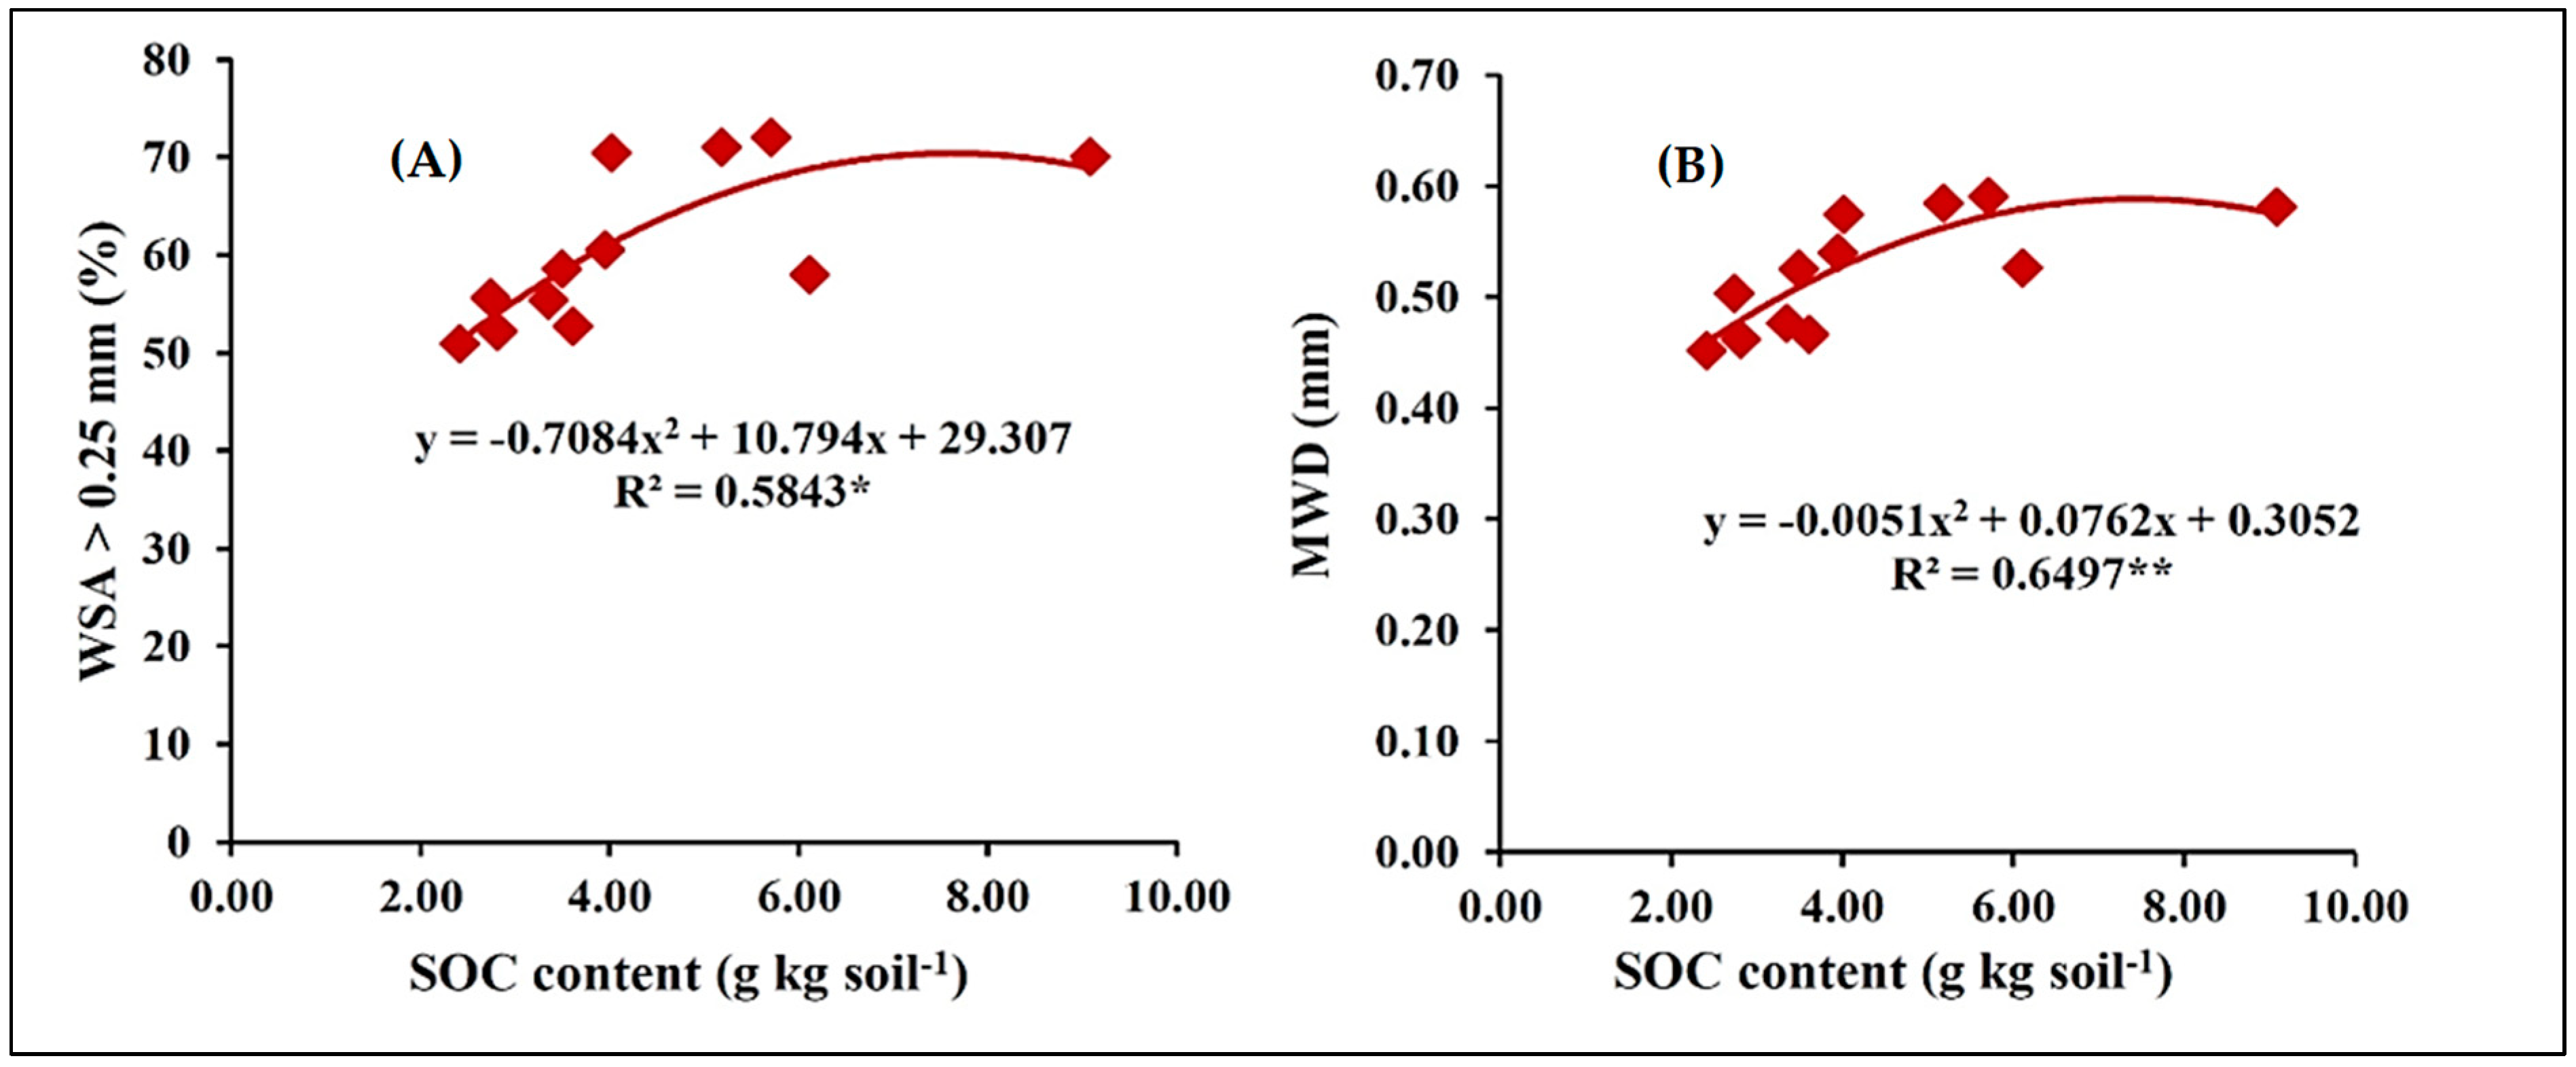
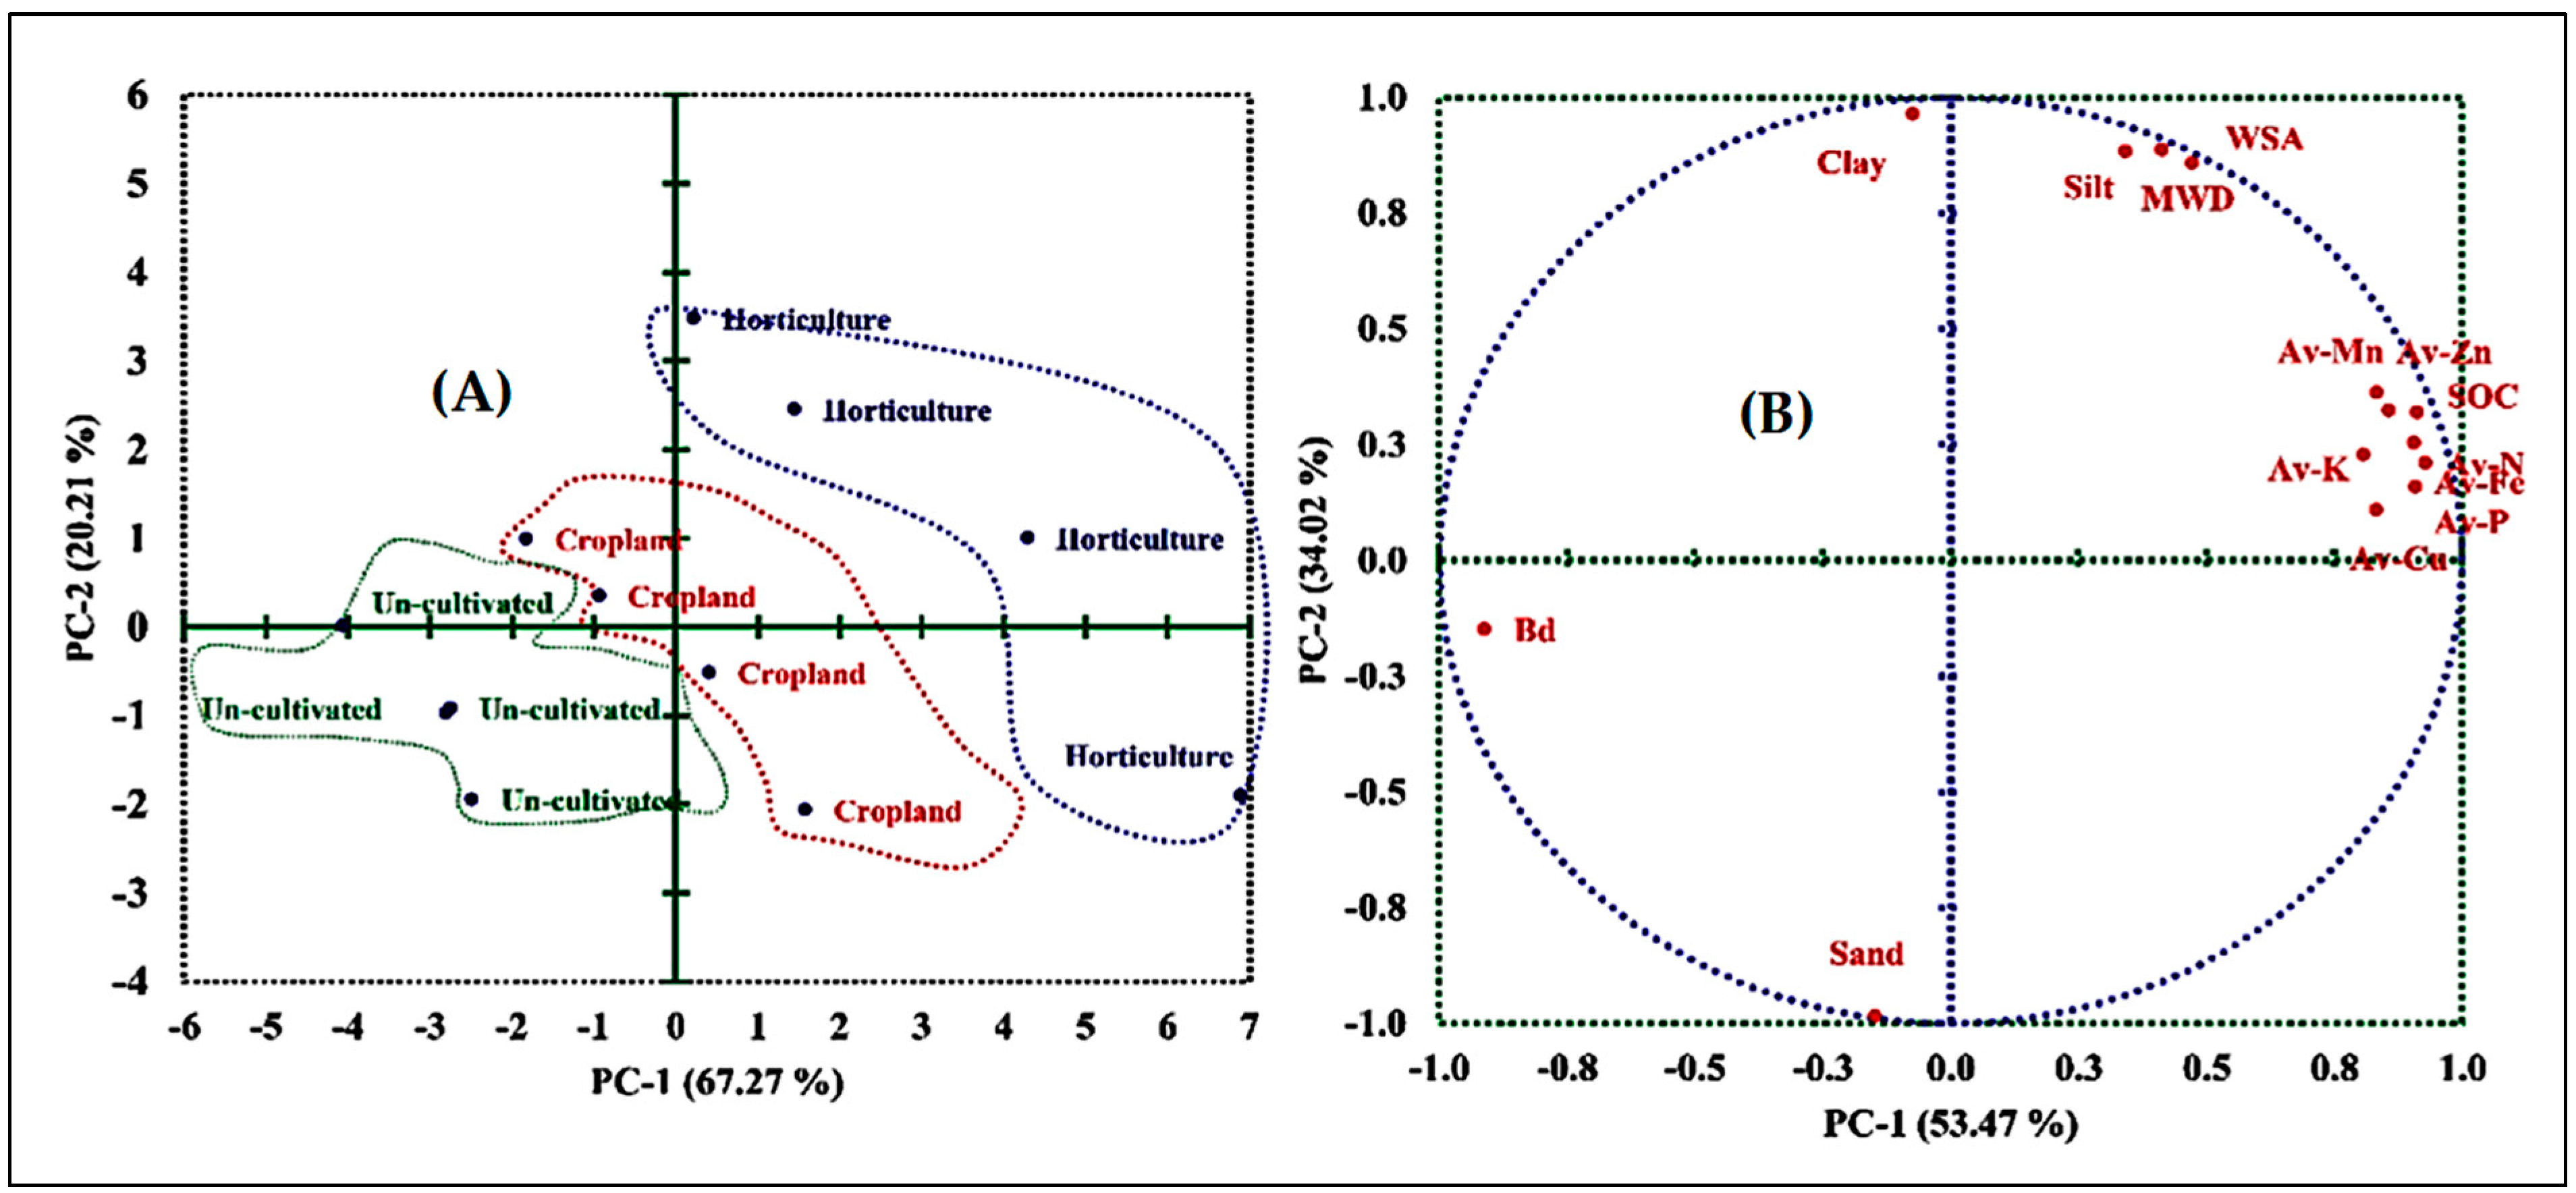
3.4. Relationships between Different Soil Parameters

The inverse relation between SOC and Bd (r = −0.70, p = 0.01) was noted in the recent study while significant positive correlations of WSA (r = 0.62, p = 0.01) and MWD (r = 0.58, p = 0.01) were found with SOC (Table S1). It was observed that SOC could explain 58% variation in WSA (WSA > 0.25 mm) (Figure 2) which was about. 62 and 53% reported by Saha et al. [51] and Holeplass et al. [30] respectively. Available soil N (r = 0.66, p = 0.05) exhibited significant positive correlation with SOC.
The studied micronutrients showed significant positive relations with SOC which was prominent in the case of Zn (r = 0.54, p = 0.01). Similar to the observations of Dhaliwal et al. [52], a positive correlation between clay content and micronutrient availability was also noted. Like the findings of Ojha et al. [53], the positive polynomial relationship was noted between available micronutrients (Zn, Cu, Fe and Mn) and SOC contents where enhancement in Zn availability with increment in SOC content was found continuous and much stronger than the rise of available Fe and Mn (Figure 3).
The formation of the chelating complex with organic material and slow mineralization rate of OM bound Zn lead to the slow continuous supply of the element [54]. Variability of Cu availability with SOC content in a lesser magnitude (R2 = 0.846, p < 0.01) might be due to the tendency of Cu to form a stronger inner-sphere complex with SOM [55] and weaker outer-sphere complex [56]. Thus, Cu exhibits better sorption to soil solids which ultimately results in less availability but higher total soil Cu concentration and a longer supply of the nutrient [57]. Biplots illustrate (Figure 4a,b) that the principal component explained 87.5% of the total variance.
The first PC (PC-1) explained 67.3% and the second PC (PC-2) explained 20.2% of total data-set variability (Table S2). From the Dendrogram (Figure S3) a close relationship between SOC and available micro-and macro-nutrients was observed under different land-use systems while the close relations of WSA and MWD of aggregates with soil silt and clay content indicates governance of finer fraction in the formation of soil aggregation.

4. Conclusions

Based on the present study the soils of both croplands and horticultural lands could be characterized as sandy loam soils. Soils of 15–90 cm depths under uncultivated lands were characterized as sandy loam soil while surface soils (0–15 cm) of uncultivated lands were classified as loamy sand soils with relatively higher pH, EC and Bd. Relatively poor soil nutrient status and soil stability under uncultivated lands might be due to no external input of mineral nutrients and micronutrients, very less OM input through decomposition of roots and residues of naturally grown weeds, removal of nutrients by the weeds growing in the abandoned lands, overgrazing and higher erosional loss. Greater SOC content under orchards over croplands and uncultivated lands might be attributed to smaller removal as compared to higher input of C through manuring, leaf litterfall and root deposits, and lesser soil disturbances and less thermal oxidation of C due to greater amount of shades provided by large canopy cover. Despite of being N deficient area, a positive correlation between SOC and N availability might be the reason behind the considerable predominance of available soil N under horticulture. Contrarily, appreciable accumulation of N in the deeper soil layers of croplands over horticultural lands might be governed by the process of leaching driven by rainfall and especially irrigation. Organic acids liberated due to decomposition OM prevents the reaction of Fe, Al, Mg and Ca ions with phosphate ions by forming chelates with them which leads to the overall rise in P availability. Greater OM content and finer soil particles under horticultural lands also enhance the P availability while long-term application of potassic fertilizer raised K availability in soils of croplands. The deficiency of micronutrients due to no external application has been further enhanced by low OC contents, greater disturbances and higher removal under uncultivated lands while a little bit improved micronutrient availability in sub-surface and deeper layers in uncultivated lands indicated positive influences of finer particles (silt and clay). Thus, an overall superiority both in terms of soil nutrient status and soil stability under predominant horticultural lands over croplands and uncultivated lands indicates that the inclusion of horticulture with suitable management practices in areas affected by intensive cultivation and abandoned lands would be an effective strategy to maintain soil sustainability, particularly under land degradation prone semi-arid climate.

Supplementary Materials

The following supporting information can be downloaded at: https://www.mdpi.com/article/10.3390/agronomy12051010/s1, Table S1: Correlations among studied soil physico-chemical parameters and nutrients irrespective of land-uses and soil depths; Table S2. Matrix of principle component analysis (PCA) for soils under different land use systems (data pooled for soil depths) obtained with various soil properties viz. sand, silt, clay, bulk density (Bd), water stable aggregates (WSA), mean weight diameter (MWD), soil organic C (SOC), available nitrogen (Av-N), available phosphorus (Av-P), available potassium (Av-K), available zinc (Av-Zn), available-copper (Av-Cu), available iron (Av-Fe) and available manganese (Av-Mn); Figure S1. Map indicating location of study area (south western Punjab, India) and sites of soil sampling; Figure S2. Pictures of the studied land-uses (a) Wheat field, (b) Cotton field, (c) Orchards (Kinnow cultivation and (d) Uncultivated land) of semi-arid zones of south-western Punjab; Figure S3. Dendrogram depicting single linkage and correlation coefficient distance between different soil variables viz. sand, silt, clay, bulk density (Bd), water stable aggregates (WSA), mean weight diameter (MWD), soil organic C (SOC), available nitrogen (Av-N), available phosphorus (Av-P), available potassium (Av-K), available zinc (Av-Zn), available-copper (Av-Cu), available iron (Av-Fe) and available manganese (Av-Mn).

Author Contributions

Conceptualization, A.M., A.S.T., S.S.D., P.S., V.K.S., V.S., R.K.G., R.K.N., Y.K., G.N. and B.P.; methodology and visualization, A.M., A.S.T., S.S.D., P.S., V.K.S., V.S., R.K.G., R.K.N., Y.K., G.N. and B.P.; software, A.M., A.S.T., S.S.D., B.P. and A.H.; validation, A.M., A.S.T., S.S.D., B.P. and A.H.; formal analysis, A.M., A.S.T., S.S.D., B.P. and A.H.; investigation, A.M., A.S.T., S.S.D., P.S., V.K.S., V.S., R.K.G., R.K.N., Y.K., G.N. and B.P.; resources, A.M., A.S.T., S.S.D., P.S., V.K.S., V.S., R.K.G., R.K.N., Y.K. and B.P.; data curation, A.M., A.S.T., S.S.D., B.P. and A.H.; writing—original draft preparation, A.M., A.S.T., S.S.D., P.S., V.K.S., V.S., R.K.G., R.K.N., Y.K. and B.P.; writing—review and editing, B.P., A.G., A.A., M.M.S. and A.H.; supervision and project administration, A.G., A.A., M.M.S. and A.H.; funding acquisition, A.G., A.A., M.M.S. and A.H. All authors have read and agreed to the published version of the manuscript.

Funding

This research was funded by the Department of Soil Science, Punjab Agricultural University, Ludhiana, India and also partially funded by Taif University Researches Supporting Project number (TURSP-2020/104), Taif University, Taif, Saudi Arabia.

Institutional Review Board Statement

Not applicable.

Informed Consent Statement

Not applicable.

Data Availability Statement

Most of the data are available in all Tables and Figures of the manuscripts.

Acknowledgments

We are thankful to the Department of Soil Science, Punjab Agricultural University, Ludhiana, India for providing facilities for conducting the research. The authors wish to acknowledge the valuable contribution of R. K. Setia, Scientist E, Punjab Remote Sensing Centre, Ludhiana, Punjab, India for the preparation and elaboration of the site map (Provided as supporting information) in ArcGis (Esri, USA, version 10.5.1) software. The authors also extend their appreciation to the Taif University Researches Supporting Project number (TURSP-2020/104), Taif University, Taif, Saudi Arabia.

Conflicts of Interest

There is no conflict of interest among the authors.

References

  1. Lal, R. Restoring soil quality to mitigate soil degradation. Sustainability 2015, 7, 5875–5895. [Google Scholar] [CrossRef] [Green Version]
  2. Arshad, M.A.; Martin, S. Identifying critical limits for soil quality indicators in agroecosystems. Agric. Ecosyst. Environ. 2002, 88, 153–160. [Google Scholar] [CrossRef]
  3. Singh, R.P. Earth observation and sustainable development goals. Geomat. Nat. Hazards Risk 2020, 11, i–vi. [Google Scholar] [CrossRef]
  4. FAO. Action against Desertification. 2017. Available online: http://www.fao.org/in-action/action-against-desertification/background/en/ (accessed on 28 May 2021).
  5. Cade-Menun, B.J.; Bainard, L.D.; LaForge, K.; Schellenberg, K.; Houston, B.; Hamel, C. Long-term agricultural land use affects chemical and physical properties of soils from southwest Saskatchewan. Can. J. Soil Sci. 2017, 97, 650–666. [Google Scholar] [CrossRef]
  6. Pathak, P.; Reddy, A.S. Vertical distribution analysis of soil organic carbon and total nitrogen in different land use patterns of an agro-organic farm. Trop. Ecol. 2021, 62, 386–397. [Google Scholar] [CrossRef]
  7. Yadav, R.P.; Bisht, J.K.; Pandey, B.M.; Kumar, A.; Pattanayak, A. Cutting management versus biomass and carbon stock of oak under high density plantation in Central Himalaya, India. Appl. Ecol. Environ. Res. 2016, 14, 207–214. [Google Scholar] [CrossRef]
  8. Dhaliwal, S.S.; Naresh, R.K.; Gupta, R.K.; Panwar, A.S.; Mahajan, N.C.; Ravinder-Singh; Mandal, A. Effect of tillage and straw return on carbon footprints, soil organic carbon fractions and soil microbial community in different textured soils under rice–wheat rotation: A review. Rev. Environ. Sci. Biotechnol. 2020, 19, 103–115. [Google Scholar] [CrossRef]
  9. Wasihun, M.; Muktar, M.; Teshome, Y. Evaluation of Effect of land use types on Selected Soil Physicochemical Properties in Itang-Kir area of Gambella region, Ethiopia. J. Biol. Agric. Healthc. 2015, 5, 128–138. [Google Scholar]
  10. Bunemann, E.K.; Bongiorno, G.; Bai, Z.G.; Creamer, R.E.; Deyn, G.D.; Goede, R.; Fleskens, L.; Geissen, V.; Kuyper, T.W.; Mader, P.; et al. Soil quality—A critical review. Soil Biol. Biochem. 2018, 120, 105–125. [Google Scholar] [CrossRef]
  11. NBSS & LUP. Soils of Punjab, National Bureau of Soil Survey and Land Use Planning; NBSS Publ. 46b; Vayusena Nagar: Nagpur, India, 1995; ISBN 81-85460-26-4. [Google Scholar]
  12. Mahal, J.S.; Kaur, S. Package of Practices for the Crops of Punjab—Kharif 2021; Punjab Agricultural University: Ludhiana, India, 2021; Volume 38, ISSN 2278-3725. [Google Scholar]
  13. Kumar, M.; Kar, A.; Raina, P.; Singh, S.K.; Moharana, P.C.; Chauhan, J.S. Assessment and mapping of available soil nutrients using gis for nutrient management in hot arid regions of North-Western India. J. Indian Soc. Soil Sci. 2021, 69, 119–132. [Google Scholar] [CrossRef]
  14. Thind, S.K.; Mahal, J.S. Package of Practices for Cultivateion of Fruits; Punjab Agricultural University: Ludhiana, India, 2021; ISBN 978-93-86267-00-9. [Google Scholar]
  15. Rattanpal, H.S.; Singh, G.; Singh, S.; Arora, A. Citrus Cultivation in Punjab; Punjab Agricultural University: Ludhiana, India, 2017; ISBN 978-93-86267-00-9. [Google Scholar]
  16. Jackson, M.L. Soil Chemical Analysis; Practice Hall of India Pvt Ltd.: New Delhi, India, 1967; pp. 452–485. [Google Scholar]
  17. Gee, G.W.; Bauder, J.W. Particle size analysis. In Methods of Soil Analysis; Part 1. Agronomy No. 9; Klute, A., Ed.; American Society of Agronomy: Madison, WI, USA, 1986; pp. 383–411. [Google Scholar]
  18. Yoder, R.E. A Direct method of aggregate analysis of soil and a study of the physical nature of erosion losses. J. Am. Soc. Agron. 1936, 28, 337–351. [Google Scholar] [CrossRef]
  19. Walkley, A.; Black, C.A. An examination of the Degtjareft method for determining soil organic matter and a proposed modification of the chromic acid titration method. Soil Sci. 1934, 37, 29–38. [Google Scholar] [CrossRef]
  20. Subbiah, B.V.; Asija, G.L. A rapid procedure for the estimation of available nitrogen in soils. Curr. Sci. 1956, 25, 259–260. [Google Scholar]
  21. Sahrawat, K.L.; Burford, J.R. Modification of the alkaline permanganate method for assessing the availability of soil nitrogen in upland soils. Soil Sci. 1982, 133, 53–57. [Google Scholar] [CrossRef]
  22. Merwine, H.D.; Peech, M. Exchangeability of soil potassium in the sand, silt and clay fractioned as influenced by the nature of the complementary exchangeable cation. Soil Sci. Soc. Am. Proc. 1951, 15, 125–128. [Google Scholar] [CrossRef] [Green Version]
  23. Lindsay, W.H.; Norvell, W.A. Development of DTPA soil test for zinc, iron, manganese and copper. Soil Sci. Soc. Am. J. 1978, 42, 421–428. [Google Scholar] [CrossRef]
  24. Bhunia, G.S.; Shit, P.K.; Maiti, M. Spatial variability of soil organic carbon under different land-use using radial basis function (RBS). Model. Earth Syst. Environ. 2016, 2, 1–8. [Google Scholar]
  25. Deng, Y.; Xia, D.; Cai, C.; Ding, S. Effects of land uses on soil physic-chemical properties and erodibility in collapsing-gully alluvial fan of Anxi County, China. J. Integr. Agric. 2016, 15, 1863–1873. [Google Scholar] [CrossRef] [Green Version]
  26. Chauhan, R.P.; Pand, K.K.; Thakur, S. Soil properties affected by land use systems in western Chitwan, Nepal. Int. J. Bioassays 2014, 2, 398–402. [Google Scholar] [CrossRef] [Green Version]
  27. Bizuhoraho, T.; Kayiranga, A.; Manirakiza, N.; Mourad, K.A. The Effect of Land Use Systems on Soil Properties; A case study from Rwanda. Sustain. Agric. Res. 2018, 7, 30–40. [Google Scholar] [CrossRef] [Green Version]
  28. Yu, P.J.; Liu, S.W.; Yang, H.T.; Fan, G.H.; Zhou, D.W. Short-term land use conversions influence the profile distribution of soil salinity and sodicity in northeastern China. Ecol. Indic. 2018, 88, 79–87. [Google Scholar] [CrossRef]
  29. Yu, P.; Hanb, D.; Liua, S.; Wena, X.; Huanga, Y.; Jiab, H. Soil quality assessment under different land uses in an alpine grassland. Catena 2018, 171, 280–287. [Google Scholar] [CrossRef]
  30. Tellen, V.A.; Yerima, B.P. Effects of land use change on soil physicochemical properties in selected areas in the North West region of Cameroon. Environ. Syst. Res. 2018, 7, 3. [Google Scholar] [CrossRef] [Green Version]
  31. Brady, N.C.; Weil, R.R. The Nature and Properties of Soils, 14th ed.; Prentice-Hall: Upper Saddle River, NJ, USA, 2015. [Google Scholar]
  32. Nath, A.J.; Lal, R. Effects of tillage practices and land use management on soil aggregates and soil organic carbon in the north Appalachian region, USA. Pedosphere 2017, 27, 172–176. [Google Scholar] [CrossRef]
  33. Don, A.; Schumacher, J.; Freibauer, A. Impact of tropical land-use change on soil organic carbon stocks—A meta-analysis. Glob. Chang. Biol. 2011, 17, 1658–1670. [Google Scholar] [CrossRef] [Green Version]
  34. Holeplass, H.; Singh, B.R.; Lal, R. Carbon sequestration in soil aggregates under different crop rotation and nitrogen fertilization in an Inceptisol in southern Norway. Nutr. Cycl. Agroecosystems 2004, 70, 167–177. [Google Scholar] [CrossRef]
  35. Kemner, J.E.; Adams, M.B.; McDonald, L.M.; Peterjohn, W.T.; Kelly, C.N. Fertilization and Tree Species Influence on Stable Aggregates in Forest Soil. Forests 2021, 12, 39. [Google Scholar] [CrossRef]
  36. Mandal, A.; Majumder, A.; Dhaliwal, S.S.; Toor, A.S.; Mani, P.K.; Naresh, R.K.; Gupta, R.K.; Mitran, T. Impact of agricultural management practices on soil carbon sequestration and its monitoring through simulation models and remote sensing techniques: A review. Crit. Rev. Environ. Sci. Technol. 2020, 52, 1–49. [Google Scholar] [CrossRef]
  37. Dhaliwal, S.S.; Naresh, R.K.; MandalAgniva Ravinder-Singh Dhaliwal, M.K. Dynamics and transformations of micronutrients in agricultural soils as influenced by organic matter build-up: A review. Environ. Sustain. Indic. 2019, 1–2, 100007. [Google Scholar] [CrossRef]
  38. Dhaliwal, S.S.; Naresh, R.K.; Mandal, A.; Walia, M.K.; Gupta, R.K.; Rajveer-Singh; Dhaliwal, M.K. Effect of manures and fertilizers on soil physical properties, build-up of macro and micronutrients and uptake in soil under different cropping systems: A review. J. Plant Nutr. 2019, 42, 2873–2900. [Google Scholar] [CrossRef]
  39. Anantha, K.C.; Majumder, S.P.; Padhan, D.; Badole, S.; Datta, A.; Mandal, B.; Gade, K.R. Carbon dynamics, potential and cost of carbon sequestration in double rice cropping system in semi-arid southern India. J. Soil Sci. Plant Nutr. 2018, 18, 418–434. [Google Scholar] [CrossRef] [Green Version]
  40. Dhaliwal, S.S.; Naresh, R.K.; Walia, M.K.; Gupta, R.K.; Mandal, A.; Rajveer-Singh. Long-term effects of intensive rice–wheat and agroforestry based cropping systems on build-up of nutrients and budgets in alluvial soils of Punjab, India. Arch. Agron. Soil Sci. 2020, 66, 330–342. [Google Scholar] [CrossRef]
  41. Jia, J.; Yu, D.; Zhou, L.; Bao, Y.; Meng, Y.; Dai, L. Variations of soil aggregates and soil organic carbon mineralization across forest types on the northern slope of Changbai Mountain. Acta Ecol. Sin. 2015, 35, 1–7. [Google Scholar] [CrossRef]
  42. Mandal, A.; Toor, A.S.; Dhaliwal, S.S. Assessment of sequestered organic carbon and its pools under different agricultural land-uses in the semi-arid soils of south-western Punjab, India. J. Soil Sci. Plant Nutr. 2020, 20, 259–273. [Google Scholar] [CrossRef]
  43. Vig, A.C.; Yashpal, S.; Aroa, G.S.; Bahl, G.S. Forms of P and efficacy of different soil tests for P extractability in calcareous soils. J. Indian Soc. Soil Sci. 2000, 48, 527–532. [Google Scholar]
  44. Moges, A.; Dagnachew, M.; Yimer, F. Land Use Effects on Soil Quality Indicators: A Case Study of Abo-Wonsho Southern Ethiopia. Appl. Environ. Soil Sci. 2013, 2013, 784989. [Google Scholar] [CrossRef]
  45. Dhaliwal, S.S.; Sharma, B.D.; Bijay-Singh; Khera, K.L. Profile distribution of chemical, physical and microbial characteristics in four land use systems of Sadh Di Khad watershed in submontaneous tract of Punjab. Asian J. Soil Sci. 2008, 3, 316–322. [Google Scholar]
  46. Dhaliwal, S.S.; Bijay-Singh. Depthwise distribution of macronutrients, micronutrients and microbial populations under different land use systems. Asian J. Soil Sci. 2013, 8, 404–411. [Google Scholar]
  47. Yitbarek, T.; Gebrekidan, H.; Kibret, K.; Beyene, S. Impacts of Land Use on Selected Physicochemical Properties of Soils of Abobo Area, Western Ethiopia. Agric. For. Fish. 2013, 2, 177–183. [Google Scholar] [CrossRef]
  48. Dhaliwal, S.S.; Bijay-Singh; Sharma, B.D.; Khera, K.L. Soil quality and yield trends of different crops in low productive submontaneous tract and highly productive area in Punjab, India. Indian J. Dryland Agric. Res. Dev. 2009, 24, 39–45. [Google Scholar]
  49. Stark, J.M. Causes of soil nutrient heterogeneity at different scales. In Exploitation of Environmental Heterogeneity by Plants; Caldwell, M.M., Pearcy, R.W., Eds.; Academic Press: San Diego, CA, USA, 1994. [Google Scholar]
  50. Rengel, Z. Cycling of micronutrients in terrestrial ecosystems. In Nutrient Cycling in Terrestrial Ecosystems; Marschner, P., Rengel, Z., Eds.; Springer: Berlin/Heidelberg, Germany, 2007; pp. 93–121. [Google Scholar]
  51. Saha, D.; Kukal, S.S.; Sharma, S. Landuse impacts on SOC fractions and aggregate stability in typicustocherpts of Northwest India. Plant Soil 2011, 339, 457–470. [Google Scholar] [CrossRef]
  52. Dhaliwal, S.S.; Bijay-Singh; Sharma, B.D. Soil quality and sustainability indices as influenced by potassium distribution in submontaneous tract of Punjab. Indian J. Dryland Agric. Res. Dev. 2008, 23, 42–47. [Google Scholar]
  53. Ojha, S.; Sourabh, S.; Dasgupta, S.; Das, D.K.; Sarkar, A. Influence of Different Organic Amendments on Fe, Mn, Cu and Zn Availability in Indian Soils. Int. J. Curr. Microbiol. Appl. Sci. 2018, 7, 2435–2445. [Google Scholar] [CrossRef]
  54. Kizilkaya, R. Cu and Zn accumulation in earthworm Lumbricusterrestris L. in sewage sludge amended soil and fractions of Cu and Zn in casts and surrounding soil. Ecol. Eng. 2004, 22, 141–151. [Google Scholar] [CrossRef]
  55. Boudesocque, S.; Guillon, E.; Aplincourt, M.; Marceau, E.; Stievano, L. Sorption of Cu (II) on to vineyard soils: Macroscopic and spectroscopic investigations. J. Colloid Interface Sci. 2007, 307, 40–49. [Google Scholar] [CrossRef] [PubMed]
  56. Tessier, A.; Fortin, D.; Belize, N.; DeVitre, R.R.; Leppard, G.G. Metal sorption to diagenetic iron and manganese oxyhydroxides and associated organic matter: Narrowing the gap between field and laboratory measurements. Geochim. Cosmoch. Acta 1996, 60, 387–404. [Google Scholar] [CrossRef]
  57. Degryse, F.; Smolders, E.; Parker, D.R. Partitioning of metals (Cd Co, Cu, Ni, Pb, Zn) in soils: Concepts, methodologies, prediction and applications—A review. Eur. J. Soil Sci. 2009, 60, 590–612. [Google Scholar] [CrossRef] [Green Version]
Figure 1. (A) Soil organic carbon (SOC) stock (Mg ha−1) of the studied soil profile (up to 90 cm depth) and (B) its distribution in four studied soil depths (0–15, 15–30, 30–60, 60–90 cm) under different land uses expressed in terms of percentage of total SOC stock (Vertical bars indicate standard errors of means; dissimilar letters indicate significant differences at p ≤ 0.05).
Agronomy 12 01010 g001
Figure 2. Relationship of (A) water-stable aggregates (WSA) > 0.25 mm (%) and (B) mean weighted diameter (MWD) (mm) with soil organic carbon (SOC) (g kg soil−1) irrespective of land uses and depths. * and ** next to R2 values indicate significance at p ≤ 0.05 and p ≤ 0.01 respectively.
Agronomy 12 01010 g002
Figure 3. Relationship of Available Micronutrients (mg kg soil−1) with soil organic carbon (SOC) (g kg soil−1) irrespective of land uses and depths. ** and *** next to R2 values indicate significance at p ≤ 0.01 and p ≤ 0.001 respectively.
Agronomy 12 01010 g003
Figure 4. Principle component analysis (PCA) biplots on the land-use systems (A) and the different soil parameters including sand, silt, clay, bulk density (Bd), water-stable aggregates (WSA), mean weight diameter (MWD), soil organic C (SOC), available nitrogen (Av-N), available phosphorus (Av-P), available potassium (Av-K), available zinc (Av-Zn), available-copper (Av-Cu), available iron (Av-Fe) and available manganese (Av-Mn) (B).
Agronomy 12 01010 g004
Table 1. Detailed information on sampling sites and studied land uses were assessed in the present study.
SitesLand UseCrops/PlantsAge of Land Use (Years)
(Approx.)
Geolocations
Latitude (N) Longitude (E)
Site 1
Dhanaula
CroplandsCotton-Wheat System2030°17′22.5″75°27′19.2″
HorticultureGuava and Kinnow1730°18′57.5″75°27′51.1″
Uncultivated-1530°19′01.2″75°27′52.0″
Site 2
Bhucho
CroplandsCotton-Wheat System1530°15′49.5″75°27′28.0″
HorticultureGuava and Kinnow1530°15′28.2″75°27′50.6″
Uncultivated-1530°15′33.2″75°27′38.0″
Site 3
Phul
CroplandsCotton-Wheat System1530°19′43.0″75°27′11.3″
HorticultureGuava and Kinnow1330°19′19.2″75°27′59.3″
Uncultivated-1530°19′21.0″75°27′45.6″
Total sample no. (n) = 108 = 3 {No of sites} × 3 {Land uses} × 4 {Depths} × 3 {Replications}.
Table 2. Fertilization and manuring practiced in the studied land uses.
Studied
Plants under Different Land-Uses
Doses of Nutrients Applied through Fertilizers and Manures
Organic Manure (t ha−1) N (kg ha−1) P2O5 (kg ha−1) K2O (kg ha−1) Micronutrient Recommendation
Crops
Cotton-75–150 (Depending upon Bt or Non-Bt Varieties) 3025–50
  • 25 kg zinc sulphate heptahydrate (21%) or 16.5 kg zinc sulphate monohydrate (33%) per hectare
Wheat-120–1306030–60
  • Spraying of zinc sulphate heptahydrate (21%) solution from anthesis to early grain development stages in the evening hours.
Orchards (More than 7 years old)
Guava
(Spacing = 6 m × 5 m) (Total trees = 325 nos. ha−1)
13–17 (Well Decomposed Cow-dung, 40–50 kg tree−1) 115–150
(750–1000 g tree−1)
105–130
(320–400 g tree−1)
210–295
(650–900 g tree−1)
  • 2–3 sprays of 1% solution of zinc sulphate at the fortnightly interval between June to September.
Kinnow
(Spacing = 6 m × 6 m) (Total trees = 275 nos. ha−1)
16–25 t ha−1 (60–90 kg tree−1) 205–250
(750–900 g tree−1)
95–125
(350–450 g tree−1)
-
  • Combined application of 1000 ppm solution of both Zn and Mn during April and August.
  • 3–4 sprays of 0.18% of ferrous sulfate solution in April and August.
  • Spray of Bordeaux mixture to avoid Cu deficiency.
Table 3. Depth-wise variation of soil physicochemical parameters under different studied land uses in south-western Punjab, India.
Depths
(cm)
Land Uses
CroplandsHorticultural LandsUncultivated Lands
pH
0–157.98 (±0.040) aAB7.69 (±0.015) cB7.84 (±0.139) bC
15–307.92 (±0.024) aB7.72 (±0.051) bB7.94 (±0.142) aBC
30–607.96 (±0.030) aAB7.73 (±0.036) bB8.01 (±0.136) aB
60–908.06 (±0.044) aA7.87 (±0.054) bA8.15 (±0.110) aA
EC dS m−1
0–150.47 (±0.019) aA0.33 (±0.026) cA0.42 (±0.060) bA
15–300.39 (±0.019) abB0.36 (±0.018) bA0.43 (±0.046) aA
30–600.36 (±0.020) aB0.32 (±0.022) aA0.35 (±0.045) aB
60–900.31 (±0.011) bC0.27 (±0.025) bB0.39 (±0.035) aAB
Sand (%)
0–1575.33 (±0.471) bA70.22 (±1.188) cA79.67 (±0.726) aA
15–3074.33 (±0.333) bAB67.22 (±1.746) cB78.11 (±0.978) aAB
30–6073.44 (±0.556) bBC67.56 (±1.773) cB77.33 (±0.850) aBC
60–9072.33 (±0.527) bC66.33 (±2.034) cB76.22 (±0.997) aC
Silt (%)
0–1515.56 (±0.444) bA19.00 (±1.225) aA11.78 (±1.128) cA
15–3014.89 (±0.772) bA19.22 (±0.401) aA13.22 (±1.256) cA
30–6015.33 (±0.957) bA18.33 (±0.289) aA14.78 (±1.579) bA
60–9015.00 (±0.799) bA19.11 (±0.351) aA14.89 (±1.637) bA
Clay (%)
0–159.11 (±0.200) bC10.78 (±0.465) aB8.56 (±0.580) bA
15–3010.78 (±0.983) bBC13.56 (±1.600) aA8.67 (±0.471) cA
30–6011.22 (±1.267) bAB14.11 (±1.611) aA7.89 (±0.790) cA
60–9012.67 (±1.155) bA14.56 (±1.819) aA8.89 (±0.735) cA
Bd (Mg m−3)
0–151.43 (±0.021) bD1.39 (±0.048) bD1.54 (±0.017) aC
15–301.56 (±0.018) aC1.49 (±0.045) bC1.66 (±0.028) aB
30–601.66 (±0.020) aB1.57 (±0.070) bB1.69 (±0.029) aB
60–901.73 (±0.017) aA1.64 (±0.063) bA1.76 (±0.019) aA
WSA > 0.25 mm (%)
0–1557.99 (±0.907) bB70.11 (±0.968) aB52.72 (±0.318) cB
15–3060.57 (±0.750) bA72.06 (±0.649) aA55.42 (±0.462) cA
30–6058.57 (±0.791) bB71.04 (±0.694) Aab52.24 (±0.394) cB
60–9055.66 (±1.171) bC70.45 (±0.852) aAB50.94 (±0.244) cC
MWD (mm)
0–150.53 (±0.006) bA0.58 (±0.012) aAB0.47 (±0.007) cAB
15–300.54 (±0.008) bA0.59 (±0.010) aA0.48 (±0.003) cA
30–600.53 (±0.006) bA0.58 (±0.010) aAB0.46 (±0.006) cBC
60–900.50 (±0.010) bB0.57 (±0.010) aB0.45 (±0.007) cC
LU = Land uses, D = Depths, NS = Not Significant. Values in parenthesis indicate the standard error of means. Dissimilar lowercase letters (row-wise) indicate significant differences with respect to land uses whereas dissimilar uppercase letters (column-wise) indicate significant differences with respect to soil depths (p ≤ 0.05).
Table 4. Soil organic carbon (%), availability of N, P and K (kg ha−1) and micronutrients (Fe, Mn, Zn and Cu) (mg kg−1) are under-studied land uses in south-western Punjab, India.
Depths
(cm)
Land Uses
CroplandsHorticultural LandsUncultivated Lands
SOC (%)
0–150.61 (±0.019) bA0.91 (±0.033) aA0.36 (±0.019) cA
15–300.40 (±0.029) bB0.57 (±0.050) aB0.34 (±0.017) cA
30–600.35 (±0.032) bB0.52 (±0.053) aB0.28 (±0.010) cB
60–900.27 (±0.028) bC0.40 (±0.047) aC0.24 (±0.014) bB
SOM (g kg soil−1)
0–1510.51 (±0.328) bA15.62 (±0.568) aA6.22 (±0.331) cA
15–306.8 (±0.494) bB9.82 (±0.857) aB5.76 (±0.300) bBC
30–606.01 (±0.551) bBC8.92 (±0.910) aBC4.84 (±0.176) bCD
60–904.71 (±0.473) bC6.91 (±0.800) aC4.15 (±0.236) bD
Available N (kg ha−1)
0–1591.99 (±2.957) bA103.14 (±2.788) aA59.93 (±4.196) cA
15–3071.78 (±3.324) bB82.93 (±4.282) aB55.75 (±2.852) cA
30–6065.51 (±3.324) aC64.11 (±3.432) aC49.48 (±3.536) bB
60–9064.81 (±5.913) aC57.14 (±3.833) bD43.90 (±4.435) cB
Available P (kg ha−1)
0–1525.41 (±0.693) aA25.13 (±0.679) aA13.09 (±0.827) bA
15–3018.40 (±0.196) bB20.14 (±1.044) aB10.16 (±0.883) cB
30–6013.36 (±0.733) bC14.67 (±0.949) aC7.48 (±0.522) cC
60–9010.39 (±0.3547) aD9.89 (±0.844) aD5.10 (±0.393) bD
Available K (kg ha−1)
0–15227.11 (±4.288) aA219.02 (±7.074) aA125.07 (±7.974) bA
15–30202.84 (±8.843) aB184.80 (±10.964) bB90.22 (±4.008) cB
30–60164.89 (±17.035) aC140.00 (±12.417) bC79.02 (±4.708) cB
60–90129.42 (±17.422) aD118.22 (±14.917) aD60.98 (±3.668) bC
Available Zn (mg kg soil−1)
0–150.61 (±0.122) bA2.70 (±0.611) aA0.48 (±0.196) bA
15–300.39 (±0.057) bA1.66 (±0.341) aB0.42 (±0.128) bA
30–600.26 (±0.043.) bAB0.77 (±0.188) aC0.30 (±0.077) bA
60–900.23 (±0.042) aB0.45 (±0.104) aC0.20 (±0.050) aA
Available Cu (mg kg soil−1)
0–150.49 (±0.053) bA1.04 (±0.132) aA0.46 (±0.127) bB
15–300.45 (±0.050) bA0.67 (±0.045) aB0.42 (±0.119) bB
30–600.45 (±0.041) aA0.47 (±0.040) aC0.61 (±0.214) aA
60–900.42 (±0.044) aA0.41 (±0.027) aC0.44 (±0.130) aB
Available Fe (mg kg soil−1)
0–153.36 (±0.544) bA6.08 (±0.746) aA1.84 (±0.365) cA
15–303.19 (±0.397) bAB4.96 (±0.994) aB2.57 (±0.359) bA
30–602.40 (±0.260) aBC2.50 (±0.548) aC2.19 (±0.410) aA
60–902.22 (±0.278) aC2.00 (±0.484) aC2.09 (±0.405) aA
Available Mn (mg kg soil−1)
0–153.67 (±0.365) bAB7.31 (±1.286) aA3.10 (±0.775) bB
15–304.61 (±0.755) bA5.89 (±0.503) aB2.99 (±0.722) cB
30–603.60 (±0.579) aAB4.25 (±0.829) aC4.32 (±1.048) aA
60–903.34 (±0.484) aB3.41 (±0.639) aC2.26 (±0.332) bB
LU = Land uses, D = Depths, NS = Not Significant. Values in parenthesis indicate the standard error of means. Response: Dissimilar lowercase letters (row-wise) indicate significant differences with respect to land uses whereas dissimilar uppercase letters (column-wise) indicate significant differences with respect to soil depths (p ≤ 0.05).
Table 5. Weighted means of soil physicochemical properties and nutrient status under different land uses (data pooled for soil depths) in south-western Punjab, India.
Soil Properties Land Uses
CroplandsHorticultural LandsUncultivated Lands
pH7.99 (±0.034) a7.77 (±0.039) a8.02 (±0.121) a
EC0.37 (±0.015) a0.31 (±0.020) a0.39 (±0.042) a
Sand (%) 73.54 (±0.420) b67.54 (±1.714) c77.48 (±0.881) a
Silt (%) 15.19 (±0.718) b18.85 (±0.356) a14.06 (±1.420) b
Clay (%) 11.28 (±0.902) ab13.61 (±1.438) a8.46 (±0.596) b
Bd (Mg m−3) 1.63 (±0.016) ab1.55 (±0.054) b1.69 (±0.021) a
WSA > 0.25 mm (%) 57.84 (±0.905) b70.86 (±0.768) a52.42 (±0.297) c
MWD (mm) 0.52 (±0.007) b0.58 (±0.010) a0.46 (±0.006) c
SOC (%) 0.38 (±0.234) b0.55 (±0.432) a0.29 (±0.108) c
SOM (g kg soil−1) 6.46 (±0.402) b9.52 (0.744) a4.99 (±0.187) b
Available N (kg ha−1) 70.73 (±3.667) a71.43 (±2.265) a50.41 (±3.240) b
Available P (kg ha−1) 15.22 (±0.447) a15.73 (±0.831) a8.07 (±0.573) b
Available K (kg ha−1) 169.76 (±13.577) a153.38 (±11.778) a82.55 (±4.455) b
Available Zn (mg kg soil−1) 0.33 (±0.031) b1.13 (±0.178) a0.32 (±0.095) b
Available Cu (mg kg soil−1) 0.45 (±0.042) a0.58 (±0.030) a0.50 (±0.154) a
Available Fe (mg kg soil−1) 2.63 (±0.281) a3.34 (±0.518) a2.16 (±0.376) a
Available Mn (mg kg soil−1) 3.69 (±0.505) a4.75 (±0.710) a3.21 (±0.503) a
LU = Land uses, D = Depths, NS = Not Significant. Values in parenthesis indicate the standard error of means. Dissimilar lower cases letter indicate significant differences at p ≤ 0.05 concerning land uses.
Publisher’s Note: MDPI stays neutral with regard to jurisdictional claims in published maps and institutional affiliations.

