Article

Assessing Intraspecific Variability and Diversity in African Yam Bean Landraces Using Agronomic Traits

by
Oluwaseyi E. Olomitutu
1,2,
Ayodeji Abe
1,
Olaniyi A. Oyatomi
2,
Rajneesh Paliwal
2 and
Michael T. Abberton
2,*
1
Department of Agronomy, University of Ibadan, Oduduwa Road, Ibadan 200132, Nigeria
2
Genetic Resources Center, International Institute of Tropical Agriculture, Oyo Road, Ibadan 200001, Nigeria
*
Author to whom correspondence should be addressed.
Agronomy 2022, 12(4), 884; https://doi.org/10.3390/agronomy12040884
Submission received: 7 March 2022 / Revised: 30 March 2022 / Accepted: 31 March 2022 / Published: 6 April 2022

Abstract

:
Landraces are repositories for potential beneficial traits which could be used to develop varieties with enhanced qualities. Optimal utilization of the available large collection of landraces of African yam bean (AYB) presently conserved at the Genetic Resource Center, International Institute of Tropical Agriculture, Ibadan (GRC-IITA), requires an assessment of the magnitude and nature of genetic diversity within the germplasm. One hundred and ninety-six AYB accessions were evaluated during the 2018 and 2019 cropping seasons in three agro-ecologies of Nigeria, using a 14 × 14 triple lattice design. The accessions were assessed for fourteen agronomic traits. Accession, environment, and accession × environment interaction effects were significant (p < 0.05) for all the traits. Variances due to environment and accession × environment interaction were higher than the genotypic variances. Similarly, estimates of phenotypic coefficient of variation (PCV) were higher than genotypic coefficient of variation (GCV) for all traits. Broad-sense heritability ranged from 17.1% (days to maturity) to 66.4% (seed length). Seed yield per plant had positive significant genotypic correlation with all the studied traits, except pod length and seed length. The first three principal components accounted for 59.7% of the total variation among the accessions and comprised of the 14 traits. Five major clusters were delineated based on phenotypic characteristics. Genetic variation was present among the AYB accessions, and these results will be useful for setting breeding goals and conservation approaches.

1. Introduction

In order to promote food security, plant breeders have continued to intensify the search for improved crop productivity in their crop breeding programmes [1]. However, much emphasis is placed on the major staple crops in Africa, neglecting indigenous underutilized leguminous crops such as African yam bean (Sphenostyli stenocarpa (Hochst ex. A. Rich) Harms), Bambara groundnut (Vigna subterranea (L) Verdc) and Kersting’s groundnut (Macrotyloma geocarpum (Harms) Marechal and Baudet) [2].
African yam bean (AYB) is a tuberous underutilized legume grown in sub-Saharan Africa (SSA). Its tubers and seeds are of higher protein content than most tuberous and leguminous crops [3]. It has considerable nitrogen-fixing ability [4], less susceptible to most field and storage pests of leguminous crops [5], and is rich in medicinal properties [6]. The acceptability of AYB is, however, limited by constraints such as low seed yield [7], the need for stakes, long maturation period and photoperiodic sensitivity [8], as well as its high content of anti-nutritional factors and long cooking time [9].
The Genetic Resource Center of the International Institute of Tropical Agriculture (GRC-IITA), Ibadan, holds over 450 accessions of AYB landraces, most of which were collected from different parts of Nigeria [10]. These accessions are bound to vary in phenotypic characteristics. In order to use, maintain and conserve optimally, these collections must be characterized. Previous studies [2,11,12,13,14,15,16] have characterized some of the available collections of AYB using morphological traits in few environments. These studies have reported phenotypic differences among the AYB germplasm investigated. In addition, some studies have deployed the use of molecular technologies to unravel intra-specific diversity within the AYB germplasm. Notably among these are [17] using random amplified polymorphic DNA (RAPD), [18,19] using amplified fragment length polymorphism (AFLP), and [20] using simple sequence repeat (SSR) markers. In each case, high genetic diversity was reported among the accessions studied. However, the studies on the phenotypic characterizations of these accessions complementing the reports based on molecular data were conducted on relatively few accessions and in few environments. Evaluating a larger proportion of the collections in diverse environments will avail the breeder more information on the phenotypic variability within the AYB landraces and help underpin improvement strategies that could be adopted for important agronomic traits.
Phenotypic characterization is an important step in germplasm identification and classification. The approach is inexpensive, reliable, and a relatively easy method of identifying discriminating characters among accessions. When conducted in a diverse set of environments, phenotypic characterization could provide reliable information for germplasm utilization. Information of the extent of genetic diversity can be used to identify a novel source of alleles that can be exploited to improve elite varieties through direct selection on multiple aspects of plant development [21]. Estimates of heritability, variance components, and other indices of variability help to unravel the response to selection, magnitude of variation among the landraces, and the type of gene action governing important traits for breeding [22]. Furthermore, knowledge of correlation among important traits is very useful in indirect selection [23,24]. In this study, 196 AYB accessions were evaluated across three agro-ecologies in Nigeria using quantitative phenotypic characters with a view to (i) estimate the nature and magnitude of genetic variability, heritability and relationships among traits, and (ii) identify gene pools (clusters) within the population.

2. Materials and Methods

2.1. Germplasm, Research Sites and Experimental Design

A total of 196 accessions of AYB, comprising 91 from Nigeria, 2 from Bangladesh, 1 from Ghana, and 102 of unknown origin, were sourced from existing collections of landraces at GRC-IITA and used for this study (Supplementary Table S1). Field experiments were carried out during the 2018 and 2019 cropping seasons at three IITA research stations in Nigeria, namely Ibadan in the derived savanna, Ubiaja in the humid forest, and Kano in the Sudan savanna. Prior to planting at each site, soils samples were randomly collected to 30 cm depth using a soil auger for physical and chemical analyses (Table 1). Data were also collected on selected weather indices at each location during the cropping seasons (Table 2).
Experimental design was a 14 × 14 lattice replicated three times. Plots consisted of single 4 m long ridges spaced 0.75 m apart. Seeds were treated with Macozeb 80% wettable powder (WP), and planted 0.5 m apart on the ridges. One seed was sown per hill to give a population density of 26,666 plants/ha. Plants were staked three weeks after planting. Triple superphosphate fertilizer was applied at the rate of 50 kg P/ha three weeks after seedling emergence. Fortnightly, Cypermethrin 30 g/L + Dimethoate 250 g/L EC and Macozeb 80% WP were applied at the rate of 200 mL and 200 g per 20 L of water, respectively, from the inception of flowering to harvest maturity, to control floral and pod pests, and fungal diseases. Manual weeding was carried out as necessary to keep the field clean.

2.2. Data Collection

Data were recorded on a plot basis using IITA descriptors for AYB [25] on days to flowering, days to maturity, grain filling period, number of pods per plant, pod weight per plant (g), pod length (cm), number of locules per pod, number of seeds per pod, shelling percentage, 100-seed weight (g), seed yield per plant (g), seed length (mm), seed width (mm), and seed thickness (mm)

2.3. Data Analysis

To test the existence of significant variation among the accessions, environment, and accessions × environment for measured traits, a combined analysis of variance (ANOVA) was performed using the mixed model approach. Each location–year combination was regarded as separate environments. Environments were considered fixed effects, whereas accessions, replications within environments, and blocks within replication and environments were regarded as random effects. Count data were log-transformed, while square root transformation was used for data in percentages before subjecting them to ANOVA to reduce the heterogeneity of variances. Mixed-model analysis with the restricted maximum likelihood procedure [26] was used to estimate variance components. Phenotypic variance and broad-sense heritability were then computed as:
Phenotypic   variance   ( σ P 2 ) = σ g 2 + σ ge 2 nlocs + σ e 2 ( nlocs × nreps )
Broad-sense   heritability   ( H 2 ) = σ g 2 σ P 2
where σ g 2 , σ ge 2 , σ e 2 , nreps and nlocs are the genotype variance, genotype × environment interaction variance, error variance, number of replicates and number of locations, respectively. The heritability estimates were categorized as low (0–30%), moderate (30–60%) and high (>60%) [27].
Phenotypic coefficient of variation (PCV) and genotypic coefficient of variation (GCV) were computed for all the traits according to [28], using the equations:
Phenotypic   coefficient   of   variation   ( PCV ) = phenotypic   variance Grand   mean   ×   100
Genotypic   coefficient   of   variation   ( GCV ) = genotypic   variance Grand   mean   ×   100
The PCV and GCV values were classified according to [29] as: low (0 to 10%), moderate (10 to 20%) and high (>20%).
Phenotypic (rp) and genotypic (rg) correlation coefficients were estimated using META-R (Multi Environment Trail Analysis with R for Windows) version 6.04 [30]. To obtain information on traits most effective in discriminating among accessions, principal component analysis (PCA) was carried out. Principal components (PCs) with eigenvalues ≥ 1.0 were retained. A PCA biplot analysis of the first two PCs was run to explain the relationships between the PCs and the variables. Cluster analysis with constellation plot and pairwise Mahalanobis genetic distances between clusters was performed on standardized means using the Ward minimum variance method [31]. The JMP Pro 14.1.0 [26] was used for both the PCA and cluster analyses.

3. Results

3.1. Soil and Climatic Conditions under Field Evaluation

Across all environments, the soil textural class varied. The soil available phosphorus, total nitrogen and organic carbon were generally low. The pH (H2O) of the soil was moderately acidic in the 2018 season in Ibadan (EI) and neutral in the 2019 season (E2); both seasons in Ubiaja (E5 and E6) and the 2019 season in Kano (E4) were strongly acidic, while the soil of the 2018 season in Kano (E3) was moderately acidic (Table 1).
The weather conditions (rainfall, solar radiation, temperature and relative humidity) varied across environments. The mean amount of rainfall was highest in the E6 cropping season and lowest in E3 followed by E4. The mean maximum temperature was highest in the E1 and lowest in the E6 cropping season. The relative humidity was highest in the E6 cropping season, but lowest in E4 (Table 2).

3.2. Variability among Accessions

There were significant differences among the accessions for all traits measured. Effects of environments and accession × environment interaction were also significant for all traits. Experimental coefficient of variations (CV) for all the traits were generally low (<21%), except pod weight per plant (PWPPL) and seed yield per plant (SYPPL) with CV of 56.4% and 64.6%, respectively (Table 3). The days to flowering (D50F) ranged from 83.9 (TSs-90) to 101.4 (TSs-153), days to maturity (DPM) from 139.9 (89A) to 163.0 (TSs-19), and grain filling period (GFP) from 52.6 (TSs-13) to 76.5 (TSs-61). The mean SYPPL was 15.2 g and ranged from 7.3 (TSs-309) to 31.6 (TSs-421). The PWPPL ranged from 17.7 g (TSs-309) to 56.9 (TSs-195), while 100-seed weight (HSW) ranged from 16.2 (TSs-368) to 25.1 (TSs-151A). The lowest number of pods per plant (NPPPL) was produced by TSs-217 (4.1), while TSs-162 (16.3) had the highest. The number of seeds per pod (NSPPD) and number of locules per pod (NLPPD) were lowest in TSs-6 (9.3, 10.1) and highest in TSs-96 (15.5, 14.5, respectively). Accessions TSs-1 (18.0 cm) and TSs-297 (23.4 cm) had the shortest and longest pods, respectively. The shelling percentage (SP) ranged from 32.4% (TSs-31) to 58.7% (TSs-46) (Supplementary Table S1).
For all traits, the estimates of genotypic variance were lower than those of environmental variance and the variance due to accession × environment interaction. The phenotypic coefficients of variation (PCV) were higher than the genotypic coefficients of variation (GCV) for all the traits (Table 4). The PCV and GCV were generally low. The PCV ranged from 2.5% for DPM to 24.3% for SYPPL, while the GCV ranged from 1.0% for DPM to 11.3% for SYPPL. Low to high broad-sense heritability estimates were obtained for the studied traits. Only seed length (SL) (66.4%) had high heritability. Moderate heritability estimates were obtained for seed thickness (ST), HSW, seed width (SW), D50F, pod length (PDL) and NSPPD. All the other traits exhibited low heritability estimates, with shelling percentage recording the least (16.8%).

3.3. Relationships among Traits

The extents of association between paired traits of AYB landraces evaluated across the six environments is presented in Table 5. In nearly all cases, genotypic correlation coefficients were higher than those of their corresponding phenotypic values. Positive significant genotypic associations were recorded between SYPPL and all traits, except PDL and SL. Significant negative genotypic association was recorded between SYPPL and PDL. Except for D50F, GFP, PDL and SL, all the other traits manifested significant positive phenotypic correlations with SYPPL. The phenotypic and genotypic associations of D50F with DPM were positive and significant (rp = 0.21 **; rg = 0.35 **); however, its associations with GFP, though significant, were negative (rp = −0.42 **; rg = −0.61 **). One hundred seed weight had significant positive phenotypic and genotypic relationships with the three seed metric traits (SL, ST and SW). The seed metric traits had significant positive relationships with one another both at the genotypic and phenotypic levels.

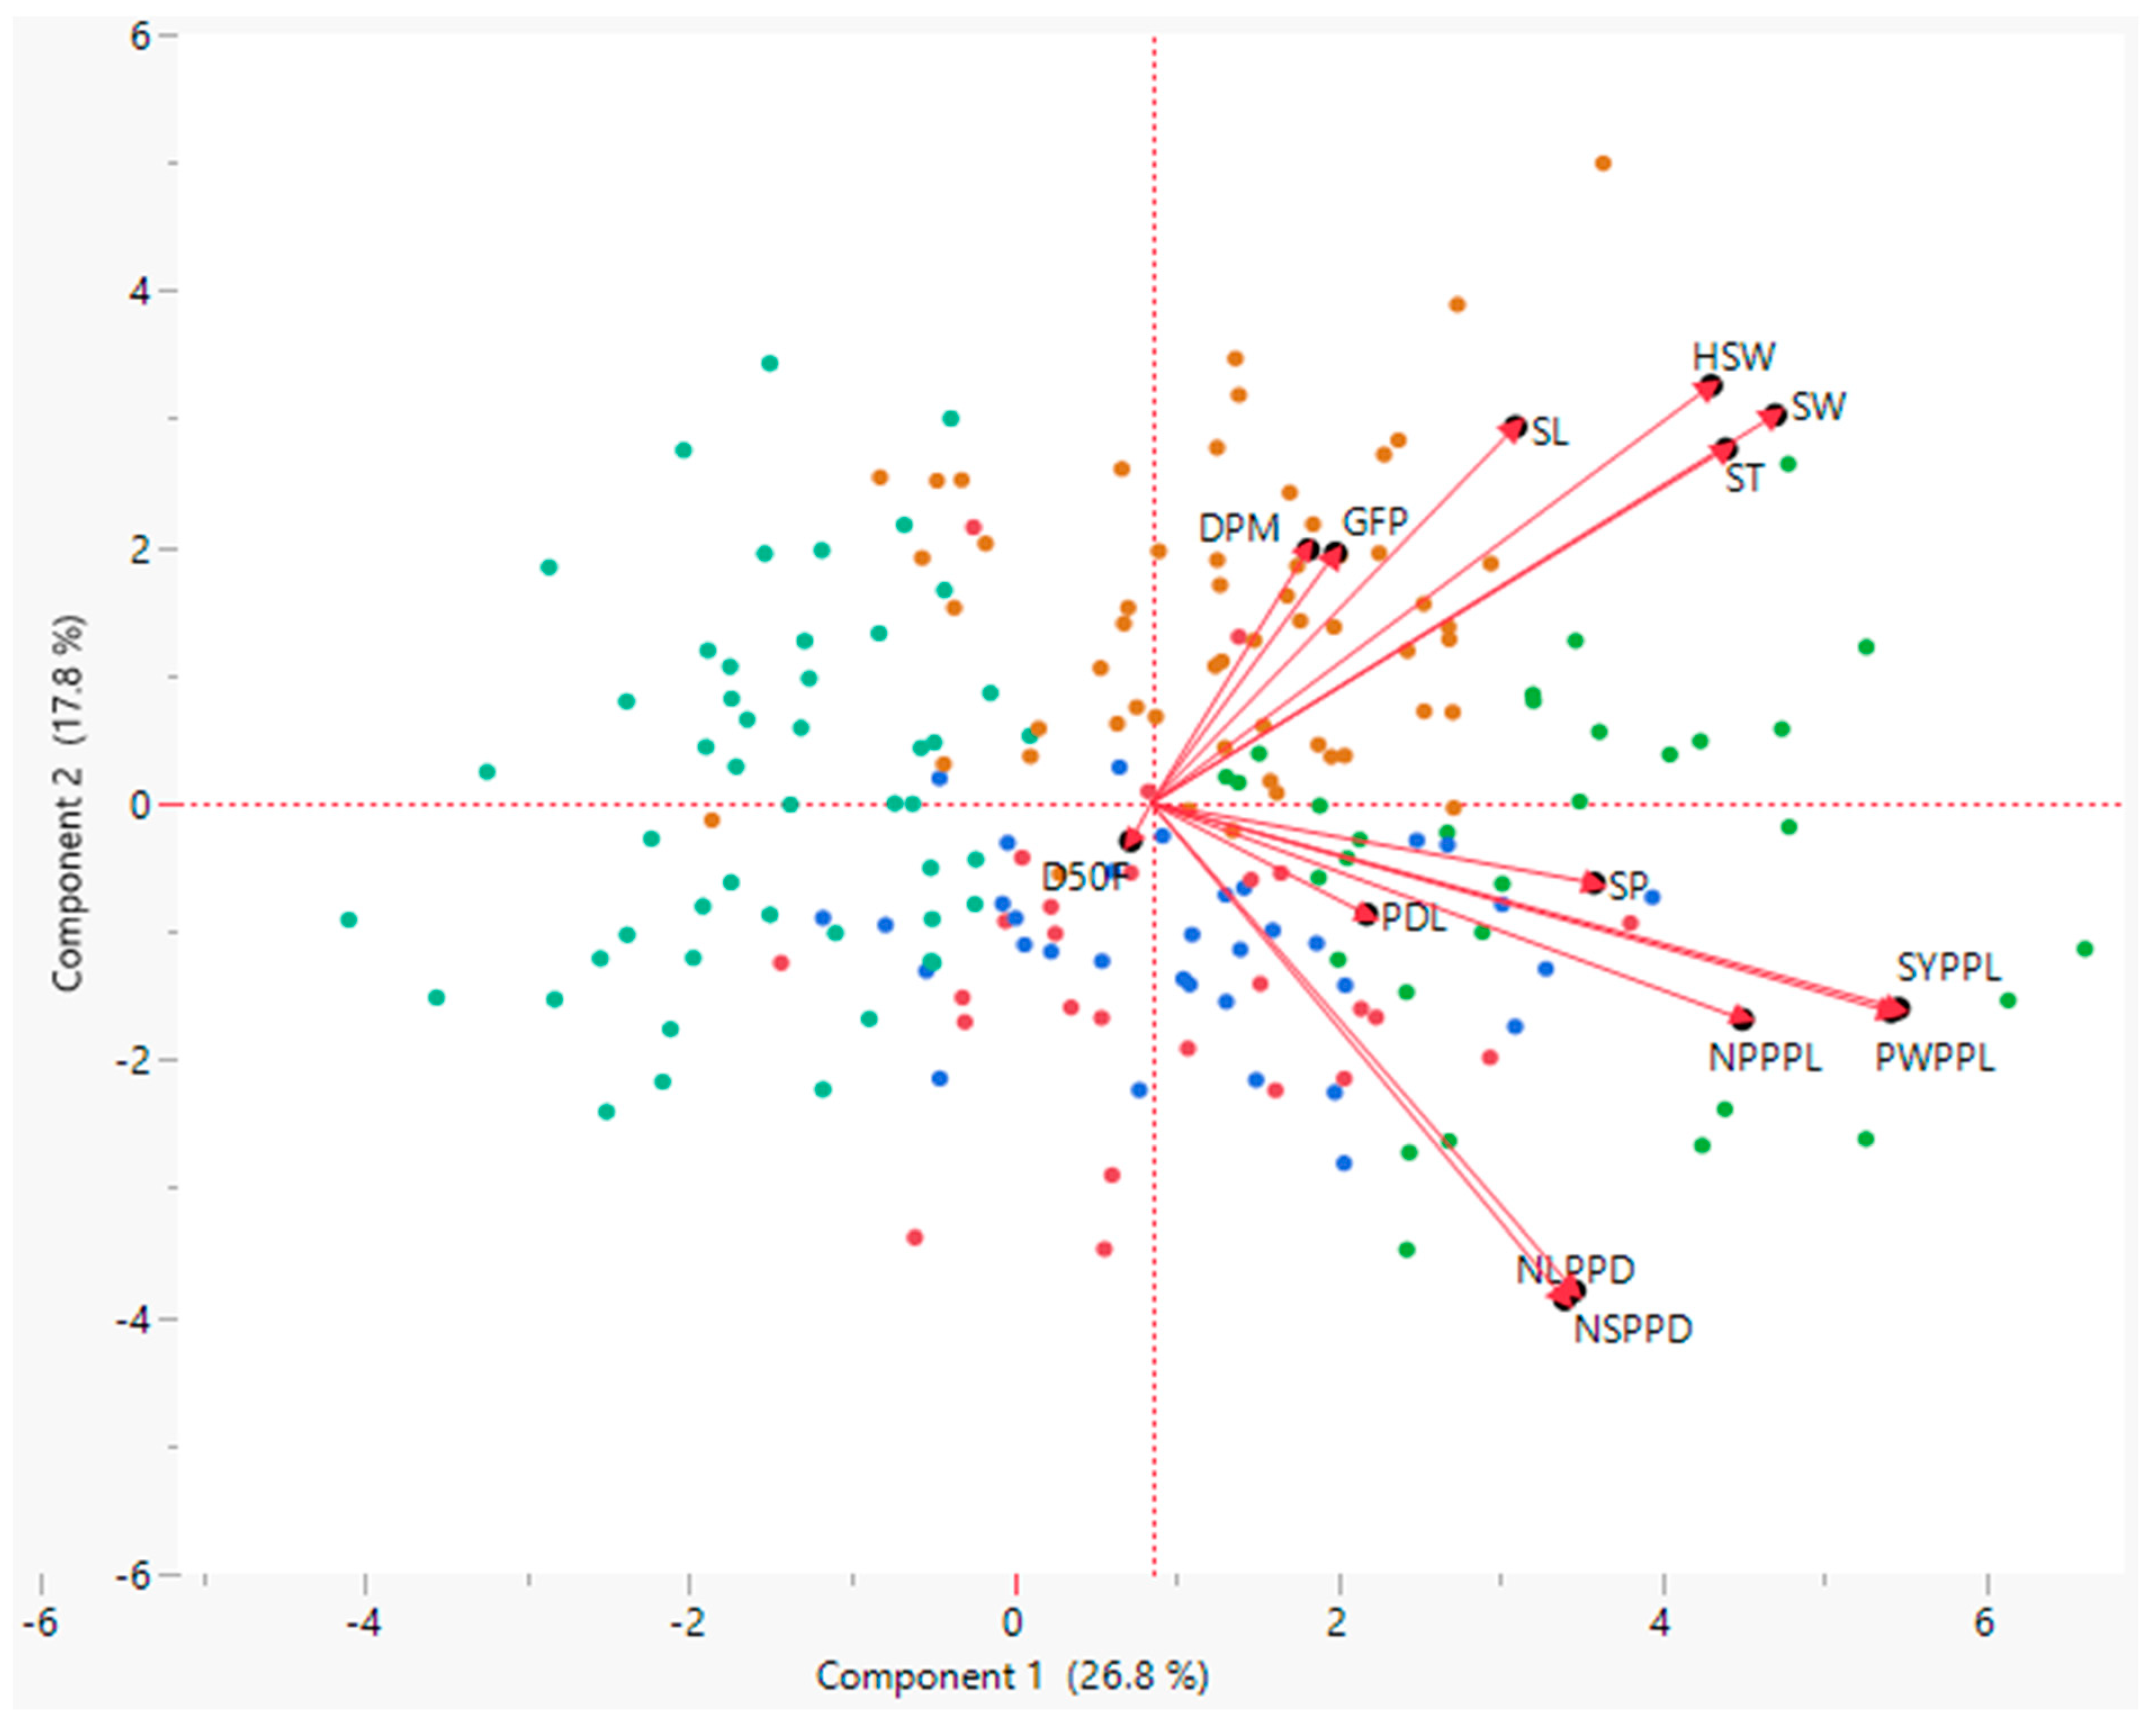
3.4. Principal Component Analysis (PCA)

The first six principal components (PCs) accounted for 86.6% of the total variation among the accessions (Table 6). The first and second PCs cumulatively explained about 44.6% of the variation among the accessions. The first PC, which explained 26.8% of the total variation, was positively discriminated by NPPPL, PWPPL, SP, NLPPD, NSPPD, HSW, SYPPL, SL, SW and ST. The second PC, which accounted for 17.77% of the total variance, was positively associated with GFP, DPM, HSW, SL, SW and ST, but negatively associated with NSPPD and NLPPD. The major positive contributors to the third PC, which explained 15.15% of the total variation, were D50F, PDL, NSPPD, NLPPD, HSW, SL and SW, while DPM, GFP, NPPPL, and PWPPL contributed negatively. The fourth, fifth and sixth PCs accounted for 10.43%, 8.79% and 7.72% of the total variation among the accessions, respectively.
A PCA biplot of the first and second PCs revealed that, with the exception of D50F, all the other traits had positive contributions to the first PC. On the second PC, DPM, GFP, HSW, SL, SW and SL made positive contributions, while the contributions of D50F, NLPPD, NSPPD, PDL, NPPL, PWPPL, SYPPL and SP were negative. Based on vector lengths, D50F and PDL had relatively low contributions to both PCs (Figure 1).

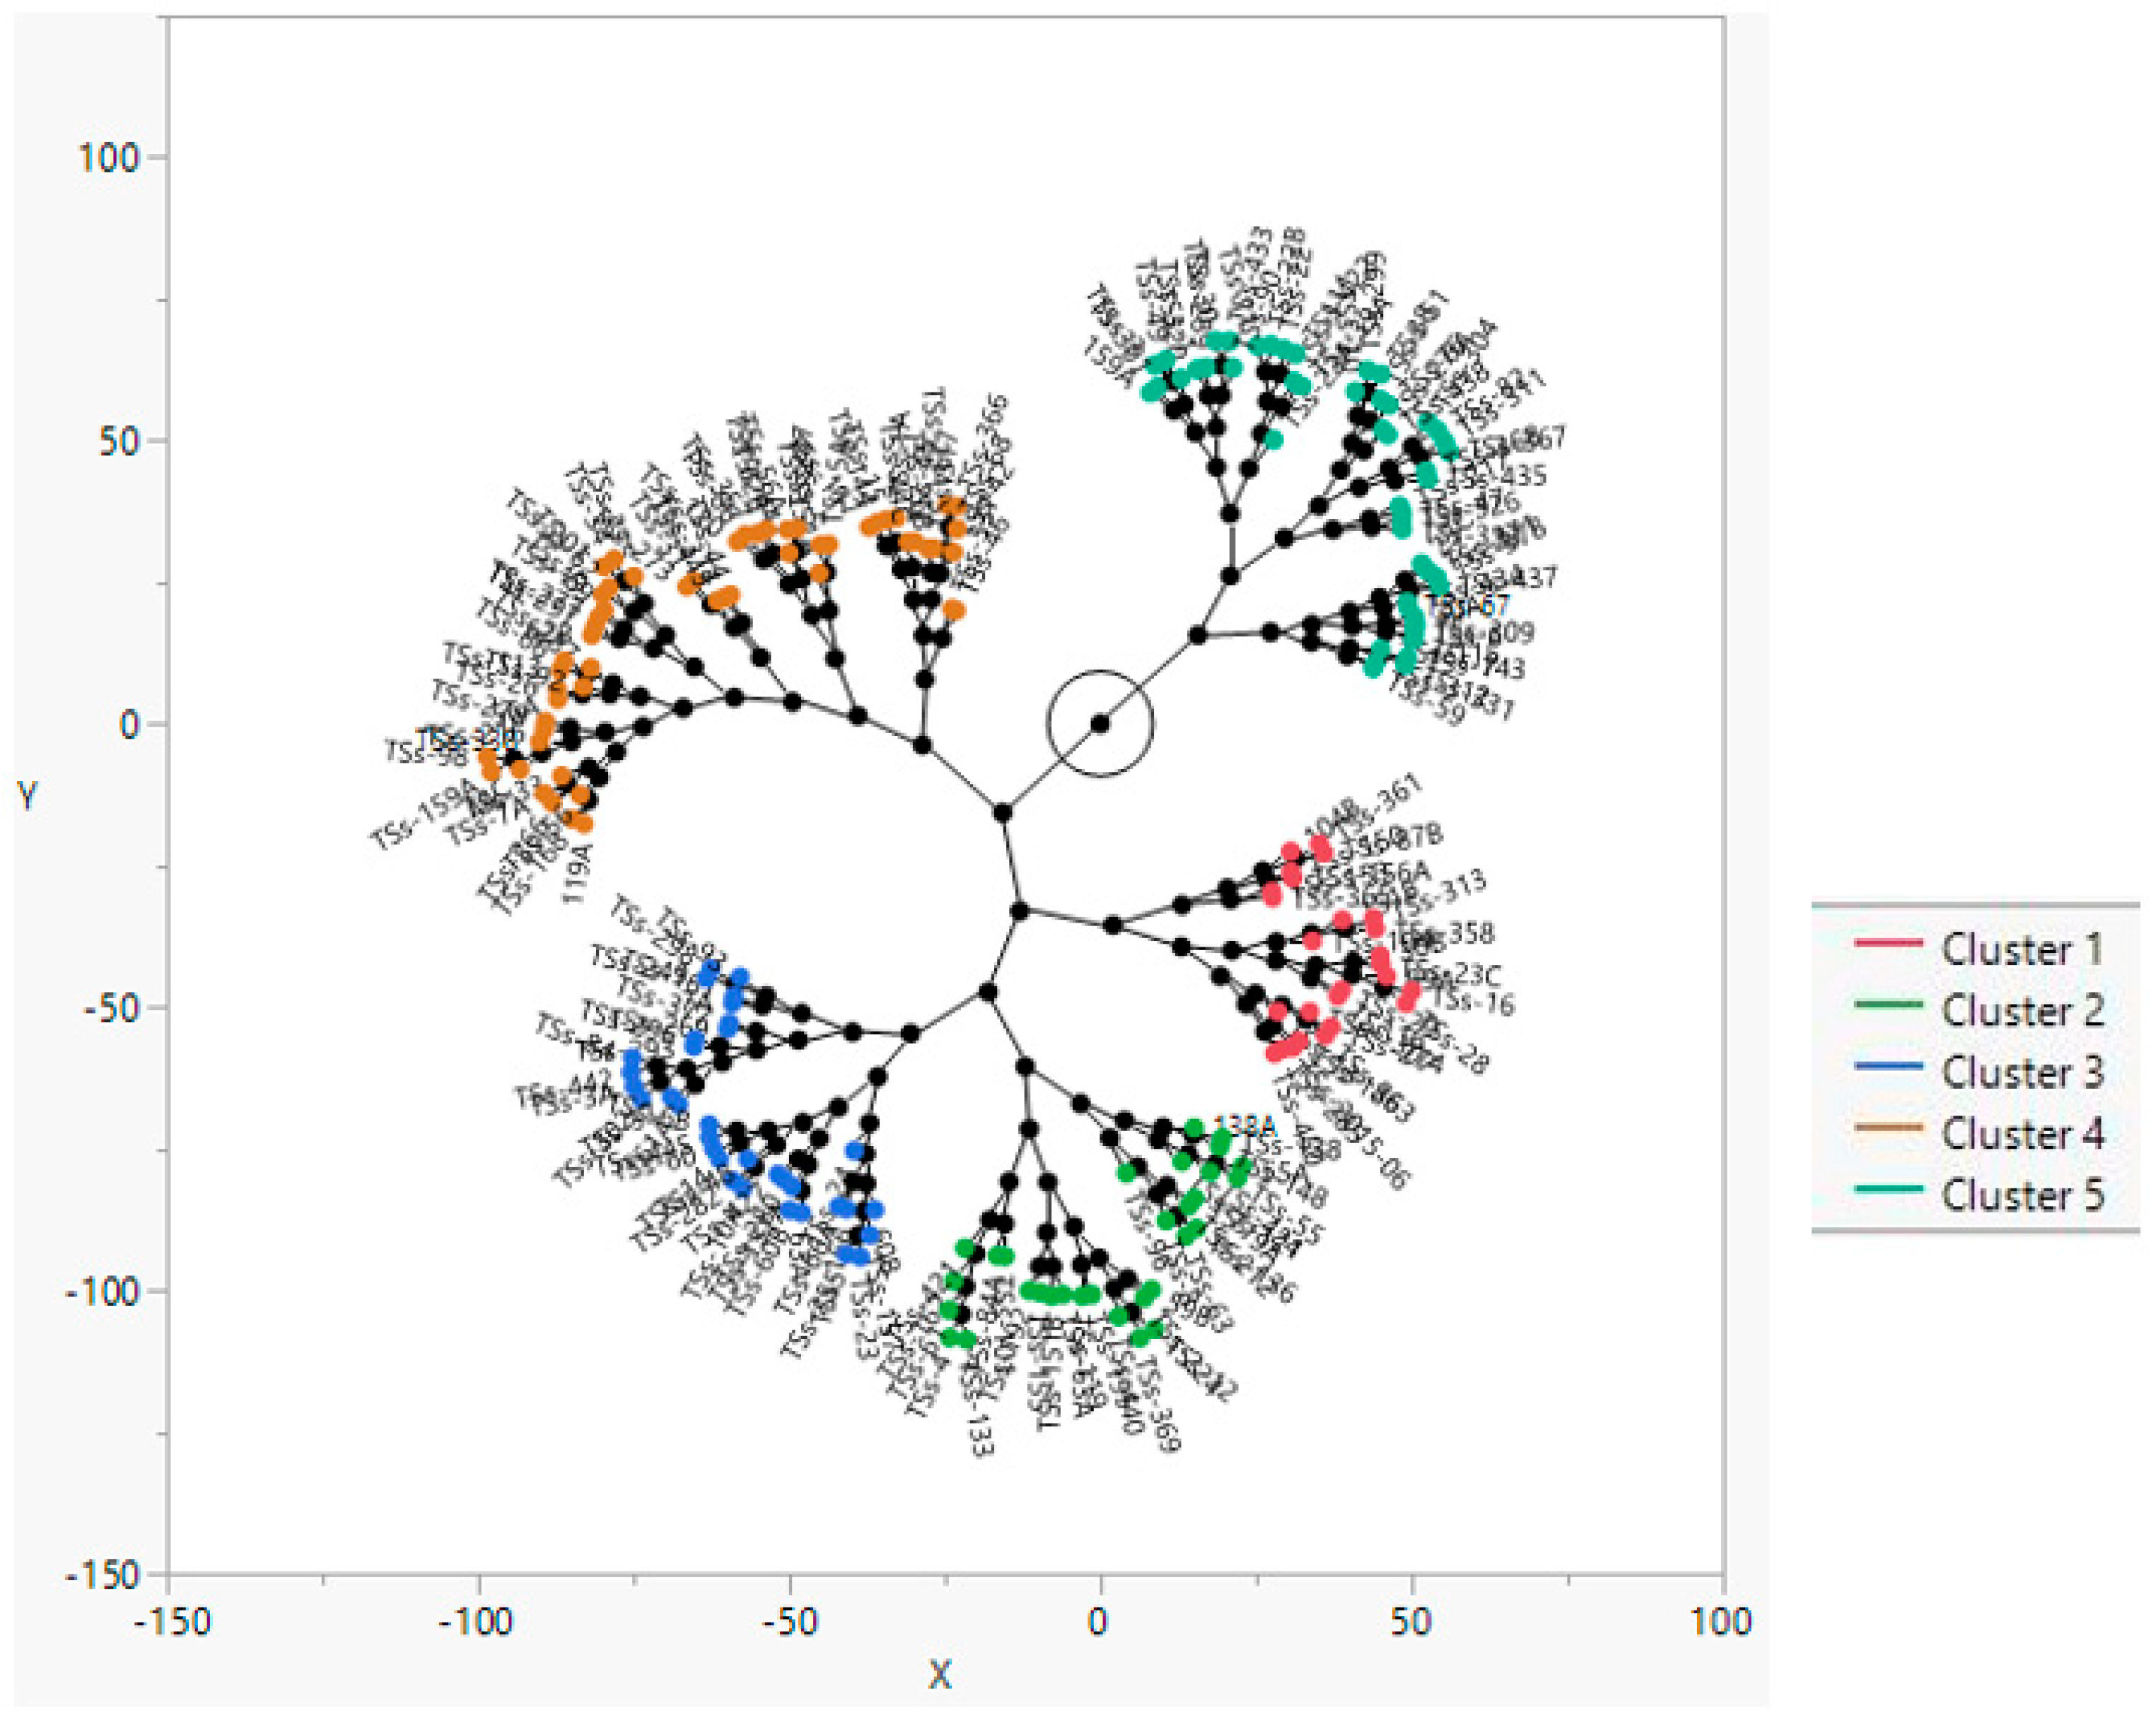
3.5. Cluster Analysis

The cluster history with 195 morphotypes is presented in (Supplementary Table S2). The dissimilarity among the accessions spanned a distance of between 0.92 and 19.29. Accessions TSs-366 and TSs-294 were the most similar (with the least distance of 0.92). The 196 accessions were grouped into five main phenotypically-related clusters, with each cluster further divided into sub-groups (Figure 2). The number of accessions in each cluster were 26 (13.3% in Cluster I), 31 (15.8% in cluster II), 34 (17.4% in cluster III), 54 (28.6% in cluster IV) and 49 (25.0% in cluster V) (Supplementary Table S3). Cluster I comprised of accessions that were early maturing, with short grain filling period, high shelling percentage, long pods, and high number of seeds and locules per pod. Cluster II consisted of accessions with early flowering, high number of pods per plant, heavy pods and seed weight, high seed yield, width and thickness. Accessions in cluster III had the longest grain filling period. Cluster IV comprised of accessions that were late maturing with long seeds and high seed thickness, while accessions in cluster V had a low number of pods per plant, pod weight, shelling percentage, locus and seeds per pod, hundred seeds weight, seed yield, short pods, and small seed size.

4. Discussion

Quantitative phenotypic traits were used to investigate the extent of genetic variability among 196 accessions of African yam bean and identify gene pools among them. The variation in soil-fertility levels and agro-climatic conditions during the periods of evaluation provided opportunity to assess the effects of environmental differences on the accessions. The significant differences observed among the accessions for all traits was an indication of the genetically diverse nature of the germplasm and suggested that good progress can be made in the improvement of desired traits. Previous studies using fewer number of accessions [2,14,15,16,32,33,34,35,36] had reported substantial variability for different traits in African yam bean. The significance of environment and accession × environment interaction effects for all traits indicated that the performance of accessions were influenced by environment, and the relative rank in performance of accessions varied with the different environments. This finding implied that selections are made for the different environments. This is in agreement with the results reported by [2,32,36]. The generally low experimental CV buttresses the good level of precision achieved in the study. Low experimental CVs have been shown to be suggestive of improved level of reliability and precision [37].
The greater magnitudes of PCV, environmental variance and the variance due to accession × environment interaction compared to the GCV and genotypic variance suggested higher environmental influence in the expression of all traits. Similar results have been reported by [32,35,38,39] in their studies of AYB variability. The high PCV and moderate GCV observed for both SYPPL and NPPPL indicated the presence of considerable variation for these traits among the AYB accessions studied, and thus provides opportunity for improvement through effective selection. High degree of GVC gives rise to varying offspring in the segregating generation [40]. The low GCV and PCV found for D50F, DPM, GFP, SP, PDL, NSPPD, NLPPD, HSW, SL, ST and ST suggests low variability among the accessions for these traits; [32,35,38,39] had previously reported low variability for these traits in AYB landraces.
The moderate to high broad-sense heritability estimates observed for some traits implied the possibility of effective selection for genetic improvement of these traits. The heritability estimates are in agreement with the results reported for seed metric traits [33], HSW and NSPPD [38,39], as well as D50F and PDL [41]. Low broad-sense heritability values observed for SYPPL, DPM, GFP, NPPPL, PWPPL, SP and NLPPD indicated the large influence of environment on these traits, which could limit progress from selection. To increase the efficiency of selection for traits with low heritability estimates, [38] suggested the use of genetic correlation between traits as a tool in selecting progenies with desirable attributes in crop improvement programmes.
In this study, genotypic correlation coefficient was higher than the corresponding phenotypic correlation coefficient for nearly all traits, indicating the inherent nature of the association among the traits. The positive and significant genotypic correlation between SYPPL on the one hand, and D50F, DPM, GFP, NPPPL, SP, PWPPL, NLPPD, NSPPD, HSW, SW and ST on the other, showed that the traits can be considered in an index for indirect selection to improve seed yield in AYB. These results are consistent with the findings of previous authors on the relationship between SYPPL and NPPPL [15], SYPPL and HSW [38], as well as SYPPL on the one hand and GFP and NSPPD [2] in AYB. Similarly, the significant negative genotypic correlation between SYPPL and PDL is in agreement with the findings of [42], that longer pods may not necessarily translate to high seed yield in AYB. The positive and significant associations among the yield-related traits indicated the possibility to simultaneously improve the traits.
In morphological characterization studies of germplasm, data is often collected on a large number of variables, some of which could be inadequate in discriminating the germplasm evaluated. As such, PCA was used to reveal patterns and eliminate redundancy in data sets [43]. In this study, all fourteen traits significantly contributed to the first three PCs, which explained more than half of the variation. Traits associated with the first three PCs are more useful in differentiating the germplasms [43,44]. Therefore, consideration should be given to such traits for genetic improvement. The PCA biplot of the first and second PCs further explained the relationship between traits and PCs, and also among traits. The tight angles between vectors illustrate close relationships among traits. The spread of the accessions across the four quadrants on account of the fourteen agronomic characteristics suggest wide diversity. This was also confirmed by the constellation plot. Cluster analysis classify accessions into separate groups based on their similarity for one or more morphological traits, such that heterosis can be exploited through hybridization of accessions belonging to different groups [38]. A cross between members of clusters I and II could lead to the development of hybrids characterized by earliness, better phenological appeal and high seed yield. In addition, hybridization between members of cluster V and any of clusters I and II could be useful for bi-parental study of genetic control of variation in seed of yield and yield-related traits in AYB.

5. Conclusions

To date, attempts to study the magnitude of genetic variability in the AYB germplasm collection at GRC-IITA have been limited to few accessions and environments. This study, which included 196 accessions of AYB evaluated across three locations in two years, validates all previous claims of the existence of ample genetic variability in the germplasm collection held at GRC-IITA, Ibadan, Nigeria. All traits studied significantly differentiated the AYB accessions used in this study. There was high influence of environment in the expression some traits. The positive and significant associations among agronomic traits indicated the possibility of simultaneous improvement of the traits. Accessions characterized by earliness, better phenological appeal and high seed yield were identified as potential sources of gene diversity for developing desirable varieties. Clusters, useful in bi-parental studies of quantitative trait loci (QTL) underlining genetic variation in seed yield and yield-related traits, were also identified. Altogether, the results of this study established the existence of variability among the AYB landraces using agronomic traits. We suggest that further studies aimed at exploring the genetic basis of the observed phenotypic differences in these accessions using high throughput molecular platforms should be encouraged.

Supplementary Materials

The following supporting information can be downloaded at: https://www.mdpi.com/article/10.3390/agronomy12040884/s1, Supplementary Table S1: Summary statistics of the 196 accessions of African yam bean evaluated during the 2018 and 2019 cropping seasons in three agro-ecologies of Nigeria. Supplementary Table S2: Cluster History of 196 African yam bean accessions by Ward minimum variance technique. Supplementary Table S3: Cluster means and standard deviation of 196 accessions of African yam bean evaluated during the 2018 and 2019 cropping seasons at three agro-ecologies of Nigeria based on 14 agronomic traits.

Author Contributions

Conceptualization, M.T.A. and O.E.O.; Funding acquisition, M.T.A.; Investigation, O.E.O.; Methodology, O.E.O., A.A., R.P. and O.A.O.; Data curation, O.E.O.; Formal analysis, O.E.O.; Project administration, M.T.A. and O.A.O.; Supervision, M.T.A., A.A., O.A.O. and R.P.; Writing—original draft, O.E.O.; Writing—review and editing, A.A. and M.T.A. All authors have read and agreed to the published version of the manuscript.

Funding

This study is funded by the Crop trust through GRC-IITA.

Acknowledgments

The authors express gratitude to members of staff of the seed bank of the GRC-IITA, Ibadan, the cassava breeding unit, IITA, Ubiaja, and the cowpea breeding unit, IITA, Kano, for field assistance.

Conflicts of Interest

The authors declare no conflict of interest.

References

  1. Xu, X.; Sharma, R.; Tondelli, A.; Russell, J.; Comadran, J.; Schnaithmann, F.; Pillen, K.; Kilian, B.; Cattivelli, L.; Thomas, W.T.B.; et al. Genome-Wide association analysis of grain yield-associated traits in a pan-European barley cultivar collection. Plant Genome 2018, 11, 170073. [Google Scholar] [CrossRef] [PubMed]
  2. Aremu, C.O.; Ojuederie, O.B.; Ayo-Vaughan, F.; Dahunsi, O.; Adekiya, A.O.; Olayanju, A.; Adebiyi, O.T.; Sunday, I.; Inegbedion, H.; Asaleye, A.J.; et al. Morphometric analysis and characterization of the nutritional quality in African yam bean accessions. Plant Physiol. Rep. 2019, 24, 446–459. [Google Scholar] [CrossRef]
  3. Okigbo, B.N. Introducing the yam bean: Stenostylis stenocarpa (Hochst ex A. Rich) harms. Proc. First IITA Grain 1973, 7, 224–237. [Google Scholar]
  4. Oganale, D. Nodulation and nitrogen fixation of African yam beam (Sphenostylis stenocarpa). In Proceedings of the African Crop Science Society Conference, Science and Technology Supporting Food Security in Africa, Cape Town, Africa, 28 September–1 October 2009. [Google Scholar]
  5. Omitogun, O.G.; Jackai, L.E.N.; Thottappilly, G. Isolation of insecticidal lectin-enrich extracts from African yam bean (Sphenostylis stenocarpa) and other legume species. Entomol. Exp. Appl. 1991, 90, 301–311. [Google Scholar] [CrossRef]
  6. Potter, D. Economic botany of Sphenostylis (Leguminosae). Econ. Bot. 1992, 46, 262–275. [Google Scholar] [CrossRef]
  7. Saka, J.O.; Ajibade, S.R.; Adeniyan, O.N.; Olowoyo, R.B.; Ogunbodede, B.A. Survey of underutilized grain Legume production systems in the Southwest Agricultural zone of Nigeria. J. Agric. Food Inf. 2004, 6, 93–107. [Google Scholar] [CrossRef]
  8. Okpara, D.A.; Omaliko, C.P.E. Effects of Staking, nitrogen and Phosphorus fertilizer rates on yield and yield components of African yam bean (Sphenostylis stenocarpa). Ghana J. Agric. Sci. 1995, 28, 23–28. [Google Scholar] [CrossRef]
  9. Fasoyiro, S.B.; Ajibade, S.R.; Omole, A.J.; Adeniyan, O.N.; Farinde, E.O. Proximate, minerals and antinutritional factors of some underutilized grain legumes in south-western Nigeria. Nutr. Food Sci. 2006, 36, 18–23. [Google Scholar] [CrossRef]
  10. Paliwal, R.; Abberton, M.; Faloye, B.; Olaniyi, O. Developing the role of legumes in West Africa under climate change. Curr. Opin. Plant Biol. 2020, 56, 242–258. [Google Scholar] [CrossRef]
  11. Akande, S.R. Germplasm characterization of African yam bean from southwest Nigeria. Acta Hortic. 2009, 806, 695–700. [Google Scholar] [CrossRef]
  12. Popoola, J.O.; Adegbite, A.E.; Obembe, O.O.; Adewale, B.D.; Odu, B.O. Morphological intraspecific variabilities in African yam bean (AYB) (Sphenostylis stenocarpa Ex. A. Rich) Harms. Sci. Res. Essay 2011, 6, 507–515. [Google Scholar]
  13. Adewale, B.D.; Dumet, D.J.; Vroh-Bi, I.; Kehinde, O.B.; Ojo, D.K.; Adegbite, A.E.; Franco, J. Morphological diversity analysis of African yam bean (Sphenostylis stenocarpa Hochst. ex A. Rich.) Harms and prospects for utilization in germplasm conservation and breeding. Genet. Resour. Crop Evol. 2012, 59, 927–936. [Google Scholar] [CrossRef]
  14. Aremu, C.O.; Ibirinde, D.B. Bio-diversity studies on accessions of African yam bean (Sphenostylis stenocarpa). Int. J. Agric. Res. 2012, 7, 78–85. [Google Scholar] [CrossRef]
  15. Ibirinde, D.O.; Aremu, C.O. Trait variability studies on African yam bean (Sphenostylis stenocarpa) grown in the Guinea Savannah Zone of Southwestern Nigeria. Int. J. Adv. Biol. Res. 2013, 3, 422–427. [Google Scholar]
  16. Aina, I.A.; Ilori, O.C.; Ekanem, O.U.; Oyatomi, A.O.; Potter, D.; Abberton, M.T. Morphological Characterization and Variability Analysis of African Yam Bean (Sphenostylis stenocarpa Hochst. ex. A. Rich) Harms. Int. J. Plant Res. 2020, 10, 45–52. [Google Scholar]
  17. Moyib, O.K.; Gbadegesin, M.A.; Aina, O.O.; Odunola, A.O. Genetic variation within a collection of Nigerian accessions of African yam bean (Sphenostylis stenocarpa) revealed by RAPD primers. Afr. J. Biotechnol. 2008, 7, 1839–1846. [Google Scholar] [CrossRef] [Green Version]
  18. Ojuederie, O.B.; Balogun, M.O.; Fawole, I.; Igwe, D.O.; Olowolafe, M.O. Assessment of the genetic diversity of African yam bean (Sphenostylis stenocarpa Hochst ex. A Rich. Harms) accessions using amplified fragment length polymorphism (AFLP) markers. Afr. J. Biotechnol. 2014, 13, 18. [Google Scholar]
  19. Adewale, B.D.; Vroh-Bi, I.; Dumet, D.J.; Nnadi, S.; Kehinde, O.B.; Ojo, D.K.; Adegbite, A.E.; Franco, J. Genetic diversity in African yam bean accessions based on AFLP markers: Towards a platform for germplasm improvement and utilization. Plant Genet. Resour. 2015, 13, 111. [Google Scholar] [CrossRef]
  20. Shitta, N.S.; Abberton, M.T.; Adesoye, A.I.; Adewale, D.B.; Oyatomi, O. Analysis of genetic diversity of African yam bean using SSR markers derived from cowpea. Plant Genet. Resour. 2016, 14, 50–56. [Google Scholar] [CrossRef]
  21. Kalisz, S.; Kramer, E.M. Variation and constraint in plant evolution and development. Heredity 2008, 100, 171–177. [Google Scholar] [CrossRef] [Green Version]
  22. Tiwari, D.N.; Tripathi, S.R.; Tripathi, M.P.; Khatri, N.; Bastola, B.R. Genetic Variability and Correlation Coefficients of Major Traits in Early Maturing Rice under Rainfed Lowland Environments of Nepal. Adv. Agric. 2019, 2019, 5975901. [Google Scholar] [CrossRef] [Green Version]
  23. Kumar, P.; Sharma, S.D.; Sharma, N.C.; Devi, M. The path coefficient analysis of yield components for leaf nutrient concentrations in mango (Mangifera indica L.) under rainfed agroclimatic conditions of north-west Himalaya. Sci. Hortic. 2015, 190, 31–35. [Google Scholar] [CrossRef]
  24. Sesay, S.; Ojo, D.K.; Ariyo, O.J.; Meseka, S.K.; Fayeun, L.S.; Omikunle, A.O.; Oyetunde, A.O. Correlation and path coefficient analysis of top-cross and three-way cross hybrid maize populations. Afr. J. Agric. Res. 2017, 12, 780–789. [Google Scholar]
  25. Adewale, D.B.; Dumet, D.J. Descriptors for African Yam Bean, Sphenostylis stenocarpa (Hochst ex. A. Rich.) Harms; Genetic Resources Center, International Institute of Tropical Agriculture (IITA): Ibadan, Nigeria, 2011; pp. 1–13. [Google Scholar]
  26. SAS Institute Inc. Base SAS® 9.4 Procedures Guide: Statistical Procedures; SAS Institute Inc.: Cary, NC, USA, 2017. [Google Scholar]
  27. Robinson, H.F.; Comstock, R.E.; Harvey, P.H. Estimates of Heritability and the Degree of Dominance in Corn. Agron. J. 1949, 41, 353–359. [Google Scholar] [CrossRef]
  28. Singh, R.K.; Chaudhary, B.D. Biometrical Methods in Quantitative Genetic Analysis; Kalyani Publishers: New Delhi, India, 1977; pp. 57–58. [Google Scholar]
  29. Sivasubramanian, S.; Menon, M. Heterosis and inbreeding depression in rice. Adv. Agron. 1973, 47, 85–140. [Google Scholar]
  30. Alvarado, G.L.; Vargas, M.; Pacheco, M.; Rodríguez, Á.F.; Burgueño, J.; Crossa, J. META-R (Multi Environment Trail Analysis with R for Windows) Version 6.04. CIMMYT Research Data & Software Repository Network, V23, 2015. Available online: https://hdl.handle.net/11529/10201 (accessed on 5 September 2021).
  31. Ward, J.H., Jr. Hierarchical grouping to optimize an objective function. J. Am. Stat. Assoc. 1963, 58, 236–244. [Google Scholar] [CrossRef]
  32. Adewale, B.D.; Aremu, C.O.; Amazue, U.E. Intra-Specific variability and diversity analysis of African yam bean by seed size parameters. J. Agric. Biol. Sci. 2012, 7, 454–461. [Google Scholar]
  33. Adewale, B.D.; Kehinde, O.B.; Aremu, C.O.; Popoola, J.O.; Dumet, D.J. Seed metrics for genetic and shape determination in African yam bean. Afr. J. Plant Sci. 2010, 4, 107–115. [Google Scholar]
  34. Ojuederie, O.B.; Balogun, M.O.; Akande, S.R.; Korie, S.; Omodele, T. Intraspecific variability in agro-morphological traits of African yam bean Sphenostylis stenocarpa (Hochst ex. A. Rich) Harms. J. Crop Sci. Biotechnol. 2015, 18, 53–62. [Google Scholar] [CrossRef]
  35. Ibirinde, D.O.; Aremu, C.O.; Balogun, K.; Oladokun, L. Assessment of Seed and Tuber Production Potential in Varieties of Sphenostylis stenocarpa (Africa Yam Bean). Agric. Sci. 2019, 10, 870–881. [Google Scholar]
  36. Aremu, C.; Abberton, M.; Adebiyi, T.; Asaleye, A.J.; Inegbedion, H.; Abolusoro, S.; Adekiya, A.; Aboyeji, C.; Dunsin, O. Selecting yield and nutritional traits in Sphenostylis stenocarpa landraces for food improvement. Recent Pat. Food Nutr. Agric. 2020, 11, 69–81. [Google Scholar] [CrossRef] [PubMed] [Green Version]
  37. Gomez, K.A.; Gomez, A.A. Statistical Procedures for Agricultural Research; John Wiley and Sons: Hoboken, NJ, USA, 1984. [Google Scholar]
  38. Alake, C.O.; Porbeni, B.J. Genetic variation and intraspecific diversity for agro-morphological and nutritional traits in African yam bean. J. Crop Improv. 2020, 34, 139–163. [Google Scholar] [CrossRef]
  39. Nwofia, G.E.; Awaraka, R.O.; Agbo, C.U. Genetic Variability and Trait Association Studies in African Yam Bean (Sphenostylis sternocarpa) Hochst ex A. Rich. Am.-Eurasian J. Agric. Environ. Sci. 2013, 13, 1547–1553. [Google Scholar]
  40. Bose, L.K.; Das, S.; Pradhan, S.K.; Subudhi, H.; Singh, S.; Singh, O. Genetic variability of quality characters and grain yield in lowland rice genotypes of Eastern India. Korean J. Breed. Sci. 2007, 39, 1–6. [Google Scholar]
  41. Adesoye, A.; Ukwueze, C. Genetic and environmental variation of seed yield and yield components in African yam bean (Sphenostylis stenocarpa (Hochst. Ex. A. Rich.)). Adv. Life Sci. Technol. 2015, 38, 7–16. [Google Scholar]
  42. Osuagwu, A.N.; Chukwurah, P.N.; Ekpo, I.A.; Akpakpan, E.E.; Agbor, R.B. Variation, correlation and path coefficient analyses in seed yield and related characters in local accessions of African Yam Bean (Sphenostylis stenocarpa) from Southern Nigeria. Afr. J. Agric. Res. 2014, 9, 211–215. [Google Scholar]
  43. Das, S.; Das, S.S.; Chakraborty, I.; Roy, N.; Nath, M.K.; Sarma, D. Principal component analysis in plant breeding. Biomol. Rep. Int. e-Newsl. 2017, 3, 1–3. [Google Scholar]
  44. Guei, R.G.; Sanni, K.A.; Abamu, F.J.; Fawole, I. Genetic diversity of rice (Oryza sativa L.). Agron. Afr. 2005, 5, 17–28. [Google Scholar]
Figure 1. PCA biplot of 14 agronomic traits of 196 Accessions of African yam bean evaluated during the 2018 and 2019 cropping seasons in three agro-ecologies of Nigeria. Days to flowering (D50F); days to pod maturity (DPM); grain filling period (GFP); number of pods per plant (NPPPL); pod weight per plant (PWPPL); shelling percentage (SP); pod length (PDL); seed yield per plant (SYPPL); number of locules per pod (NLPPD); number of seeds per pod (NSPPD); 100-seeds weight (HSW); seed length (SL); seed width (SW); seed thickness (ST). The colored points show the distribution of accessions in to five different clusters.
Agronomy 12 00884 g001
Figure 2. A constellation plot depicting genetic relatedness between 196 accessions of African yam bean evaluated during the 2018 and 2019 cropping seasons in three agro-ecologies of Nigeria.
Agronomy 12 00884 g002
Table 1. Pre-field soil physical and chemical properties and Global positioning system (GPS) coordinates of the experimental site.
PropertiesE1E2E3E4E5E6
pH (1:1)5.96.85.85.44.85.2
Bray P (mg/kg)95121023
Organic Carbon (g/kg)4.34.23.88.75.14.8
N (g/kg)0.61.30.20.61.12.8
Particle size (g/kg)
Sand750650850770810850
Silt6080601406090
Clay190270909013060
Textural classSLSCLLSSLSLLS
Coordinates7°29′12.89″ N,
3°54′07.38″ E, 237.07 m altitude
7°29′07.95″ N, 3°54′03.79″ E, 211.6 m altitude12°08′21.97″ N, 8°40′05.55″ E, 427.8 m altitude12°08′23.59″ N, 8°40′11.03″ E, 425.5 m altitude6°40′09.40″ N, 6°20′28.08″ E, 334.4 m altitude6°40′09.40″ N, 6°20′28.08″ E, 334.4 m altitude
SL: sandy loam; LS: loamy sand; SCL: sandy clay loam. E1: Ibadan 2018; E2: Ibadan 2019; E3: Kano 2018; E4: Kano 2019; E5: Ubiaja 2018; E6: Ubiaja 2019.
Table 2. Weather condition in each cropping season in Ibadan, Kano and Ubiaja.
MonthYearRainfall (mm)Solar Radiation (MJ/m2/day)Temp. Min (°C)Temp. Max (°C)Relative Humidity (%)MonthYearRainfall (mm)Solar Radiation (MJ/m2/day)Temp. Min (°C)Temp. Max (°C)Relative Humidity (%)
E1 E2
4–31 August201891.5513.222.2328.3384.916–31 August2019236.8514.91622.2728.9582.35
September2018251.5614.8122.4429.3982.66September2019305.315.7322.2928.9681.14
October201828018.1521.9230.978.08October2019299.9516.9222.0529.2379.06
November201816.918.9423.3932.0469.28November201932.418.1823.332.370.05
December2018018.7720.5433.8351.48December2019918.621.5133.8460.39
January20197.114.2822.135.0257.86January2020018.9319.8134.7146.69
Average 107.8516.3622.131.5970.71Average 147.2517.2121.8731.3369.95
E3 E4
20–31 July201863.7219.1822.0431.5988.3317–31 July2019114.2120.4422.1931.1571.34
August2018249.8617.8521.4530.2892.26August2019244.2518.9921.1629.2179.22
September201885.5619.9821.7231.9489.09September201972.820.3821.9631.7971.63
October201910.6420.3421.5331.867.83October201953.8720.3421.5331.867.83
November2018019.9616.1734.5454.88November201921.520.7818.0334.0841.21
December2018016.9914.1230.1942.2December2019020.6311.8730.4226.88
1–19 January2019019.7313.819.7218.711–16 January2020019.3813.0329.2828.58
Average 58.4519.1518.6930.0164.76Average 72.3820.1318.5431.155.24
E5 E6
25–31 August201891.4917.4721.91128.3388.9June2019315.7616.5522.929.0788.36
September2018325.4216.4322.3728.0190.35July2019241.3616.3822.3228.2189.2
October2018139.9718.4522.5728.5889.53August2019386.1715.6521.9927.7790.09
November201876.7219.5822.5430.1483.15September2019391.5316.5122.4627.8191.14
December20180.0119.0319.2729.7266.92October2019417.3916.6322.1927.9490.08
January201914.8917.7820.5230.472.76November201962.619.0322.7530.0584.45
1–24 February201915.9418.5721.530.4272Average 302.4716.7922.4428.4888.89
Average 94.9218.1921.5329.3780.52
E1: Ibadan 2018; E2: Ibadan 2019; E3: Kano 2018; E4: Kano 2019; E5: Ubiaja 2018; E6: Ubiaja 2019.
Table 3. Mean squares from analysis of variance for 14 agronomic and yield traits of 196 accessions of African yam bean evaluated during the 2018 and 2019 cropping season in three agro-ecologies of Nigeria.
SOVDFD50FDPMGFPNPPPLPWPPLSPPDL
ACC195111.12 ***248.33 *300.56 **0.11 **774.96 *1.8 *19.61 ***
ENV (LOC * YR)5105,468 ***410,740 ***252,643 ***18.17 ***178,126 ***156.3 ***3725.93 ***
REP (ENV)12463.82 ***1422.3 ***1174.56 ***1.07 ***19,861 ***8.26 ***62.84 ***
BLK (REP * ENV)23462.96 ***134.33 ***158.49 ***0.07 ***765.32 ***0.92 **6.63 *
ACC * ENV97564.13 ***209.3 ***236.84 ***0.09 ***644.24 ***1.52 ***11.74 ***
Error215735.8475.4697.980.04336.720.735.54
CV (%) 6.725.6815.4521.5656.4313.1211.37
SOVDFNLPPDNSPPDHSWSYPPLSLSWST
ACC1950.02 ***0.02 **52.18 ***225.74 *1.26 ***0.55 ***0.88 ***
ENV (LOC * YR)58.71 ***9.56 ***2582.22 ***56,656 **59.79 ***57.48 ***63.52 ***
REP (ENV)120.05 ***0.05 ***66.67 ***6967.85 ***0.54 **0.37 **0.52 **
BLK (REP * ENV)2340.010.01 *17.14 *232.52 ***0.220.140.2
ACC * ENV9750.02 ***0.02 ***25.69 ***181.26 ***0.42 ***0.28 ***0.38 ***
Error21570.010.0114.196.360.220.140.21
CV (%) 7.988.5618.2464.625.896.067.76
*, **, *** significant at 0.05, 0.01 and 0.001 levels of probability, respectively. Source of variation (SOV); accession (ACC); environment (ENV); location (LOC); year (YR); replication (REP); block (BLK), coefficient of variation (CV); days to flowering (D50F); days to pod maturity (DPM); grain filling period (GFP); number of pods per plant (NPPPL); pod weight per plant (PWPPL); shelling percentage (SP); pod length (PDL); seed yield per plant (SYPPL); number of locules per pod (NLPPD); number of seeds per pod (NSPPD); 100-seeds weight (HSW); seed length (SL); seed width (SW); seed thickness (ST).
Table 4. Mean, estimates of genetic variability and broad-sense heritability for 14 agronomic traits of 196 accessions of African yam bean evaluated during 2018 and 2019 cropping season in three agro-ecologies of Nigeria.
TraitsMeanσ2eσ2pσ2gσ2geGVCPCVH2 (%)
D50F89.1136.096.612.979.761.92.945.0
DPM153.0375.6714.762.5348.171.02.517.1
GFP64.0598.4817.874.1549.523.26.623.2
NPPPL9.2325.464.020.8710.4210.121.721.6
PWPPL32.52334.7945.727.86115.588.620.817.2
SP43.80112.3816.22.7243.433.89.216.8
PDL20.695.541.180.502.273.45.342.0
NLPPD12.354.960.790.221.743.87.228.1
NSPPD11.424.740.790.251.654.47.830.8
HSW20.5814.243.071.584.176.18.551.6
SYPPL15.1995.713.622.9732.0111.324.321.8
SL7.980.220.080.050.082.83.566.4
SW6.190.140.030.020.052.12.950.0
ST5.970.210.050.030.063.03.957.8
Days to flowering (D50F); days to pod maturity (DPM); grain filling period (GFP); number of pods per plant (NPPPL); pod weight per plant (PWPPL); shelling percentage (SP); pod length (PDL); seed yield per plant (SYPPL); number of locules per pod (NLPPD); number of seeds per pod (NSPPD); 100-seeds weight (HSW); seed length (SL); seed width (SW); seed thickness (ST); environmental variance (σ2e); genotypic variance (σ2g); genotypic × environment variance (σ2ge); phenotypic variance (σ2p); phenotypic coefficient of variation (PCV); genotypic coefficient of variation (GCV); broad sense heritability (H2).
Table 5. Genotypic and phenotypic correlation coefficient among agronomic traits of 196 accessions of African yam bean evaluated during the 2018 and 2019 cropping season in three agro-ecologies of Nigeria.
Traits D50FDPMGFPNPPPLPWPPLSPPDLNLPPDNSPPDHSWSLSWST
DPMrg0.35 **
rp0.21 **
GFPrg−0.61 **0.53 **
rp−0.42 **0.78 **
NPPPLrg−0.57 **0.010.53 **
rp−0.2 **0.16 *0.27 **
PWPPLrg−0.15 *0.32 **0.40 **0.71 **
rp−0.090.14 *0.19 **0.83 **
SPrg0.29 **0.40 **0.120.78 **0.70 **
rp0.080.060.010.21 **0.21 **
PDLrg0.35 **0.21 **−0.14−0.33 **−0.23 **−0.83 **
rp0.12−0.003−0.080.020.12−0.16 *
NLPPDrg0.48 **0.21 **−0.20.120.19 **0.31 **0.01
rp0.140.02−0.060.18 **0.26 **0.21 **0.39 **
NSPPDrg0.31 **0.09−0.140.010.110.27 **−0.080.97 **
rp0.080.02−0.020.18 *0.27 **0.23 **0.33 **0.94 **
HSWrg0.090.120.05−0.18 *0.26 **0.28 **0.11−0.27 **−0.28 **
rp0.050.110.080.050.21 **0.26 **0.12−0.06−0.07
SLrg0.030.15 *0.09−0.16 *0.07−0.21 **0.42 **−0.25 **−0.36 **0.73 **
rp0.050.10.06−0.010.090.020.30 **−0.07−0.130.6 **
SWrg0.010.070.07−0.16 *0.25 **0.43 **0.040.06−0.010.86 **0.50 **
rp0.010.120.110.10.24 **0.23 **0.110.110.080.68 **0.54 **
STrg0.090.090.05−0.20 **0.28 **0.50 **−0.020.140.15 *0.70 **0.19 **0.82 **
rp0.010.110.110.050.22 **0.26 **0.020.080.090.61 **0.3 **0.80 **
SYPPLrg0.28 **0.45 **0.15 *0.53 **0.89 **0.76 **−0.44 **0.26 **0.2 **0.29 **−0.060.36 **0.41 **
rp0.030.15 *0.120.70 **0.91 **0.44 **0.020.27 **0.28 **0.26 **0.050.26 **0.28 **
*, **, significant at 0.05 and 0.01 levels of probability, respectively. Days to flowering (D50F); days to pod maturity (DPM); grain filling period (GFP); number of pods per plant (NPPPL); pod weight per plant (PWPPL); shelling percentage (SP); pod length (PDL); seed yield per plant (SYPPL); number of locules per pod (NLPPD); number of seeds per pod (NSPPD); 100-seeds weight (HSW); seed length (SL); seed width (SW); seed thickness (ST).
Table 6. Eigen vectors on the first six principal components and the proportion and cumulative contributions for 14 agronomic and yield traits of 196 accessions of African yam bean, evaluated during the 2018 and 2019 cropping seasons at three agro-ecologies of Nigeria.
Variables PC1PC2PC3PC4PC5PC6
D50F−0.01−0.030.250.130.600.59
DPM0.090.22−0.370.510.360.12
GFP0.100.22−0.490.41−0.02−0.26
NPPPL0.33−0.19−0.36−0.13−0.190.17
PWPPL0.41−0.18−0.24−0.13−0.140.27
SP0.24−0.070.04−0.280.43−0.26
PDL0.12−0.100.270.47−0.360.28
NLPPD0.23−0.420.240.300.05−0.24
NSPPD0.23−0.430.210.270.06−0.30
HSW0.310.360.20−0.08−0.040.01
SYPPL0.41−0.18−0.19−0.210.070.22
SL0.200.320.250.07−0.310.22
SW0.350.330.200.000.01−0.15
ST0.320.300.15−0.030.16−0.24
Eigenvalue3.752.492.121.461.231.08
Proportion %26.817.815.210.48.77.7
Cumulative %26.844.659.870.278.986.6
Days to flowering (D50F); days to pod maturity (DPM); grain filling period (GFP); number of pods per plant (NPPPL); pod weight per plant (PWPPL); shelling percentage (SP); pod length (PDL); seed yield per plant (SYPPL); number of locules per pod (NLPPD); number of seeds per pod (NSPPD); 100-seeds weight (HSW); seed length (SL); seed width (SW); seed thickness (ST). Eigenvectors ≥ 0.20, which largely controlled each PC axes are in bold.
Publisher’s Note: MDPI stays neutral with regard to jurisdictional claims in published maps and institutional affiliations.

