Article

Strengthened Assimilate Transport Improves Yield and Quality of Super Rice

1
National Key Laboratory of Rice Biology, China National Rice Research Institute, Hangzhou 310006, China
2
Ministry of Agriculture and Rural Affairs of the People’s Republic of China, Beijing 100125, China
*
Authors to whom correspondence should be addressed.
These authors contributed equally to this work.
Agronomy 2022, 12(4), 753; https://doi.org/10.3390/agronomy12040753
Submission received: 21 January 2022 / Revised: 16 March 2022 / Accepted: 17 March 2022 / Published: 22 March 2022

Abstract

:
Rice varieties with ultra-high yields play an important role in grain production and global food security. However, little information is available on the source–sink relationships that underpin the grain quality and ultra-high-yield properties. Photosynthesis, carbohydrate accumulation and allocation, vascular bundle morphology, and nutrient uptake and characteristics were, therefore, compared in two ‘super rice’ varieties: Yongyou9 (control) and Yongyou12 (ultra-high yield) that differ in grain production. Yongyou12 had a significantly higher (18.8–21.4%) grain yield than Yongyou9, together with a substantial improvement in appearance-related qualities. The total dry weight and the ratio of panicle dry weight to total dry weight were significantly higher in Yongyou12 than Yongyou9, suggesting that the improved seed traits were related to higher assimilate accumulation and allocation in the ultra-high-yield variety. Yongyou12 had larger vascular bundles and greater numbers of vascular bundles in the panicle-neck internode, as well as higher levels of SUT1, SUT2, and CIN2 transcripts in the grains than Yongyou9. The contents of nitrogen, phosphorous, and potassium were similar in Yongyou12 and Yongyou9. We concluded that assimilate transport and nutrient utilization efficiency are the main factors underlying the higher yield and quality traits of the super rice variety Yongyou12.

1. Introduction

Rice is one of the most important food crops in the world. More than 40% of the world’s population eats a rice-based diet, and rice production, therefore, plays a considerable part in assuring food security and energy supply [1]. At the same time, there are currently 820 million hungry people in the world [2]. By 2050, it is estimated that the global population will exceed 9 billion, and about 70% more food will be required for human consumption [3,4]. To provide adequate nutrition, the global food and agricultural system must make profound changes. Therefore, increasing agricultural productivity and sustainable rice-grain production is critical to reducing the risk of world hunger. The FAO indicates that about 85% of the growth in global crop output over the next ten years will be attributed to yield improvements resulting from more intensive inputs, investments in production technology, and better cultivation practices [5]. Further intensification of land use through multiple harvests per year will account for another 10%, and cropland area expansion is projected to account for only 5%, playing a much smaller role than it has over the last decade.
Aimed at ensuring food security, China’s super rice program has achieved good results during the past twenty years [6]. High-yield rice varieties are frequently reported, and the development of super rice has played a crucial role in ensuring food security [7,8,9]. The term ‘super rice’ refers to new rice varieties with huge yield potential that are bred by a combination of techniques, including ideal plant type shaping and heterosis utilization. In recent years, high-yield rice cultivation has demonstrated the super-high-yield potential of large-spike varieties, such as the indica-japonica super rice that created a 15 t hm−2 super-high-yield record [10,11,12]. These varieties have shown significantly greater yields than existing rice varieties when supported with super-high-yield cultivation techniques. In addition, super rice usually exhibits good quality traits, strong resistance capacity, and other excellent comprehensive traits [13]. However, there are still many problems that severely limit its yield potential and remain to be solved. It is thought that the high-yield potential of super rice is difficult to realize and repeat. Poor grain filling of inferior spikelets often leads to a low seed-setting rate of super rice, and the physiological mechanisms underlying its high yield are complex and difficult to clarify. For these reasons, super rice has not been readily accepted by farmers, and without corresponding integrated and convenient cultivation methods, it is far from achieving its full-yield potential.
Significant past work has been performed and various results were obtained regarding the high-yield potential of super rice varieties. Liu et al. [14] found that the elite hybrid rice Y-liangyou 900 had relatively higher radiation-use efficiency that further improved its yield. Similarly, Chang et al. [10] showed that Y-liangyou 900 had greater photosynthetic rates, leaf chlorophyll concentrations, leaf thickness, and leaf area, all which led to higher dry matter accumulation. Furthermore, its sturdier stems, shorter internode lengths on the lower stem, and higher sheath mass contributed to higher lodging resistance and stronger stem-lodging resistance. Super rice also exhibited larger root and shoot biomass, greater root length and volume throughout the growing season, higher root oxidation activity, and greater root zeatin plus zeatin-riboside content per plant at the early- and middle-growth stages [15]. These factors contributed to a larger sink size, shoot stay-green traits, greater biomass accumulation, and higher grain yield in the super rice varieties [16,17]. Previous research has also explored population-level dry matter production and the utilization of nutrient elements by super-high-yielding rice varieties to construct a developmental model and better understand underlying regulatory mechanisms [18,19]. This work has provided an important basis for research on rice cultivation techniques and has been indispensable for the promotion of rice production. However, less work has been performed to evaluate assimilate transport characteristics and their corresponding physiological mechanisms in super rice, particularly in terms of the microstructure of the neck-panicle internodes and related gene expression.
In this study, grain-filling properties, yield components and rice quality were compared between two varieties, Yongyou12 (super-high-yielding variety) and Yongyou9 (control variety). Photosynthetic rate, solar radiation interception, soluble sugar contents that indicated the activity of the source organ, grain-filling characteristics, and changes in hormone content of superior/inferior grains that reflected the sink strength were investigated. Most importantly, vascular bundle structures and the expression of genes directly related to carbohydrate transport were surveyed and evaluated. Here, we target revealing the physiological mechanism underlying the super-high yield formation of super rice and providing some indication for increasing the grain yield.

2. Materials and Methods

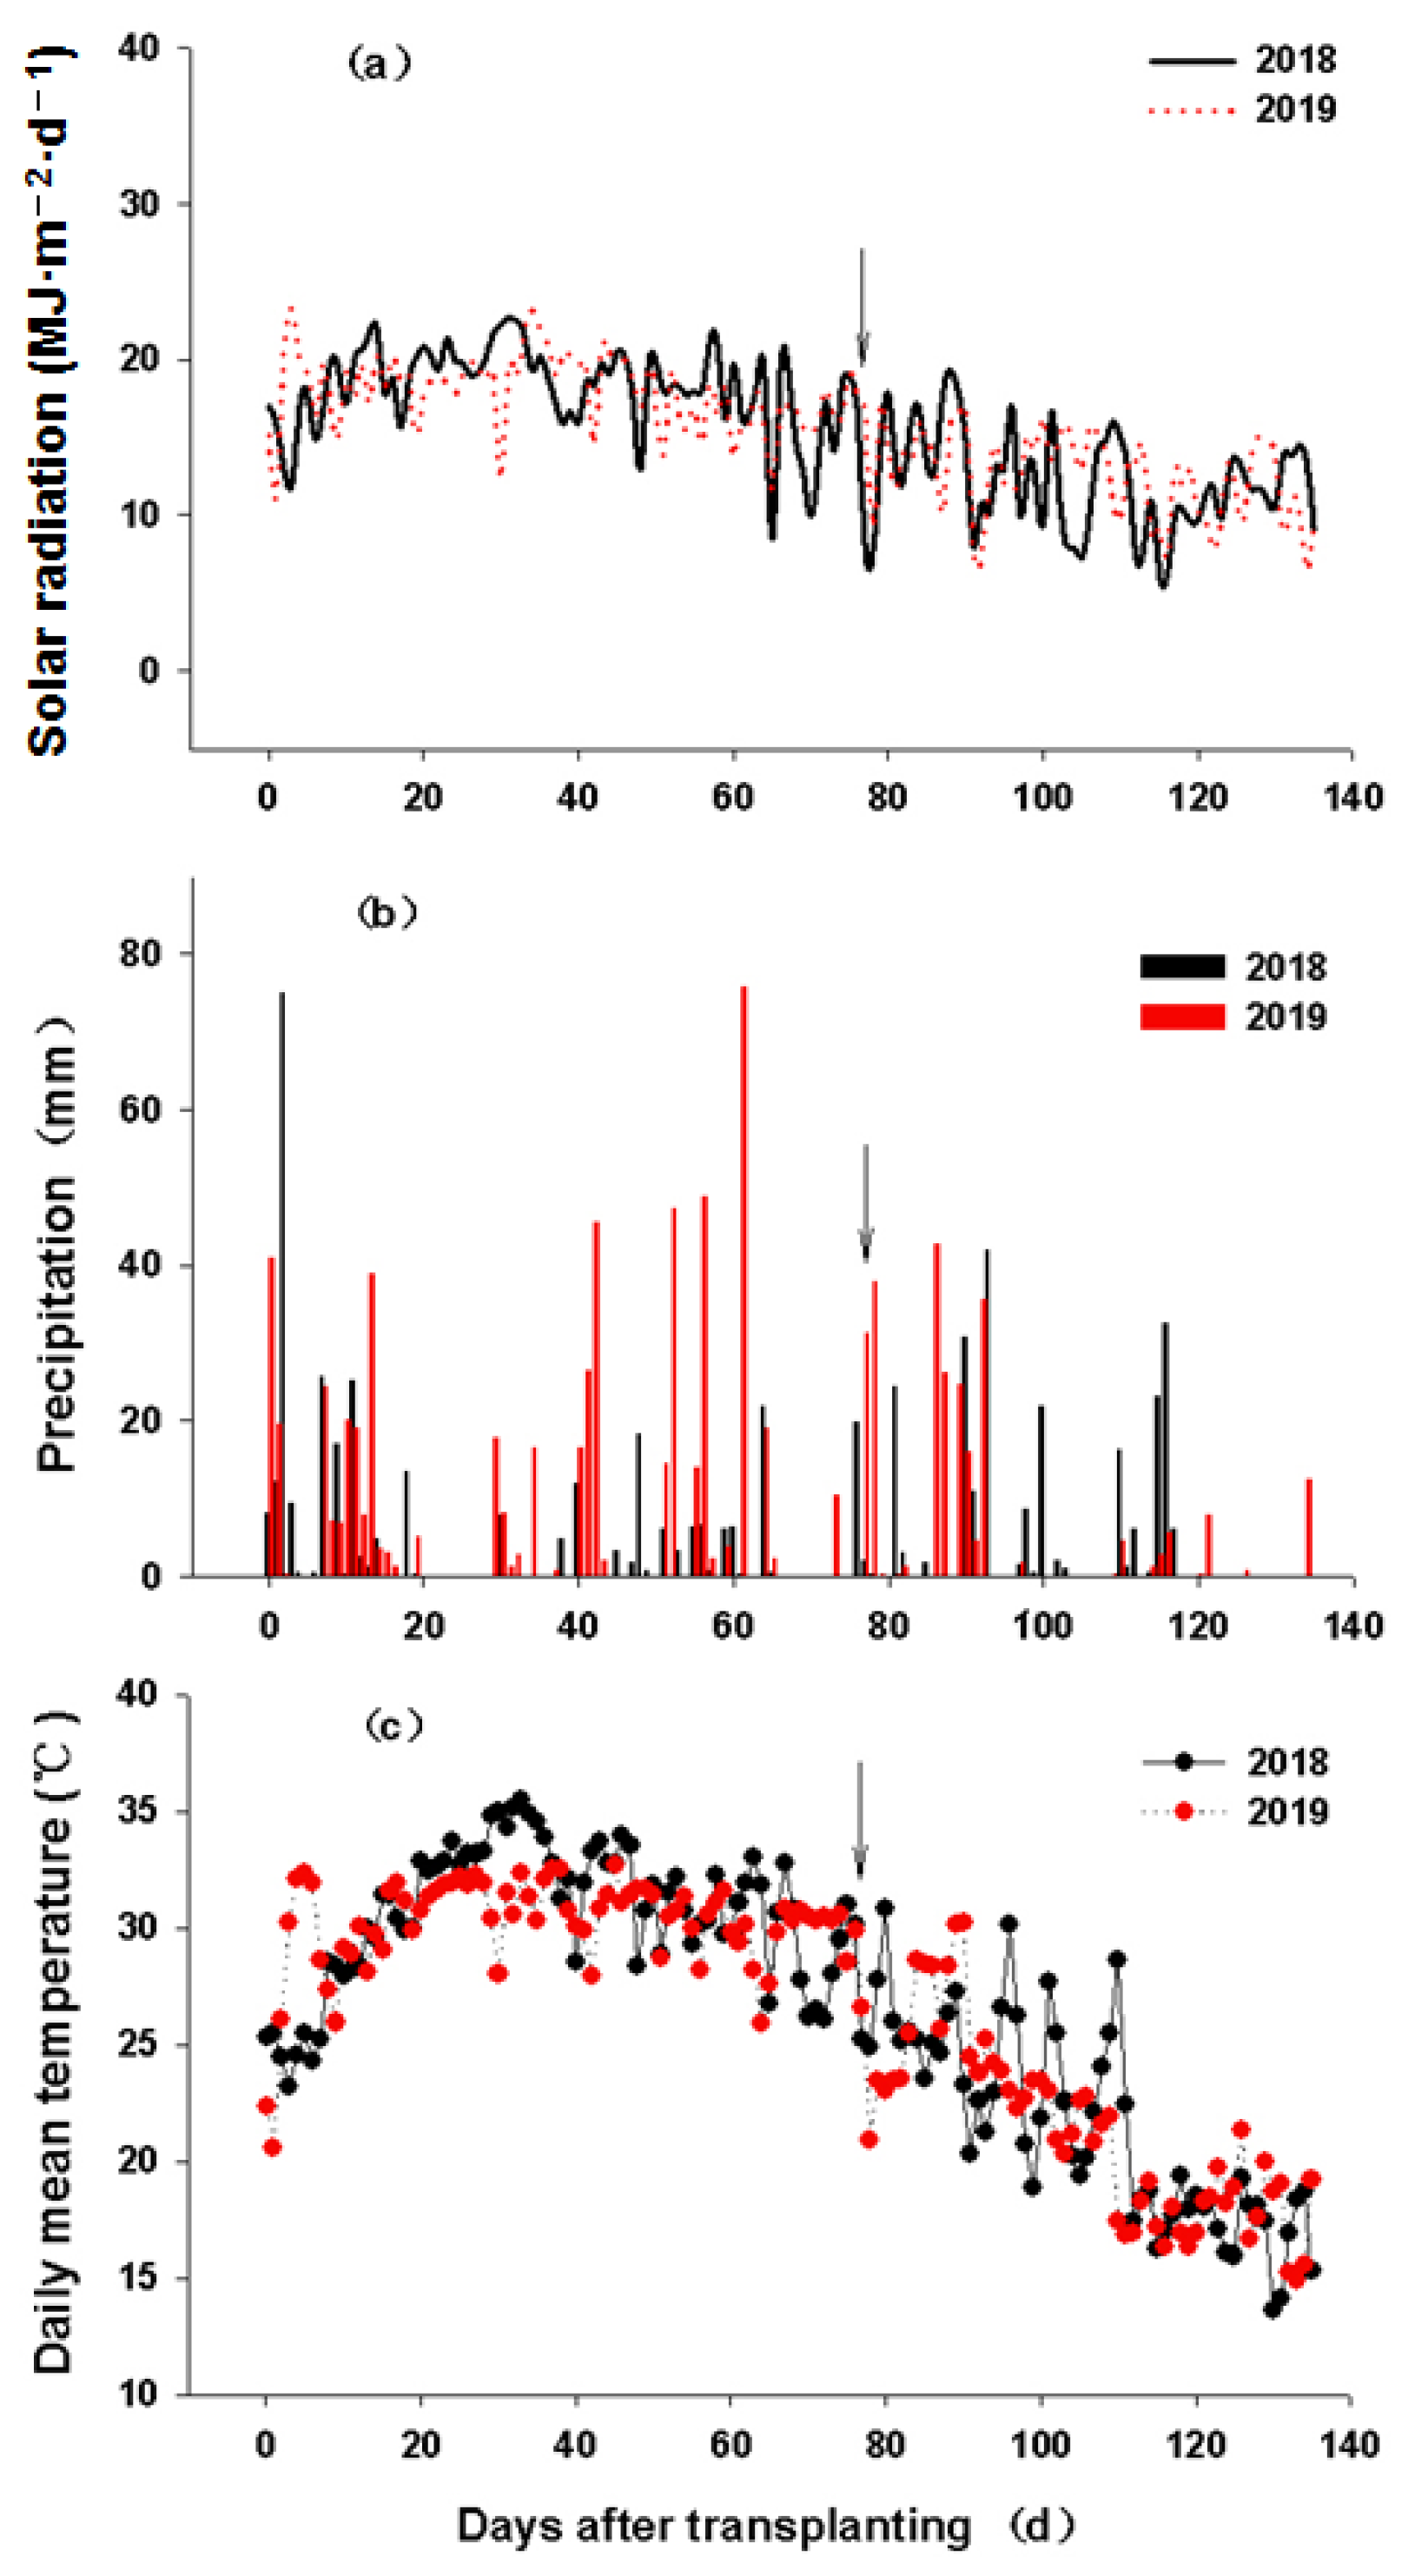
2.1. Plant Materials and Growth Conditions

This experiment was performed at the Fuyang base of the China National Rice Research Institute from 2018 to 2019. Two three-line hybrid super rice varieties (japonica) were selected: Yongyou12 (Yongjing2A × F5032) and Yongyou9 (Yongjing2A × K306093), both bred by the Ningbo Academy of Agricultural Sciences and Ningbo Seed Co., Ltd. in Zhejiang Province. Their seeds were sown on 28 May after germination at a constant temperature of 30 °C in a wet and dark incubator. Seedlings were transplanted as single plants to a paddy field on 22 June using row spacing of 25 cm × 20 cm. The flowering date and harvest date of Yongyou9 were respectively 5 September and 25 October in 2018. The development periods of Yongyou12 were similar with those of Yongyou9 in that the flowering date was 7 September while the maturation date was 2 November. The variation of growth stages between two experimental years was negligible while they were only delayed for two days in 2019.
The trial used a single factor randomized block design with a plot size of 25 m2 and four replications. The loam clay of the test field contained 36.9 g/kg of organic matter, 2.73 g/kg total nitrogen, 0.60 g/kg total phosphorus, 20.1 g/kg total potassium, 232 mg/kg alkaline nitrogen, 9.7 mg/kg ammonium nitrogen, 25.2 mg/kg available phosphorus, and 65 mg/kg available potassium with a pH of 6.5. Nitrogen in the form of urea was applied at the rate of 15 kg/667 m2, with a 5:3:2 ratio of base fertilizer:tiller fertilizer:ear fertilizer. Phosphorus pentoxide was applied once (7.5 kg/667 m2) at transplant. Potassium chloride was applied twice as base and ear fertilizer at a total rate of 15 kg/667 m2 split evenly between the two applications. Field managements including prevention and control of diseases, pests and weeds at some certain periods were performed according to conventional high-yield cultivation methods. The water in the paddy field was drained at the mid-tillering stage, whereas at other times, they were kept at a shallow layer. The solar radiation, precipitation, and daily mean temperature during the rice-growing season across the two testing years were recorded at a weather station close to the experimental site (Figure 1).

2.2. Determination of Grain Yields, Yield Components and Grain Quality

Rice plants were sampled at maturity, and actual yields were calculated based on actual grains harvested from 15-m2 plots. Twelve hills of rice plants in each plot were selected for measurement of yield components, including the number of effective panicles, the number of grains per panicle, the seed-setting rate, and the grain weight. The seed-setting rate was defined as the percentage of fully filled grains to total grains using the water flotation method. The theoretical grain yield was calculated by multiplication of yield components. The grain samples were sent to the Rice Quality Testing Center of the Chinese Rice Research Institute for rice quality testing after drying under natural sunlight.

2.3. Plant Height, Stem Tiller Dynamics, and Solar Radiation Interception Rate

Plant height and tiller numbers per plant were measured every seven days after transplant for about two months. Three fixed observation points were selected for each experimental plot in which ten neighboring hills were targeted for measurement of plant height and tiller numbers. Another ten hills were selected at the same time, and new tillers were tagged and counted at the same measurement frequency until no new tillers were observed.
From 9:00 to 11:00 am. on a sunny day at the full-heading stage, a portable luminance meter (IM-600, Topcon, Tokyo, Japan) was used to measure the inter-row light strength at the top of the canopy and at 100 cm, 75 cm, 50 cm, and 25 cm above the ground. The light energy interception rate at each measurement point was calculated as the ratio of light intensity at each height to that at the top of the canopy.

2.4. Photosynthesis and Dry Matter Accumulation

Photosynthetic measurements were conducted at mid-tillering, panicle initiation, full heading, and every 10 days from 10 days after flowering (DAF) to 60 DAF. The photosynthetic rate of the rice leaves was measured between 9:00 am. and 11:00 am. using a portable photosynthesis system (LI-6800, LI-COR, Lincoln, NE, USA). The top fully expanded leaves whose upper surfaces were exposed to the sunlight were selected and measured with six repetitions under the following conditions: photosynthetic photon flux density 1200 μmol/(m2∙s), ambient CO2 concentration 400 μmol/mol, flow rate 500 μmol/s, and temperature 30 °C [20].
Five hills of rice plants were harvested from each experimental plot and separated into leaves, panicles, stems, and sheaths. Leaf area was measured with a leaf area meter (LI-3000C, LI-COR, Lincoln, NE, USA). All samples were placed in a 105 °C oven for 60 min and then dried at 80 °C for 48 h to a constant weight. The specific leaf weight was defined as the ratio of leaf dry weight to leaf area.

2.5. Measurement of Grain Filling Rate

Two hundred rice panicles that developed uniformly and flowered on the same day were selected, tagged with plastic cards, and marked with the flowering date. Fifteen panicles were harvested on seven dates from flowering to maturity to investigate the weight of the superior and inferior grains. The superior and inferior grains were separated and classified, as described previously [21]. The grain-filling process was fitted using Richards’ growth equation W = A/(1 + Be−kt)1/N, and the grain-filling rate was calculated [22]. In the formula, W indicates the grain weight, A is the maximum grain weight, t is the time (days) after flowering, and B, K, and N are coefficients determined by regression analysis. Simulation was performed using Curve Expert 1.3 software (Digital River, Minnetonka, MN, USA).

2.6. Soluble Sugar Content Determination

The anthrone colorimetric method was used to determine the soluble sugar content at 0, 15, 30, and 45 DAF [23]. Dried samples (0.1 g) of flag leaf, grain, stem, and sheath were prepared, pulverized, and sieved. They were extracted with 10 mL 80% (v/v) methanol in an 80 °C water bath for 30 min. The extract was centrifuged at 2000 rpm for 15 min after cooling. The supernatant was collected, and the extraction process was repeated twice using the residue. A sample of the extraction solution (0.5 mL) was combined with 1.5 mL distilled water and 4 mL 0.2% (m/v) anthrone prepared with sulfuric acid, and the mixture was heated in boiling water for 15 min. Absorbance was recorded at 620 nm with a visible light spectrophotometer (Model 722S, Lengguang Technology, Shanghai, China). The total soluble sugar content was calculated with reference to the sugar contents and the absorbance of the standard curve.

2.7. Measurement of Plant Hormone Content

Fresh samples of superior and inferior grains harvested at ten intervals from 10 DAF to 50 DAF were quickly frozen in liquid nitrogen and stored at −80 °C for hormone measurements. Extractions of indoleacetic acid (IAA), gibberellin 3 (GA3), zeatin (ZR), and abscisic acid (ABA) were performed as described in Bollmark et al. [24] and Zhang et al. [25]. In brief, 0.5 g of fresh grain sample was homogenized on ice in 8 mL of 80% (v/v) methanol. The extracted solution was centrifuged at 2000 rpm for 15 min after digestion for 12 h at 4 °C. The extraction process was repeated twice with 5–10 mL of the same medium, and the supernatants were collected. The samples were evaporated, concentrated, and combined with 0.1 g of polyvinyl pyrrolidone to cross-link phenolic compounds and pigments. Impurities were removed after centrifugation at 10,000 rpm for 15 min at 4 °C, and the extract solution was vacuum dried. Samples were fully dissolved in 2 mL methanol and passed through micropore-filtering film (0.45 μm diameter). Samples (10 μL) were then injected for analysis by high-performance liquid chromatography (Alliance e2695, Waters, Millford, MA, USA).

2.8. Root-Bleeding Sap Determination

Three hills of rice plants were harvested as one sample at 0, 10, 20, 30, and 40 DAF and used to estimate the amount of root-bleeding sap. Plant stems were cut off about 12 cm aboveground at 6:00 pm. (the field water had been drained before sampling). Pre-weighed absorbent cotton was placed into a large glass tube, which was then placed above the bleeding stem and wrapped with plastic film. The absorbent cotton with absorbed wound fluid was retrieved at 8:00 am. the next day. The amount of bleeding sap was calculated by subtracting the cotton weight from the total weight and was expressed as the quantity per plant stem per hour [26].

2.9. Observation of Vascular Bundles

Panicle neck internode samples were obtained at the full-heading stage and fixed in 2.5% glutaraldehyde solution. The position used for microscopy observation was about 2 cm above the uppermost node. Transverse sections of paraffin-embedded tissue were prepared and stained with safranine and fast green, as described previously [27]. Sections of vascular bundles in the sheath were observed and photographed using a florescence microscope (Leica DM4000, Wetzlar, Germany). At least ten photographs displaying the intact tissues for each variety were taken at 20-fold and 200-fold eyepiece. The numbers of both large and small vessel bundles were counted, and their dimensions (diameter and area) were determined using Image J software (US National Institutes of Health, Bethesda, MD, USA) with the irregular delineation calculation tool.

2.10. Gene Expression Determination

The relative expression levels of three genes, including OsSUT1, OsSUT2 and the cell wall invertase gene, CIN2, were measured by RT-PCR for their possible role in assimilates transport and unloading from the stem and sheath to grain [28,29,30]. All primers are listed in Supplementary Table S1. The 2−ΔΔCT method, as described by Feng et al. [31], was used to calculate the relative gene expression levels using the mean value of three replicates.

2.11. Data Analysis

Analysis of variance was performed using SPSS software (version 11.5, IBM Corp., Armonk, NY, USA). When there was no significant effect of year, data from the two years were averaged. Differences among means were evaluated using the least significant difference test (LSD) at p = 0.05 level by one way analysis of variance (ANOVA). The correlation of the ratio of panicle weight to total weight/grain yield with the agronomy traits and physiological parameters were analyzed by linear regression.

3. Results

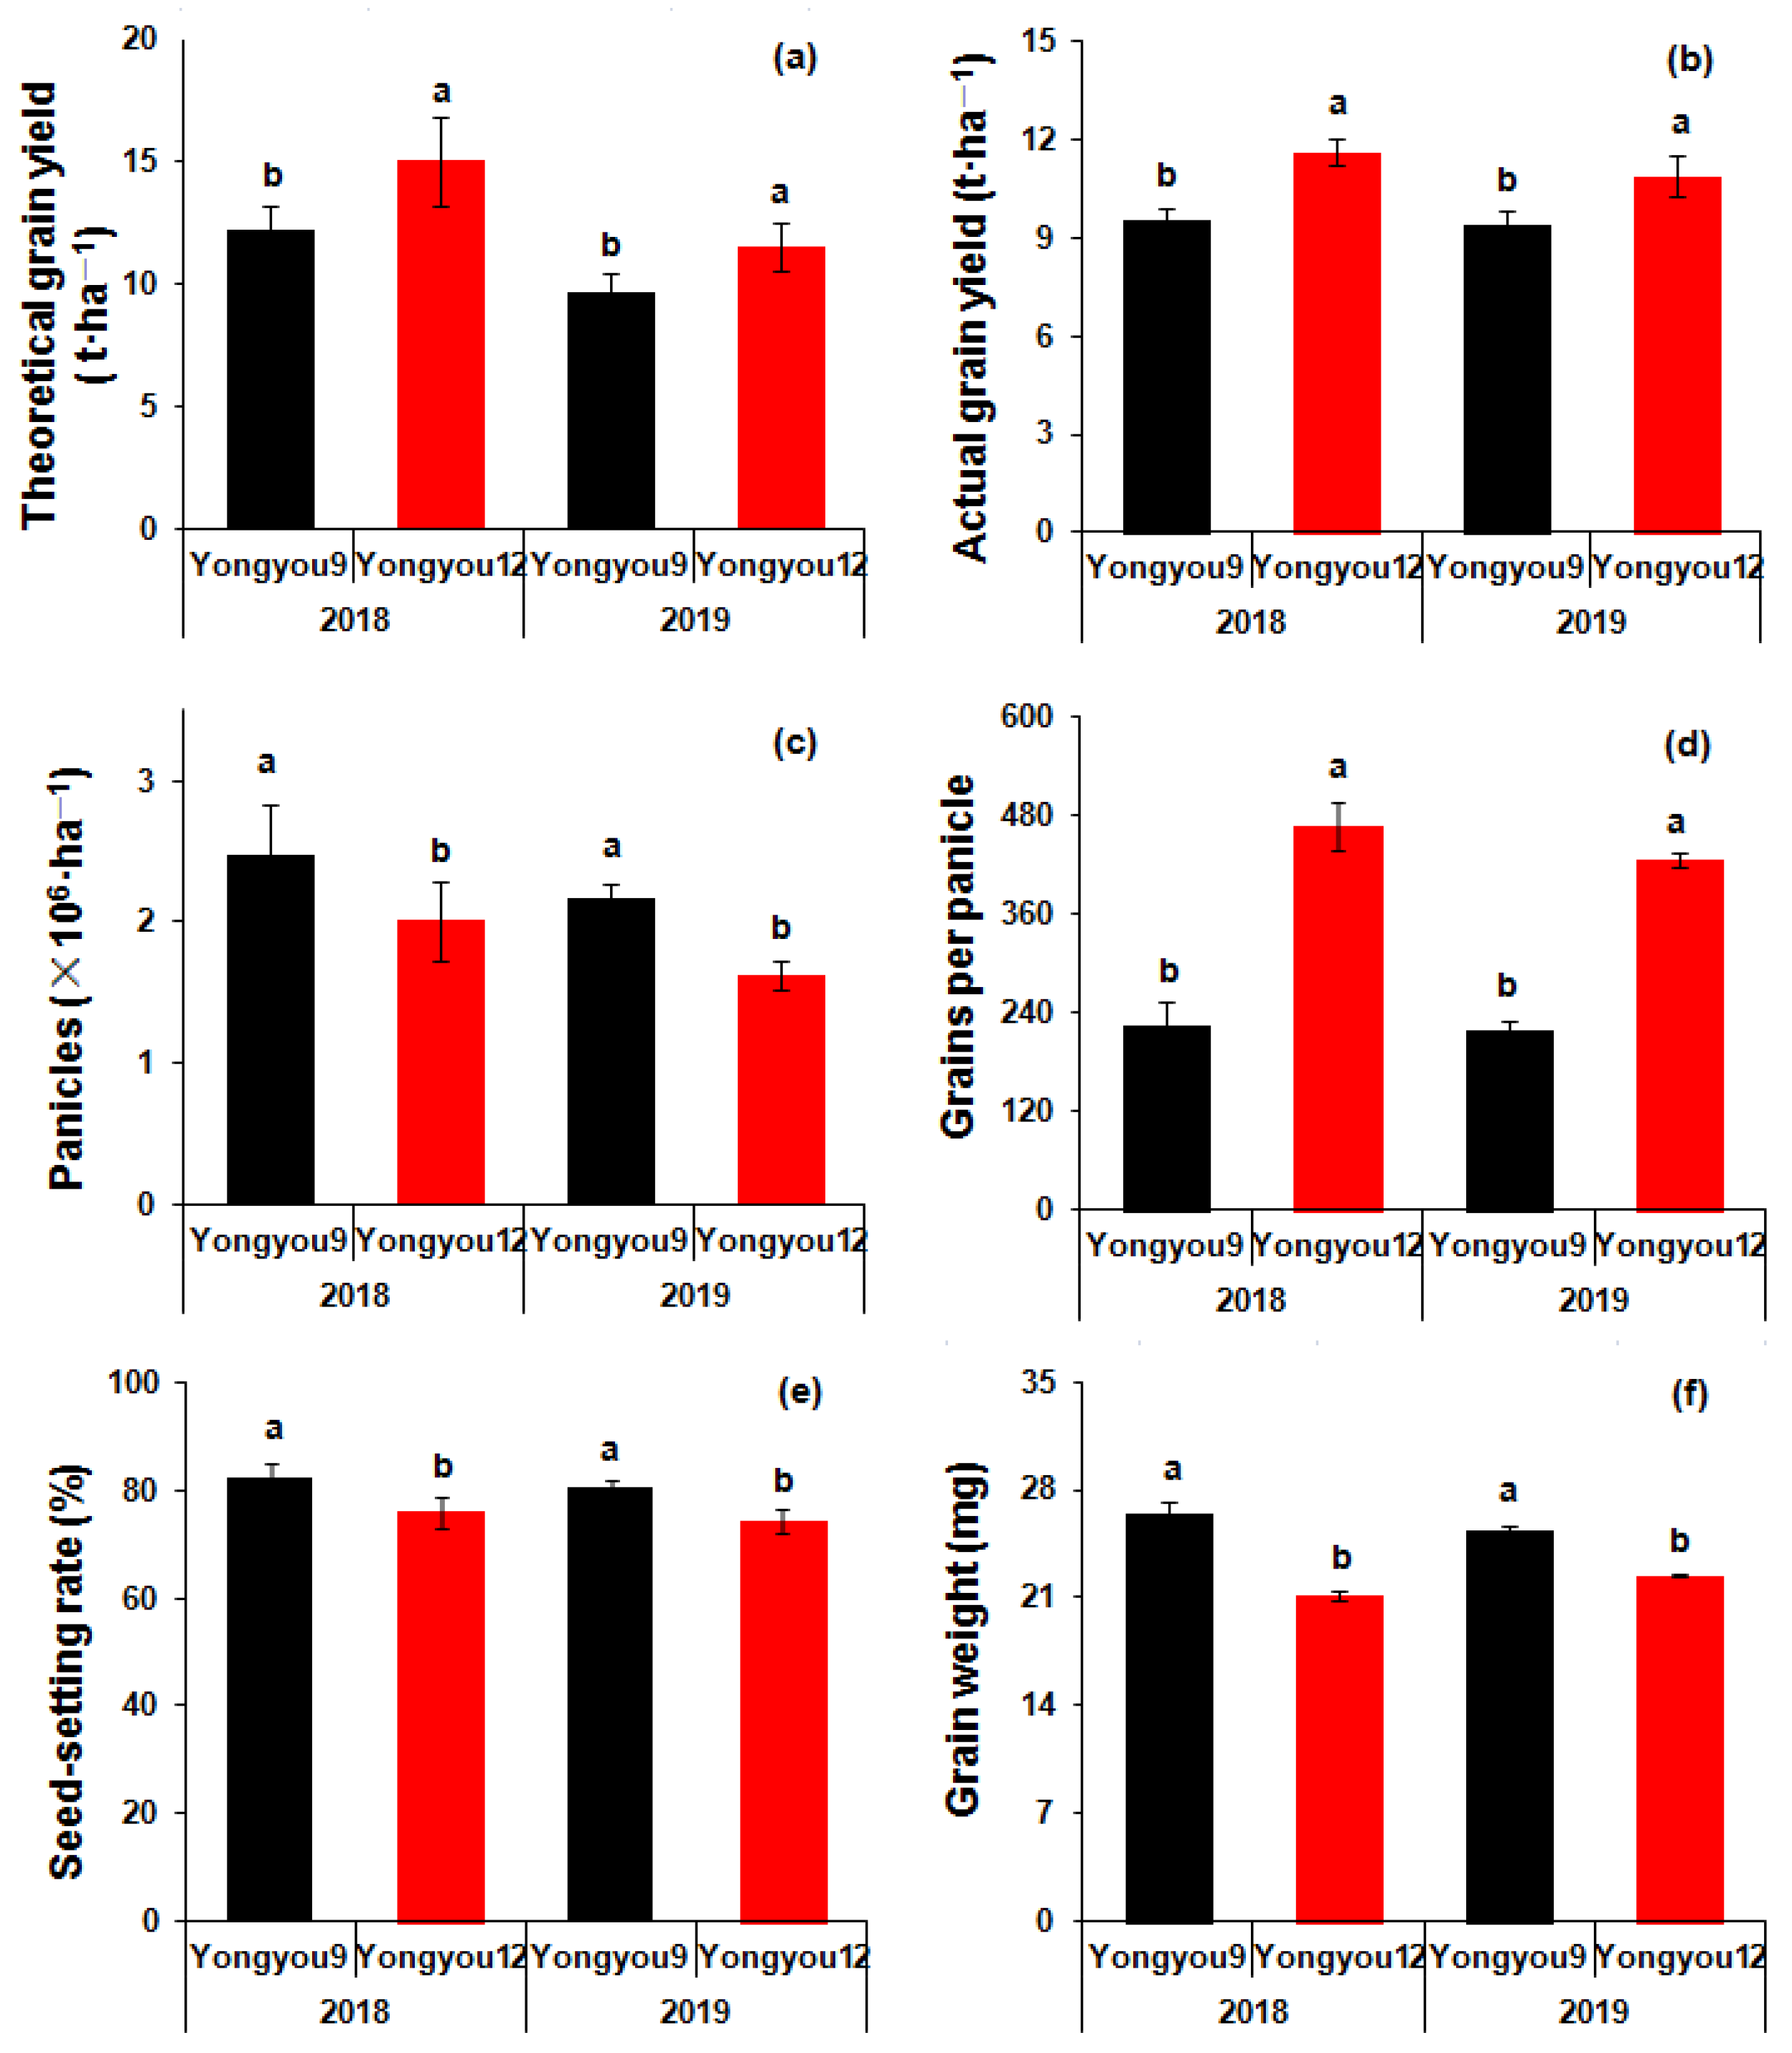
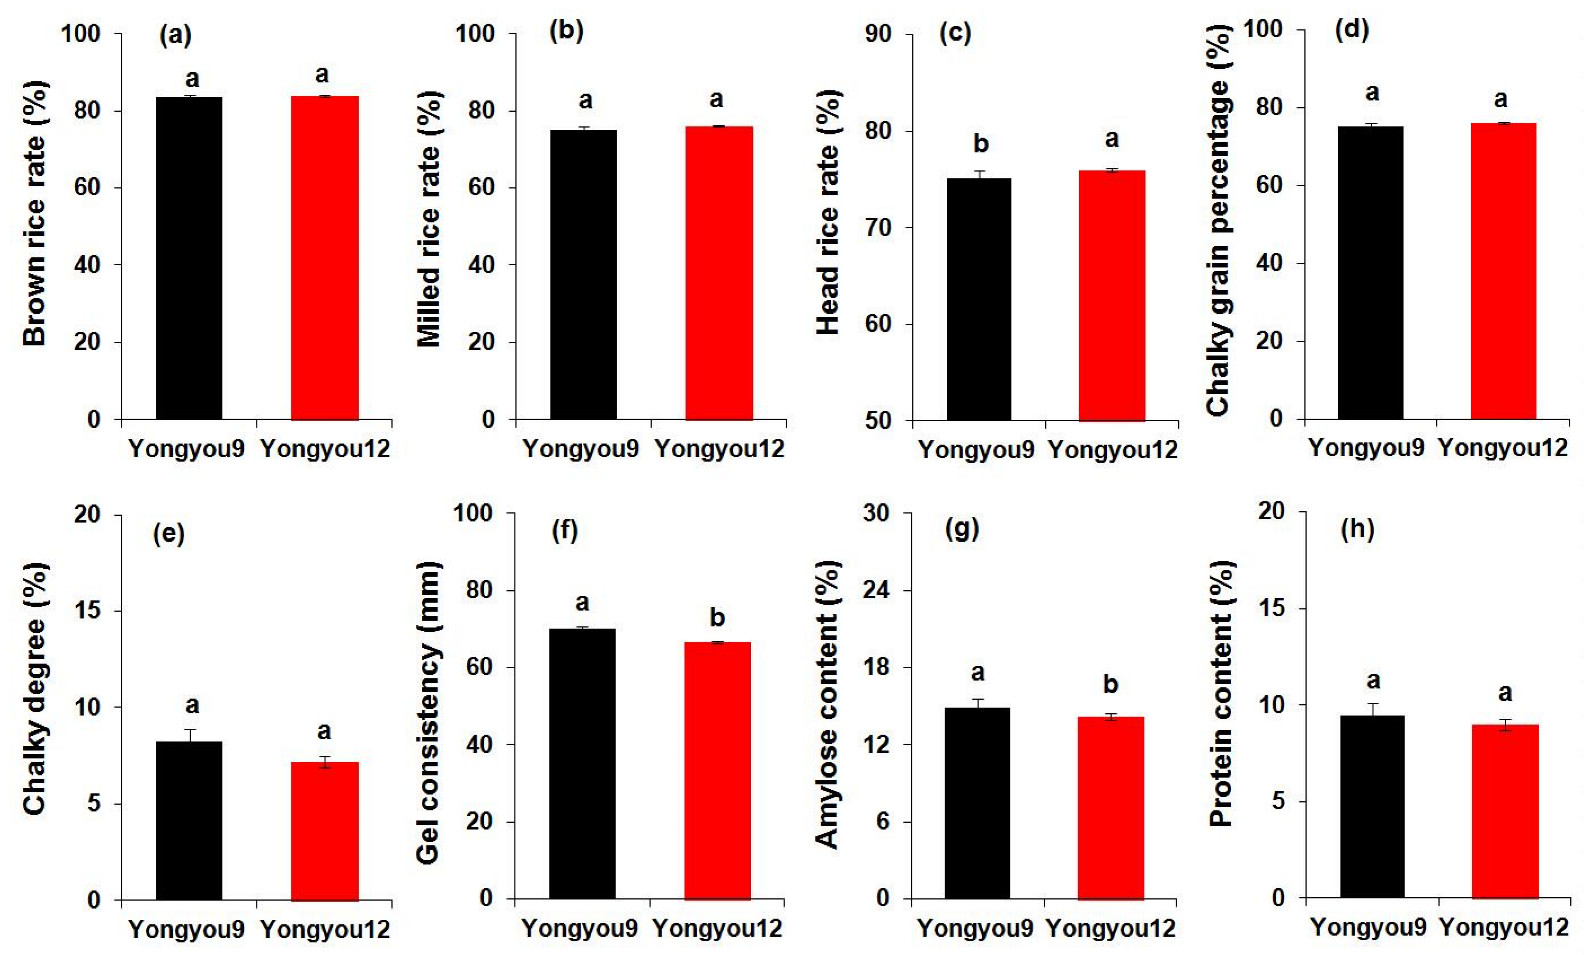
3.1. Grain Yield and Rice Quality

The mean temperature across the whole rice growth stage was 26.6 °C in 2018 and 26.3 °C in 2019, and there were no extreme high or low temperatures that could induce significant temperature stress (Figure 1c). Those climate conditions were generally favorable for growth and development of rice. The theoretical and actual grain yields of Yongyou12 averaged 13.27 t/hm2 and 11.27 t/hm2, significantly higher than those of Yongyou9 by 21.4–23.4% in 2018 and 16.1–19.4% in 2019 (Figure 2a,b). Effective panicle numbers of Yongyou12 were 18.9% lower than those of Yongyou9 in 2018 and 25.0% lower in 2019 (Figure 2c). The seed-setting rate and grain weight of Yongyou12 were also significantly lower than those of Yongyou9 (Figure 2e,f). However, the number of grains per panicle of Yongyou12 was significantly higher (95.0–107.4%) than that of Yongyou9 (Figure 2d). The solar radiation was similar between two experimental years; they were, respectively, 15.5 MJ/(m2∙d) in 2018 and 15.6 MJ/(m2∙d) in 2019 (Figure 1a). Thus, the lower grain yield in 2019 than 2018 might be due to the higher rainfall during the whole rice-growing period in 2019 than 2018 (Figure 1b).
Yongyou12 had a higher brown rice rate, milled rice rate, and head rice rate than Yongyou9, although only the difference in head rice rate was significant (Figure 3a–c). The chalky grain rate of Yongyou12 was higher than that of Yongyou9. The chalky degree of Yongyou12 was lower than that of Yongyou9, but this difference was not significant (Figure 3d,e). The gel consistency and amylose content of Yongyou12 were significantly lower than those of Yongyou9 by 5.3% and 4.9%, respectively (Figure 3f,g). In addition, there was no obvious difference in protein content between the two varieties (Figure 3h). Some other supplementary indicators of rice quality, including grain length, alkali-spreading value, and transparency are listed in Table S2 for reference.

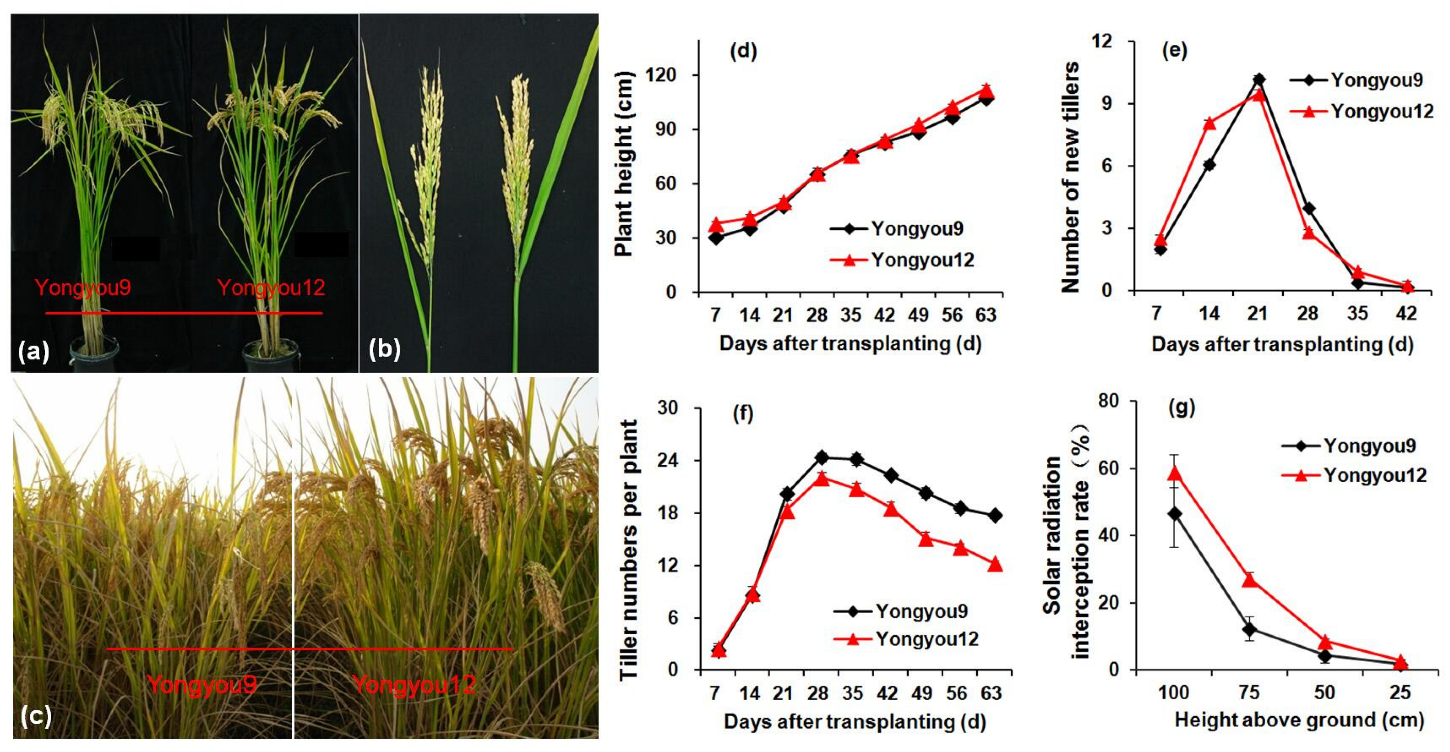
3.2. Plant Morphology and Tillering Dynamics

The plant height of Yongyou12 was slightly higher than that of Yongyou9 (Figure 4a,c,d). Compared with the pendulous leaf morphology and remarkably accelerated leaf senescence of Yongyou9, the flag leaf of Yongyou12 showed a deeper dark green color and a more upright morphology (Figure 4a,c). Consistent with these differences, the light interception rate of the lower layer was significantly higher in Yongyou12 than in Yongyou9 at the late growth stage (Figure 4g). Although the panicle length of Yongyou12 was shorter than that of Yongyou9, the spikelet density was significantly greater (Figure 2d and Figure 4b). New tiller numbers were significantly higher in Yongyou12 than in Yongyou9 from 0–21 days after transplant, but effective tiller numbers were lower than in Yongyou9 (Figure 4e,f).

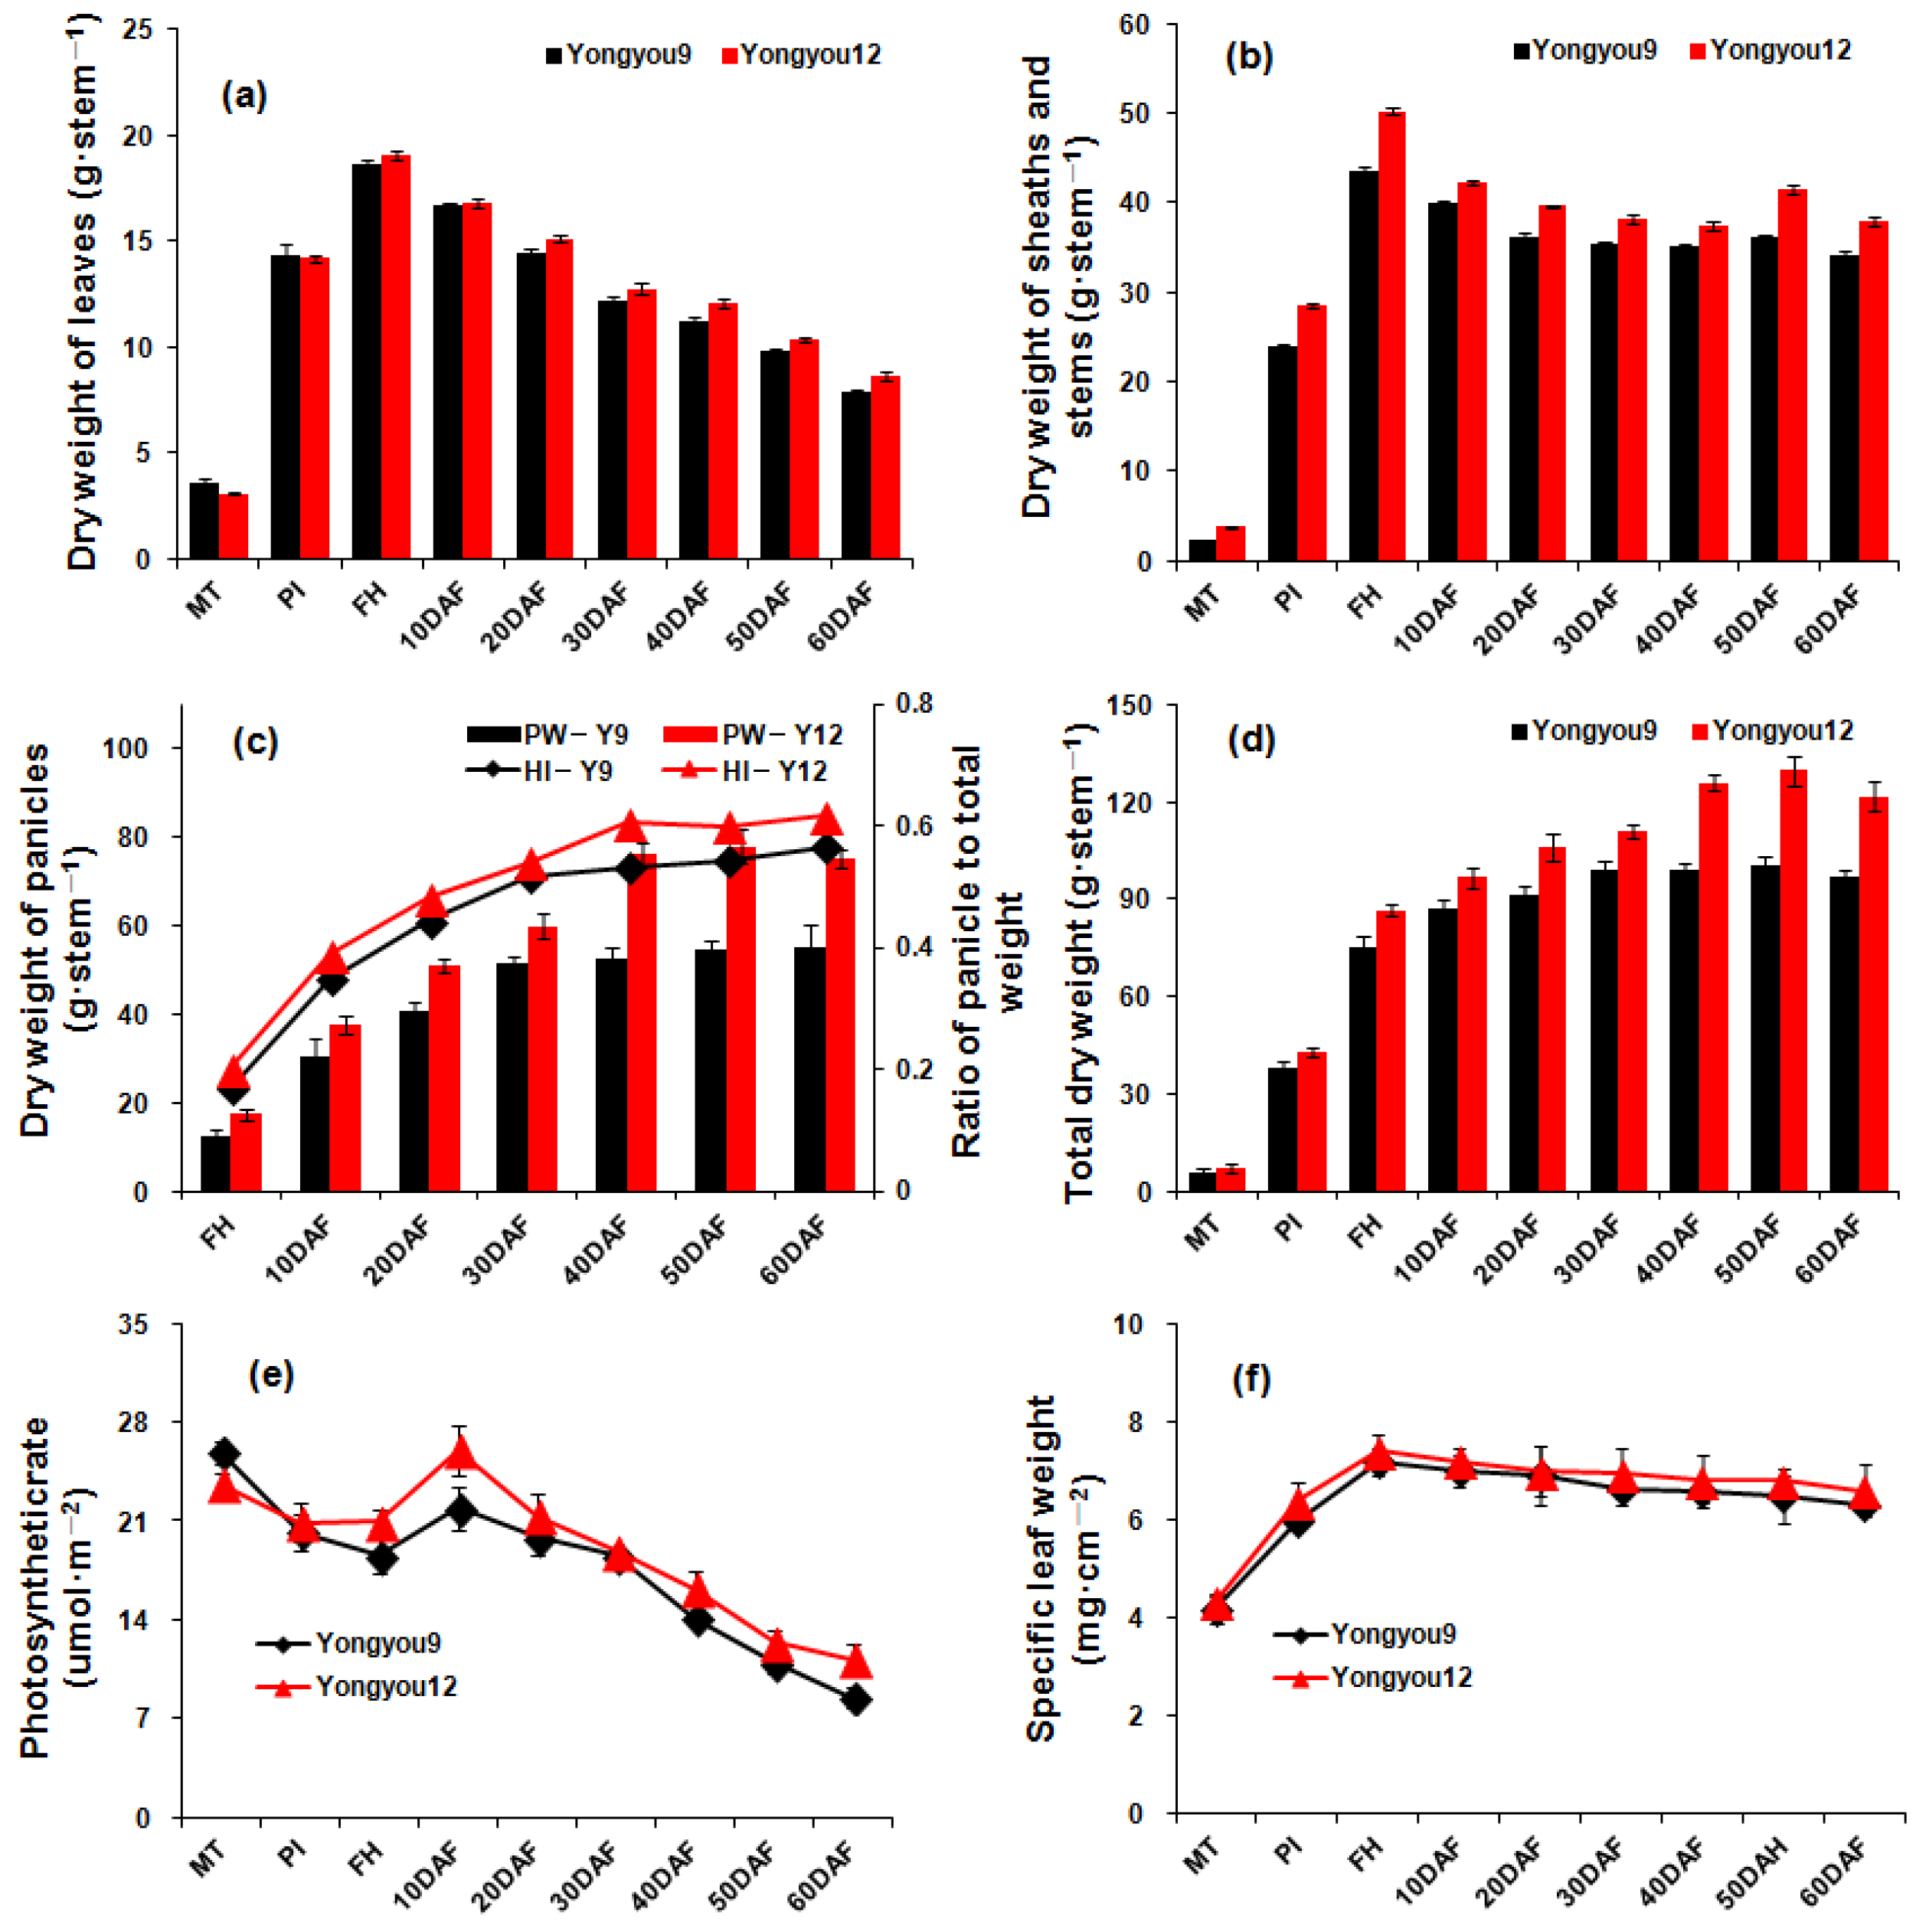
3.3. Production and Accumulation of Photoassimilates

As the growth stage advanced, the leaf dry weights in Yongyou12 and Yongyou9 increased before heading and decreased after heading (Figure 5a). Leaf dry weight was significantly higher in Yongyou12 than in Yongyou9 only after heading, whereas stem and sheath dry weights were significantly higher in Yongyou12 during the entire measurement period (Figure 5a,b). Similarly, panicle dry weight, total dry weight, and the ratio of panicle weight to total weight (harvest index) were always significantly higher in Yongyou12 than in Yongyou9, especially during the late grain-filling stage (Figure 5c,d). The net photosynthetic rate showed no significant difference between two varieties until the full-heading stage. It increased thereafter and reached the peak at 10 DAF and then decreased slowly in both varieties. Yongyou12 always kept a relatively higher photosynthetic rate than Yongyou9 during the whole grain-filling stage, while in most dates these differences were significant (Figure 5e). The specific leaf weight of Yongyou12 was slightly higher than that of Yongyou9, although this difference was not significant, and specific leaf weight increased until full heading and then gradually decreased (Figure 5f).

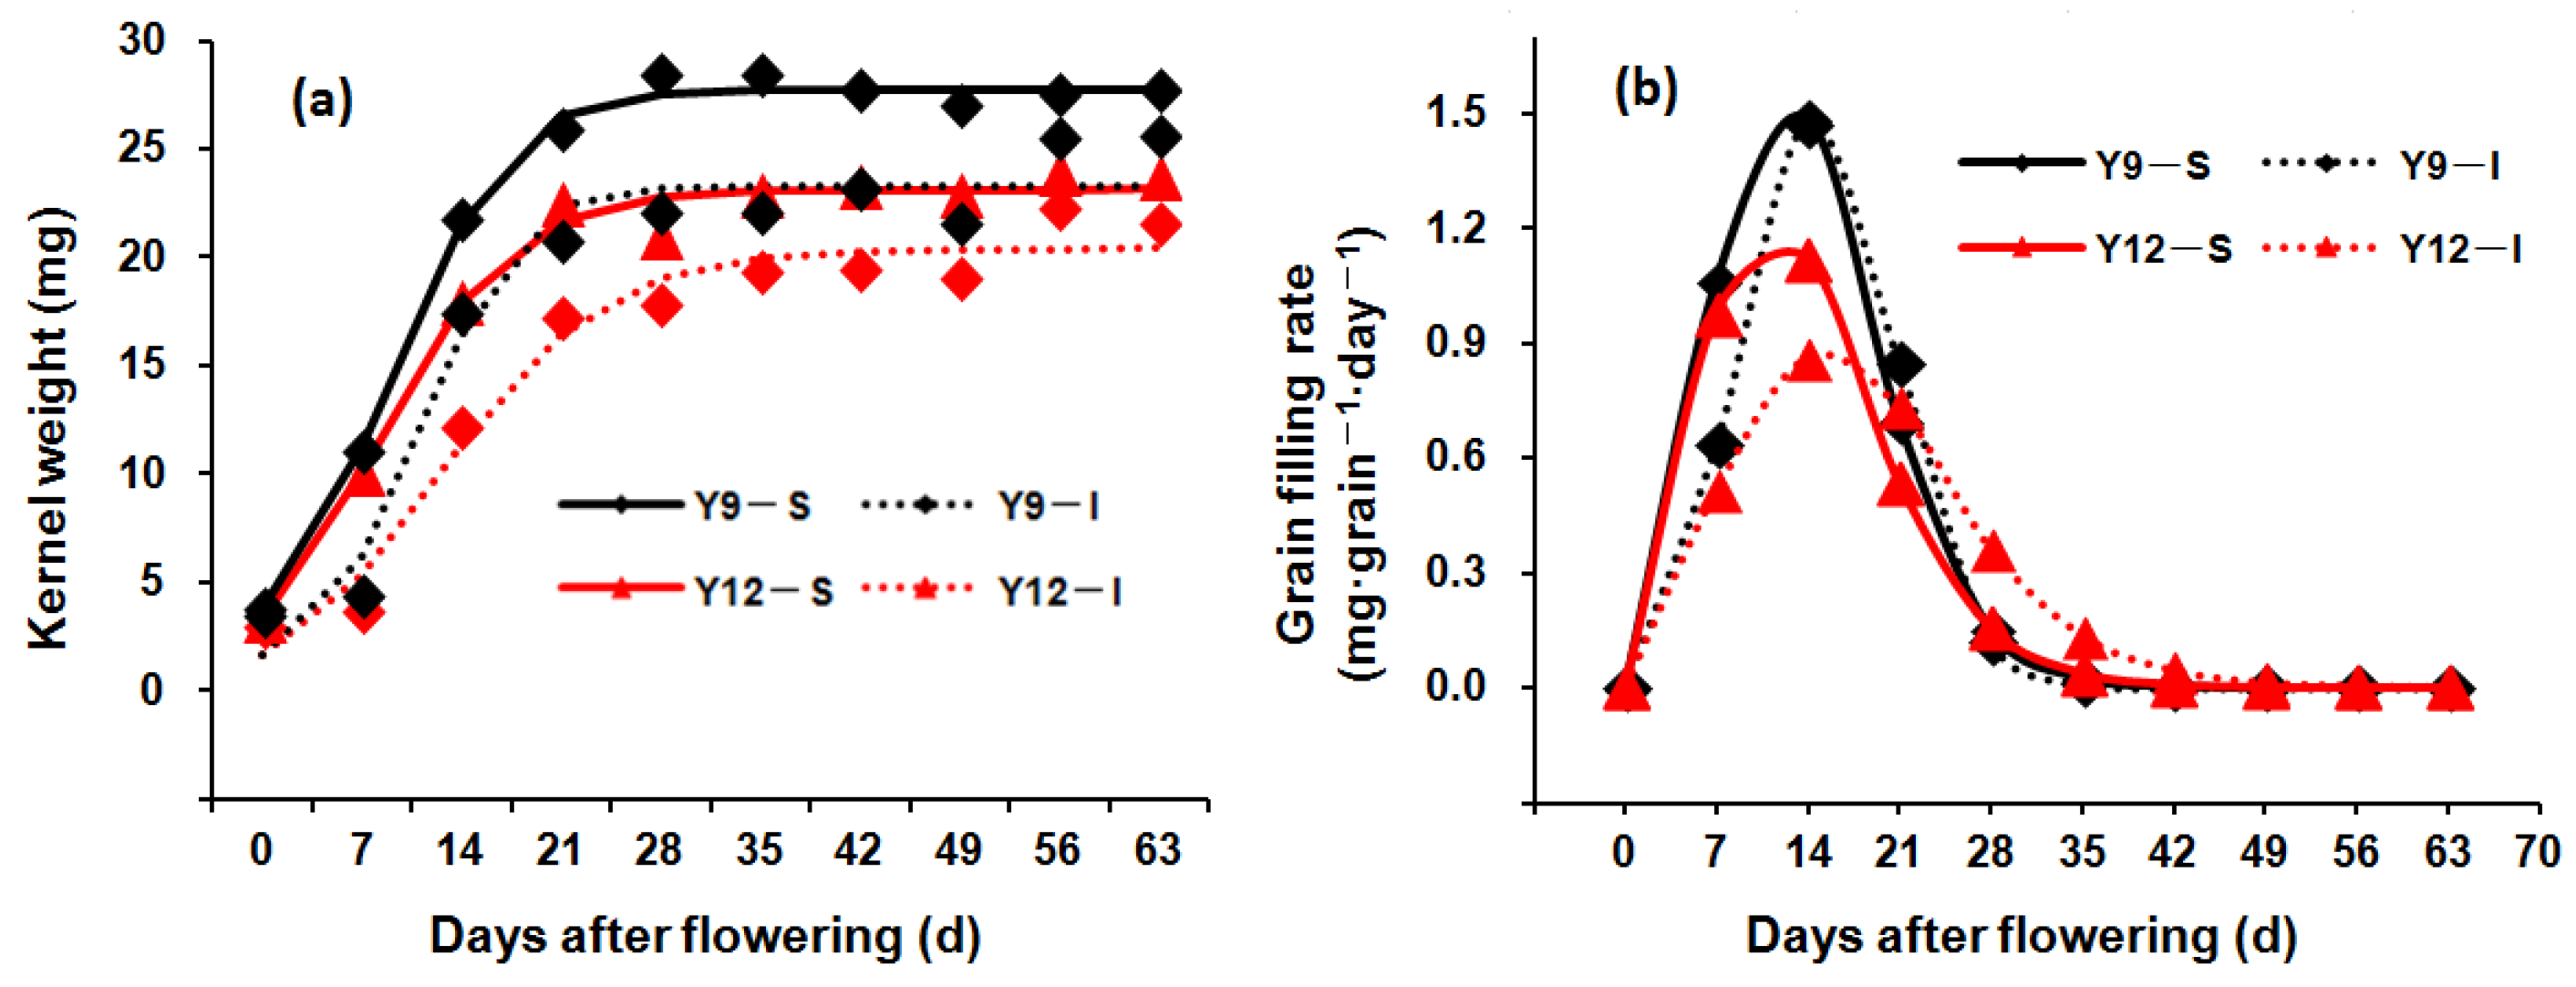
3.4. Grain-Filling Characteristics
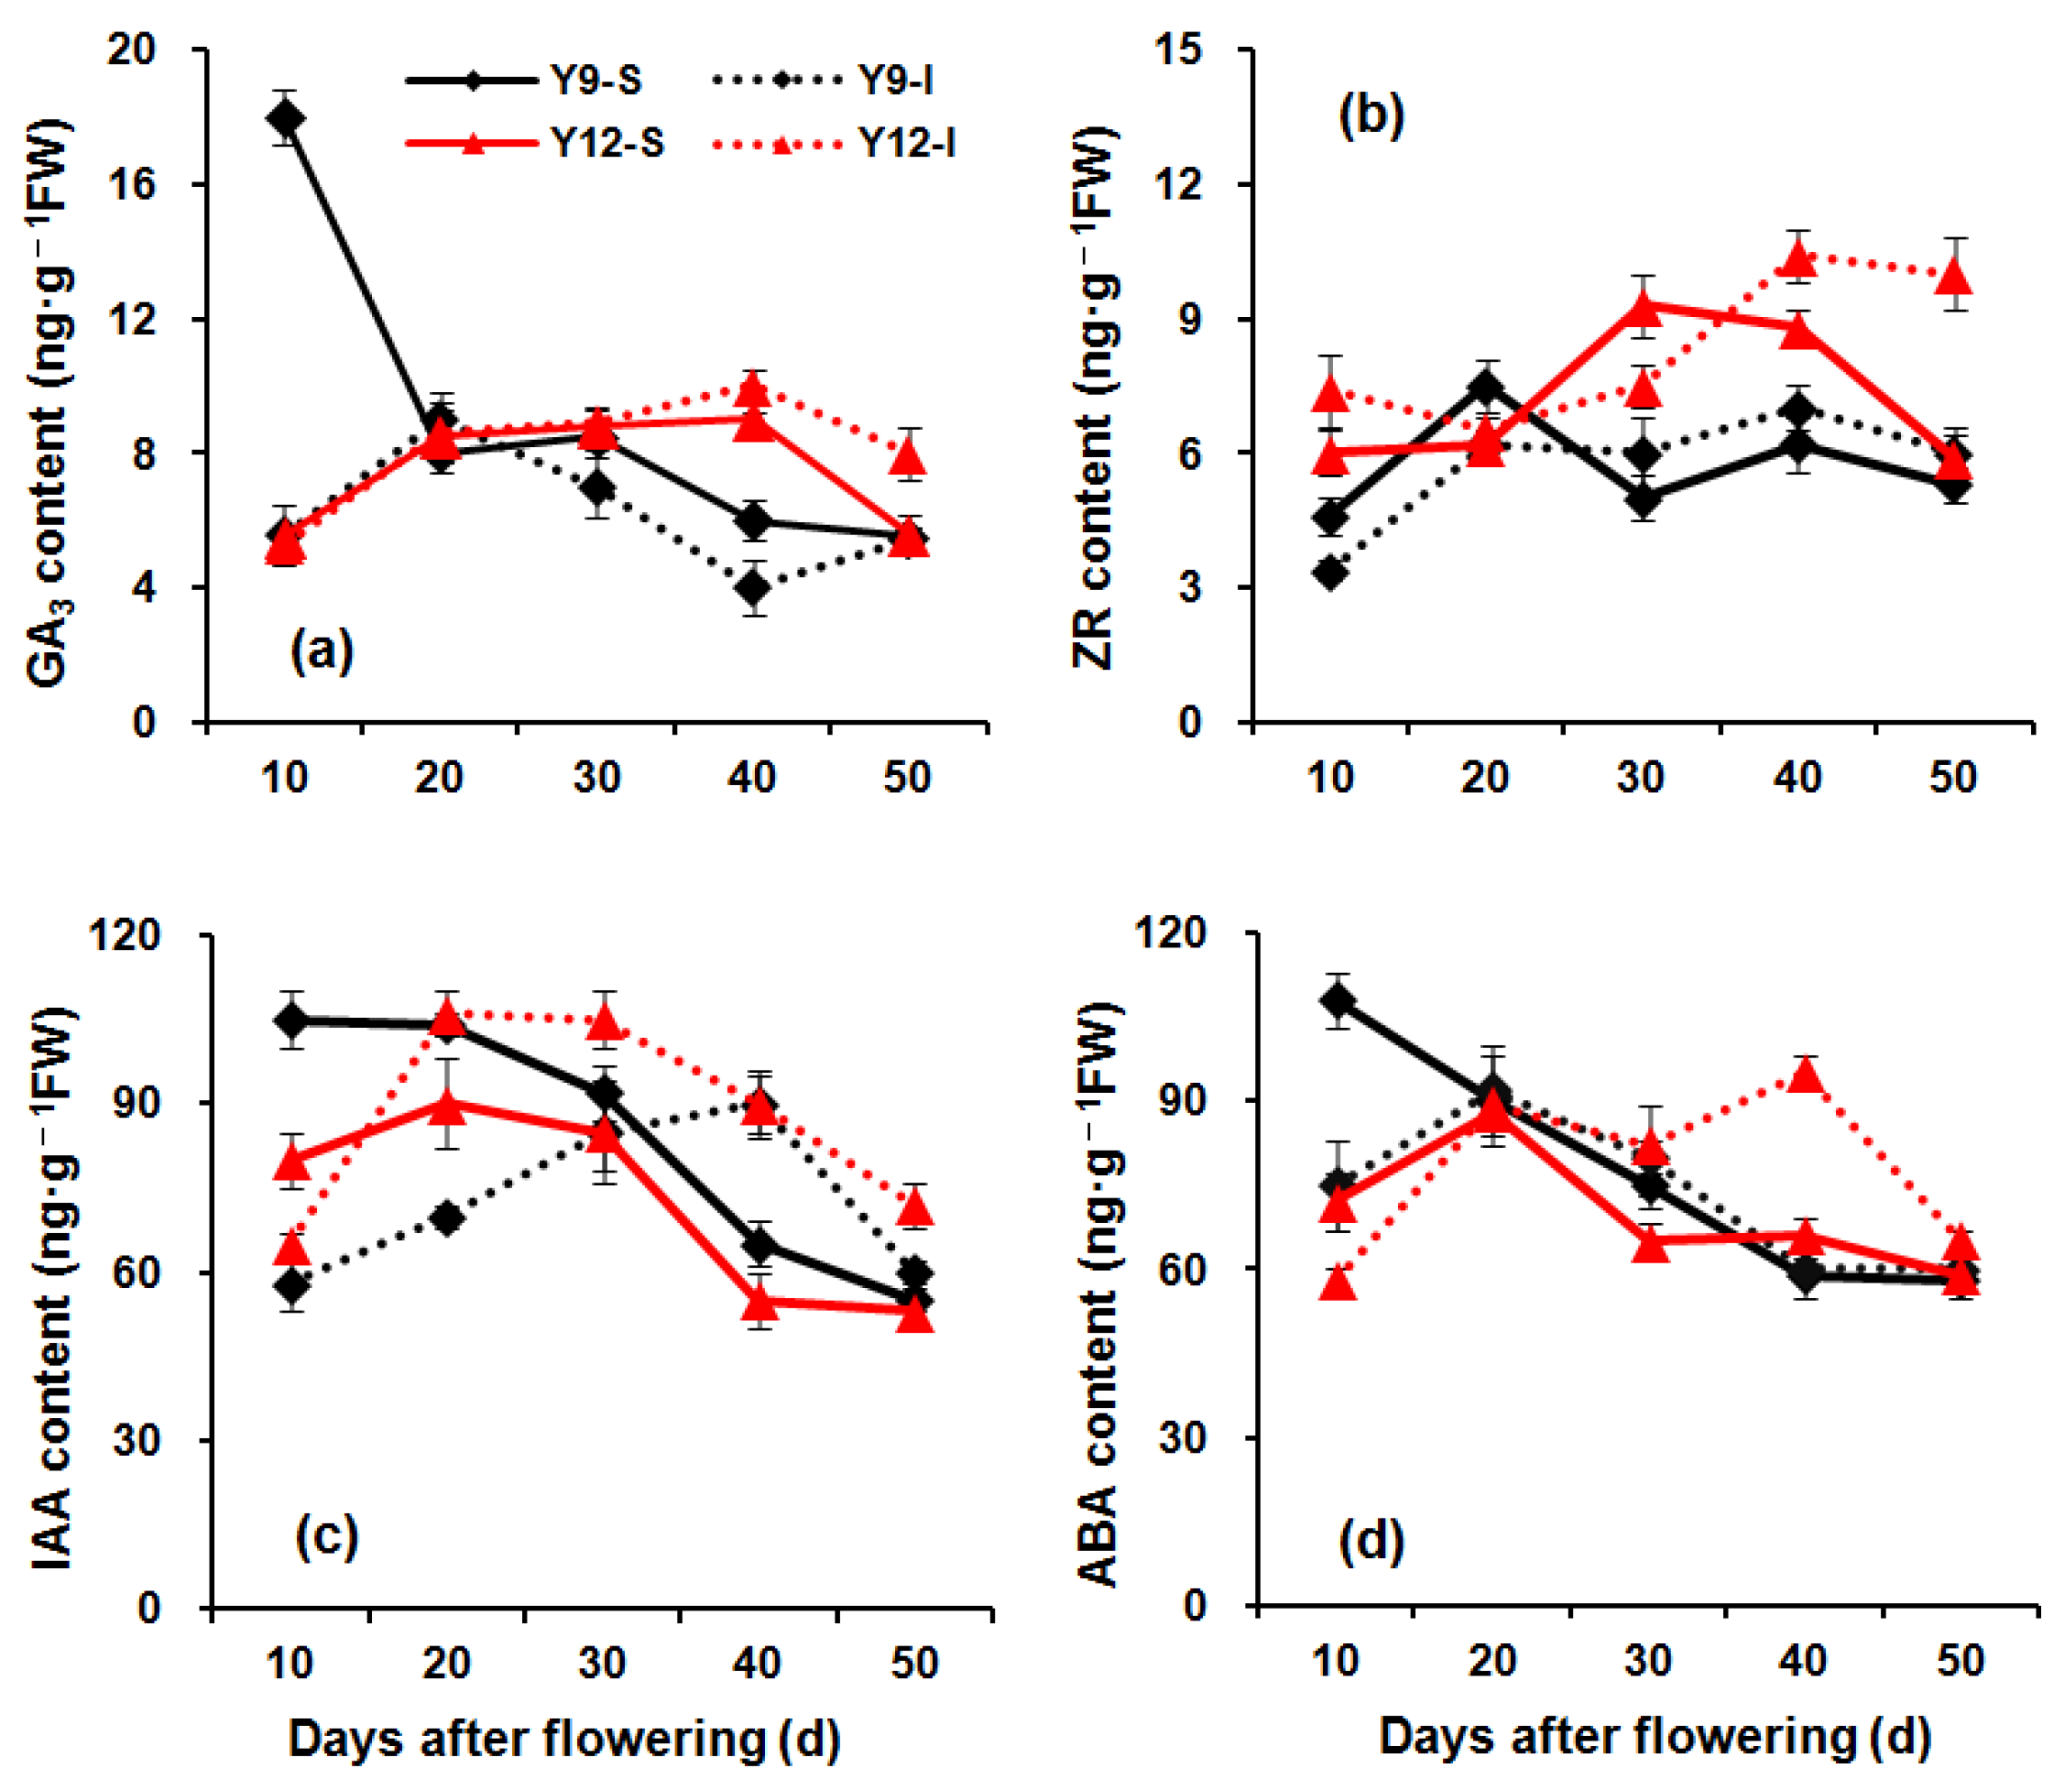
Grain-filling parameters were fitted well by Richards’ equation with a coefficient of determination (R2) ranging from 0.977 to 0.998 (Table 1). The differences between the final grain weight (A value) of the superior and inferior grains of Yongyou12 and Yongyou9 were 2.71 g and 4.50 g, respectively. Based on the grain-filling dynamics, we can see that the grain weight and filling rate of the superior and inferior grains were significantly higher in Yongyou9 than in Yongyou12 (Figure 6). The superior and inferior grains of Yongyou9 and Yongyou12 all reached a maximum grain-filling rate at 14 DAF. The grain-filling rate of Yongyou9 decreased sharply and was basically 0 after 35 DAF. The grain-filling rate of inferior grains in Yongyou12 decreased relatively slowly compared with the others (Figure 6b). In the early grain-filling stage, the grain-filling rate of Yongyou9 was higher than that of Yongyou12, but this pattern was reversed at the late grain-filling stage (from 28 DAF to harvest).

3.5. Plant Hormones

In general, the hormone contents of inferior grains of Yongyou12 were higher than that of superior grains, whereas the relative hormone contents of Yongyou9 superior and inferior grains differed depending on the grain-filling period (Figure 7). The GA3 content was significantly higher in superior and inferior Yongyou12 grains than in Yongyou9 grains at 40 DAF, but GA3 differences were not significant at most times during grain filling (Figure 7a). The ZR content was significantly higher in superior and inferior Yongyou12 grains than in Yongyou9 grains, except at 20 DAF (Figure 7b). The IAA content in Yongyou12 first increased and then decreased as grain filling proceeded. The IAA content in inferior grains of Yongyou9 showed a similar pattern, although IAA content peaked later in the grain-filling period (Figure 7c). By contrast, the IAA content in superior grain of Yongyou9 declined continuously throughout the whole grain-filling period. Differences in the content of IAA between superior and inferior grains were greater than those of other hormones. Inferior grains of Yongyou9 had ABA contents comparable to those of superior grains, although this difference was not significant at most time points (Figure 7d). The ABA content of superior grain in Yongyou12 was similar to that in Yongyou9. By contrast, the ABA content of inferior grain in Yongyou12 was lowest at initial grain filling and significantly higher at late grain filling (Figure 7d).

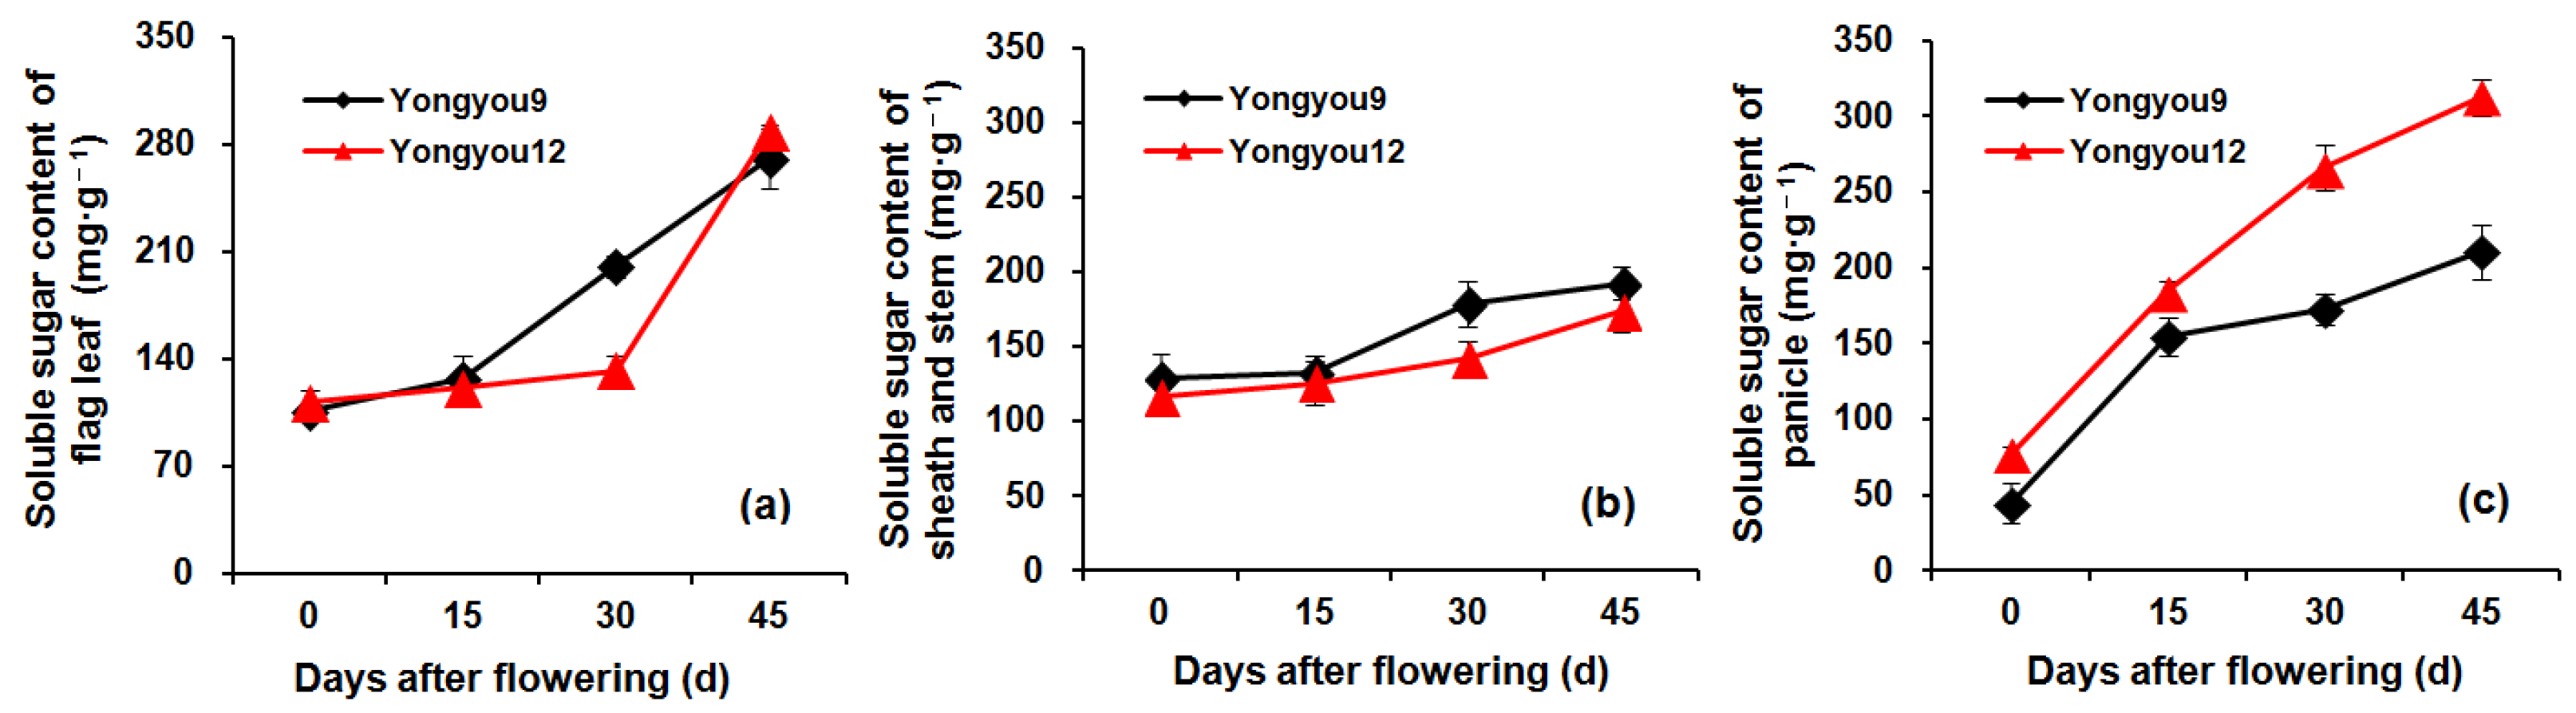
3.6. Soluble Sugar Content

As grain filling progressed, soluble sugar content increased in flag leaves of both rice varieties (Figure 8). Except at 30 DAF, there was little difference in leaf soluble sugar content between the varieties (Figure 8a). The soluble sugar content of Yongyou9 stems and sheaths was higher than that of Yongyou12 during the entire grain-filling period, especially at 30 DAF, and this difference reached a significant level (Figure 8b). By contrast, the grain soluble sugar content was significantly higher in Yongyou12 than in Yongyou9 throughout the grain-filling period, particularly at 30–45 DAF (Figure 8c).

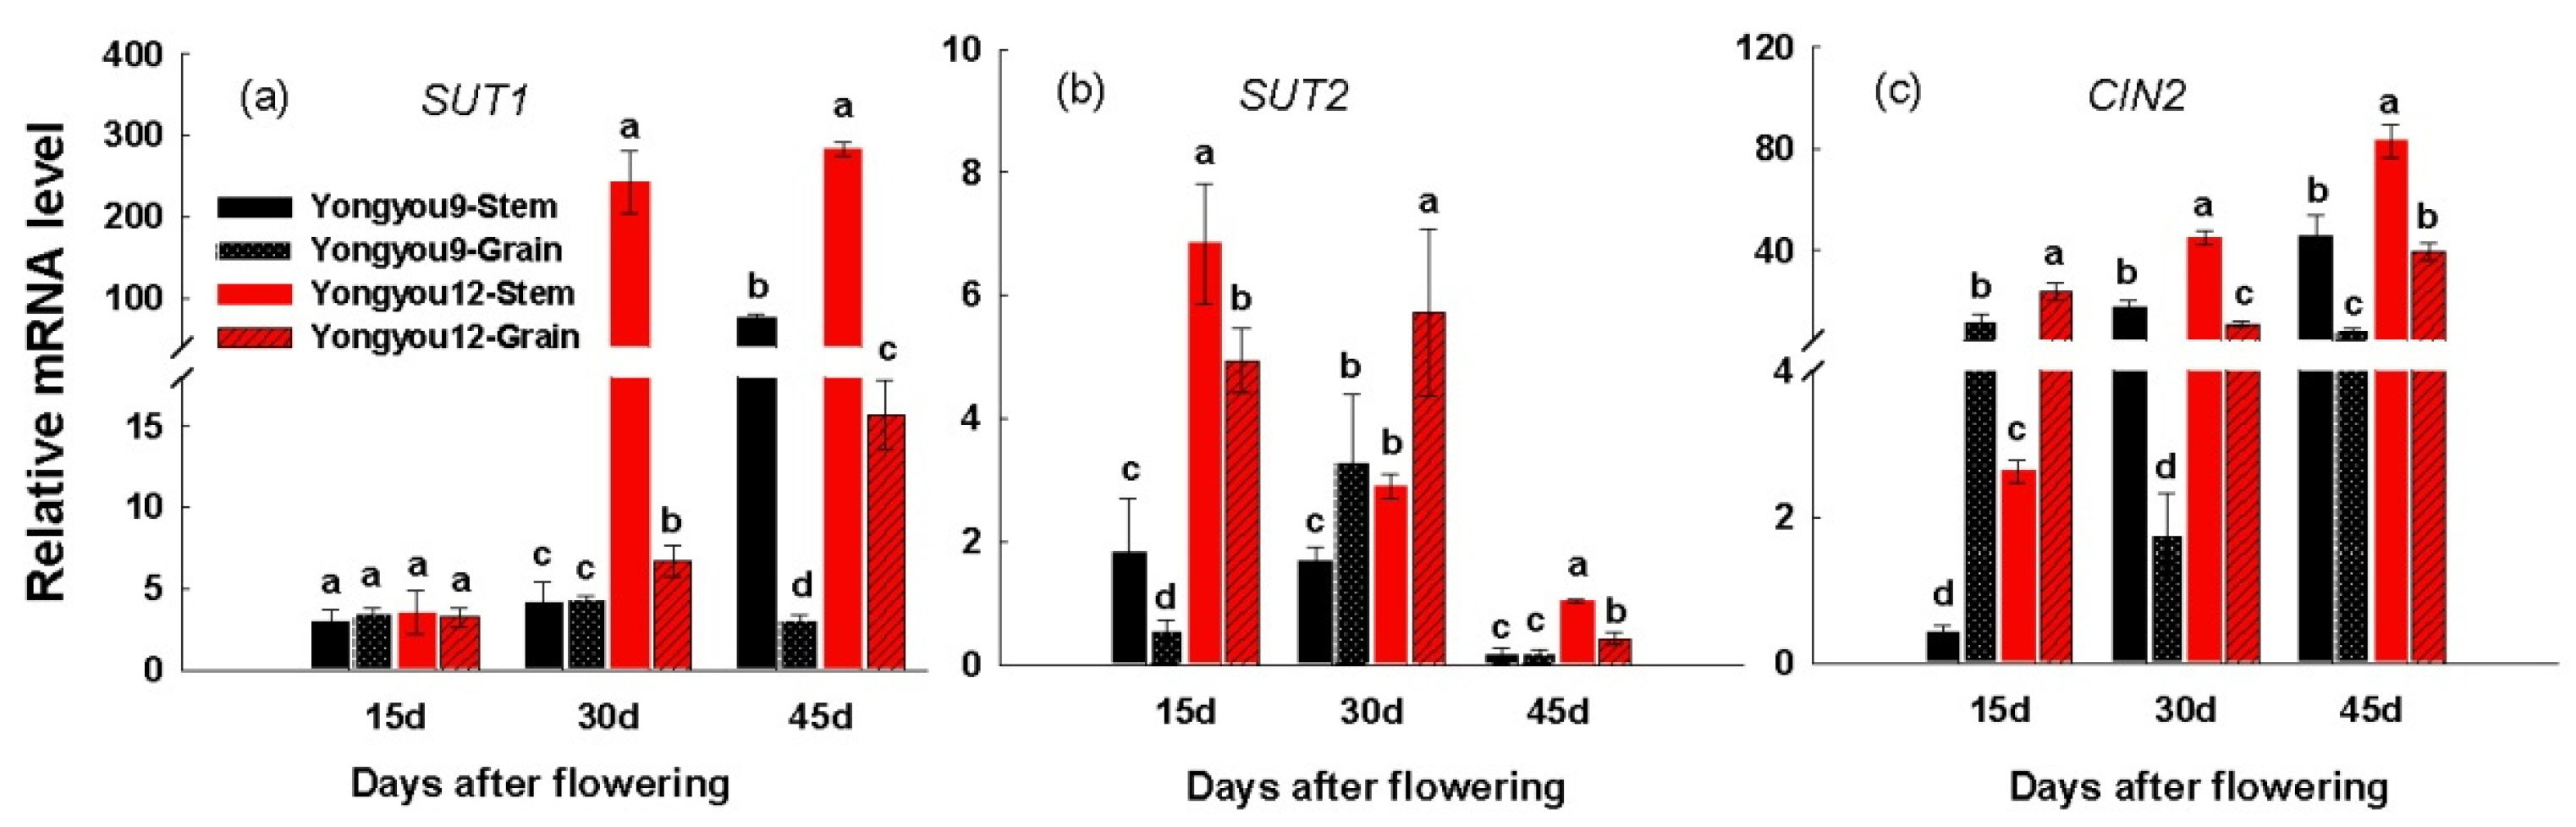
3.7. Gene Expression of SUT and Cell Wall Invertase Genes

Figure 9 shows the relative expression of genes encoding the sucrose transporters, SUT1 and SUT2, as well as the cell wall invertase, CIN2, in rice stems and grains during the grain-filling stage. The expression level of SUT1 was similar in both varieties at 15 DAF, but it was significantly higher in Yongyou12 than Yongyou9 at 30 to 40 DAF (Figure 9a). In contrast to SUT1, the expression level of SUT2 was higher in the early stage of filling and lower in the later stage. However, SUT2 expression was still significantly higher in Yongyou12 than in Yongyou9 (Figure 9b). Expression of CIN2 was significantly higher in Yongyou12 than inYongyou9 at 15–45 DAF (Figure 9c). In both stem sheaths and grains, the expressions of SUT1, SUT2, and CIN2 were almost always significantly higher in Yongyou12 than in Yongyou9 on a given measurement date.

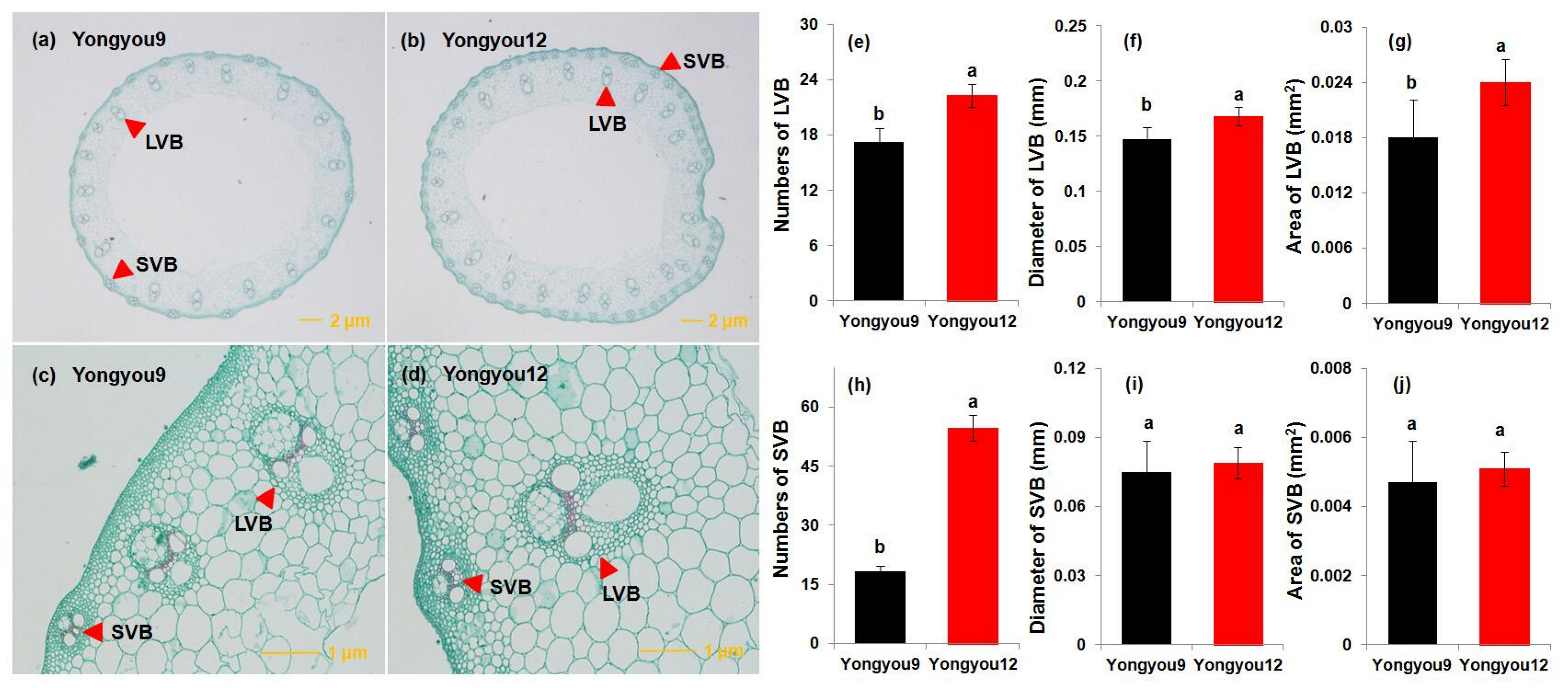
3.8. Number and Size of Vascular Bundles

The number and size of vascular bundles in the panicle neck internode of Yongyou12 and Yongyou9 are shown in Figure 10. The numbers of large (LVB) and small (SVB) vascular bundles in the panicle neck internode were significantly higher in Yongyou12 than in Yongyou9 (Figure 10a,b,e,h). In particular, the number of small vascular bundles was almost three-fold higher in Yongyou12 (Figure 10h). The mean diameter of LVB in the panicle neck internode was significantly larger in Yongyou12 than in Yongyou9, and the area of the LVB showed the same trend (Figure 10f,g). There were no clear differences in the diameter or area of the SVB between the two varieties (Figure 10i,j).

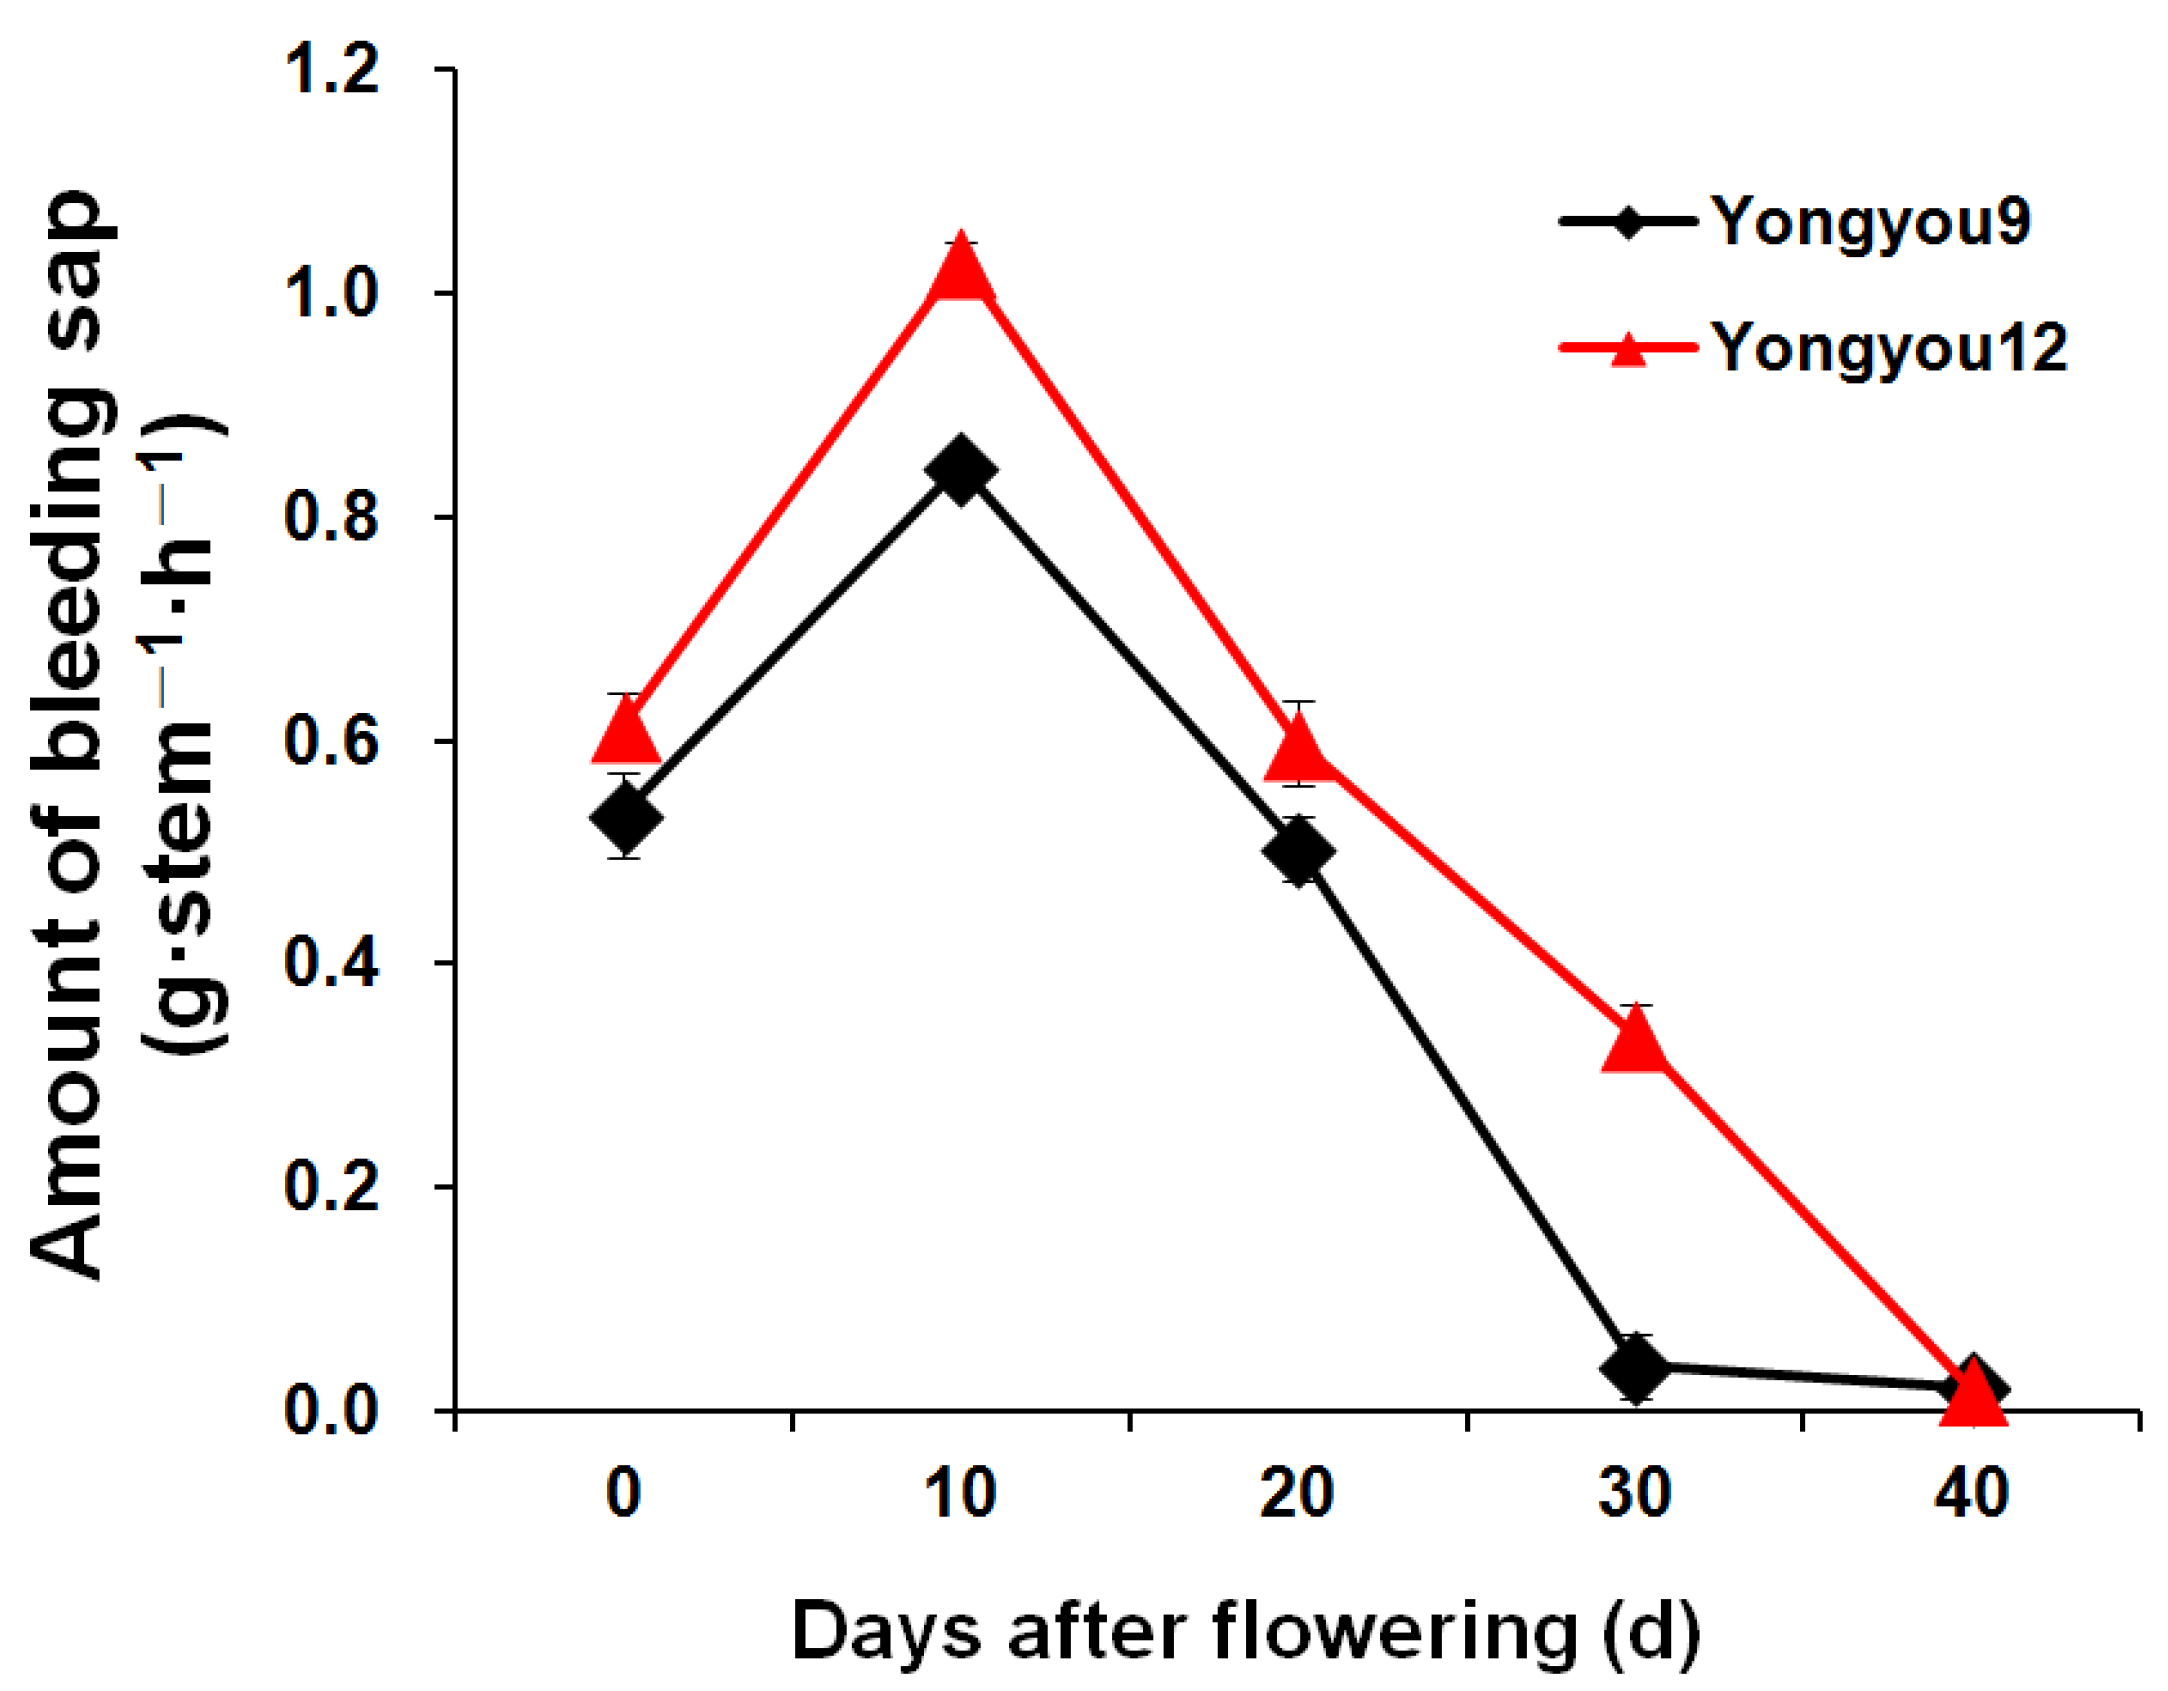
3.9. Root-Bleeding Sap

Changes in root injury flow through time were basically the same for both cultivars, and the highest values were recorded at 10 DAF (Figure 11). However, Yongyou12 produced more root-bleeding sap than Yongyou9 throughout most of the grain-filling period. The largest difference in root-bleeding sap between the two varieties was observed during late grain filling at 30 DAF, and values then declined to a minimum at 40 DAF for both varieties. In addition, root system senescence occurred earlier and faster in Yongyou9 than in Yongyou12, and its root-bleeding sap was markedly decreased by 30 DAF.

3.10. Correlation of the Ratio of Panicle Weight to Total Weight/Grain Yield with the Agronomy Traits and Physiological Parameters

As it was shown in Table 2, the agronomy traits including the dry weight of leaves, panicle, sheath, and stem were very significantly and positively correlated with the ratio of panicle weight to total weight. While physiological parameters, including the net photosynthetic rate, soluble sugars in panicle, hormone contents of GA3/ZR, expression levels of SUT1/SUT2/CIN2 in stem and grain, numbers of LVB/SVB, and diameter of LVB in the panicle neck internode were correlated very significantly and positively with the ratio of panicle weight to total weight. Furthermore, these agronomy traits, physiological parameters, and the ratio of panicle weight to total weight were significantly or very significantly and positively correlated with the grain yield.

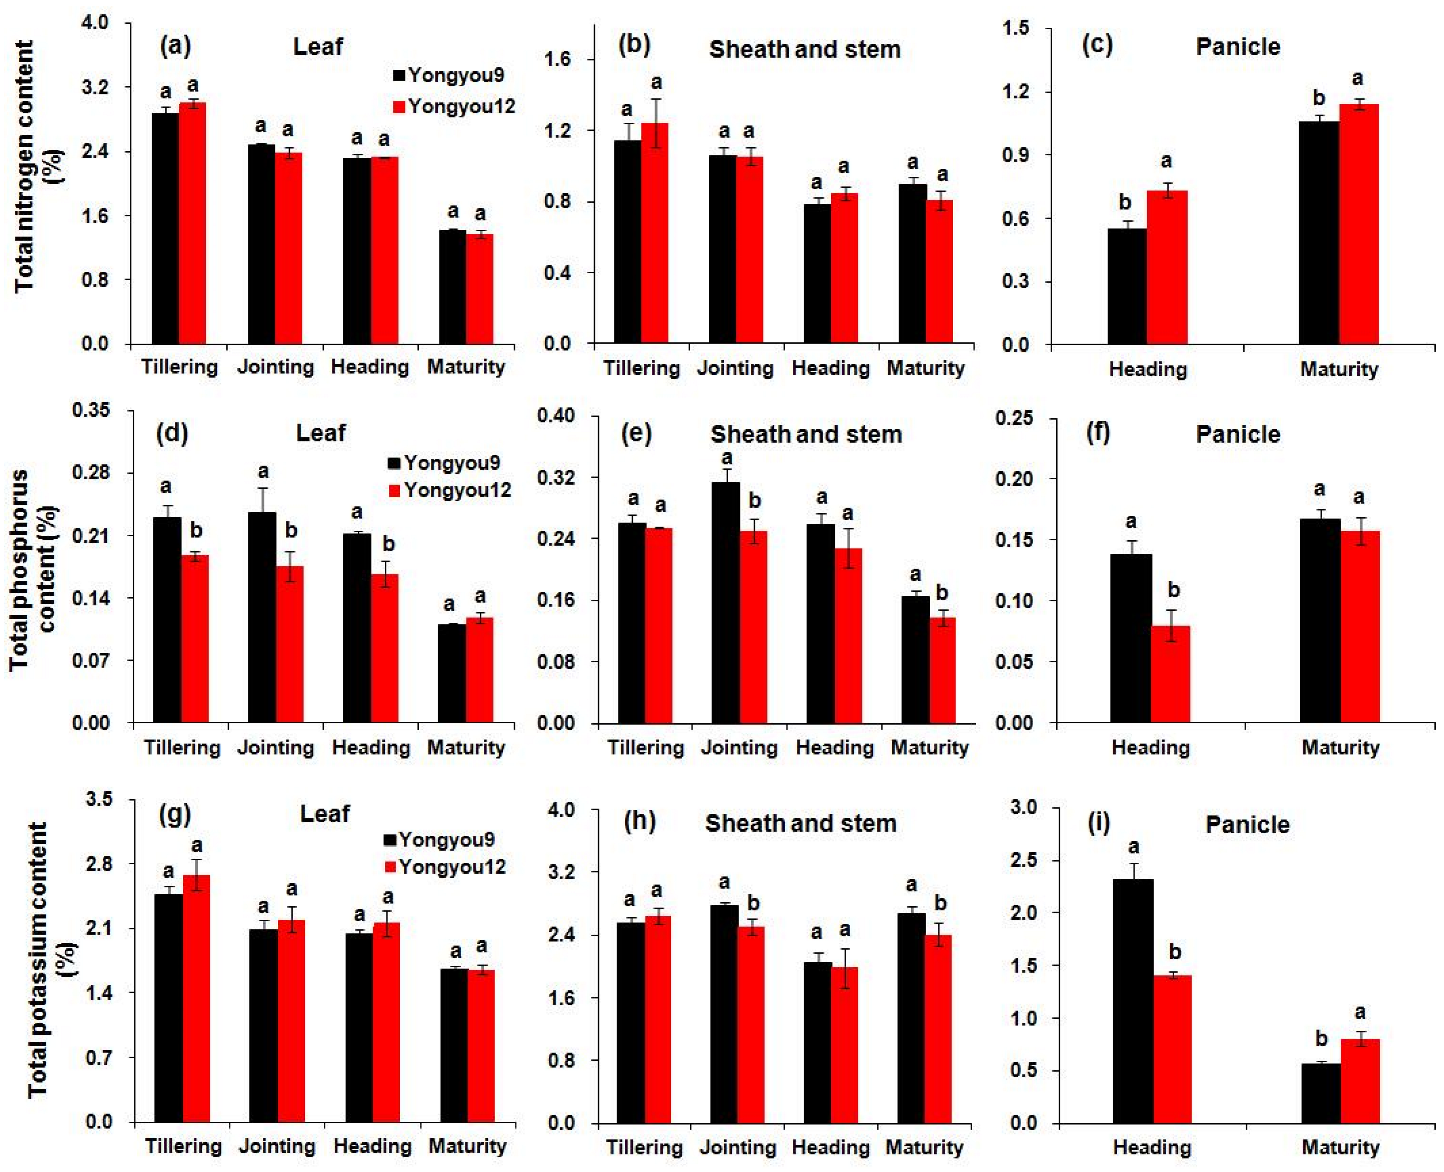
3.11. Distribution of Nitrogen, Phosphorus, and Potassium Content in Rice Plants

There was little difference between Yongyou12 and Yongyou9 in total leaf nitrogen and potassium contents, whereas the total leaf phosphorus content was significantly higher in Yongyou9 than in Yongyou12, especially from tillering to the full-heading stage (Figure 12a,d,g). There was little difference between the varieties in total nitrogen content of stems and sheaths (Figure 12b). However, the total phosphorus and total potassium contents of Yongyou9 stems and sheaths were slightly higher than that of Yongyou12, and this difference reached a significant level on some measurement dates (Figure 12e,h). The panicle nitrogen content was significantly higher in Yongyou12 than in Yongyou9 at heading and maturity (Figure 12c). By contrast, the panicle phosphorus and potassium contents were significantly lower in Yongyou12 than in Yongyou9 at heading. The difference in panicle potassium content was reversed at maturity, but there was no significant difference in panicle phosphorus content at maturity (Figure 12f,i).

4. Discussion

Increasing the rice yield per unit area is one of the most important means by which both our country and the world can guard against a future food crisis. This experiment showed that the yield potential of super rice Yongyou12 was clearly and significantly higher than that of Yongyou9 (16.1% to 21.4%) (Figure 2a,b). Undoubtedly, the larger number of grains per panicle in Yongyou12 was the main factor that accounted for its significantly higher yield, and this trait made up for its deficiencies in panicle number per plant, seed-setting rate, and grain weight (Figure 2). Moreover, the smaller difference in relative grain weight between superior and inferior grains could also have contributed to high yield formation in Yongyou12 (Figure 2 and Figure 6a). According to previous research, many rice varieties that have large panicles complete the grain-filling process asynchronously because of their superior and inferior grains [32,33,34]. Although the grain-filling rate of inferior grains was lower than that of superior grains in Yongyou12 and all grains in Yongyou9, the decrease in filling rate was slow, and grain filling remained vigorous during the late grain-filling period (Figure 6b). Hormones, including GA3 and ZR, which are closely associated with grain filling, may have played a role in this phenomenon [35,36,37]. Contents of both hormones were significantly higher in inferior Yongyou12 grains than in other grains, especially at the late grain-filling stage, and their change trend was generally consistent with the grain-filling rate (Figure 6b and Figure 7b,c,d). This result agreed with previous studies in which sink capacity (total spikelet numbers) and the degree of grain filling determined yield [14,38,39]. Furthermore, the main way to increase the number of spikelets in ultra-high-yielding cultivated rice was to develop rice with large panicles [14,40,41]. In this study, we also found that new tillers originated more rapidly after transplant but were fewer in number in Yongyou12 than in Yongyou9 (Figure 4e). Possible interventions, such as greater fertilizer supply at the initiation of the tillering process, might be an option to promote panicle numbers and ultimately improve the grain yield [33,42].
Studies have shown that the process of yield formation in rice is actually the process of accumulation and transport of carbohydrates or dry matter. Hua et al. [43] showed that the rate of dry matter accumulation in an ultra-high-yield rice population was relatively slow before jointing but relatively high after jointing and after heading. Pan et al. [44] showed that an ultra-high-yield rice population accumulated more dry matter at full heading, during grain filling, and at maturity. Wang et al. [45] observed that the carbohydrate accumulation of Yongyou12 was low at the jointing stage and increased at all other growth periods thereafter. Different varieties have different patterns of dry matter accumulation. However, as a rule, the greater the dry matter accumulation from heading to maturity, the higher the ultimate grain yield [46]. Our results were consistent with this pattern, and Yongyou12 had a significant advantage in dry matter weight (Figure 5a–d). Given that Yongyou12 has a similar plant height to Yongyou9 and fewer tillers, it may develop a stronger and more resistant single stem. We can verify this point based on post-anthesis soluble sugar content, which was significantly lower in stems and sheaths of Yongyou12. Dry matter accumulation, which is composed of structural carbohydrates (lignin, cellulose, etc.) and non-structural carbohydrates (sucrose, fructose, other soluble sugars, starch, etc.), showed the opposite pattern and was significantly higher in Yongyou12 (Figure 5c). Based on the fact that starch in stems and sheaths would be largely broken down into sucrose to supply grain filling after flowering, the remaining structural carbohydrates must have increased and remained higher in Yongyou12 than Yongyou9 [47,48,49]. In addition, Yongyou12 had a much more plentiful carbohydrate supply, as indicated by its higher photosynthetic rate, solar radiation interception, and leaf soluble sugars, and these factors also contributed to yield formation (Figure 4g, Figure 5e and Figure 8a; Table 2).
Clearly, the increased number of grains per panicle was not the only factor responsible for the high yield of Yongyou12. Many rice varieties with large panicles and high biomass accumulation fail to show obvious yield advantages in field production, and this is believed to reflect the capacity for assimilate transport in rice [42,50,51]. Yield formation can be severely inhibited because seed-setting rate and kernel weight, especially the former, are seriously limited when the assimilate transport rate is too low. Obviously, the assimilate transport capacity of Yongyou12 is higher than that of Yongyou9, and the total dry weight of Yongyou12 from 0–60 DAF was significantly higher than that of Yongyou9. Previous studies have suggested that high biomass could contribute to a lower assimilate transport rate [51,52,53]. However, in this experiment, the conversion rate of assimilates was significantly higher in Yongyou12, mainly because of the following phenomena. First, the proportion of panicle to total weight was significantly higher in Yongyou12 than in Yongyou9; the former was 60% and the latter was 55% (Figure 5c). Second, although there was little difference in leaf soluble sugar content between Yongyou12 and Yongyou9, soluble sugars were significantly lower in stems and sheaths of Yongyou12 and significantly higher in grains (Figure 8). Both results could be inferred from differences in the numbers and sizes of internode vascular bundles (especially large vascular bundles), which function directly as transmission channels for the assimilate stream (Figure 10). The vascular system of the panicle neck internode is closely involved in the uploading, transport, and conversion of assimilates from the rice leaf, sheaths, and stem to the grains and determines the transport efficiency of assimilates [46]. There have been very few previous studies on internode microstructure and vascular bundle size. Third, the expression of genes related to sucrose transport and conversion (SUT1, SUT2, and CIN2) in stem sheaths and grains was significantly higher in Yongyou12 than in Yongyou9 (Figure 9), consistent with potentially higher rates of sucrose transport and unloading of assimilates from stems and sheaths to grains. Thus, Yongyou12 appears to have a more fluent carbohydrate transport stream due to better vascular system development and higher expression of genes associated with assimilate transport and finally contributed to its significantly higher grain yield (Table 2).
In this experiment, we also observed that there were no clear differences between Yongyou9 and Yongyou12 in nitrogen, phosphorus, or potassium content per plant. In many growth periods, the nitrogen, phosphorus, and potassium contents were lower in tissues of Yongyong12 than Yongyou9, although grain yield was significantly higher in the former than in the latter (Figure 2a,b and Figure 12). This result indicated that the high yield of Yongyou12 super rice was independent of large nutrient inputs, given that its absorption of nutrients was slightly lower than that of Yongyou9. On the other hand, this result also showed that under the same nutritional conditions, Yongyou12 had a higher yield and a higher assimilate conversion rate. These findings were distinct from those of Huang et al. [54] considering that newly developed elite varieties need high nitrogen inputs and nitrogen application increased yield by 60–65% in their experiment. These authors did not observe the phenomenon that large-spike varieties rely more on chemical fertilizers. Improving the conversion efficiency of rice assimilates may be an important direction for rice breeding in China and may be conducive not only to increasing rice yield but also to improving the efficiency of resource utilization.

5. Conclusions

In conclusion, the ultra-high-yield variety, Yongyou12, exhibited significantly larger panicles, higher grain yield, and improved rice quality compared with its control, Yongyou9. Much greater biomass accumulation in leaves, sheaths and stems, and panicles, as well as more balanced development between superior and inferior grains, were also observed in Yongyou12. These traits were inseparable from the higher solar radiation interception and leaf photosynthetic rates that produced much more plentiful carbohydrates and assimilates for grain filling. Most importantly, Yongyou12 showed higher assimilate transport than its control, as its panicle dry weight to total dry weight ratio was significantly higher. The expression of genes responsible for sucrose transport (SUT1, SUT2, and CIN2), was significantly higher in Yongyou12, and the numbers and sizes of vascular bundles in panicle neck internodes were significantly greater. These features accelerated assimilate translocation and ultimately contributed to the improved grain yield of the super-high-yielding rice variety Yongyou12.

Supplementary Materials

The following supporting information can be downloaded at: https://www.mdpi.com/article/10.3390/agronomy12040753/s1, Table S1: Primer sequences used in the quantitative RT-PCR; Table S2: Supplementary data of other indicators of rice quality in the study.

Author Contributions

Conceptualization, L.T. and G.F.; writing—original draft preparation, T.C. and X.Y.; methodology, W.F. and G.L.; software, B.F.; validation, G.F. and L.T.; writing—review and editing, T.C. and G.F.; project administration, L.T. All authors have read and agreed to the published version of the manuscript.

Funding

This research was funded by the “Pioneer” and “Leading Goose” Key R&D Program of Zhejiang (2022C02035), the Zhejiang Provincial Natural Science Foundation of China (LY20C130011 and LY19C130006), the State Key Laboratory of Rice Biology (20210402), the China National Rice Re-search Institute Key Research and Development Project (CNRRI-2020-05), and the National Rice Industry Technology System (CARS-1).

Institutional Review Board Statement

Not applicable.

Informed Consent Statement

Not applicable.

Data Availability Statement

The data presented in this publication are available on request from the corresponding author.

Conflicts of Interest

The authors declare no conflict of interest.

References

  1. Yu, S.; Ali, J.; Zhang, C.; Li, Z.; Zhang, Q. Genomic Breeding of Green Super Rice Varieties and Their Deployment in Asia and Africa. Theor. Appl. Genet. 2020, 133, 1427–1442. [Google Scholar] [CrossRef] [PubMed] [Green Version]
  2. FSIN. Globle Report on Food Crises 2020. FSIN 2020. Rome. Available online: https://www.fsinplatfom.org (accessed on 20 January 2022).
  3. Godfray, H.C.J.; Beddington, J.R.; Crute, I.R.; Haddad, L.; Lawrence, D.; Muir, J.F.; Pretty, J.; Robinson, S.; Thomas, S.M.; Toulmin, C. Food Security: The Challenge of Feeding 9 Billion People. Science 2010, 327, 812–818. [Google Scholar] [CrossRef] [PubMed] [Green Version]
  4. Cole, M.B.; Mary, A.A.; Michael, J.R.; John, M.M. The science of food security. NPJ Sci. Food 2018, 2, 14. [Google Scholar] [CrossRef] [PubMed]
  5. OECD/FAO. OECD-FAO Agricultural Outlook 2020–2029; FAO: Rome, Italy; OECD Publishing: Paris, France, 2020. [Google Scholar]
  6. Ma, G.-H.; Yuan, L.-P. Hybrid rice achievements, development and prospect in China. J. Integr. Agric. 2015, 14, 197–205. [Google Scholar] [CrossRef]
  7. Du, S.; Wang, S.; Li, C.; Wang, D.; Luo, Y.; Wu, S. Introduction to the progress and problems in ‘‘super’’ rice breeding. Chin. Agric. Sci. Bull. 2006, 8, 195–198. [Google Scholar]
  8. Liu, K.; Yang, R.; Deng, J.; Huang, L.; Wei, Z.; Ma, G.; Tian, X.; Zhang, Y. High radiation use efficiency improves yield in the recently developed elite hybrid rice Y-liangyou 900. Field Crop. Res. 2020, 253, 107804. [Google Scholar] [CrossRef]
  9. Xu, L.; Yuan, S.; Man, J. Changes in rice yield and yield stability in China during the past six decades. J. Sci. Food Agric. 2020, 100, 3560–3569. [Google Scholar] [CrossRef]
  10. Chang, S.; Chang, T.; Song, Q.; Zhu, X.-G.; Deng, Q. Photosynthetic and agronomic traits of an elite hybrid rice Y-Liang-You 900 with a record-high yield. Field Crop. Res. 2016, 187, 49–57. [Google Scholar] [CrossRef]
  11. Cheung, F. Yield: The search for the rice of the future. Nature 2014, 514, S60–S61. [Google Scholar] [CrossRef]
  12. Li, J.; Zhang, Y.; Wu, J.; Shu, Y.; Zhou, P.; Deng, Q. High-yielding cultural techniques of super hybrid rice YLY 900 yielded 15.40 t/hm2 on a 6.84 hm2 scale. Chin. Rice 2014, 20, 1–4. [Google Scholar]
  13. Chen, Z.; Yang, X.; Song, W.; Khan, A.; Najeeb, U.; Li, P.; Cao, C. Water-saving cultivation plus super rice hybrid genotype improves water productivity and yield. Agron. J. 2020, 112, 1764–1777. [Google Scholar] [CrossRef]
  14. Liu, K.; Li, T.; Chen, Y.; Huang, J.; Qiu, Y.; Li, S.; Wang, H.; Zhu, A.; Zhuo, X.; Yu, F.; et al. Effects of root morphology and physiology on the formation and regulation of large panicles in rice. Field Crop. Res. 2020, 258, 107946. [Google Scholar] [CrossRef]
  15. Zhang, H.; Xue, Y.; Wang, Z.; Yang, J.; Zhang, J. Morphological and physiological traits of roots and their relationships with shoot growth in ‘‘super’’ rice. Field Crop. Res. 2009, 113, 31–40. [Google Scholar] [CrossRef]
  16. Jiang, Y.-H.; Xu, K.; Zhao, K.; Sun, J.-J.; Wei, H.-H.; Xu, J.-W.; Wei, H.-Y.; Guo, B.-W.; Huo, Z.-Y.; Dai, Q.-G.; et al. Canopy Structure and Photosynthetic Characteristics of Yongyou Series of Indica-Japonica Hybrid Rice under High-yielding Cultivation Condition. Acta Agron. Sin. 2015, 41, 286–296. [Google Scholar] [CrossRef]
  17. Meng, T.; Wei, H.; Li, X.; Dai, Q.; Huo, Z. A better root morpho-physiology after heading contributing to yield superiority of japonica/indica hybrid rice. Field Crop. Res. 2018, 228, 135–146. [Google Scholar] [CrossRef]
  18. Meng, T.-Y.; Xu, J.-W.; Shao, Z.-B.; Ge, M.-J.; Zhang, H.-C.; Wei, H.-Y.; Dai, Q.-G.; Huo, Z.-Y.; Xu, K.; Guo, B.-W.; et al. Advantages and Their Formation Characteristics of the Highest Population Productivity of Nitrogen Fertilization in Japonica/Indica Hybrid Rice of Yongyou Series. Acta Agron. Sin. 2015, 41, 1711. [Google Scholar] [CrossRef]
  19. Wei, H.-H.; Meng, T.-Y.; Li, C.; Zhang, H.-C.; Dai, Q.-G.; Ma, R.-R.; Wang, X.-Y.; Yang, J.-W. Accumulation, Distribution, and Utilization Characteristics of Phosphorus in Yongyou 12 Yielding over 13.5 t ha−1. Acta Agron. Sin. 2016, 42, 886–897. [Google Scholar] [CrossRef]
  20. Zhao, X.; Chen, T.; Feng, B.; Zhang, C.; Peng, S.; Zhang, X.; Fu, G.; Tao, L. Non-photochemical Quenching Plays a Key Role in Light Acclimation of Rice Plants Differing in Leaf Color. Front. Plant Sci. 2017, 7, 1968. [Google Scholar] [CrossRef] [Green Version]
  21. Chen, T.; Xu, G.; Wang, Z.; Zhang, H.; Yang, J.; Zhang, J. Expression of proteins in superior and inferior spikelets of rice during grain filling under different irrigation regimes. Proteomics 2015, 16, 102–121. [Google Scholar] [CrossRef]
  22. Richards, F.J. A Flexible Growth Function for Empirical Use. J. Exp. Bot. 1959, 10, 290–301. [Google Scholar] [CrossRef]
  23. DuBois, M.; Gilles, K.A.; Hamilton, J.K.; Rebers, P.A.; Smith, F. Colorimetric method for determination of sugars and related substances. Anal. Chem. 1956, 28, 350–356. [Google Scholar] [CrossRef]
  24. Bollmark, M.; Kubát, B.; Eliasson, L. Variation in Endogenous Cytokinin Content during Adventitious Root Formation in Pea Cuttings. J. Plant Physiol. 1988, 132, 262–265. [Google Scholar] [CrossRef]
  25. Zhang, H.; Chen, T.; Wang, Z.; Yang, J.; Zhang, J. Involvement of cytokinins in the grain filling of rice under alternate wetting and drying irrigation. J. Exp. Bot. 2010, 61, 3719–3733. [Google Scholar] [CrossRef] [Green Version]
  26. Li, H.; Liu, L.; Wang, Z.; Yang, J.; Zhang, J. Agronomic and physiological performance of high-yielding wheat and rice in the lower reaches of Yangtze River of China. Field Crop. Res. 2012, 133, 119–129. [Google Scholar] [CrossRef]
  27. Chen, T.; Feng, B.; Fu, W.; Zhang, C.; Tao, L.; Fu, G. Nodes protect against drought stress in rice (Oryza sativa) by mediating hydraulic conductance. Environ. Exp. Bot. 2018, 155, 411–419. [Google Scholar] [CrossRef]
  28. Eom, J.-S.; Cho, J.-I.; Reinders, A.; Lee, S.-W.; Yoo, Y.; Tuan, P.Q.; Choi, S.-B.; Bang, G.; Park, Y.-I.; Cho, M.-H.; et al. Impaired Function of the Tonoplast-Localized Sucrose Transporter in Rice, OsSUT2, Limits the Transport of Vacuolar Reserve Sucrose and Affects Plant Growth. Plant Physiol. 2011, 157, 109–119. [Google Scholar] [CrossRef] [Green Version]
  29. Siahpoosh, M.R.; Sanchez, D.H.; Schlereth, A.; Scofield, G.N.; Furbank, R.T.; van Dongen, J.T.; Kopka, J. Modification of OsSUT1 gene expression modulates the salt response of rice Oryza sativa cv. Taipei 309. Plant Sci. 2012, 182, 101–111. [Google Scholar] [CrossRef]
  30. Yan, S.; Zou, G.; Li, S.; Wang, H.; Liu, H.; Zhai, G.; Guo, P.; Song, H.; Yan, C.; Tao, Y. Seed size is determined by the combinations of the genes controlling different seed characteristics in rice. Theor. Appl. Genet. 2011, 123, 1173–1181. [Google Scholar] [CrossRef]
  31. Feng, B.; Li, G.; Islam; Fu, W.; Zhou, Y.; Chen, T.; Tao, L.; Fu, G. Strengthened antioxidant capacity improves photosynthesis by regulating stomatal aperture and ribulose-1,5-bisphosphate carboxylase/oxygenase activity. Plant Sci. 2019, 290, 110245. [Google Scholar] [CrossRef]
  32. Ishimaru, T.; Matsuda, T.; Ohsugi, R.; Yamagishi, T. Morphological development of rice caryopses located at the different positions in a panicle from early to middle stage of grain filling. Funct. Plant Biol. 2003, 30, 1139–1149. [Google Scholar] [CrossRef]
  33. Jiang, Q.; Du, Y.; Tian, X.; Wang, Q.; Xiong, R.; Xu, G.; Yan, C.; Ding, Y. Effect of panicle nitrogen on grain filling characteristics of high-yielding rice cultivars. Eur. J. Agron. 2016, 74, 185–192. [Google Scholar] [CrossRef]
  34. Zhu, Q.; Cao, X.; Luo, Y. Growth analysis on the process of grain filling in rice. Acta Agron. Sin. 1988, 14, 182–193. [Google Scholar]
  35. Mahadi, S.; Nulit, R.; Mohtar, M.; Ibrahim, M.; Ab Ghani, N. Synergistic effect of KCl, thiourea, GA3 and SA on the germination and early seedling growth enhancement of drought-stressed Malaysian indica rice cv. MR220. Biocatal. Agric. Biotechnol. 2020, 29, 101779. [Google Scholar] [CrossRef]
  36. Li, J.; Li, C.; Smith, S.M. Hormone Metabolism and Signaling in Plants; Elsevier: Amsterdam, The Netherlands, 2017. [Google Scholar] [CrossRef]
  37. Wang, G.; Li, H.; Gong, Y.; Yang, J.; Yi, Y.; Zhang, J.; Ye, N. Expression profile of the carbon reserve remobilization from the source to sink in rice in response to soil drying during grain filling. Food Energy Secur. 2020, 9, e204. [Google Scholar] [CrossRef] [Green Version]
  38. Fu, P.; Wang, J.; Zhang, T.; Huang, J.; Peng, S. High nitrogen input causes poor grain filling of spikelets at the panicle base of super hybrid rice. Field Crop. Res. 2019, 244, 107635. [Google Scholar] [CrossRef]
  39. Okamura, M.; Arai-Sanoh, Y.; Yoshida, H.; Mukouyama, T.; Adachi, S.; Yabe, S.; Nakagawa, H.; Tsutsumi, K.; Taniguchi, Y.; Kobayashi, N.; et al. Characterization of high-yielding rice cultivars with different grain-filling properties to clarify limiting factors for improving grain yield. Field Crop. Res. 2018, 219, 139–147. [Google Scholar] [CrossRef]
  40. Huang, M.; Lei, T.; Cao, F.; Chen, J.; Shan, S.; Zou, Y. Grain yield responses to nitrogen rate in two elite double-cropped inbred rice cultivars released 41 years apart. Field Crop. Res. 2020, 259, 107970. [Google Scholar] [CrossRef]
  41. Sheehy, J.; Dionora, M.; Mitchell, P. Spikelet numbers, sink size and potential yield in rice. Field Crop. Res. 2001, 71, 77–85. [Google Scholar] [CrossRef]
  42. Huang, M.; Zou, Y.-B.; Jiang, P.; Xia, B.; Ibrahim; Ao, H.-J. Relationship Between Grain Yield and Yield Components in Super Hybrid Rice. Agric. Sci. China 2011, 10, 1537–1544. [Google Scholar] [CrossRef]
  43. Hua, J.; Zhou, N.; Zhang, W.; Zhang, H.; Huo, Z.; Zhou, P.; Cheng, F.H.; Guo-Ye, L.I.; Huang, D.S.; Chen, Z.P. The structure and formation characteristics of super-high yield population with late Yongyou series of Indica-Japonica hybrid rice in double-cropping rice area. Sci. Agric. Sin. 2015, 48, 1023–1034. [Google Scholar]
  44. Pan, S.-G.; Huang, S.-Q.; Zhang, F.; Wang, J.-P.; Cai, M.-L.; Cao, C.-G.; Tang, X.-R.; Li, G.-X. Growth and Development Characteristics of Super-High-Yielding Mid-Season Indica Hybrid Rice. Acta Agron. Sin. 2011, 37, 537–544. [Google Scholar] [CrossRef]
  45. Wang, X.-Y.; Wei, H.-H.; Zhang, H.-C.; Sun, J.; Zhang, J.-M.; Li, C.; Lu, H.-B.; Yang, J.-W.; Ma, R.-R.; Xu, J.-F.; et al. Population Characteristics for Super-high Yielding Hybrid Rice Yongyou 12 (>13.5 t ha−1). Acta Agron. Sin. 2014, 40, 2149–2159. [Google Scholar] [CrossRef]
  46. Xu, H.; Wang, Z.; Xiao, F.; Yang, L.; Li, G.; Ding, Y.; Paul, M.J.; Li, W.; Liu, Z. Dynamics of dry matter accumulation in internodes indicates source and sink relations during grain-filling stage of japonica rice. Field Crop. Res. 2020, 263, 108009. [Google Scholar] [CrossRef]
  47. Braun, D.M.; Wang, L.; Ruan, Y.-L. Understanding and manipulating sucrose phloem loading, unloading, metabolism, and signalling to enhance crop yield and food security. J. Exp. Bot. 2013, 65, 1713–1735. [Google Scholar] [CrossRef] [PubMed] [Green Version]
  48. Li, G.; Pan, J.; Cui, K.; Yuan, M.; Hu, Q.; Wang, W.; Mohapatra, P.K.; Nie, L.; Huang, J.; Peng, S. Limitation of Unloading in the Developing Grains Is a Possible Cause Responsible for Low Stem Non-structural Carbohydrate Translocation and Poor Grain Yield Formation in Rice through Verification of Recombinant Inbred Lines. Front. Plant Sci. 2017, 8, 1369. [Google Scholar] [CrossRef] [Green Version]
  49. Wang, G.; Li, H.; Wang, K.; Yang, J.; Duan, M.; Zhang, J.; Ye, N. Regulation of gene expression involved in the remobilization of rice straw carbon reserves results from moderate soil drying during grain filling. Plant J. 2019, 101, 604–618. [Google Scholar] [CrossRef]
  50. Yang, J.; Zhang, J. Crop management techniques to enhance harvest index in rice. J. Exp. Bot. 2010, 61, 3177–3189. [Google Scholar] [CrossRef] [Green Version]
  51. Yang, J.; Peng, S.; Zhang, Z.; Wang, Z.; Visperas, R.M.; Zhu, Q. Grain and dry matter yields and partitioning of assimilates in japonica/indica hybrids. Crop Sci. 2002, 42, 766–772. [Google Scholar] [CrossRef]
  52. Xu, D.H.; Wang, X.Y.; Ma, R.R.; Yu, S.M.; Zhu, L.F.; Ouyang, Y.N.; Jin, Q.Y. Analysis on physiological properties of the heavy panicle type of indica-japonica inter-subspecific hybrid rice Yongyou 6. Sci. Agric. Sin. 2010, 43, 4796–4804. [Google Scholar]
  53. Yuan, L.P. Recent progress in breeding super hybrid rice in China. In Science Progress in China; Lu, Y., Ed.; Elsevier: Amsterdam, The Netherlands, 2003; pp. 231–236. [Google Scholar]
  54. Huang, Z.; Lv, Q.; Xin, Y.; Yuan, L.; Fu, X.; Zhu, L.; Wang, Z. Heterotic performance of the main yield traits in different types of Indica hybrid rice. Food Energy Secur. 2020, 9, e210. [Google Scholar] [CrossRef]
Figure 1. The solar radiation (a), precipitation (b), and daily mean temperature (c) during the rice growing season across the two testing years, 2018 and 2019. Arrows indicate the mean heading time.
Agronomy 12 00753 g001
Figure 2. Rice-grain yield and its components in 2018 and 2019: (a) theoretical grain yield; (b) actual grain yield; (c) total panicle numbers per area; (d) grain numbers per panicle; (e) seed-setting rate; (f) grain weight. Error bars denote ± standard deviation (n = 3). Different letters within the same year indicate a significant difference at the 0.05 probability level.
Agronomy 12 00753 g002
Figure 3. Grain quality of Yongyou9 and Yongyou12: (a) brown rice rate; (b) milled rice rate; (c) head rice rate; (d) chalky grain percentage; (e) chalky degree; (f) gel consistency; (g) amylose content; (h) protein content. Error bars denote ± standard deviation (n = 3). Different letters indicate a significant difference at the 0.05 probability level.
Agronomy 12 00753 g003
Figure 4. Rice plant morphology, plant height, tiller numbers, and canopy solar radiation: (a) and (b) plant morphology and panicle morphology; (c) field performance of rice; (d) plant height; (e) new tiller numbers; (f) tiller numbers per plant; (g) canopy light interception. Error bars denote ± standard deviation (n = 3).
Agronomy 12 00753 g004
Figure 5. Photosynthetic assimilate production characteristics of rice: (a) leaf dry weight; (b) sheath and stem dry weight; (c) panicle dry weight; (d) total dry weight; (e) net photosynthetic rate; (f) specific leaf weight. MT, PI, and FH denote mid-tillering, panicle initiation, and full-heading stage, respectively; DAF denotes days after flowering; Y9 and Y12 indicate rice varieties, Yongyou9 and Yongyou12, respectively; HI indicates the ratio of panicle weight to total weight (harvest index). Error bars denote ± standard deviation (n = 3).
Agronomy 12 00753 g005
Figure 6. Changes in grain weight and grain-filling rate through time: (a) kernel weight; (b) grain-filling rate. Y9 and Y12 denote the rice varieties, Yongyou9 and Yongyou12, respectively; S and I indicate superior and inferior grains, respectively.
Agronomy 12 00753 g006
Figure 7. Changes in hormone contents in rice grains after flowering: (a) GA3 contents; (b) ZR contents; (c) IAA contents; (d) ABA contents. Error bars denote ± standard deviation (n = 3).
Agronomy 12 00753 g007
Figure 8. Changes in total soluble sugar content of rice flag leaves (a), stems and sheaths (b), and panicles (c) after flowering. Error bars denote ± standard deviation (n = 3).
Agronomy 12 00753 g008
Figure 9. Gene expression of SUT1 (a), SUT2 (b), and CIN2 (c) in stems and grain after rice flowering. Error bars denote ± standard deviation (n = 3). Different letters indicate a significant difference within the same measurement period at the 0.05 probability level.
Agronomy 12 00753 g009
Figure 10. The numbers and size of vascular bundles in the panicle neck internodes of rice: (ad) large vascular bundles (LVB) and small vascular bundles (SVB) inside the internode; (e) number of LVB; (f) diameter of LVB; (g) area of LVB; (h) number of SVB; (i) diameter of SVB; (j) area of SVB. Plant tissue sections were stained using 1% safranine and 0.5% fast green, and the dimensions (diameter and area) of the vascular bundles were analyzed with Image J software. Error bars denote ± standard deviation (n = 10). Different letters indicate a significant difference at the 0.05 probability level.
Agronomy 12 00753 g010
Figure 11. Amount of bleeding sap collected from rice roots after flowering. Error bars denote ± standard deviation (n = 3).
Agronomy 12 00753 g011
Figure 12. Changes in the contents of nitrogen (ac), phosphorus (df), and potassium (gi) in rice leaves, stems and sheaths, and panicles. Error bars denote ± standard deviation (n = 3). Different letters indicate a significant difference at the 0.05 probability level.
Agronomy 12 00753 g012
Table 1. Parameters of grain filling fitted by Richards’ equation.
VarietyGrain TypesAbkmR2
Yongyou9Superior grains27.752.800.261.430.998
Inferior grains23.254.730.351.770.977
Yongyou12Superior grains23.131.500.210.870.994
Inferior grains20.421.720.160.750.984
A indicates the final growth weight (mg) of a grain calculated by Richards’ (1959) growth equation. b, k, and m are coefficients determined by regression analysis, and R2 is the coefficient of determination.
Table 2. Correlations of the Ratio of Panicle Weight to Total Weight/grain Yield with the Agronomy Traits and Physiological Parametersa.
Correlated withRatio of Panicle Weight to Total WeightGrain Yield
Agronomy traits
     Dry weight
             Leaves0.862 **0.751 *
             Sheaths and stems0.838 **0.796 *
             Panicle0.984 **0.824 *
             Total0.972 **0.815 *
     Ratio of panicle to total/0.858 *
     Plant height0.5880.559
     Specific leaf weight0.4060.530
Physiological parameters
     Net photosynthetic rate0.868 **0.942 **
     Soluble sugar in panicle0.890 **0.905 **
     Hormone contents
             GA30.826 **0.852 *
             ZR0.835 **0.861 *
             IAA0.6210.669
             ABA0.5980.605
Expression levels of the genes in stem
     SUT10.918 **0.928 **
     SUT20.925 **0.942 **
     CIN20.921 **0.945 **
Vascular bundle characteristics
     LVB/SVB numbers0.904 **/0.915 **0.886 **/0.867 **
     LVB/SVB diameter0.922 **/0.5890.895 **/0.607
Correlations were analyzed through the grain filling period for the ratio of panicle weight to total weight, while those were analyzed at final harvest for grain yield. * indicates significant at the 0.05 probability level. ** indicates Significant at the 0.01 probability level.
Publisher’s Note: MDPI stays neutral with regard to jurisdictional claims in published maps and institutional affiliations.

