Article

Application of the Nitrogen Nutrition Index to Estimate the Yield of Indica Hybrid Rice Grown from Machine-Transplanted Bowl Seedlings

1
Rice Ecophysiology and Precise Management Laboratory, College of Agronomy, Anhui Agricultural University, Anhui 230036, China
2
Pujiwei Modern Agriculture Group Co., Ltd., Tongling 244071, China
3
Zoomlion Intelligent Agricutlture Co., Ltd., Wuhu 241000, China
4
Jiangsu Collaborative Innovation Center for Modern Crop Production, Nanjing 210095, China
*
Author to whom correspondence should be addressed.
Agronomy 2022, 12(3), 742; https://doi.org/10.3390/agronomy12030742
Submission received: 8 February 2022 / Revised: 13 March 2022 / Accepted: 17 March 2022 / Published: 20 March 2022

Abstract

:
The purpose was to comprehensively compare the prediction accuracy of different nitrogen nutrition indexes (NNILAI and NNIDM) derived from critical nitrogen concentration (Nc) models established by the leaf area index (LAI) and dry matter (DM) in estimating the grain yield of indica hybrid rice grown from machine-transplanted bowl seedlings. Therefore, field experiments were conducted with two high-yielding indica hybrid rice varieties and five nitrogen application rates in 2018 and 2019. The results show that NNIDM peaked in the stem elongation stage, while NNILAI had its maximal value in the mid-tillering stage during the growth stages. The NNILAI had the highest correlation with the relative effective panicle number in the tillering stage when compared with the NNIDM, and the threshold points of the NNI were 0.971 (active tillering stage) and 1.106 (mid-tillering stage). Moreover, the NNILAI had the highest correlation with the relative seed setting rate in the stem elongation–panicle initiation stage compared with the NNIDM, and its threshold points were 1.116 (stem elongation stage) and 1.053 (panicle initiation stage). In contrast, the NNIDM had the highest correlation with the relative seed setting rate in the heading stage compared with the NNILAI, and its threshold point was 1.050 (heading stage). Therefore, the NNILAI in the tillering–panicle initiation stage and NNIDM in the heading stage should be merged to effectively improve the nitrogen nutrition status and its evaluation in addition to the prediction accuracy of the yield of indica hybrid rice grown from machine-transplanted bowl seedlings. This study provides a theoretical basis for improved understanding of the nitrogen status and yield prediction of indica hybrid rice grown from machine-transplanted bowl seedlings.

1. Introduction

Rice is one of the most important food crops in China. In 2020, the area used for planting rice accounted for 25.8% of the total area used for all food crops, and the yield of rice represented 32% of the total grain yield [1]. The amount of available arable land and lobar have decreased year-by-year due to urbanization and industrialization. Increasing the rice yield per unit area has become the main strategy to ensure national food security in machine transplanting [2,3]. Machine-transplantated bowl seedlings will become one of the main development directions of rice planting mechanization in China in the 21st century because the technology is associated with a significantly higher rice seedling quality and yield than with other machine transplanting technologies [4,5]. Nitrogen fertilizer application in rice fields in China is generally too high [6]; excessive application of nitrogen fertilizer does not significantly increase the rice yield but, rather, results in a decline in the nitrogen use efficiency and widespread pollution of ecological environments [7]. In recent years, the growth of rice production in China has slowed down or even stagnated. Therefore, the establishment of reasonable methods for the diagnosis and monitoring of crop nitrogen nutrition along with the optimization of nitrogen management measures in paddy fields are some of the main solutions that can be used to achieve sustainable development of the agricultural economy, especially regarding the machine transplantation of indica hybrid rice bowl seedlings.
At present, analysis methods based on plant nutrient elements are an effective means for diagnosing the nutritional status of crops under field conditions. The nitrogen concentration of crops decreases in the growth stage with increases in agronomic parameters (dry matter (DM) or leaf area index (LAI)), and this negative correlation is not affected by the crop planting year, species, or genotype [8,9]. Previous research has established different Nc models based on DM for plants grown in different regions [10,11]. In addition, the differences in Nc models also depend on the different cultivation methods used. Our earlier study also confirmed the view that Nc models operating under the condition of bowl seedling mechanical transplantation [12] differ from the Nc model of rice in the eastern region proposed by Ata-Ul-Karim [13]. LAI, an agricultural parameter closely related to crop photosynthesis and canopy nitrogen status, can better reflect the nitrogen absorption status of plants [14]. Although the model based on DM can provide a more accurate estimation of the rice growth status, various constraints have led to certain limitations in agricultural field production practice. For example, representativeness is required for the acquisition of DM and the reduction in DM in the drying process. Additionally, with respect to the DM sampling site, it cannot reflect the crop growth status of the whole plant space [15]. The LAI-based approach can be considered as a potential alternative to overcome the problems associated with the PDM-based approach for the assessment of the crop N status, as it can be easily, rapidly, and accurately estimated through nondestructive techniques and remote sensing. The spectral information mainly reflects the relationship between the plant canopy and sunlight. Therefore, it is difficult for remote sensing technologies to accurately predict the aboveground DM in the late growth stage [16]. Thus, LAI-based diagnostic tools can provide better technical guidance for evaluating the nitrogen nutrition supply status, and yield estimation of indica hybrid rice grown from machine-transplanted bowl seedlings remains to be determined.
The NNI calculated based on the Nc model is an important indicator that can be used to quantitatively evaluate the nitrogen nutrition status of rice and to accordingly make recommendations for decisions involving fertilization. At present, the strong correlation of the NNI with crop nitrogen demand, yield, and quality has been studied on different crops [17]. The NNI not only reflects the field nitrogen nutrition status [18] but can also be used to predict the rice yield [19]. The grain yield can be calculated by the yield components, and the yield is controlled by the yield components. However, there have been few studies on the correlation between the NNI and yield components. Scholars have only discussed the idea that the NNI can predict the yield in each period but have not considered that the rice yield is subject to the synergistic effect of yield components throughout the formation process. Therefore, it is necessary to clarify which indicator of the NNI is key in the growth period and can be used to improve yield components.
The purpose of this study was to construct a model for the Nc of machine-transplanted indica hybrid rice based on the LAI, to evaluate whether this newly developed Nc model can better estimate the yield of indica hybrid rice, and to compare the relationship and differences between the NNI (NNILAI and NNIDM) calculated by the two Nc models and the yield and its components. The prediction results can provide a theoretical reference and basis for estimating the yield of indica hybrid rice grown from machine-transplanted bowl seedlings.

2. Materials and Methods

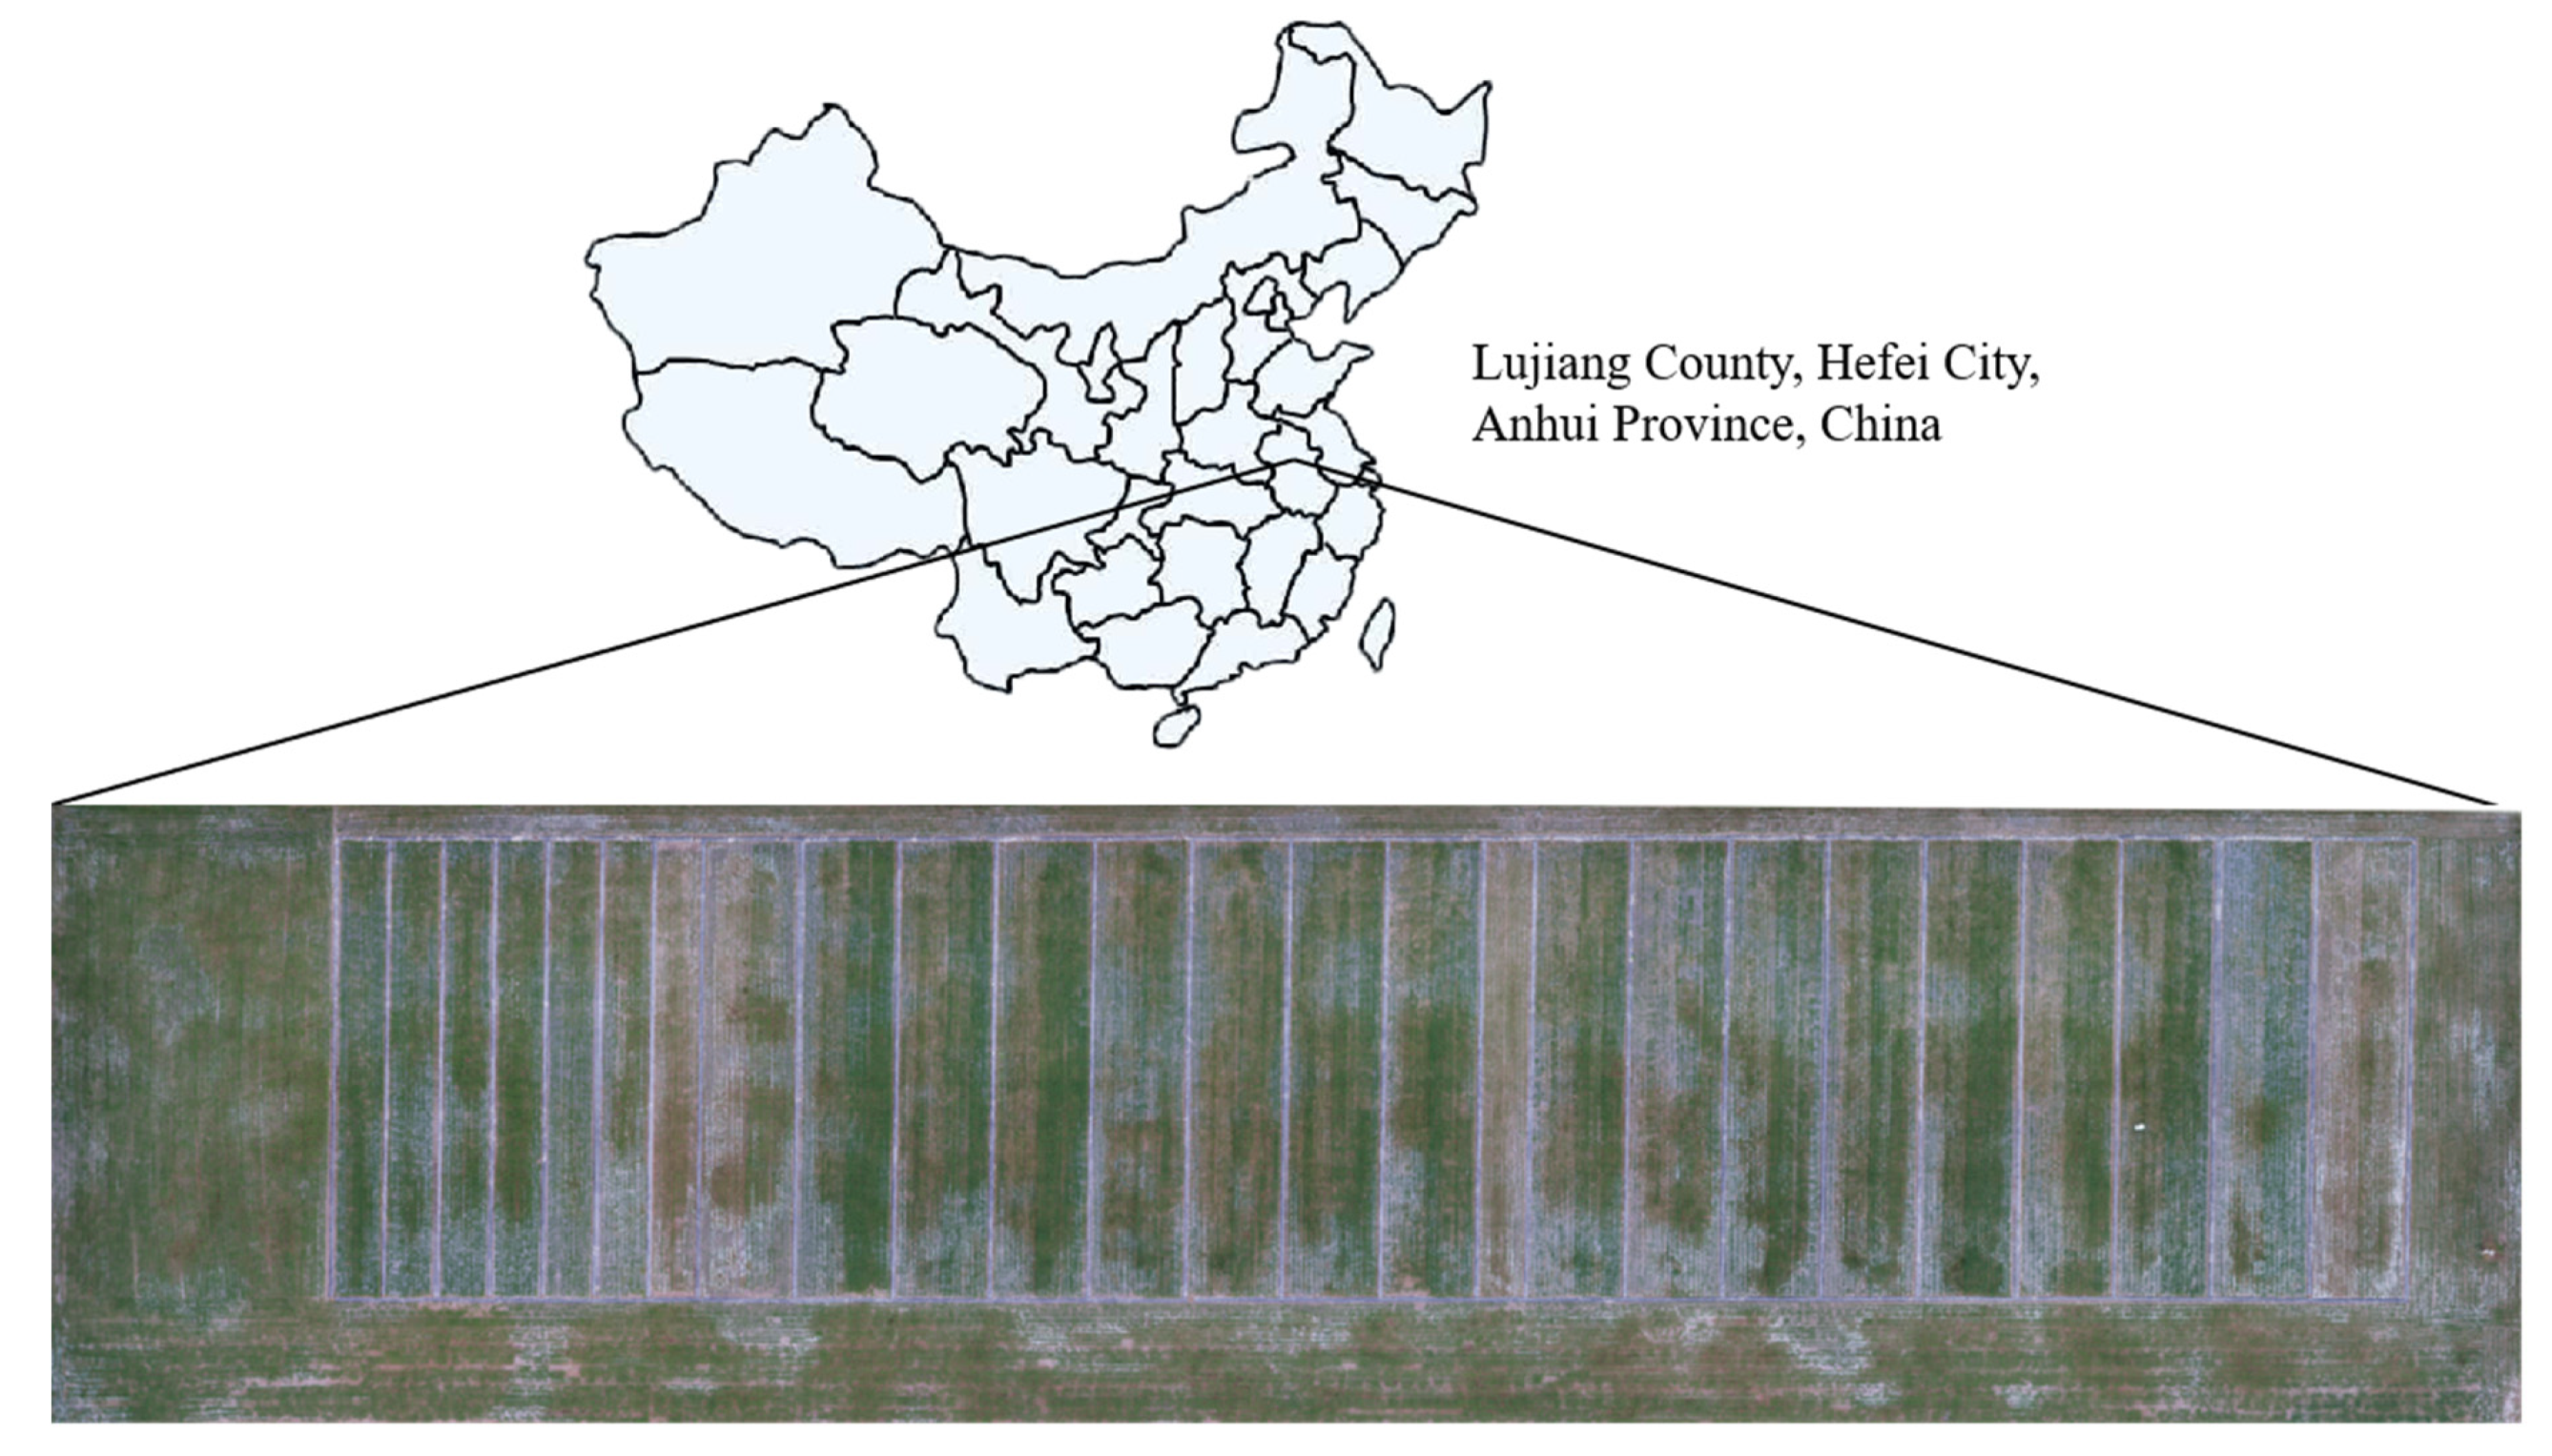
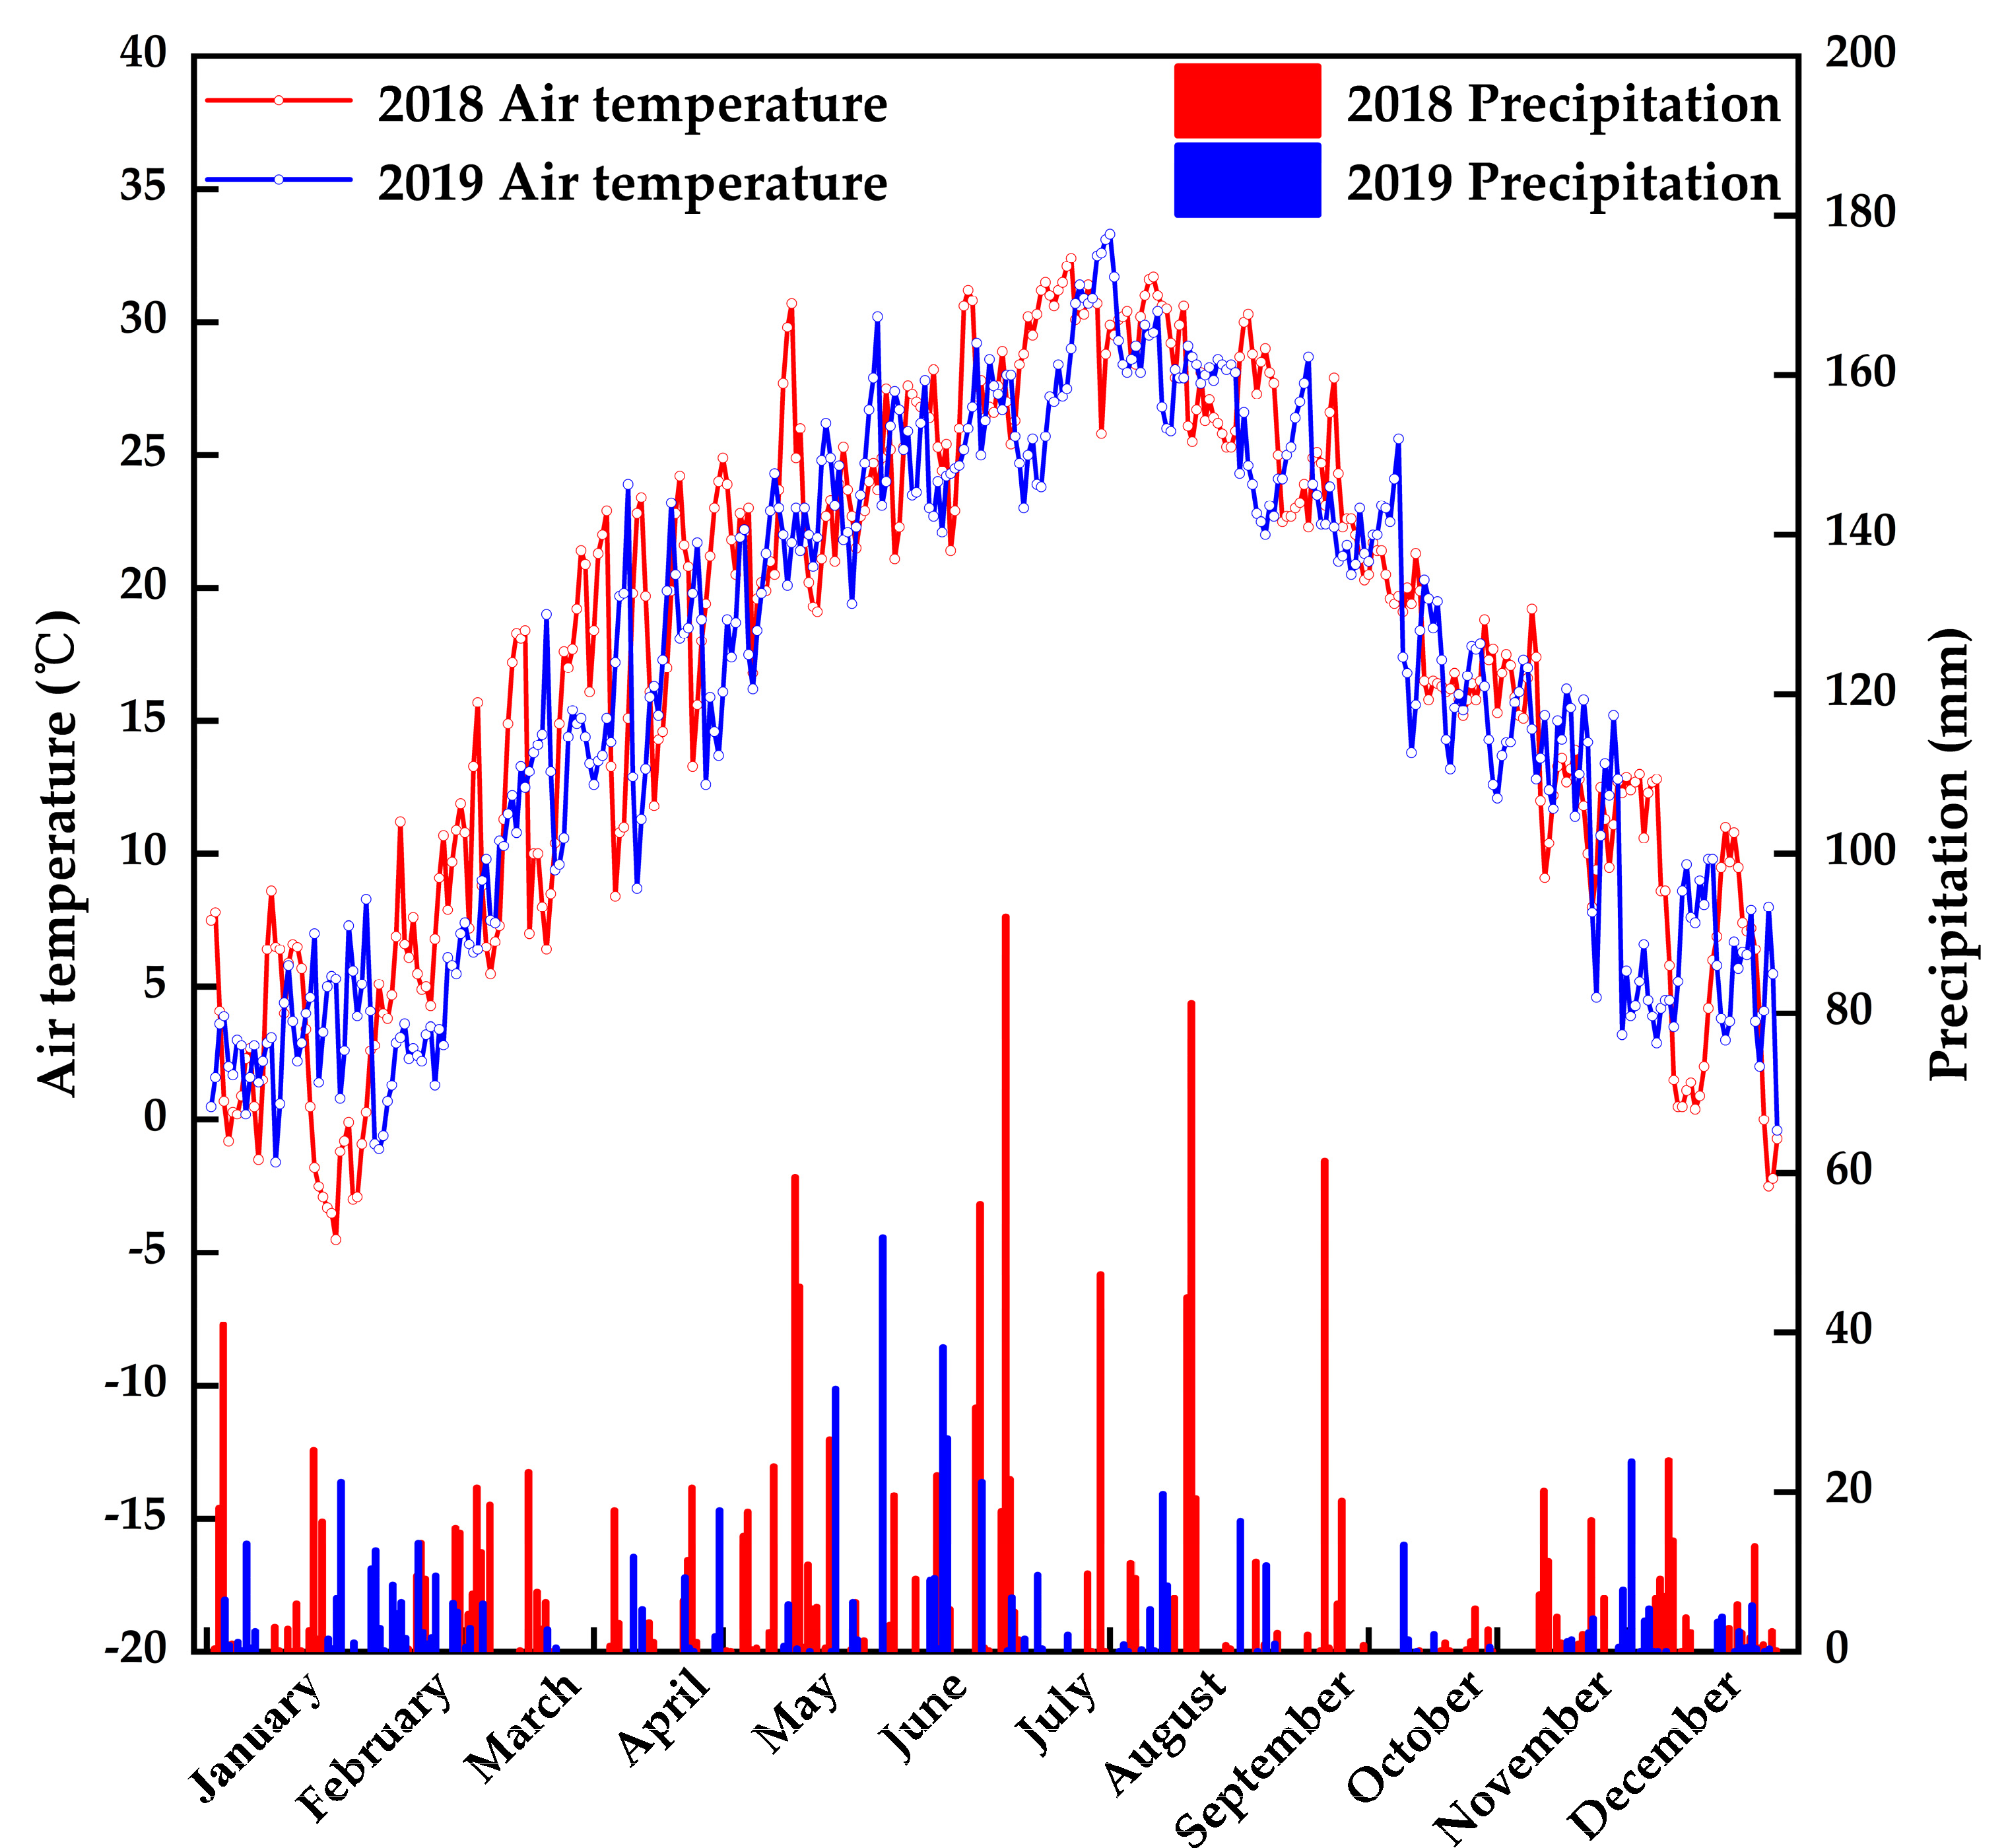
2.1. Plant Materials and Experimental Details

This experiment was conducted at the Wanzhong Experimental Station of Anhui Agricultural University, Lujiang County, Hefei City, Anhui Province, China (117.23° E, 31.48° N) for two consecutive years, 2018 and 2019 (Figure 1). Two indica hybrid rice cultivars named Huiliangyou 898 (HLY 898) and Yliangyou 900 (YLY 900) were used in this study (Table S1). Both cultivars are high-yielding rice varieties planted in large areas in the study region. The meteorological data in 2018 and 2019 are shown Figure 2.

2.2. Soil Sample Collection and Laboratory Analysis

Type of soil is clay. The soil is sticky, the structure is compact and rigid, and the expansion and contraction is strong. Topsoil was collected at depth 0–20 cm on rice fields before transplantation in 2018 and 2019. The soil samples were collected from each N treatment. At the laboratory, organic matter was determined following the method described by Kim [20]. Total N was measured by the KCl extraction method [21]. Available phosphorus (P) was determined based on the molybdate blue method (Bray II extraction) [22]. Available potassium (K) was extracted by NH4OAc pH 7.0 and measured by atomic absorption spectrometry [22]. Soil pH was determined in a 1:2.5 soil to water mixture by a pH meter [23]. The basic soil data are shown in Table 1.

2.3. Experimental Design and Treatments

The experiments were performed using a split-plot design with cultivars as the main plots and N rates as subplots. The five N treatments were 0 kg ha−1 (N0), 75 kg ha−1 (N1), 150 kg ha−1 (N2), 225 kg ha−1 (N3), and 300 kg ha−1 (N4). The experiment was repeated three times in 2018, and the area of a single plot was 40 m2. The experiment was repeated four times in 2019, with an area of 36 m2 per plot. The N fertilizer was split into three applications, with 40% as the basal fertilizer, and 30% provided at tillering and 40% at panicle initiation; all treatments of phosphorus (P2O5) and potassium (K2O) were one-time basal applications using amounts of 105 kg P ha−1 and 225 kg K ha−1, respectively. A pot hard disk was used for dry seedling cultivation in the experiment. Pre-germinated seeds were sown in a seedbed, and 26- and 28-day-old seedlings were transplanted on 7 June 2018 and 13 June 2019. In the two-year experiment, three seedlings were planted in each hole with row spacings of 15.7 cm × 33 cm. The wheat straw grown on the site prior to the experiment was mechanically crushed and fully returned to the field. After rotary tillage, it was irrigated and soaked for three days, and the rotary tillage was then smoothed down. In order to prevent water and fertilizer channeling, each plot was separated using ridge films. The seedlings were transplanted in shallow water, and shallow water irrigation was maintained in the tillering stage. When the number of stems and tillers reached 80% of the expected panicle number, the field began to drain in the sun, and alternate dry and wet irrigation was conducted from the jointing stage to maturity until the first week of harvest. Weeding has been controlled by artificial. Organic pesticides were used to pre-control the main rice diseases in this region such as rice blast and rice false smut for both cultivars and five N treatments.

2.4. Determination Content and Methods

2.4.1. Dry Matter (DM), Leaf Area Index (LAI), and Nitrogen Concentration

Plot sampling was conducted after rice transplantation. According to the average number of tillers per plot, three hills were sampled at each key growth stage. The leaf area index (LAI) was calculated using dry matter values [24]. Plant samples were separated into leaves, stems, and panicles and dried in an oven at 105 °C for 30 min to deactivate enzymes. Next, the samples were dried at 75 °C until reaching a constant weight, and the biomass was then weighed. The total aboveground dry matter mass was determined, and the total N concentration was analyzed using the Kjeldahl-N method. The plant N uptake was calculated by multiplying the total aboveground dry matter mass with the plant N concentration.

2.4.2. The Yield and Its Components

An effective panicle number of 50 hills was investigated in each plot. According to the average effective panicle number in the field, six rice hills were selected, and the process was repeated three times to obtain yield components such as the grain number per panicle, seed setting rate, and 1000-grain weight. The actual yield was measured and converted to the yield per unit area based on a water content of 14%. The relative yield (RY) was defined as the ratio of the grain yield for a given N-fertilizer application rate to the highest grain yield for all N-fertilizer application rates [12]. The method for calculating the relative yield components was similar to that used for the relative yield.

2.5. Data Analysis

2.5.1. Nc Model Based on DM

In our early research, the critical nitrogen concentration (Nc) curve was constructed based on DM data collected in 2019 [11]. Nc was better able to distinguish the data points for nitrogen-limited and non-nitrogen-limited growth in 2018 and 2019.
Nc = 4.02 DM−0.42
Nc represents the critical nitrogen concentration (%) corresponding to the DM of the machine-transplanted indica hybrid rice. DM is the dry matter weight of rice, 4.02 is the nitrogen concentration when the DM is 1, and 0.42 is the statistical parameter controlling the slope of the curve.

2.5.2. Nc Model Based on the LAI

Based on the experimental data obtained in 2018 and 2019, Nc was determined by distinguishing the data points for nitrogen-limited and non-nitrogen-limited growth. In the nitrogen-limited group, additional nitrogen was applied, leading to a significant increase in the LAI (p < 0.05). In the non-nitrogen-limited group, supplemental nitrogen application did not lead to an increased LAI, while the nitrogen concentration increased significantly (p < 0.05) [15]. The Nc of the sampling day was determined by the intersection ordinate of the above linear fitting curve and the vertical line of the maximum LAI of the non-nitrogen-limited group. The Nc curve was constructed based on data collected in 2019:
Nc = a LAI−b
Nc represents the critical nitrogen concentration (%) corresponding to the LAI of the machine-transplanted indica hybrid rice. LAI is the leaf area index of rice, a is the nitrogen concentration when the LAI is 1, and b is the statistical parameter controlling the slope of the curve.

2.5.3. Verification of the Nc Curve

The Nc model was verified using independent test data for 2018. The model accuracy (R2), root mean square error (RMSE), average relative error (RE), and prediction accuracy (R2, the determination coefficient between the measured value and the estimated value of the model) were comprehensively evaluated.
R 2 = i = 1 n ( x i x i ) 2 i = 1 n ( x i x ) 2
R M S E = i = 1 n ( x i x i ) 2 n
R E ( % ) = i = 1 n ( x i x i x i ) 2 n × 100 %
where xi is the measured value for the nitrogen nutrition index; x i is the predicted value of the model; x i is the average of the measured values; and n is the sample size. R2 reflects the fitting degree of the model, where the higher the value, the higher the accuracy. RMSE and RE reflect the dispersion and deviation between the predicted value and the real value of the model, respectively, where the lower the values, the better the prediction effect of the model.

2.5.4. Nitrogen Nutrition Index (NNI)

The NNI is the Nc ratio between the measured nitrogen concentration and LAI of the same rice plant:
N N I = N t N c
where Nt is the actual rice nitrogen concentration (%), and Nc is the critical nitrogen concentration (%) corresponding to the same LAI. When NNI = 1, the nitrogen nutrition of rice plants has reached the appropriate state; when NNI > 1, nitrogen is in excess; and when NNI < 1, nitrogen is lacking.

2.6. Statistical Analysis

The test data were collated and calculated using Microsoft Excel 2016 software, and variance analysis was performed using the general linear model in SPSS (v.20.2). The least significant difference (LSD) method (p < 0.05) was used for multiple comparisons among the treatments. OriginPro 2015 (OriginLab Corporation, Northampton, MA, USA). software and R environment (v.4.0.2) with ‘ggplot2′ [25] were used for curve fitting and plotting.

3. Results

3.1. The Nc of Indica Hybrid Rice Grown from Machine-Transplanted Bowl Seedlings Based on the LAI

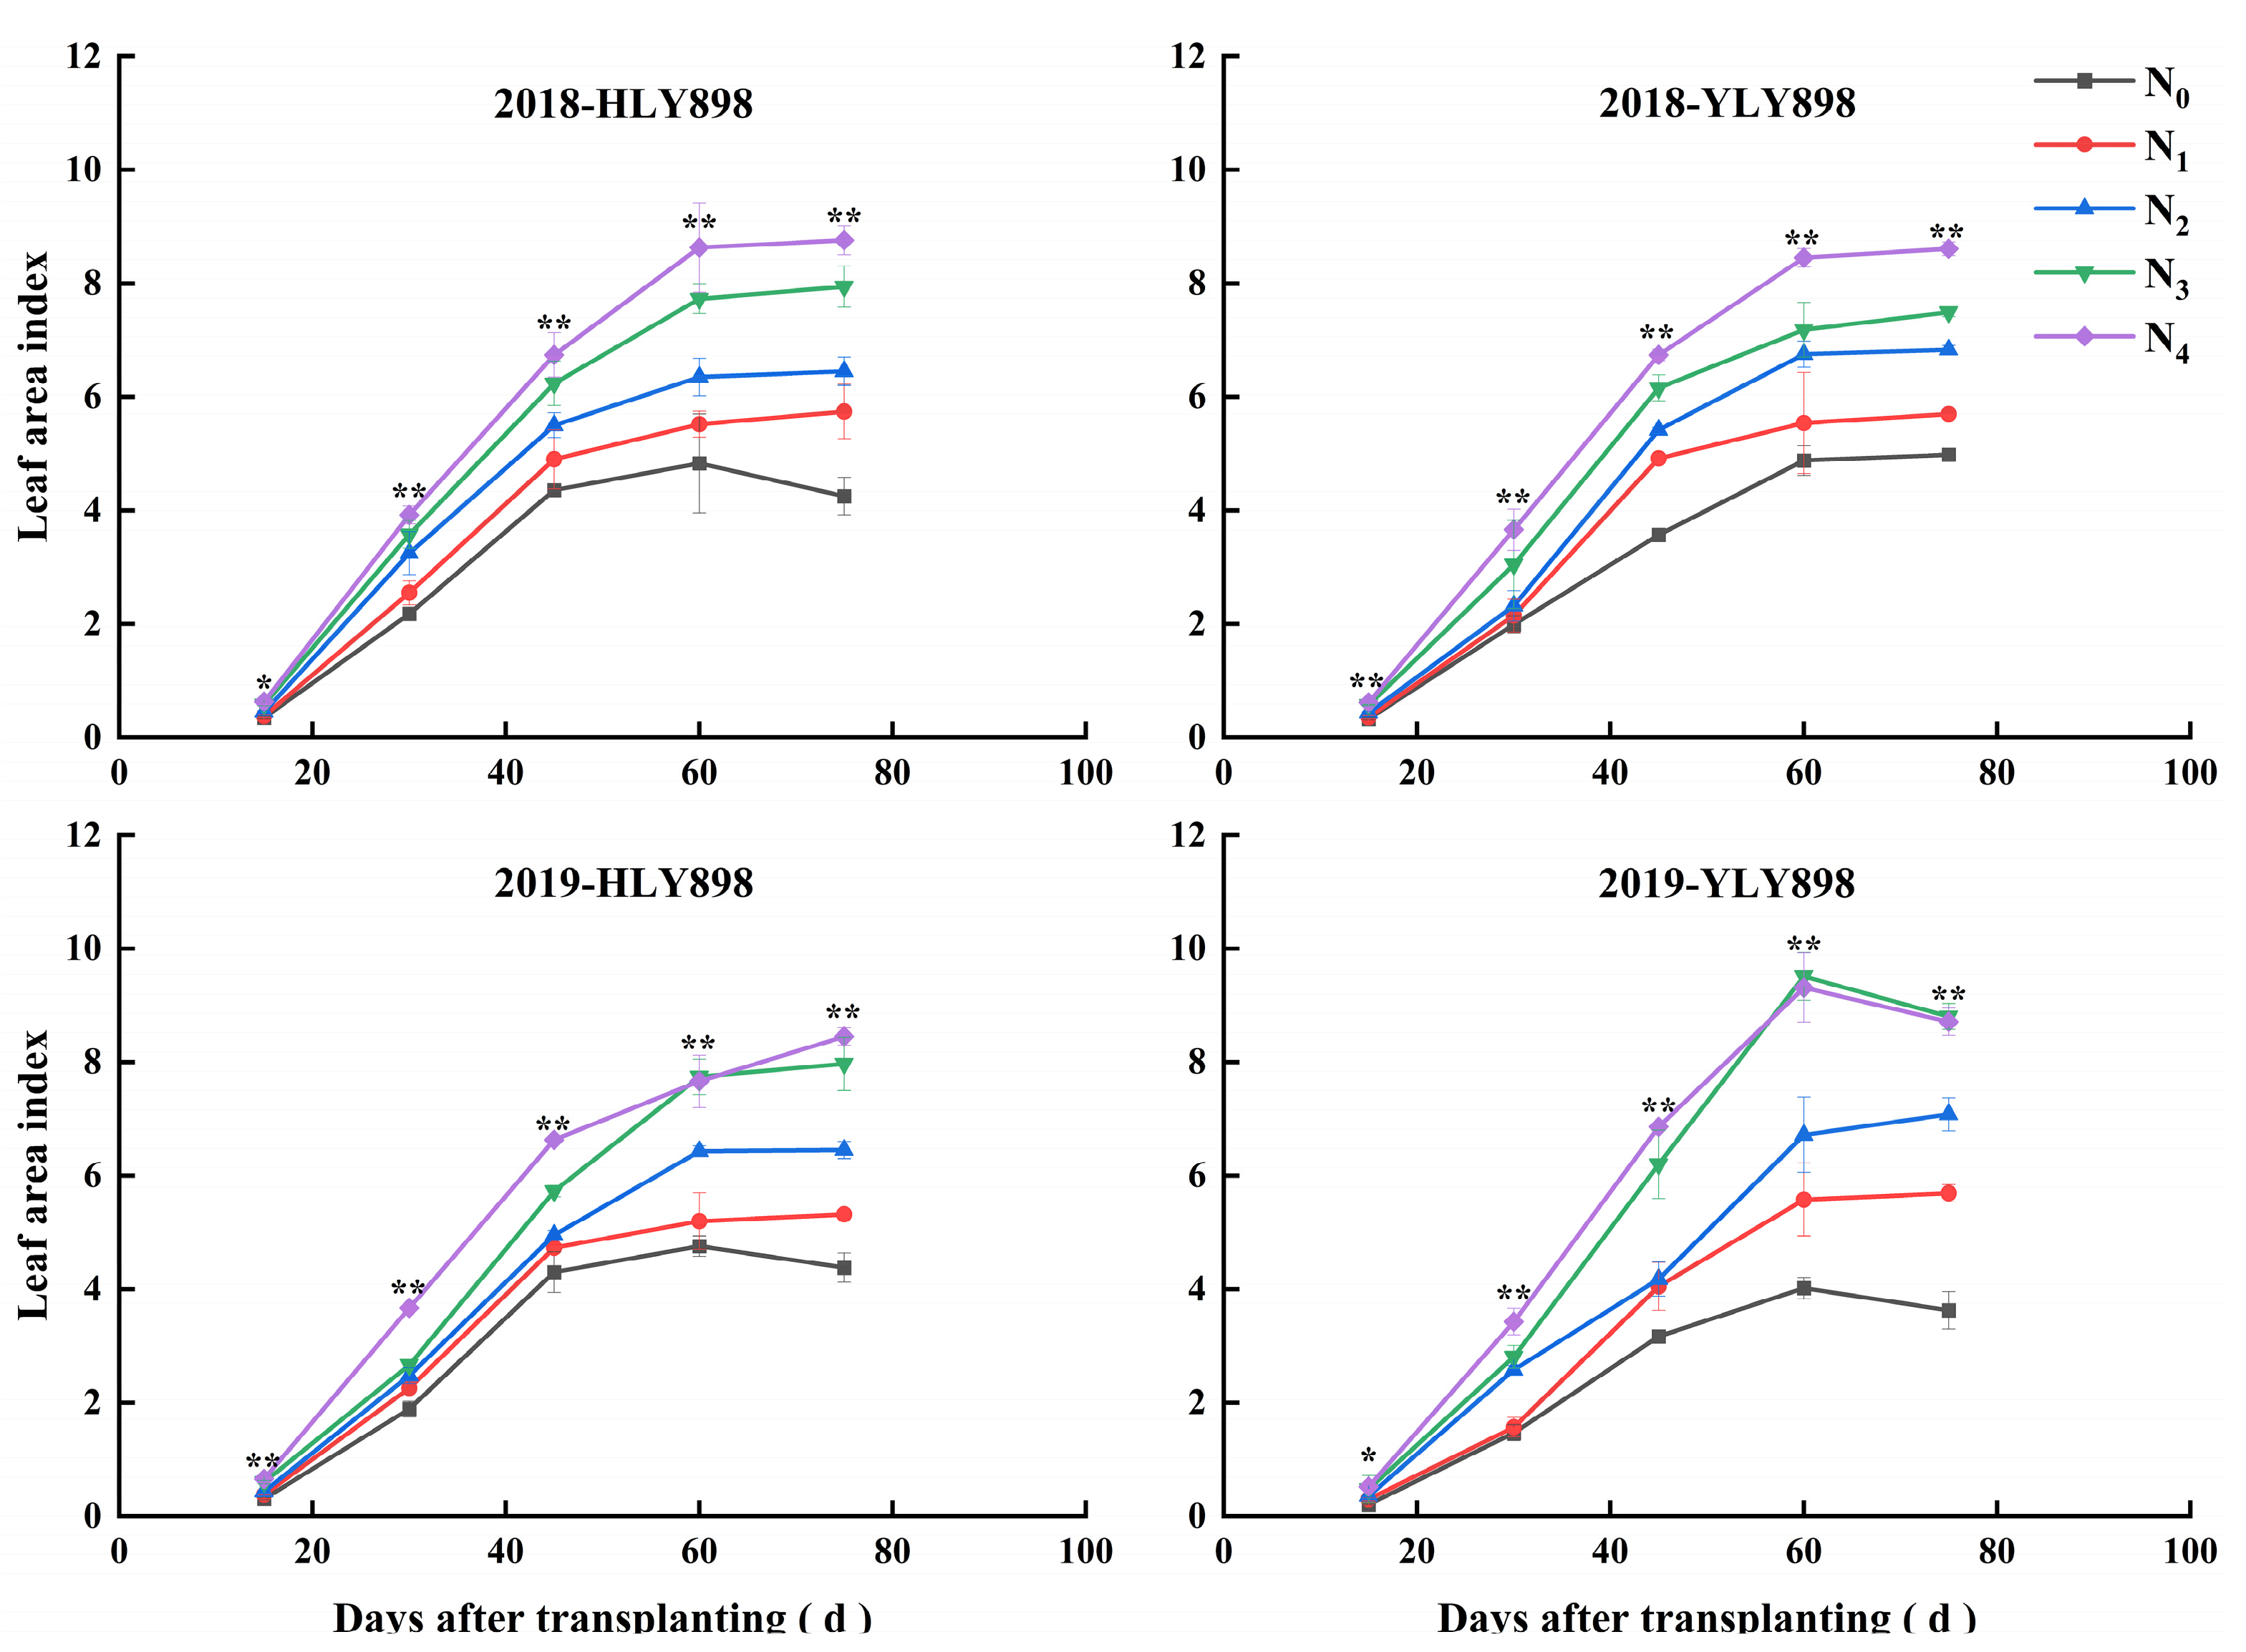
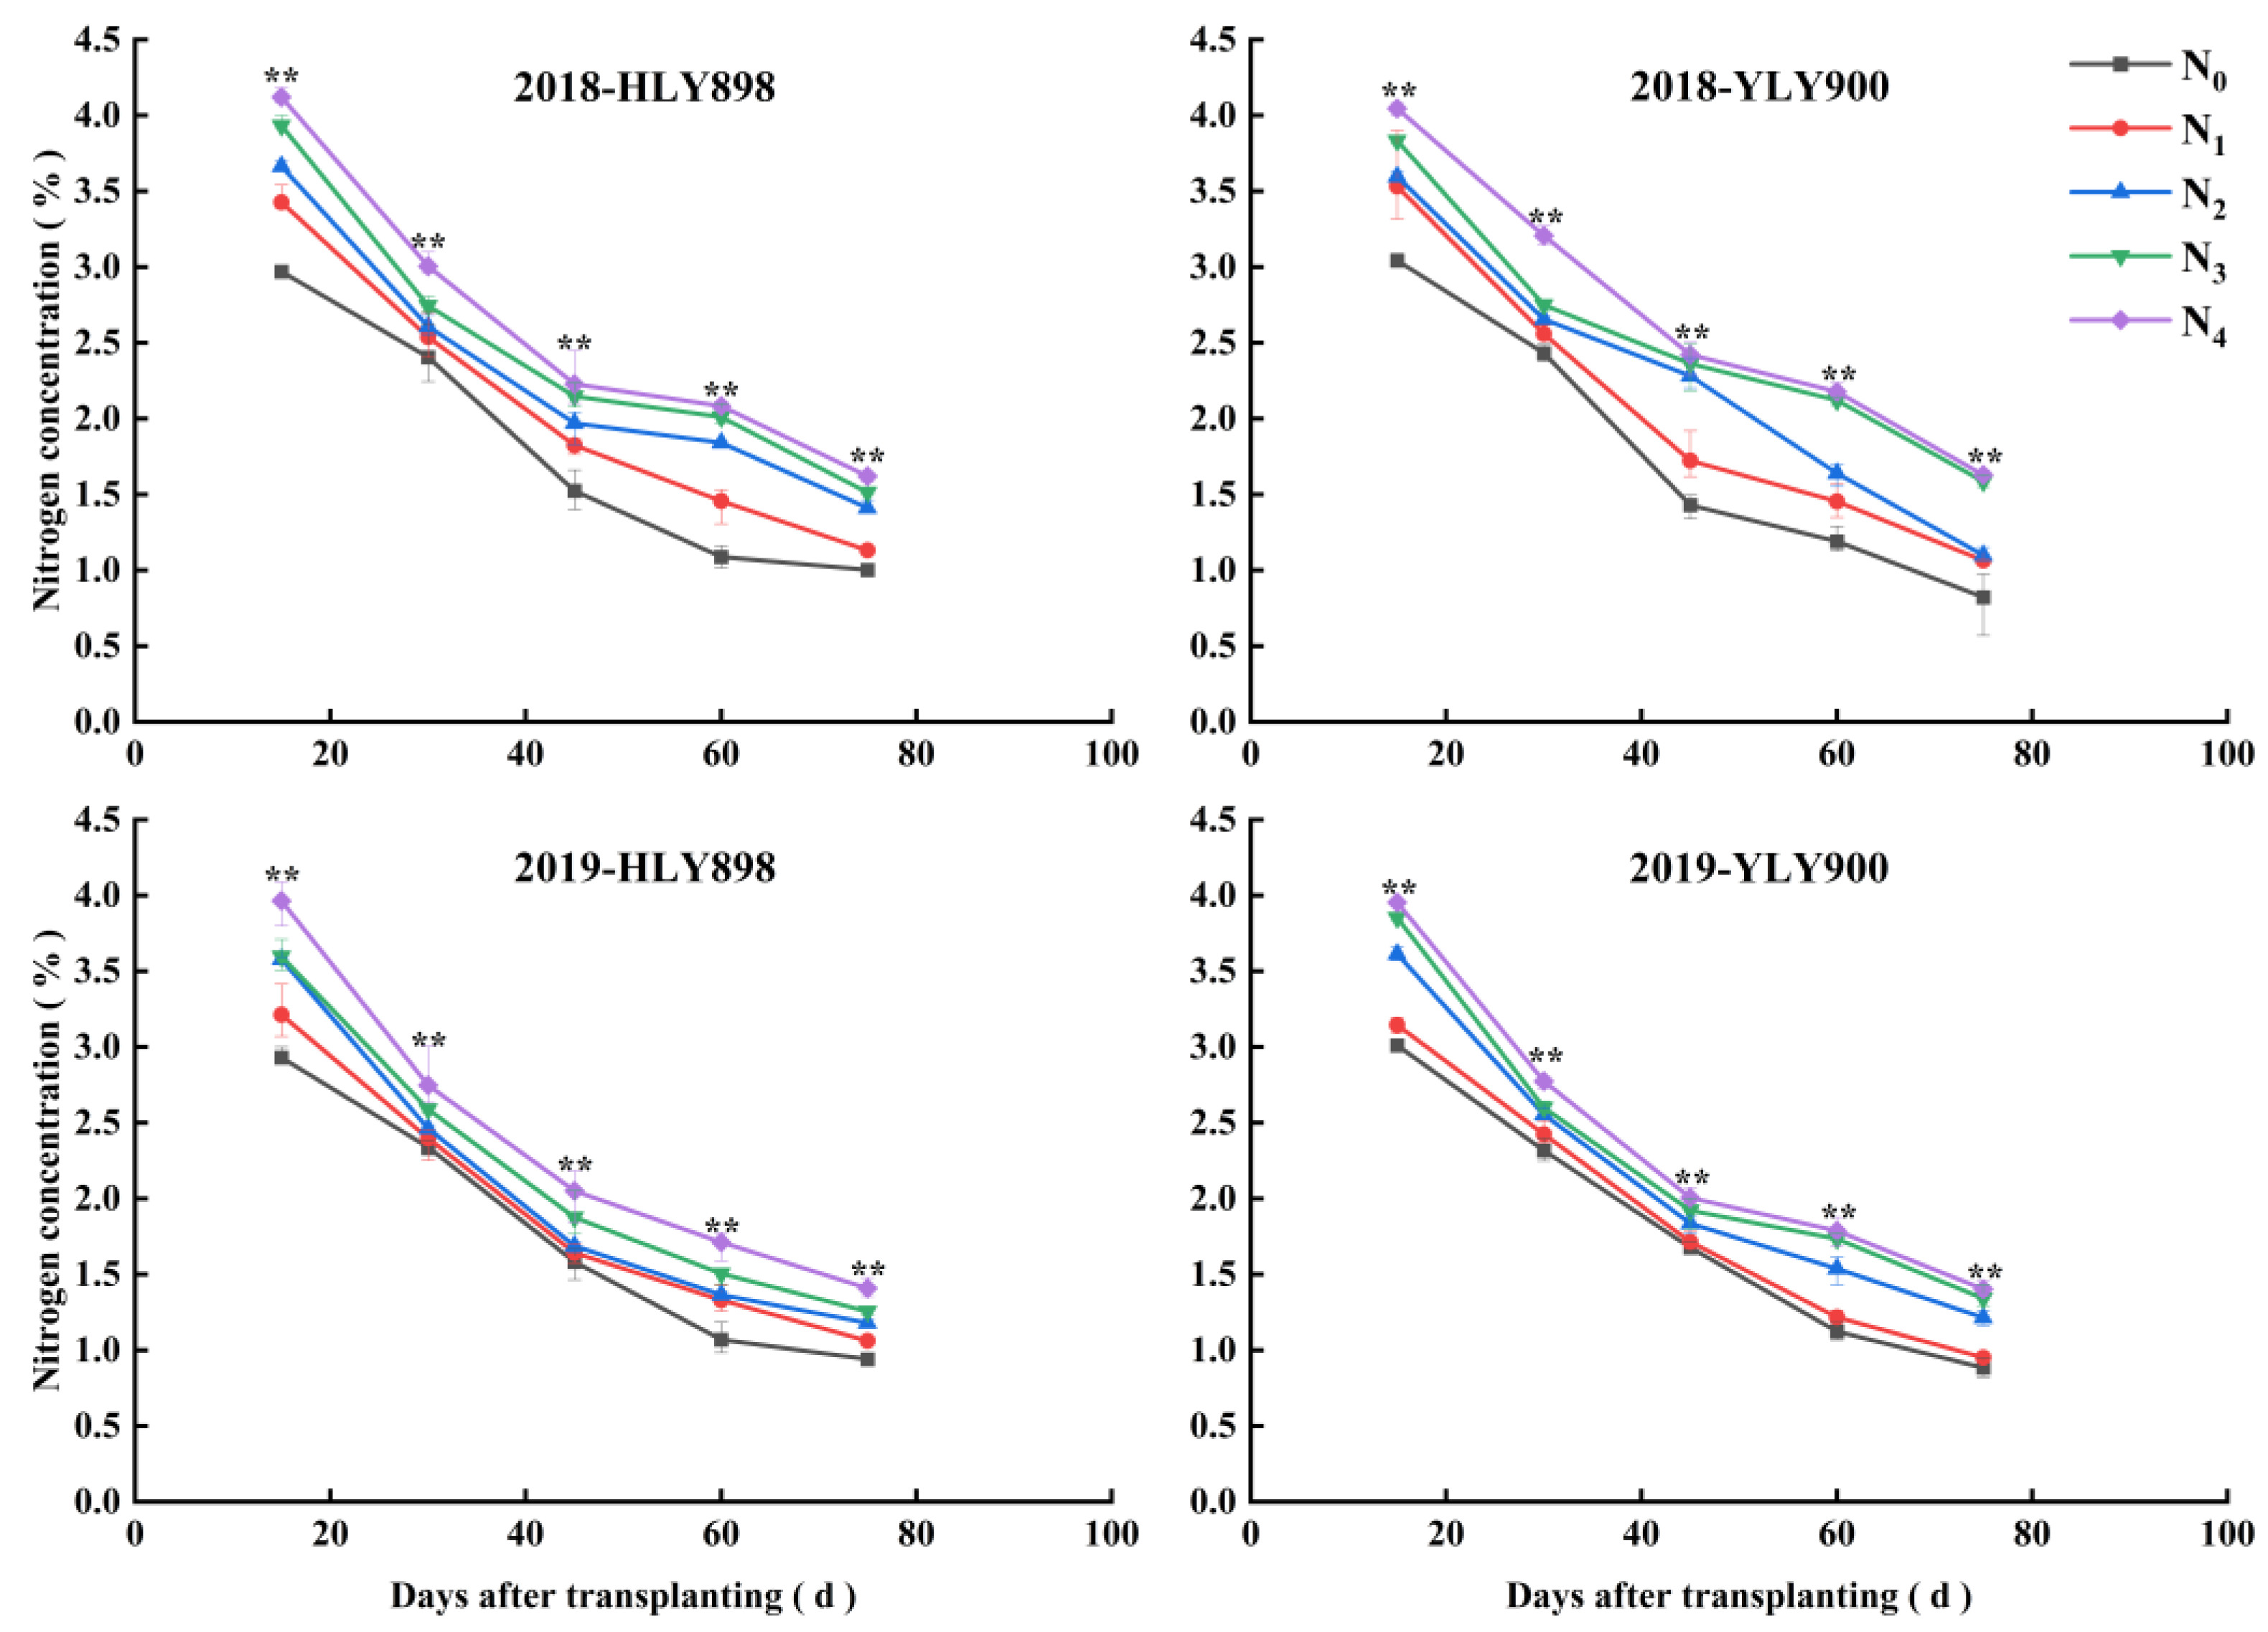
3.1.1. Dynamic Changes in the Agronomic Parameters in Different Growth Periods

The relationship between the LAI and the number of transplanting days for indica hybrid rice (Figure 3) shows that the LAI increased greatly with progression of the growth period in the early growth stage (tillering—jointing stage) with a small associated error value. In terms of the nitrogen application rate, the LAI gradually increased with an increase in the nitrogen application rate. The variation law for the nitrogen concentration with the number of transplanting days (Figure 4) shows that the nitrogen concentration decreased as the number of transplanting days increased, and it decreased significantly in the middle stage before growth (tillering—booting stage) with a small error value. In terms of the nitrogen application rate, the nitrogen concentration gradually increased as the nitrogen application rate increased. At the same time, the variation laws for the LAI and the nitrogen concentration were basically the same during the two-year period. Therefore, this study attempted to determine the Nc of indica hybrid rice grown from machine-transplanted bowl seedlings based on the LAI.

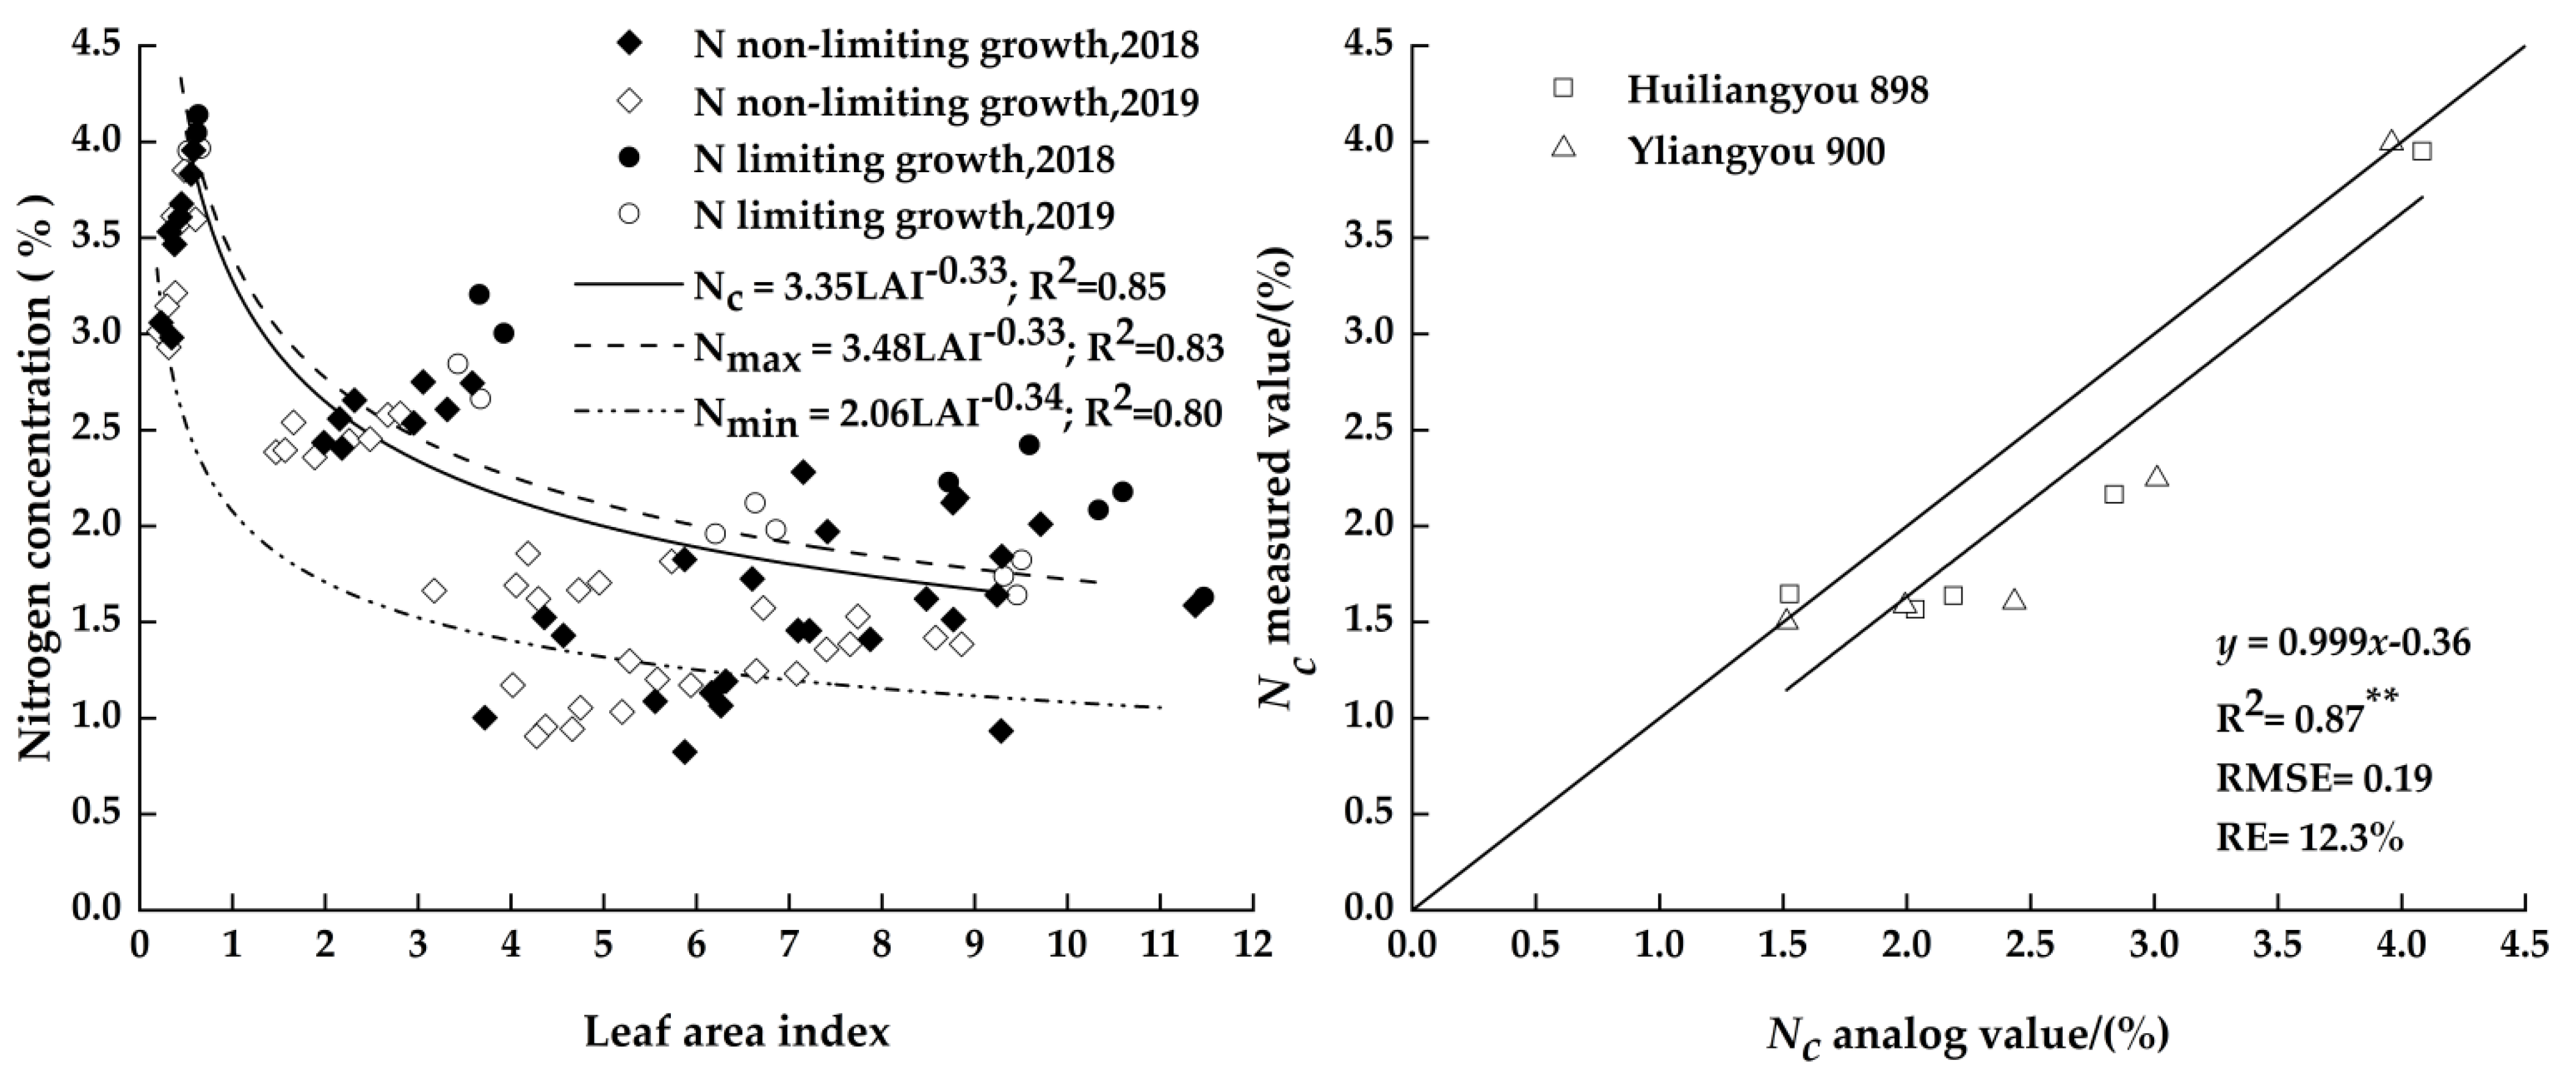
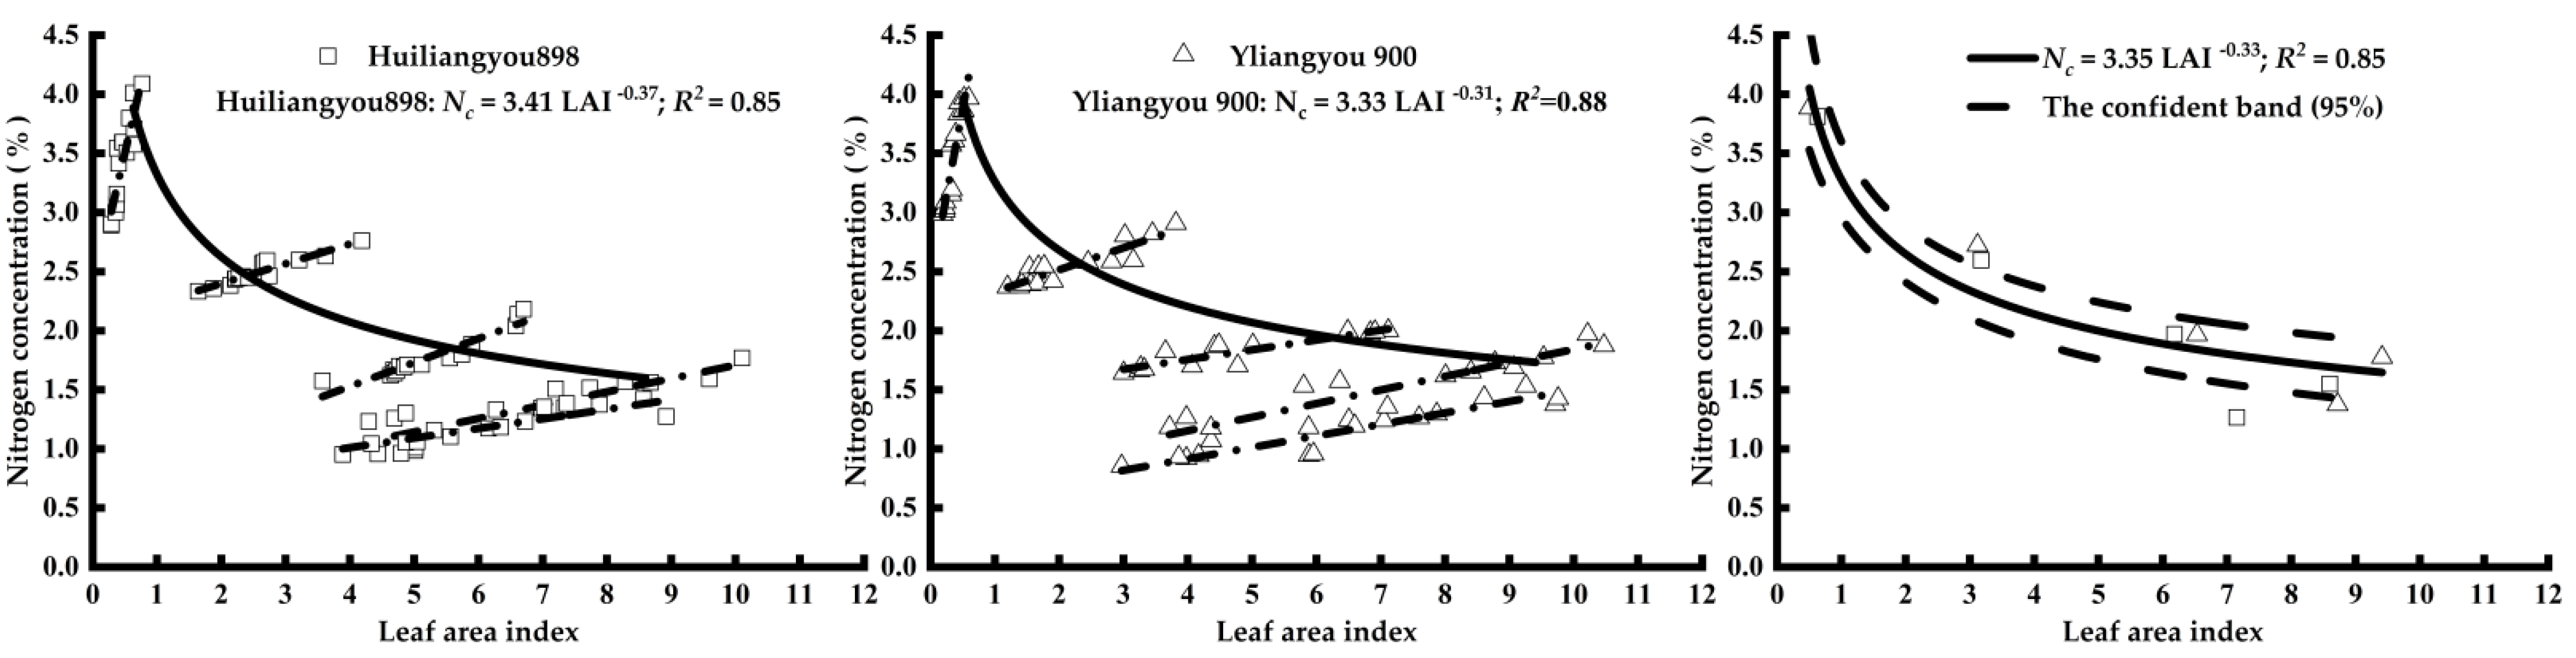
3.1.2. Nc Based on the LAI

Based on the LAI of each sampling date and its corresponding actual nitrogen concentration in 2019, the Nc corresponding to the LAI of each transplantation date was obtained, and linear curve fitting was then carried out for each Nc to construct a dilution curve of the Nc of the machine-transplanted indica hybrid rice with bowl seedlings (Figure 5). The power function equations of the Nc models developed by Huiliangyou 898 and Yliangyou 900 are Nc = 3.41 LAI−0.37, R2 = 0.85 (HLY 898) and Nc = 3.33 LAI−0.31, R2 = 0.88 (YLY 900), respectively. The variance analysis showed that there were no significant differences in the model parameters between the test varieties (p > 0.05). In order to develop a model for indica hybrid rice grown from machine-transplanted bowl seedlings that is suitable for different varieties, the Nc model was constructed by integrating data from two varieties (Nc = 3.35 LAI−0.33, R2 = 0.85).

3.1.3. Model Validation and Comparison

It was demonstrated that the Nc model constructed in this experiment could satisfactorily distinguish between the two-year nitrogen- and non-nitrogen-limited groups (Figure 6). The data points collected for the nitrogen limitation treatment were lower than or close to the Nc, and the data points from the non-nitrogen limitation treatment were higher than or close to the Nc. The maximum and minimum nitrogen concentrations (Nmax and Nmin) and the LAI were observed on each day of indica hybrid rice sampling, and two nitrogen concentration dilution boundary models (Nmax = 3.45 LAI−0.33, Nmin = 2.06 LAI−0.34) were obtained, which were also consistent with the crop nitrogen dilution model. In order to test the reliability and universality of the model, LAI data from 2018 were used to verify the constructed model (Figure 6). The results show there was a strong correlation between the measured and estimated values with a root-mean-square error (RMSE) of 0.19 and relative error (RE) of 12.3%.

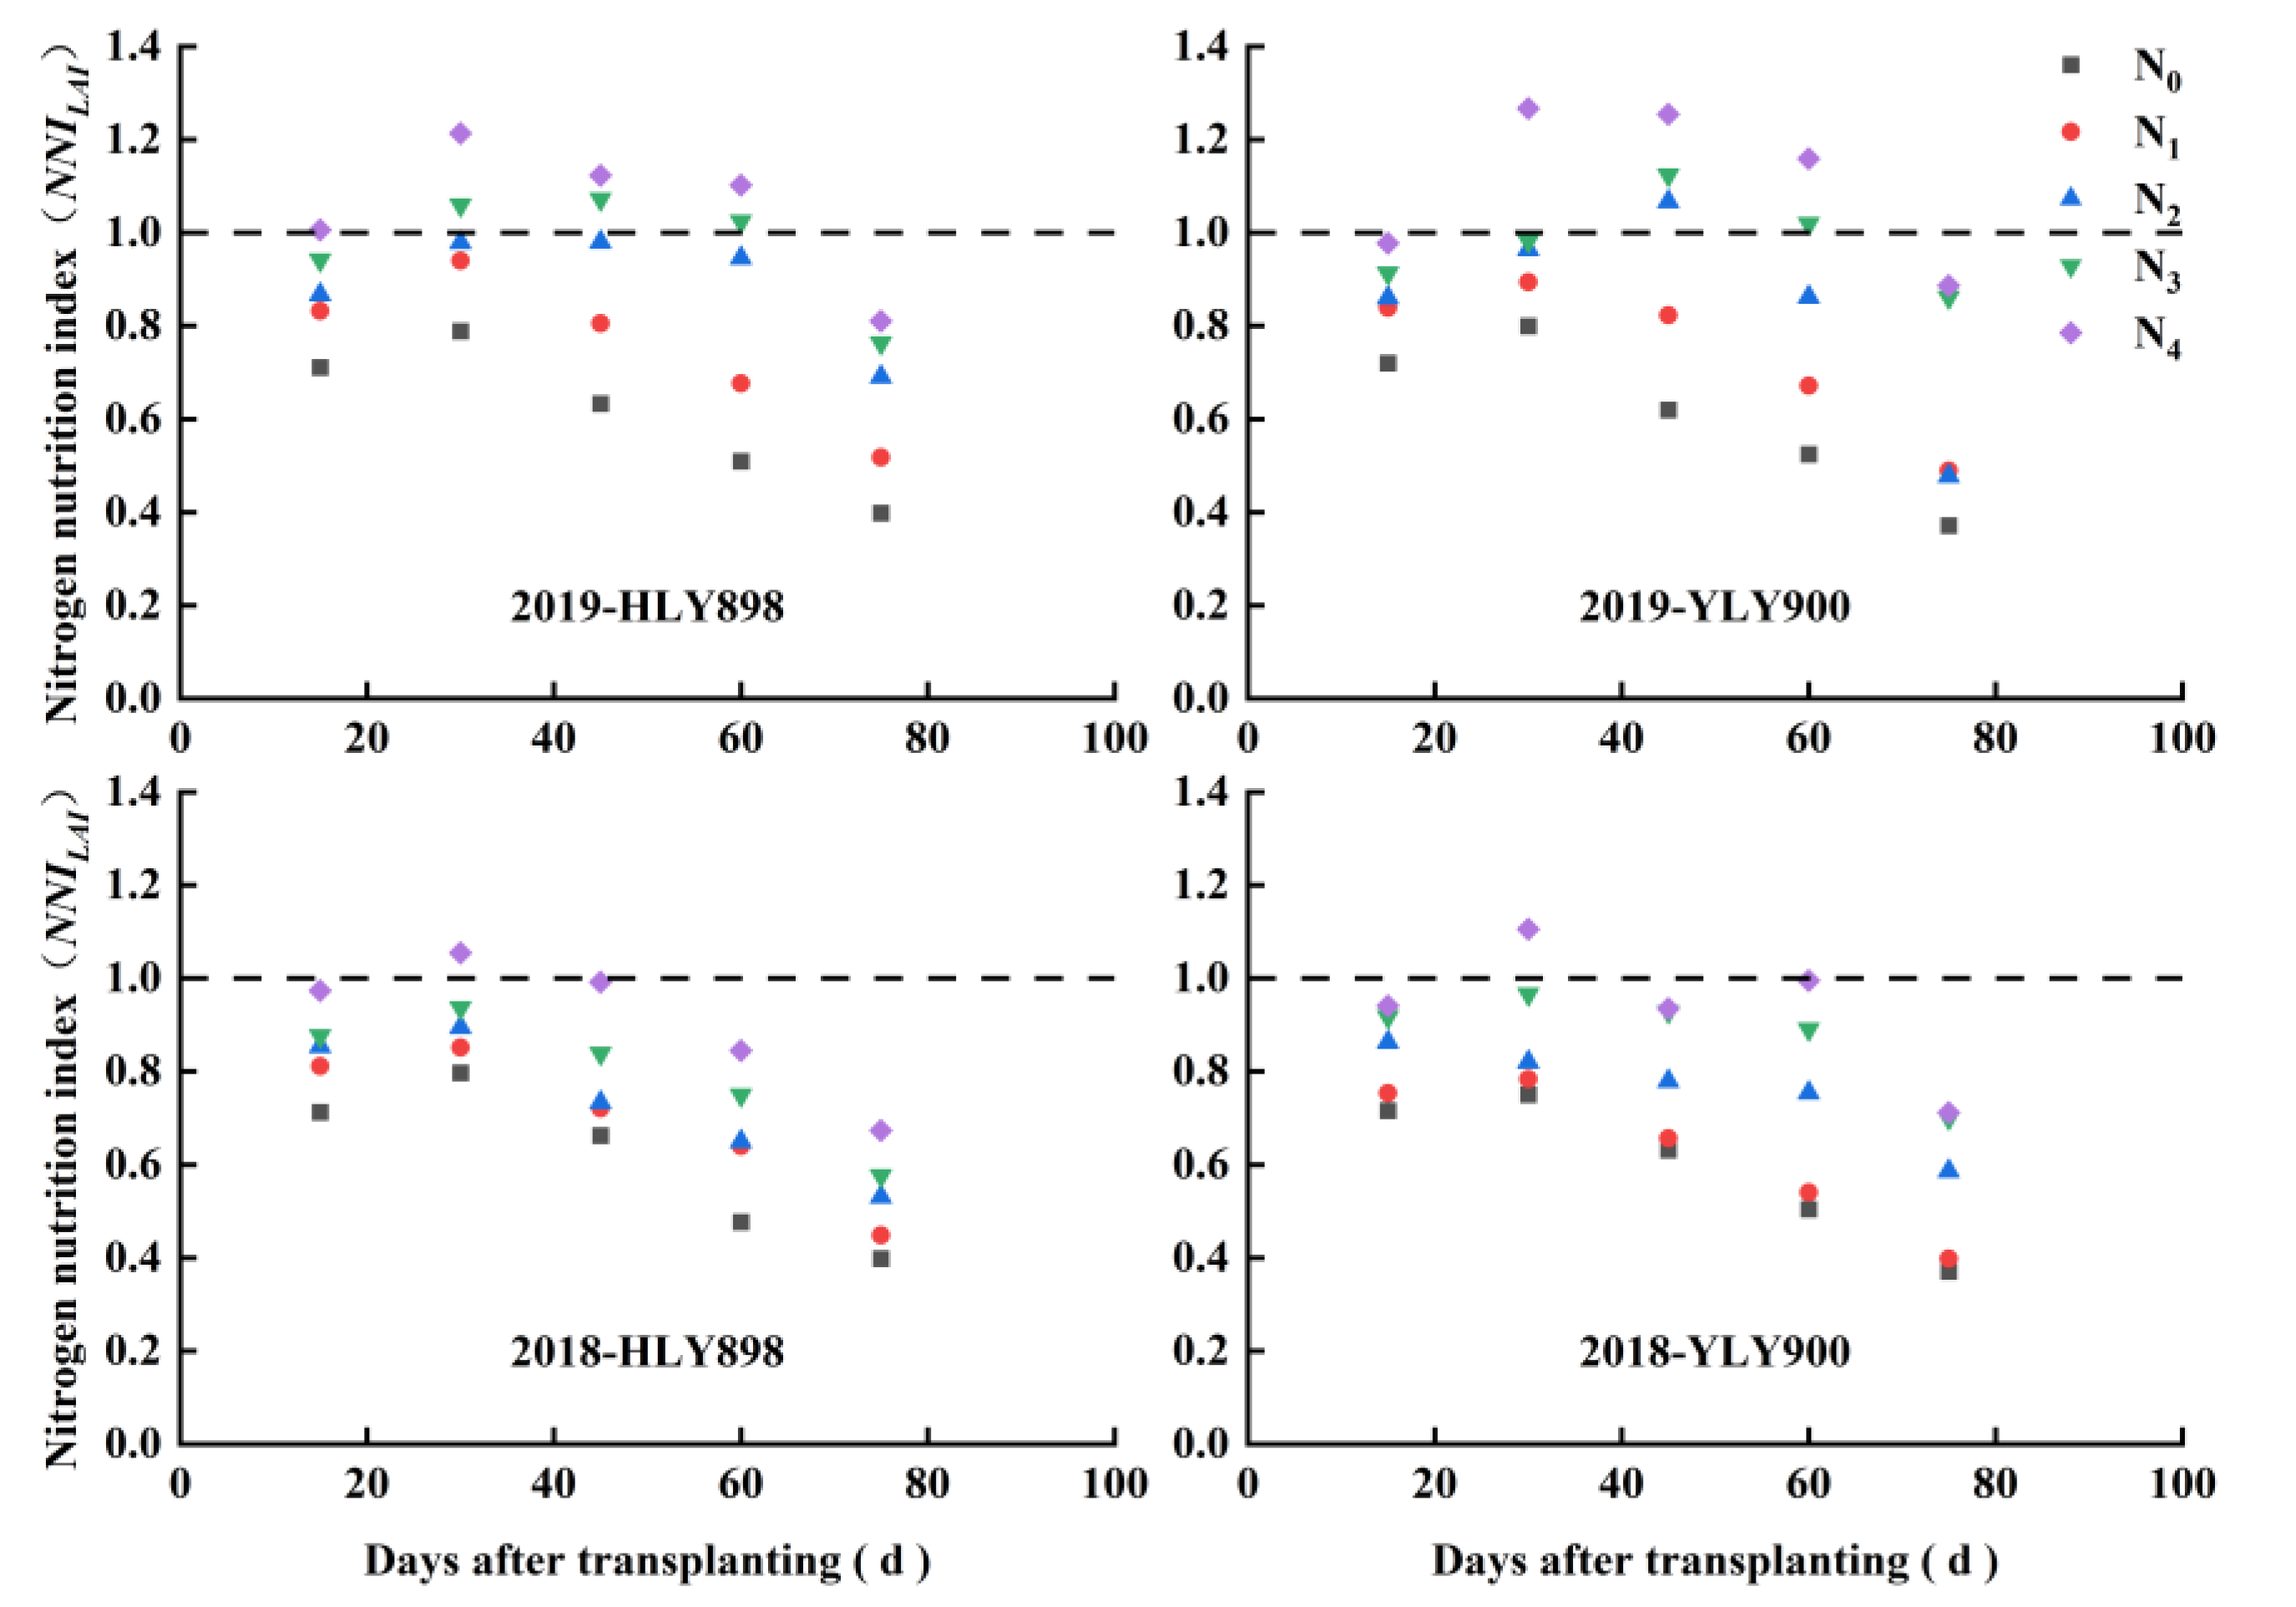
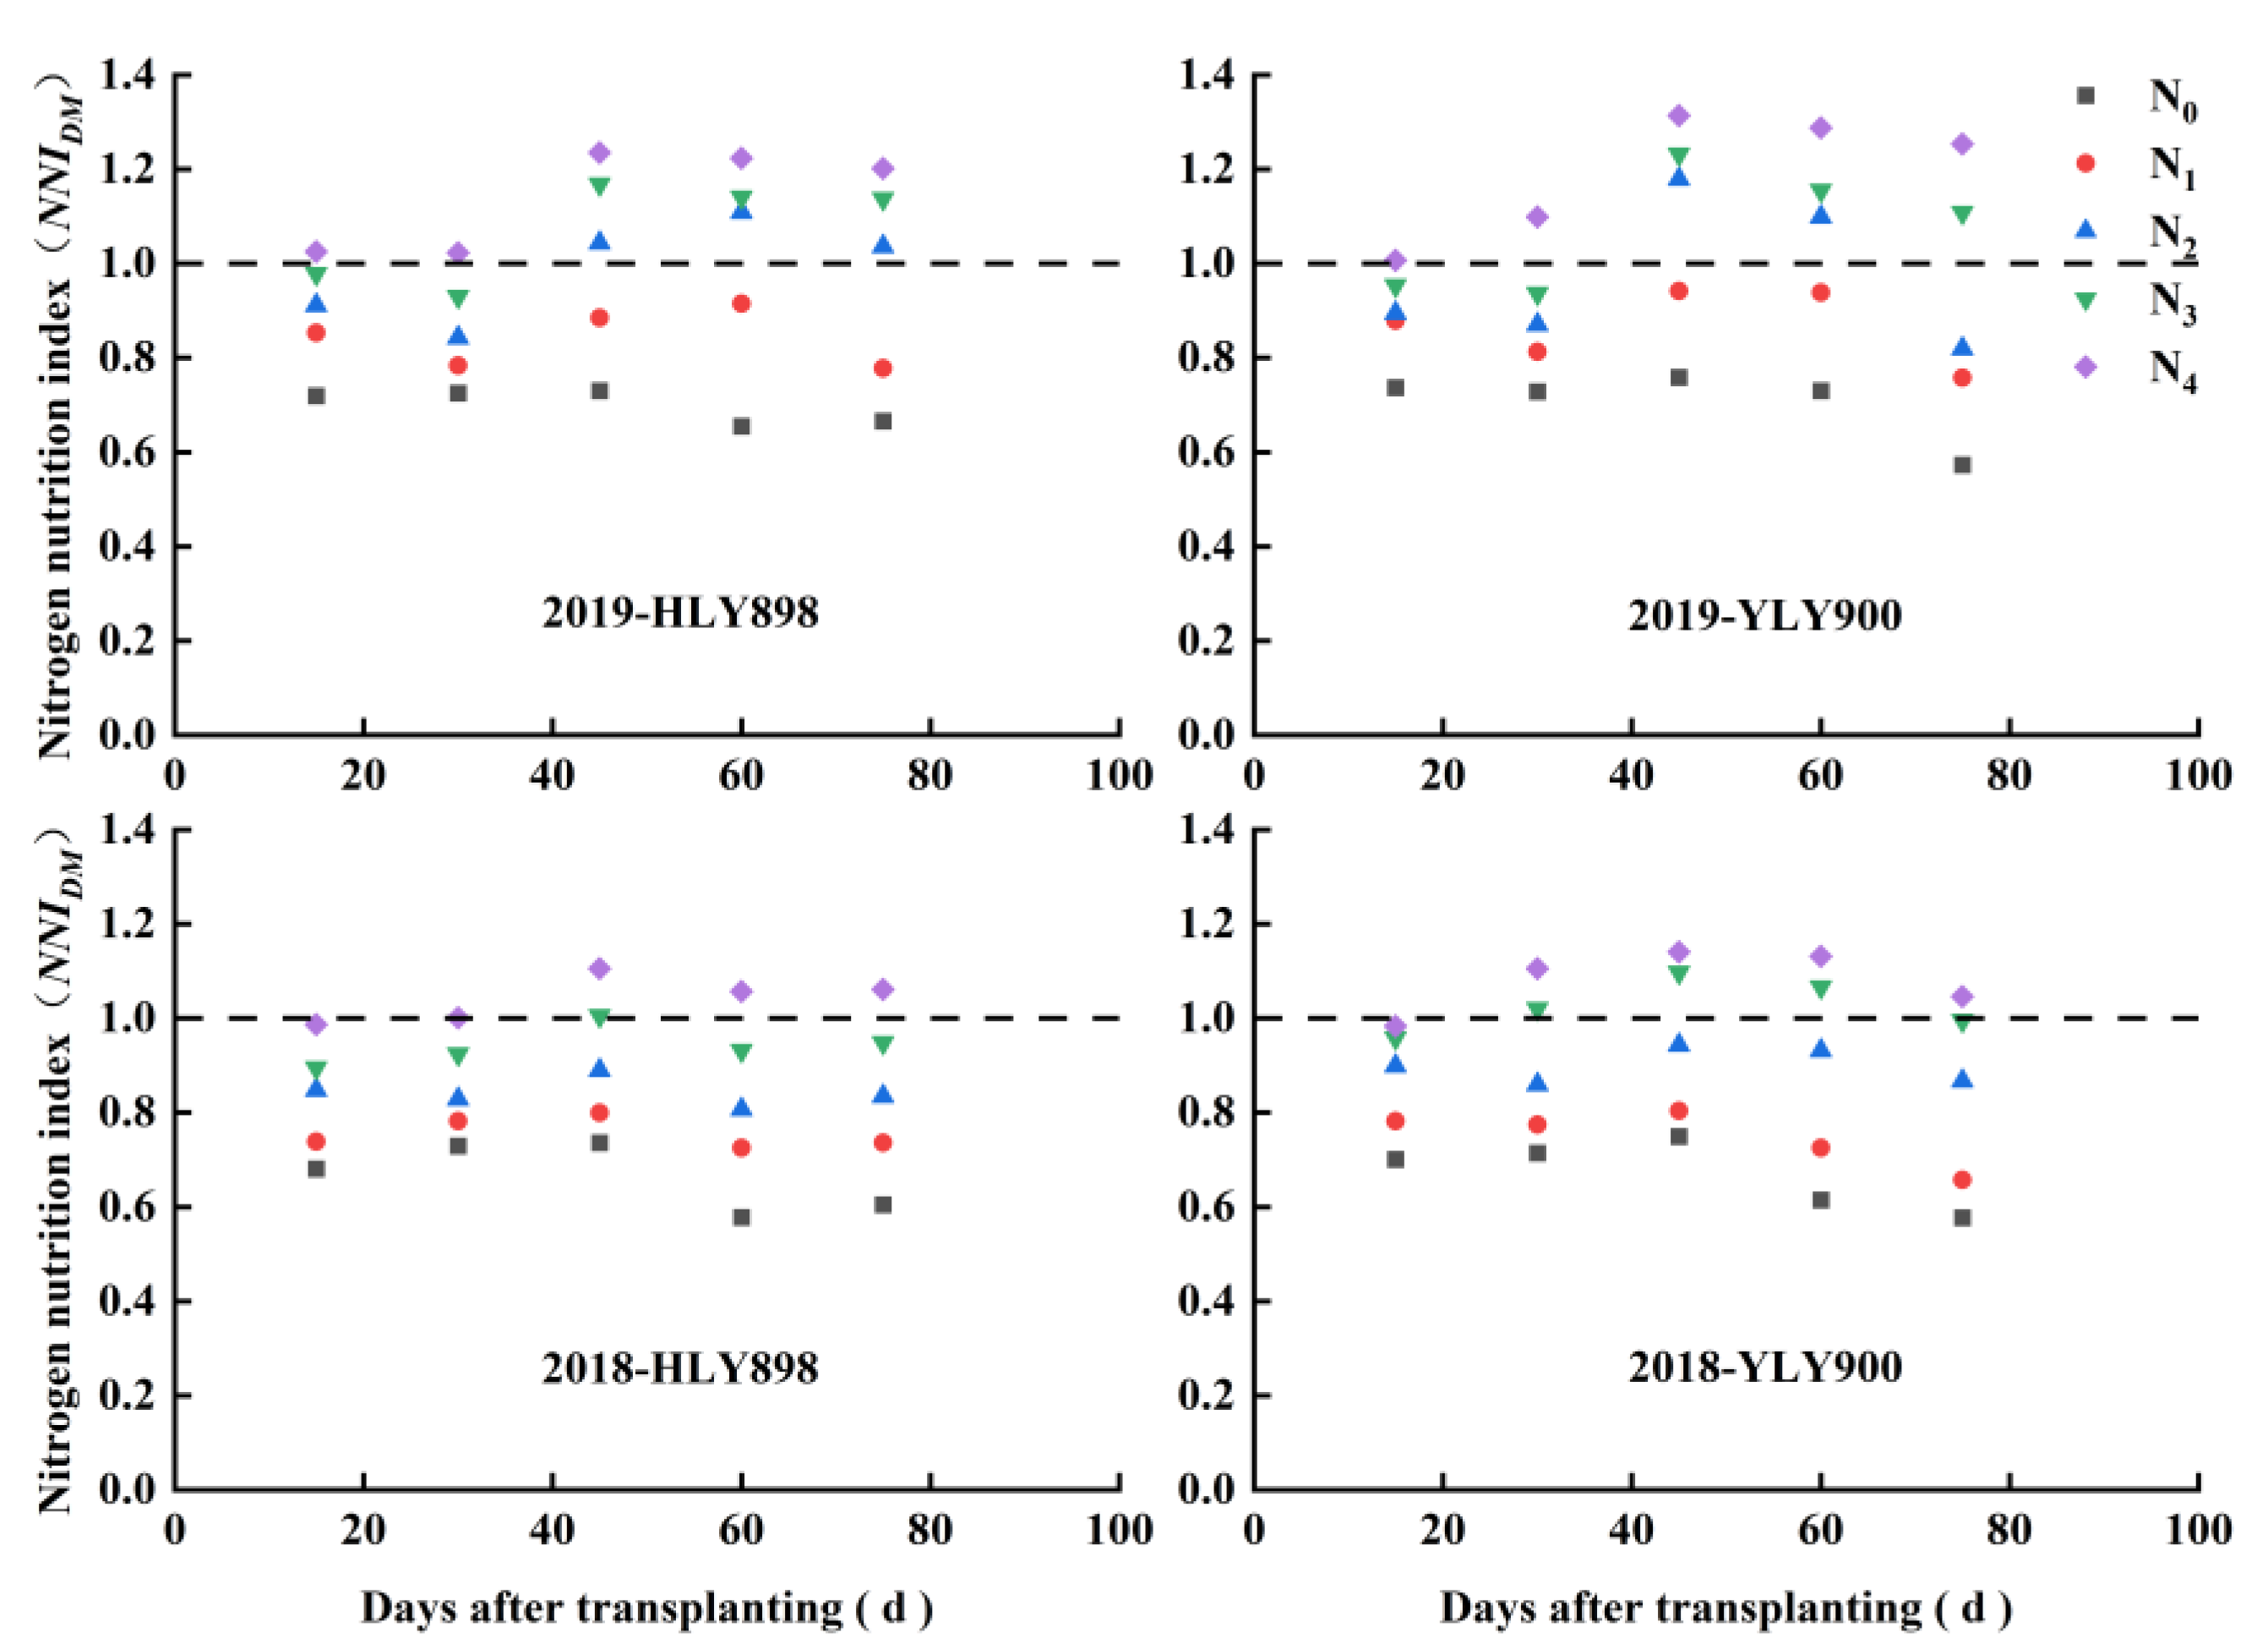
3.2. Dynamic Changes in the NNI in the Indica Hybrid Rice Grown from Machine-Transplanted Bowl Seedlings

The nitrogen nutrition index (NNILAI) was calculated based on a new model for Nc (Nc = 3.35LAI−0.33). The results show that the nitrogen nutrition index of the two rice varieties increased as the nitrogen application rate increased for different years and nitrogen levels. In terms of the NNILAI (Figure 7), the calculation ranges based on the LAI data were determined to be 0.40–1.21 (HLY 898) and 0.37–1.26 (YLY 900) in 2018 and 0.40–1.05 (HLY 898), 0.37–1.11 (YLY 900) in 2019. In terms of the NNIDM (Figure 8), the calculation ranges based on DM data were determined to be 0.65–1.23 (HLY 898) and 0.66–1.31 (YLY 900) in 2018 and 0.58–1.11 (HLY 898) and 0.58–1.14 (YLY 900) in 2019. In addition, the peak point of NNILAI appeared at the tillering stage, and the peak point of NNIDM appeared at the stem elongation stage.

3.3. Relationship between the NNILAI and the Yield of Indica Hybrid Rice Grown from Machine-Transplanted Bowl Seedlings

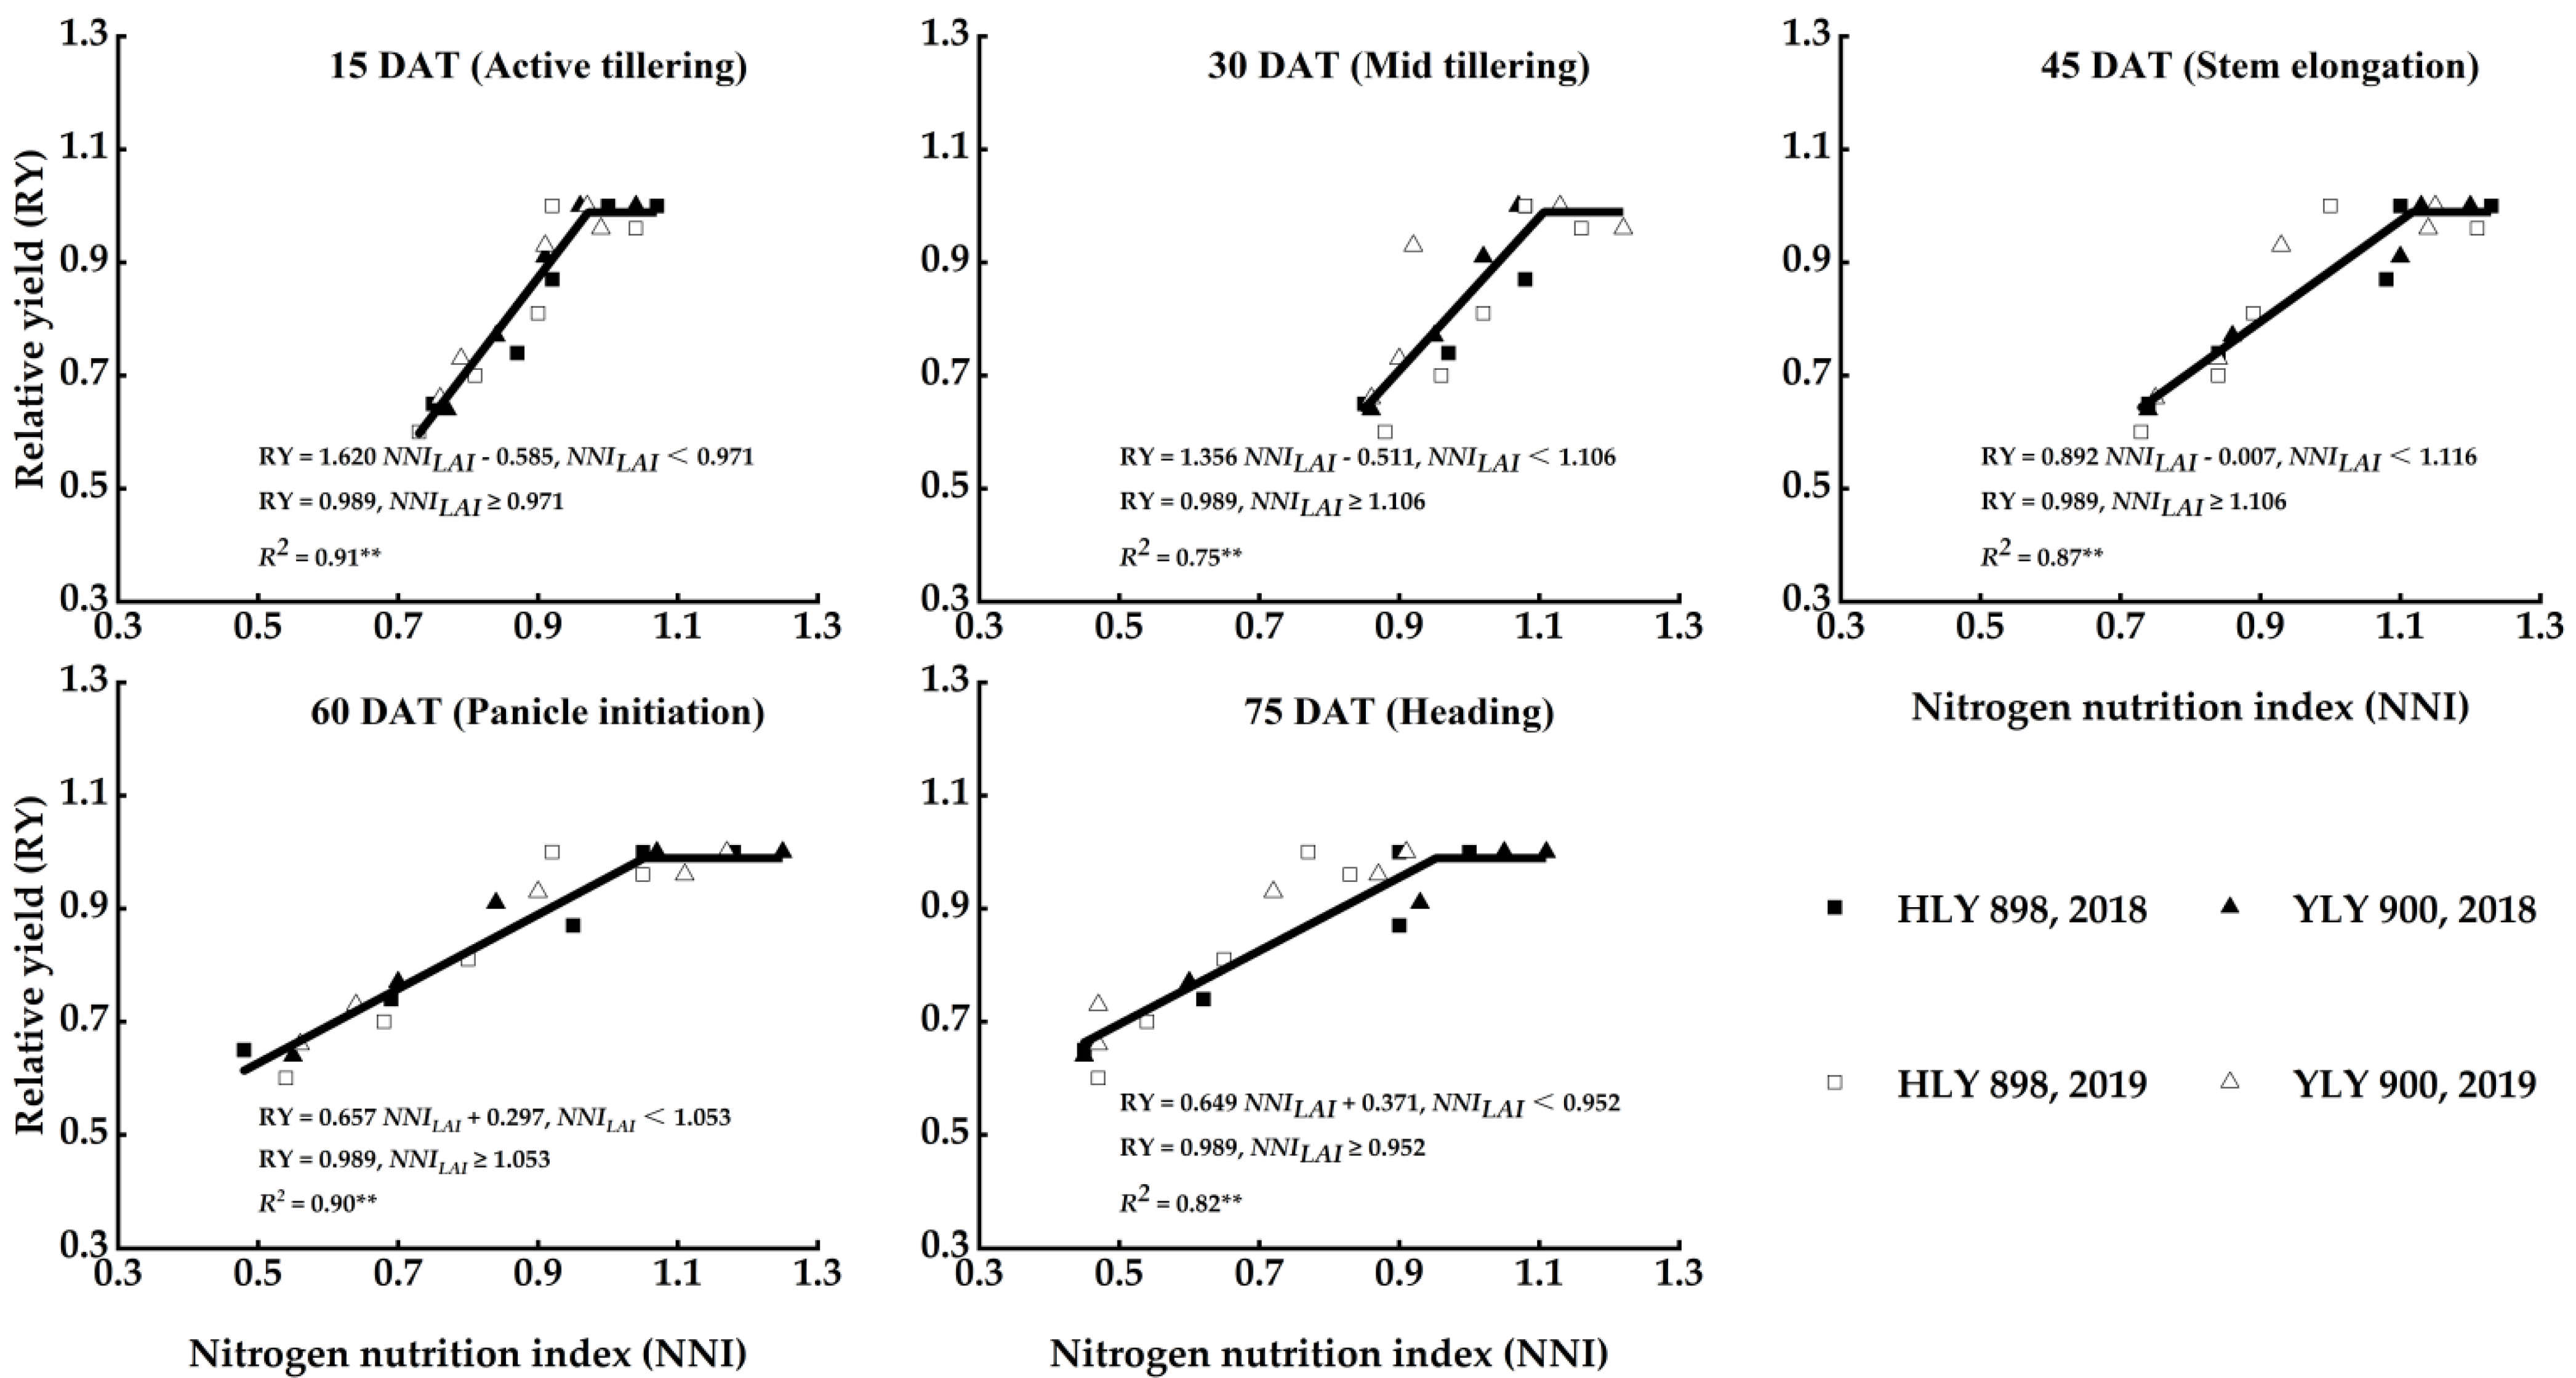
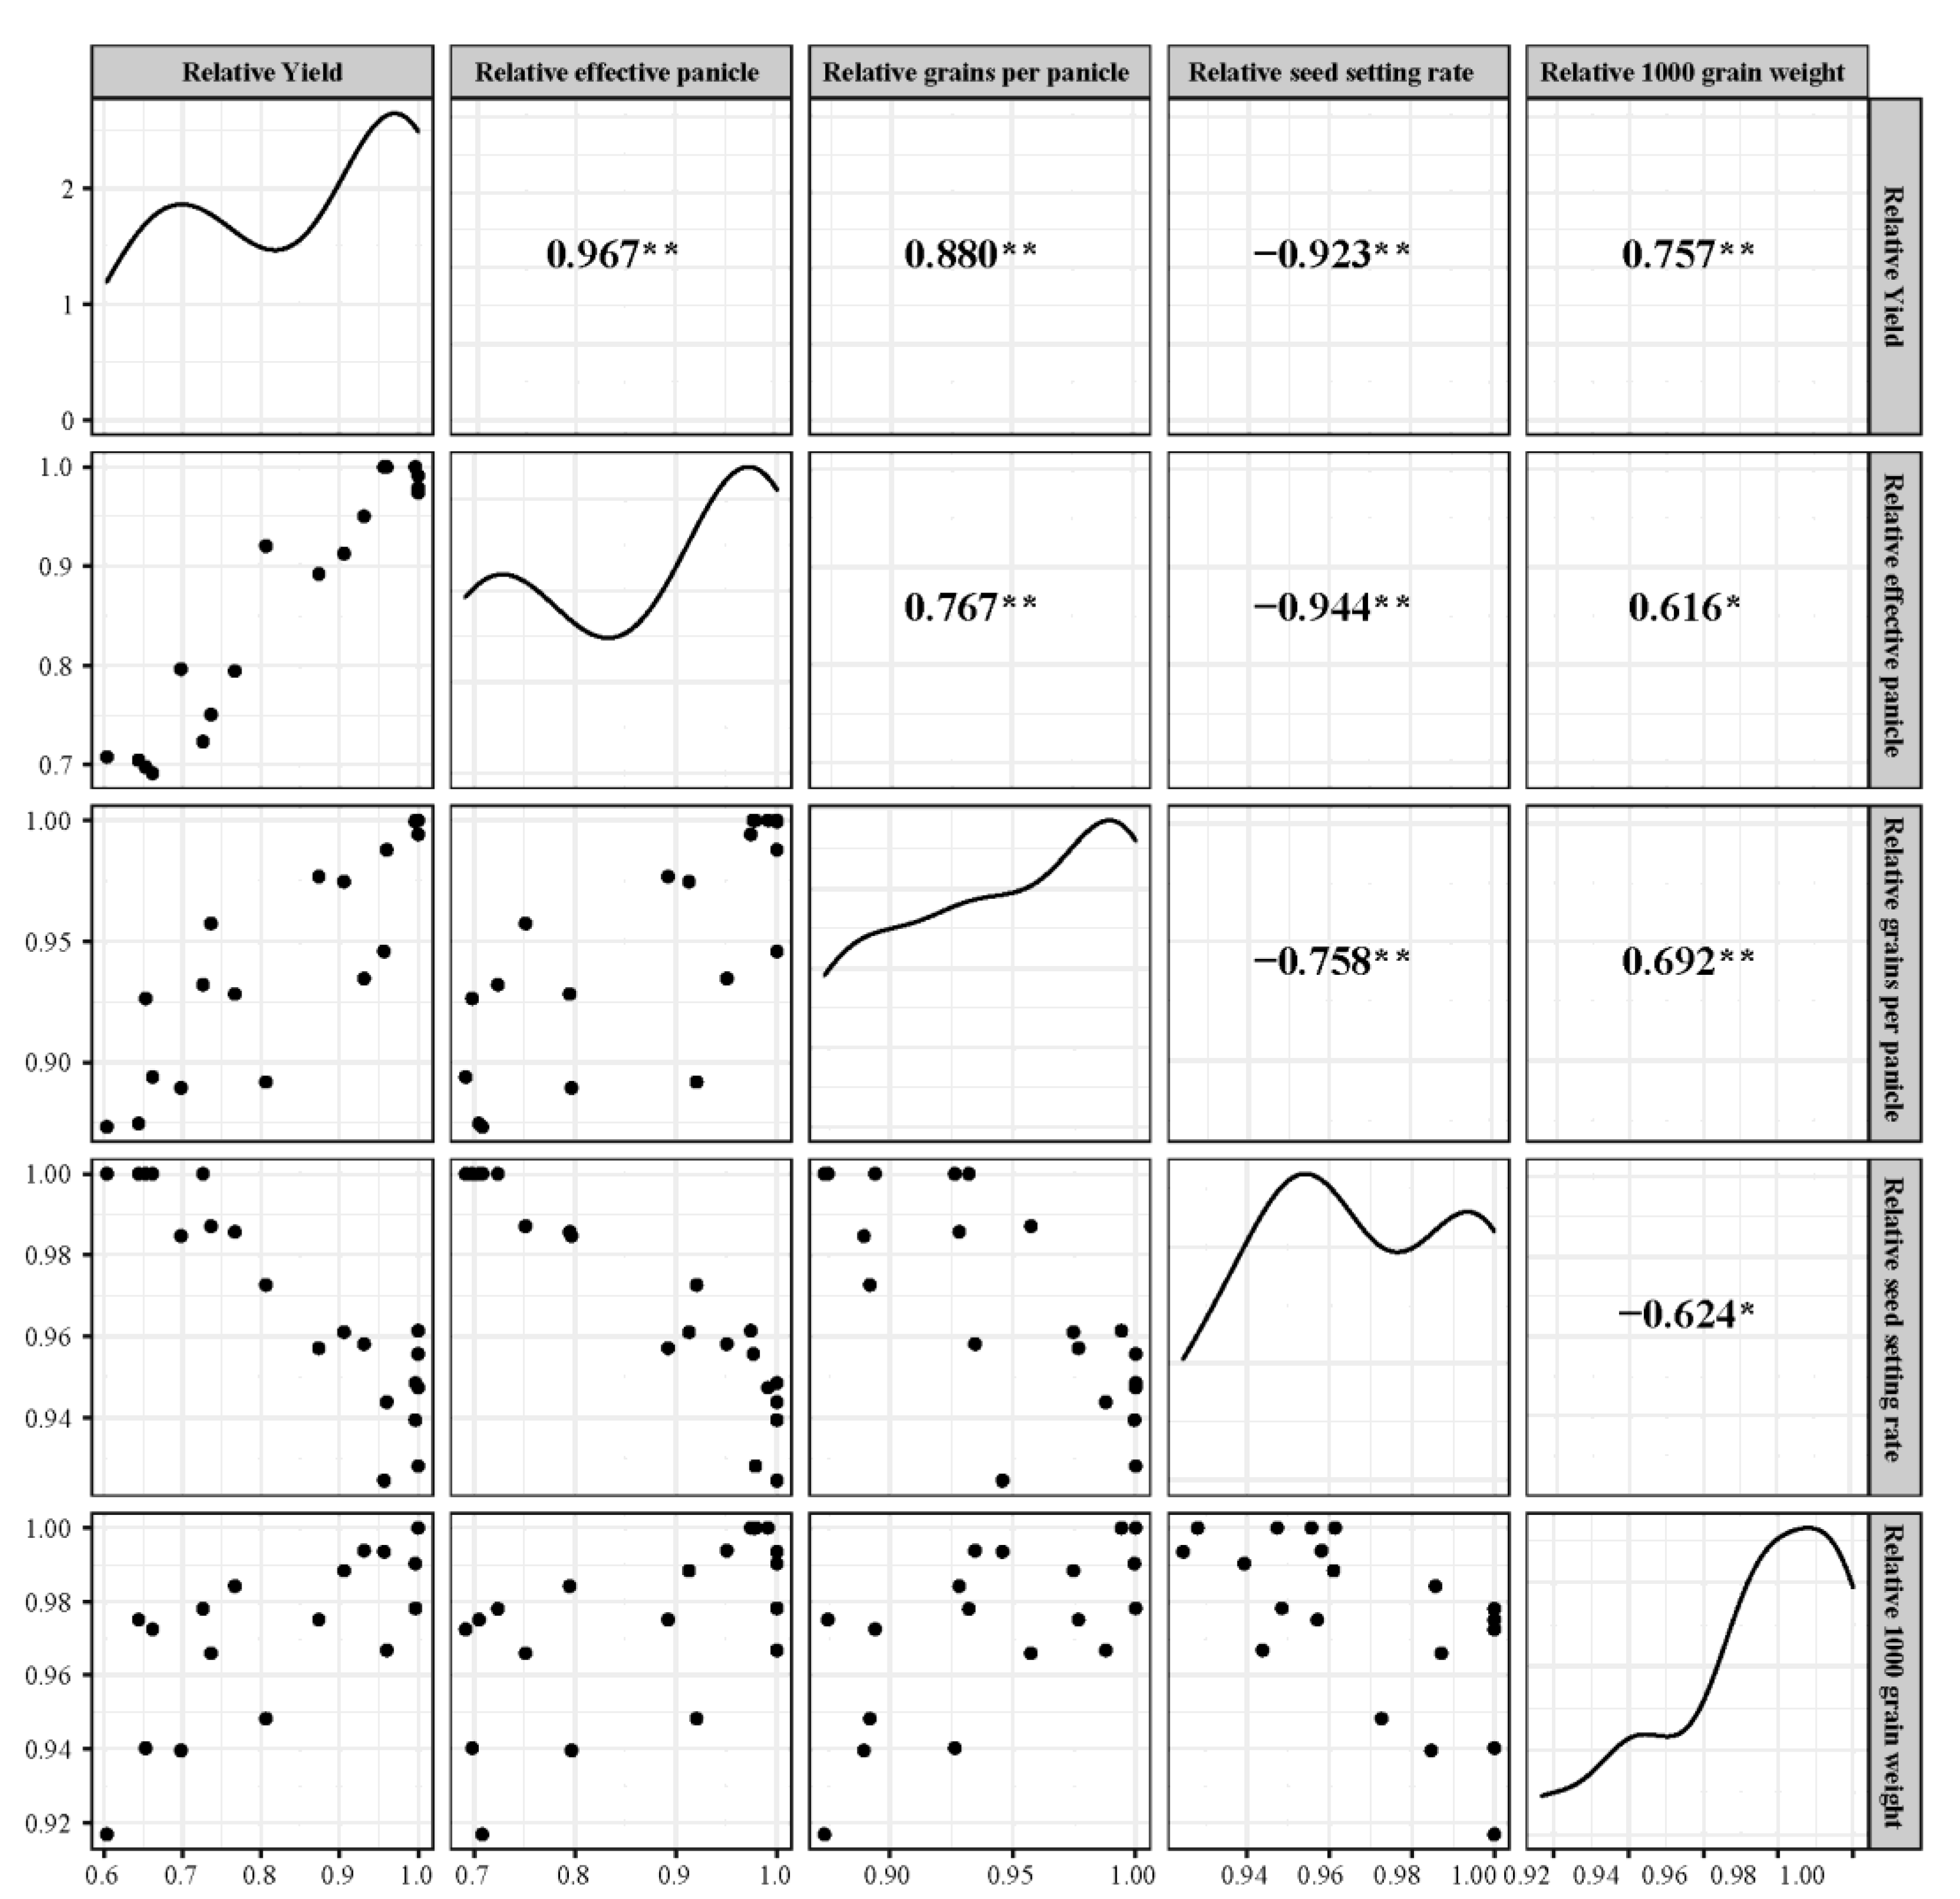
3.3.1. Correlation between the NNILAI and Relative Yield (RY)

The variance analysis of the effects of fertilization, years, and varieties on the NNILAI showed that the nitrogen application rate is the main factor affecting the NNILAI of rice from the tillering stage to the heading stage (p < 0.01). Significant differences were found between the different nitrogen treatments (p ˃ 0.05) (Table 2). The correlation between the NNILAI and yield at different growth stages was analyzed. The results show that the relative yield (RY) of the rice initially increased and then decreased as the NNILAI increased and the two varieties exhibited the same trend for each growth stage over a two-year period (Figure 9). The accuracy (R2) of the NNILAI and relative yield (RY) models were 0.91, 0.75, 0.87, 0.90, and 0.82 at the active tillering, mid-tillering, stem elongation, panicle initiation, and heading stages, respectively. When the NNILAI reached a particular threshold, the relative yield of the rice plateaued, and the thresholds for each period were 0.971 (active tillering stage), 1.106 (mid-tillering stage), 1.116 (stem elongation stage), 1.053 (panicle initiation stage), and 0.952 (heading stage).

3.3.2. Relationship between the Yield and the Yield Components

Considering that the actual yield and the yield components may differ for different varieties and years, the relative value (the ratio of the yield under each treatment to the maximum value under each treatment) was used for the discussion and an analysis of the correlation between the yield and the yield components of the machine-transplanted indica hybrid rice with bowl seedlings was carried out (Figure 10). The results show that the relative yield and the relative yield components had a significant indigenous correlation, and the order was as follows: relative effective panicle number (0.967) > relative seed setting rate (0.923) > relative grain number per panicle (0.880) > relative 1000-grain weight (0.757). At the same time, the relative effective panicle number and the relative seed setting rate also had a significant indigenous correlation.

3.3.3. Correlation between the NNILAI and the Relative Yield Components

In order to further explore the mechanisms regulating the NNILAI and their effects on the yield at different growth stages, the correlation between the NNILAI and relative yield components was established at each critical period of development (Table 3). The relative effective panicle number, relative grain number per panicle, and relative 1000-grain weight were found to be positively correlated with the NNILAI, while the relative seed setting rate was negatively correlated. The two varieties in each growth stage showed the same trend over the two years. In terms of correlation, the correlation between the relative effective panicle number and the relative seed setting rate was stronger than that between the relative grain number per panicle and the relative 1000-grain weight in each growth stage. The correlation between the NNILAI and the relative effective panicle number was the highest in the tillering stage (R2 = 0.880, 0.875), followed by the relative seed setting rate (R2 = 0.811, 0.808). The correlation between the NNILAI and the relative seed setting rate was the highest in the stem elongation–heading stage (R2 = 0.827, 0.900, 0.779), followed by the relative effective panicle (R2 = 0.793, 0.766, 0.776). In terms of the NNILAI threshold, the NNILAI threshold of the relative effective panicle numbers in the tillering stage were 0.971 (active tillering stage) and 1.106 (mid-tillering stage), the same as the NNILAI threshold of the relative yield, while that for the relative seed setting rate was quite different, with error values of 0.022 and 0.014, respectively. The NNILAI threshold values for the relative seed setting rate in the jointing—heading stage were 1.116 (stem elongation stage), 1.053 (panicle initiation stage), and 0.952 (heading stage), similar to the NNILAI threshold of the relative yield. The NNILAI thresholds of the relative spike grain number and the relative 1000-grain weight had high levels of error when compared with the NNILAI thresholds of the relative yield in each stage.

4. Discussion

4.1. Comparison of the Different Nc Models

In this study, the LAI of two indica hybrid rice varieties gradually increased as the nitrogen application rate was increased, and the difference in the model parameters between the varieties was not significant (p > 0.05, Figure 5). Therefore, based on the LAI of the two varieties, the Nc model was constructed for indica hybrid rice grown from machine-transplanted bowl seedlings (Nc = 3.35LAI−0.33, R2 = 0.85). The model conforms to the dilution model of the power function curve [9]. However, there are some differences between parameters a and b compared with the Nc model based on the LAI (Nc = 3.70LAI−0.35) constructed by Ata-Ul-Karim for japonica rice [15]. These differences are mainly due to the nitrogen concentration in indica hybrid rice being lower than that of japonica rice for the same LAI and because the values are more critically affected by environmental factors and cultivation measures. There were great differences in the climate, soil, and other environmental factors as well as the planting methods between the two experimental sites. However, the difference in the b value is small, and Zhao et al. believes that b is the statistical parameter that controls the slope of the curve and is less affected by climate, soil, and other environmental factors and varieties [26]. After verification with an independent experiment conducted in 2018, the model of Nc that was newly built in this study for indica hybrid rice grown from machine-transplanted bowl seedlings was able to satisfactorily distinguish between the data points from the nitrogen-limited and non-nitrogen-limited groups. The root-mean-square error (RMSE) of the prediction model was 0.19, and the relative error (RE) was 12.3%, indicating that the model is very stable. This indicates that it is feasible to use the model to construct an Nc model of indica hybrid rice based on the LAI. In order to further study the variation law of the nitrogen nutrition index of indica hybrid rice grown from mechanically transplanted bowl seedlings, this paper introduced the Nc model based on DM, as determined in our earlier study (Nc = 4.02DM−0.42) [12]. There are obvious differences between the two models: the Nc model of DM gave higher values than the model based on the LAI, which is due to the fact that the LAI and DM are in an allometric growth state during plant growth [15]. Some researchers believe that leaves, as the main photosynthetic organ, are sensitive to nitrogen application [27,28,29]. Therefore, it is necessary to discuss differences in the estimation of the nitrogen nutrition status of indica hybrid rice obtained based on the two Ncs.

4.2. Comparison of Two Different NNIs (NNILAI and NNIDM)

In different years and with different nitrogen levels, the values for the nitrogen nutrition index (NNILAI and NNIDM) of the two varieties of rice obtained by the two models increased as the nitrogen application rate was increased in each period [30]. In terms of the NNILAI derived from the NC model based on the LAI, the ranges in 2018 were 0.40–1.21 (HLY 898) and 0.37–1.26 (YLY 900), while they were 0.40–1.05 (HLY 898) and 0.37–1.11 (YLY 900) in 2019. For the NNIDM derived from NC models based on the DM, the ranges in 2018 were 0.65–1.23 (HLY 898) and 0.66–1.31 (YLY 900), while they were 0.58–1.11 (HLY 898) and 0.58–1.14 (YLY 900) in 2019. The NNIDM peak appeared in the stem elongation stage, while the NNILAI peak appeared in the tillering stage [12]. This is because the indica hybrid rice tillering number reached its maximum value in the early growth stage when the nitrogen supply was sufficient. The increase in DM was fastest at the jointing stage, and the increase in the LAI could not effectively results in an increase in the DM of rice in the early growth stage [31]. In conclusion, the nitrogen nutrition status reflected by the two models, namely the NNI, differs. Therefore, whether the difference in the NNIs retrieved by the model affects the yield estimation remains to be investigated.

4.3. Correlation between Two Different NNIs (NNILAI and NNIDM) and the Relative Yield and Relative Yield Components

A large number of studies have been conducted on the prediction of the rice yield based on nitrogen nutrition status-related indicators. Wu et al. showed that there is a significant correlation between the rice yield and nitrogen use efficiency [32]. Sun et al. found that the nitrogen application rate is significantly correlated with the rice yield and that the rice grain yield is also significantly correlated with nitrogen absorption and utilization [33]. However, the uniformity of nitrogen application in the field will lead to differences in the crop yield [34], so nitrogen management needs to be optimized to increase the rice yield. The nitrogen nutrition index [35], as an index for analyzing and monitoring the nitrogen nutrition status during rice production [30], showed a strong correlation with the rice yield. In terms of the estimation of the relative yield (RY) with the NNI (NNILAI and NNIDM) using the two models, this study (Figure 10) showed that the NNILAI initially increased with RY and then plateaued as RY continued to increase (R2 = 0.91, 0.75, 0.87, 0.90, and 0.82), similar to the relationship between the NNIDM and RY determined in our earlier research [12] (R2 = 0.88, 0.73, 0.77, 0.78, and 0.85) but with inconsistent model accuracy. The values for the NNILAI and RY were higher than the model accuracy of the NNIDM and RY from the tillering stage to the panicle initiation stage, but the model accuracy of the NNIDM and RY was higher in the heading stage. When the nitrogen nutrition status of rice was more accurately reflected by the NNI, the yield estimation was also more accurate. In summary, the NNILAI more accurately reflected the nitrogen nutrition status in the tillering–panicle initiation stage, while the NNIDM was more accurate in the heading stage, which is in contrast to previous results. Ata-Ul-Karim et al. suggested that the rice nitrogen uptake is greatly affected by increased LAI due to leaf expansion [15], which may be due to the more ineffective tillers of indica hybrid rice compared with those of japonica rice, resulting in more greatly reduced values for the LAI in the heading stage. However, Lemaire et al. suggested that the crop nitrogen uptake is regulated by DM and is not necessarily proportional to the LAI [36].
The rice yield is one of the most important indexes for evaluating the effect of rice cultivation measures. In recent years, researchers have been working to improve the rice yield by adjusting the rice yield components based on the synergistic effect of these yield components on the crop yield [37,38]. There are some differences in the yield components between years and varieties [39]. Therefore, relative indexes were used in this study, and it was found that the relative effective panicle number, relative seed setting rate, and relative grain number per panicle is strongly correlated with the RY. This is because the effective panicle number and yield increased as the nitrogen application rate increased, and the differences were significant. The seed setting rate was found to be negatively correlated with the yield, while the grain number per panicle was positively correlated with the yield, and there was no obvious fluctuation in the 1000-grain weight [40]. In this study, the difference in yield estimation was discussed by analyzing the relationship between the two NNIs (NNILAI and NNIDM) and the relative yield components. Based on the analysis presented in Table 3 and Table 4, the NNILAI was strongly correlated with the relative effective panicle and relative seed setting rate, while the NNIDM was strongly correlated with the relative yield components, except in the case of the relative 1000-grain weight. In terms of the growth period, the correlation of the NNILAI in the tillering—panicle initiation stage was found to be higher than that of the NNIDM, and vice versa, in the heading stage, which is consistent with the results for the correlation between the NNI (NNILAI and NNIDM) and RY. The threshold points of the NNI and the yield components indicate that the threshold points of the NNILAI required to provide N nutrition for the yield components in different periods are basically the same as those related to the N nutrition demand for the yield components. The NNILAI better reflects the nitrogen nutrition status required for an effective rice panicle number in the tillering stage and more accurately reflects the nitrogen supply required for the seed setting rate of rice in the stem elongation–heading stage and can thus be used to more effectively regulate the rice yield. In the early growth stage, the NNIDM indicates the nitrogen nutrition provided for the yield components, while the threshold point of nitrogen nutrition demand for the yield differs. In the later growth stage, the seed setting rate was shown to be the same as the NNIDM threshold point of the yield. The NNIDM can more accurately reflect the nitrogen supply required to meet the rice seed setting rate demand in the panicle initiation–heading stage and, thus, can be used to estimate the rice yield at this stage.
Considering the correlation and threshold point, the selection of the NNI should be considered in different periods when the rice yield estimation is taken as the research objective. The NNILAI was selected in the tillering–panicle initiation stage, and the NNIDM was selected in the heading stage. The NNI can not only calculate the measured value through the Nc but also can be estimated by hyperspectral technology [21]. Therefore, it is necessary to identify which NNI can better predict the rice yield. In this study, only high-yielding indica hybrid rice was used as the research object, and a large number of verification tests under other climate and varieties would be needed to improve the reliability and universality of the model and theory.

5. Conclusions

The critical nitrogen concentration (NC) model based on the leaf area index (LAI) (Nc = 3.35LAI−0.33, R2 = 0.85) can accurately reflect the nitrogen nutrition status and predict the yield of indica hybrid rice grown from machine-transplanted bowl seedlings. Some differences in the nitrogen nutrition status (NNILAI and NNIDM) between the two NC models were identified. The accuracy of the yield prediction for indica hybrid rice grown from machine-transplanted bowl seedlings was influenced by the accuracy of the estimated N nutrition status ion, which varied depending on the growth stage; the N nutrition status reflected by the NNILAI was more accurate in the tillering–panicle initiation stage, while that reflected by the NNIDM was more accurate in the heading stage. The results of this study can accurately determine the nitrogen nutrition status of indica hybrid rice grown from machine-transplanted bowl seedlings based on different NNIs. Meanwhile, the established models would be useful to provide theoretical bases for precision nitrogen fertilizer management to improve yield and benefits of rice. Whether the model is applicable to other crops and cultivation methods after some adjustments remains to be studied.

Supplementary Materials

The following supporting information can be downloaded at: https://www.mdpi.com/article/10.3390/agronomy12030742/s1, Table S1: Growth duration, plant height, and potential yield of both cultivars.

Author Contributions

Conceptualization, H.X., H.H. and L.W.; methodology, H.X., H.H. and L.W.; software, H.X. and T.Z.; validation, H.X., H.R. and L.W.; formal analysis, H.X., H.H. and K.Y.; investigation, H.X., H.H. and J.K.; resources, H.X., C.Y. and L.W.; data curation, H.X., H.H. and L.W.; writing—original draft preparation, H.X.; writing—review and editing, H.X.; visualization, H.X.; supervision, H.X., H.H. and L.W.; project administration, H.H., J.K., C.Y., L.W. and S.G.; funding acquisition, H.H., J.K., C.Y., L.W. and S.G. All authors have read and agreed to the published version of the manuscript.

Funding

This research was funded by the National Natural Science Foundation of China (No. 32071946) and Wuhu science and technology planning project (No. 2020dx09) and Natural science research project of colleges and universities in Anhui Province (No. KJ2019A0176).

Institutional Review Board Statement

Not applicable.

Informed Consent Statement

Not applicable.

Data Availability Statement

The data presented in this publication are available on request from the corresponding author.

Conflicts of Interest

The authors declare no conflict of interest.

Abbreviations

NNInitrogen nutrition index
NCcritical nitrogen concentration
NNILAInitrogen nutrition index calculated based on dry matter critical nitrogen concentration model
NNIDMnitrogen nutrition index calculated based on leaf area index critical nitrogen concentration model
HLY 898Huiliangyou 898
YLY 900Yliangyou 900
RYrelative yield
LAIleaf area index
Ntthe actual rice nitrogen concentration
Nmaxthe maximum nitrogen concentration
Nminthe minimum nitrogen concentration

References

  1. National Bureau of Statististics of China. China National Statististics Year Book in 2021; National Statististics Press: Beijing, China, 2021. [Google Scholar]
  2. Spiertz, H. Challenges for Crop Production Research in Improving Land Use, Productivity and Sustainability. Sustainability 2013, 5, 1632–1644. [Google Scholar] [CrossRef] [Green Version]
  3. Chen, X.P.; Cui, Z.L.; Fan, M.S.; Vitousek, P.; Zhao, M.; Ma, W.Q.; Wang, Z.L.; Zhang, W.J.; Yan, X.Y.; Yang, J.C.; et al. Producing more grain with lower environmental costs. Nature 2014, 514, 486–489. [Google Scholar] [CrossRef]
  4. Pan, S.G.; Huang, S.Q.; Zhang, F.; Wang, J.P.; Cai, M.L.; Cao, C.G.; Tang, X.R.; Li, G.X. Growth and Development Characteristics of Super-High-Yielding Mid-Season Indica Hybrid Rice. Acta Agron. Sin. 2011, 37, 537–544. [Google Scholar] [CrossRef]
  5. Zhang, H.C.; Zhu, C.C.; Huo, Z.Y.; Xu, K.; Jiang, X.P.; Chen, H.C.; Gao, S.Q.; Li, D.J.; Zhao, C.M.; Dai, Q.; et al. Advantages of yield formation and main characteristics of physiological and ecological in rice with bowl mechanical transplanting. Trans. Chin. Soc. Agric. Eng. 2013, 29, 50–59. (In Chinese) [Google Scholar]
  6. Xu, X.; He, P.; Pampolino, M.F.; Qiu, S.; Zhao, S.; Zhou, W. Spatial variation of yield response and fertilizer requirements on regional scale for irrigated rice in China. Sci. Rep. 2019, 9, 3589. [Google Scholar] [CrossRef] [Green Version]
  7. Bentje, B.; Bjerg, P.L.; Song, X.F.; Jakobsen, R. Field scale interaction and nutrient exchange between surface water and shallow groundwater in the Baiyang Lake region, North China Plain. J. Environ. Sci. 2016, 45, 60–75. [Google Scholar]
  8. Guo, B.B.; Zhao, X.H.; Meng, Y.; Liu, M.R.; Duan, J.Z.; He, L.; Jiao, N.Y.; Feng, W.; Zhu, Y.J. Establishment of Critical Nitrogen Concentration Models in Winter Wheat under Different Irrigation Levels. Agronomy 2020, 10, 556. [Google Scholar] [CrossRef]
  9. Ata-Ul-Karim, S.T.; Zhu, Y.; Liu, X.; Cao, Q.; Tian, Y.; Cao, W. Comparison of different critical nitrogen dilution curves for nitrogen diagnosis in rice. Sci. Rep. 2017, 7, 42679. [Google Scholar] [CrossRef] [Green Version]
  10. Confalonieri, R.; Debellini, C.; Pirondini, M.; Possenti, P.; Bergamini, L.; Barlassina, G.; Bartoli, A.; Agostoni, E.G.; Appiani, M.; Babazadeh, L.; et al. A new approach for determining rice critical nitrogen concentration. J. Agric. Sci. 2011, 149, 5. [Google Scholar] [CrossRef]
  11. Zhao, B.; Ata-Ui-Karim, S.T.; Yao, X.; Tian, Y.C.; Cao, W.X.; Zhu, Y.; Liu, X.J. A New Curve of Critical Nitrogen Concentration Based on Spike Dry Matter for Winter Wheat in Eastern China. PLoS ONE 2016, 11, e0164545. [Google Scholar] [CrossRef]
  12. Yao, B.; He, H.B.; Xu, H.C.; Zhu, T.Z.; Liu, T.; Ke, J.; You, C.C.; Zhu, D.Q.; Wu, L.Q. Determining nitrogen status and quantifying nitrogen fertilizer requirement using a critical nitrogen dilution curve for hybrid Indica rice under mechanical pot-seedling transplanting pattern. J. Integr. Agric. 2021, 20, 1474–1486. [Google Scholar] [CrossRef]
  13. Ata-Ul-Karim, S.T.; Yao, X.; Liu, X.J.; Cao, W.X.; Zhu, Y. Development of critical nitrogen dilution curve of Japonica rice in Yangtze River Reaches. Field Crops Res. 2013, 149, 149–158. [Google Scholar] [CrossRef]
  14. Qiang, S.; Zhang, F.; Dyck, M.; Zhang, Y.; Xiang, Y.; Fan, J. Determination of critical nitrogen dilution curve based on leaf area index for winter wheat in the Guanzhong Plain, Northwest China. J. Integr. Agric. 2019, 18, 10. [Google Scholar] [CrossRef]
  15. Ata-Ul-Karim, S.T.; Zhu, Y.; Yao, X.; Cao, W.X. Determination of critical nitrogen dilution curve based on leaf area index in rice. Field Crops Res. 2014, 167, 76–85. [Google Scholar] [CrossRef]
  16. Zhao, B.; Ata-Ul-Karim, S.T.; Liu, Z.D.; Ning, D.F.; Xiao, J.F.; Liu, Z.G.; Qin, A.Z.; Nan, J.Q.; Duan, A.W. Development of a critical nitrogen dilution curve based on leaf dry matter for summer maize. Field Crops Res. 2017, 208, 60–68. [Google Scholar] [CrossRef]
  17. Sedlář, O.; Balík, J.; Černý, J.; Kulhánek, M.; Vašák, F. Relation between nitrogen nutrition index and production of spring malting barley. Int. J. Plant Prod. 2017, 11, 379–388. [Google Scholar]
  18. Du, L.; Li, Q.; Li, L.; Wu, Y.; Zhou, F.; Liu, B.; Li, X.; Liu, Q.; Kong, F.; Yuan, J. Construction of a critical nitrogen dilution curve for maize in Southwest China. Sci. Rep. 2020, 10, 13084. [Google Scholar] [CrossRef]
  19. Xu, H.C.; Yao, B.; Wang, Q.; Chen, T.T.; Zhu, T.Z.; He, H.B.; Ke, J.; You, C.C.; Wu, X.W.; Guo, S.S.; et al. Determination of suitable band width for estimating rice nitrogen nutrition index based on leaf reflectance spectra. Sci. Agric. Sin. 2021, 54, 4525–4539. (In Chinese) [Google Scholar]
  20. Kim, N.; Behnke, G.D.; Villamil, M.B. Characterization of Mollisols after Long-Term N Fertilization at Successive Rates in Continuous and Rotated Corn Systems. Agronomy 2022, 12, 625. [Google Scholar] [CrossRef]
  21. Tseng, W.Y.; Lai, H.Y. Comprehensive Analysis Revealed the Specific Soil Properties and Foliar Elements Respond to the Quality Composition Levels of Tea (Camellia sinensis L.). Agronomy 2022, 12, 670. [Google Scholar] [CrossRef]
  22. Wojewódzki, P.; Lemanowicz, J.; Debska, B.; Haddad, S.A. Soil Enzyme Activity Response under the Amendment of Different Types of Biochar. Agronomy 2022, 12, 569. [Google Scholar] [CrossRef]
  23. Lu, Q.; Miles, C.; Tao, H.; DeVetter, L.W. Reduced Nitrogen Fertilizer Rates Maintained Raspberry Growth in an Established Field. Agronomy 2022, 12, 672. [Google Scholar] [CrossRef]
  24. Zhao, B.; Yao, X.; Tian, Y.C.; Liu, X.J.; Cao, W.X.; Zhu, Y. Estimation of nitrogen nutrient index on SPAD value of top leaves in wheat. Acta Ecol. Sin. 2013, 33, 916–924. (In Chinese) [Google Scholar] [CrossRef] [Green Version]
  25. Wickham, H. Ggplot2; Springer: New York, NY, USA, 2009. [Google Scholar]
  26. Zhao, B.; Yao, X.; Tian, Y.C.; Liu, X.J.; Cao, W.X.; Zhu, Y. Accumulative nitrogen deficit models of wheat aboveground part based on critical nitrogen concentration. Chin. J. Appl. Ecol. 2012, 23, 3141–3148. (In Chinese) [Google Scholar]
  27. Guo, X.; Li, G.; Ding, X.; Zhang, J.; Ren, B.; Liu, P.; Zhang, S.; Zhao, B. Response of Leaf Senescence, Photosynthetic Characteristics, and Yield of Summer Maize to Controlled-Release Urea-Based Application Depth. Agronomy 2022, 12, 687. [Google Scholar] [CrossRef]
  28. Pang, C.; Zhang, W.; Peng, M.; Zhao, X.; Shi, R.; Wu, X.; Chen, F.; Sun, C.; Wang, X.; Zhang, J. Fine Mapping and Characterization of a Major Gene Responsible for Chlorophyll Biosynthesis in Brassica napus L. Biomolecules 2022, 12, 402. [Google Scholar] [CrossRef]
  29. Ma, L.; Wang, S.; Chen, J.; Chen, B.; Zhang, L.; Ma, L.; Amir, M.; Sun, L.; Zhou, G.; Meng, Z. Relationship between Light Use Efficiency and Photochemical Reflectance Index Corrected Using a BRDF Model at a Subtropical Mixed Forest. Remote Sens. 2020, 12, 550. [Google Scholar] [CrossRef] [Green Version]
  30. Song, L.; Wang, S.; Ye, W. Establishment and Application of Critical Nitrogen Dilution Curve for Rice Based on Leaf Dry Matter. Agronomy 2020, 10, 367. [Google Scholar] [CrossRef] [Green Version]
  31. Zhou, W.; Wang, T.; Fu, Y.; Yang, Z.P.; Liu, Q.; Yan, F.J.; Chen, Y.; Tao, Y.F.; Ren, W.J. Differences in Rice Productivity and Growth Attributes Under Different Paddy-Upland Cropping Systems. Int. J. Plant Prod. 2022, 1–14. [Google Scholar] [CrossRef]
  32. Wu, L.L.; Yuan, S.; Huang, L.Y.; Sun, F.; Zhu, G.L.; Li, G.H.; Fahad, S.; Peng, S.B.; Wang, F. Physiological Mechanisms Underlying the High-Grain Yield and High-Nitrogen Use Efficiency of Elite Rice Varieties under a Low Rate of Nitrogen Application in China. Front. Plant Sci. 2016, 7, 1024. [Google Scholar] [CrossRef] [Green Version]
  33. Sun, Y.J.; Ma, J.; Sun, Y.Y.; Xu, H.; Yang, Z.Y.; Liu, S.J.; Jia, X.W.; Zheng, H.Z. The effects of different water and nitrogen managements on yield and nitrogen use efficiency in hybrid rice of China. Field Crops Res. 2012, 127, 85–98. [Google Scholar] [CrossRef]
  34. Zhen, L.; Zoebisch, M.A.; Chen, G.; Feng, Z. Sustainability of farmers’ soil fertility management practices: A case study in the North China Plain. J. Environ. Manag. 2006, 79, 409–419. [Google Scholar] [CrossRef] [PubMed]
  35. Ma, P.; Lan, Y.; Lyu, T.; Zhang, Y.; Lin, D.; Li, F.; Li, Y.; Yang, Z.; Sun, Y.; Ma, J. Improving Rice Yields and Nitrogen Use Efficiency by Optimizing Nitrogen Management and Applications to Rapeseed in Rapeseed-Rice Rotation System. Agronomy 2020, 10, 1060. [Google Scholar] [CrossRef]
  36. Lemaire, G.; Jeuffroy, M.H.; Gastal, F. Diagnosis tool for plant and crop N status in vegetative stage: Theory and practices for crop N management. Eur. J. Agron. 2008, 28, 614–624. [Google Scholar] [CrossRef]
  37. Concenço, G.; Barbat, P.J.M.; Santos, M.I.; Valle, B.M.; Trombetta, D.S.J.; Emerim, C.S. Rice Yield Components under Water Stress Imposed at Different Growth Stages. J. Agric. Sci. 2018, 10, 3. [Google Scholar] [CrossRef] [Green Version]
  38. Nemoto, M.; Hamasaki, H.; Matsuba, S.; Hayashi, S.; Yanagihara, S. Estimation of Rice Yield Components with Meteorological Elements Divided According to Developmental Stages. J. Agric. Meteorol. 2016, 72, 3–4. [Google Scholar] [CrossRef] [Green Version]
  39. Benoit, C.; Crisanta, B.; Abigail, J.D.; Heathel, L.L.; Leigh, V. Leaf emergence, tillering, plant growth, and yield in response to plant density in a high-yielding aerobic rice crop. Field Crops Res. 2016, 199, 52–64. [Google Scholar]
  40. Awan, T.H.; Sta.Cruz, P.C.; Farooq, M.; Chauhan, S.B. Influence of Seeding Rate, Nitrogen Rate and Weed Regimes on Productivity and Nitrogen Efficiency of Dry Direct-Seeded Rice. Int. J. Plant Prod. 2021, 1–18. [Google Scholar] [CrossRef]
Figure 1. Study area. The aerial images were taken from Google maps on 25 June 2019. The Field photos were taken on 8 July 2019 by the RGB camera carried by DJI UAV.
Agronomy 12 00742 g001
Figure 2. Air temperature (°C) and precipitation (mm) in 2018 and 2019.
Agronomy 12 00742 g002
Figure 3. Dynamic changes in the LAI according to days after transplanting (d) shown for the varieties Huiliangyou 898 (HLY 898) and Yliangyou 900 (YLY 900) according to the season (2018 or 2019). * indicates significance at the 0.05 level. ** indicates significance at the 0.01 level.
Agronomy 12 00742 g003
Figure 4. Dynamic changes in the N concentration (%) according to days after transplanting (d) shown for the varieties Huiliangyou 898 (HLY 898) and Yliangyou 900 (YLY 900) according to the season (2018 or 2019). ** indicates significance at the 0.01 level.
Agronomy 12 00742 g004
Figure 5. Relationship between the LAI and Nc of indica hybrid rice grown from machine-transplanted bowl seedlings.
Agronomy 12 00742 g005
Figure 6. Validation of the established critical nitrogen dilution curves with independent data. ** indicates significance at the 0.01 level.
Agronomy 12 00742 g006
Figure 7. Dynamic changes in NNILAI according to days after transplanting (d) shown for the varieties Huiliangyou 898 (HLY 898) and Yliangyou 900 (YLY 900) according to the season (2018 or 2019).
Agronomy 12 00742 g007
Figure 8. Dynamic changes in NNIDM according to days after transplanting (d) shown for the varieties Huiliangyou 898 (HLY 898) and Yliangyou 900 (YLY 900) according to the season (2018 or 2019).
Agronomy 12 00742 g008
Figure 9. Relationship between the nitrogen nutrition index (NNILAI) and relative yield (RY) in the different growth stages, shown for the varieties Huiliangyou 898 (HLY 898) and Yliangyou 900 (YLY 900) according to the season (2018 or 2019). DAT, days after transplantation. ** indicates significance at the 0.01 level.
Agronomy 12 00742 g009
Figure 10. Correlation between the relative yield and relative yield components of indica hybrid rice. ** indicates significance at the 0.01 level; * indicates significance at the 0.05 level.
Agronomy 12 00742 g010
Table 1. Chemical properties of the soil at the study sites.
YearOrganic Matter
(g·kg−1)
Total N
(g·kg−1)
Available P
(mg·kg−1)
Available K
(mg·kg−1)
pH
201832.362.0324.80211.425.11
201930.891.7725.97245.525.54
Table 2. Analysis of variance for the NNILAI with respect to the variety, nitrogen rates, and years.
Grouping FactorVariation SourceSum of SquaresdfMean SquareF-Valuep-Value
Nitrogen rateBetween groups1.98340.49621.1970
Within groups2.222950.023
Total4.20699
VarietyBetween groups0.00110.0010.0260.872
Within groups4.204980.043
Total4.20699
YearBetween groups0.26310.2636.5360.120
Within groups3.943980.040
Total4.20699
Table 3. Correlation between the NNILAI and the relative yield components of the indica hybrid rice grown from machine-transplanted bowl seedlings according to growth stage. ** indicates significance at 0.01 level.
Growth StageYield ComponentsEquationN Nutrition Index
(NNILAI) Threshold
Error Value
(Compared to the RY Threshold)
R2
15 DAT
(active tillering)
Relative effective panicley = 1.290x − 0.2720.9710.0000.880 **
Relative grains per panicley = 0.450x + 0.5520.9750.0040.683 **
Relative seed setting ratey = −0.238x + 1.1820.9930.0220.811 **
Relative 1000 grain weighty = 0.216x + 0.7880.940−0.0310.526 **
30DAT
(mid-tillering)
Relative effective panicley = 1.106x − 0.2391.1060.0000.875 **
Relative grains per panicley = 0.405x + 0.5451.101−0.0050.655 **
Relative seed setting ratey = −0.220x + 1.1901.1200.0140.808 **
Relative 1000 grain weighty = 0.154x + 0.8231.092−0.0140.320 **
45DAT
(stem elongation)
Relative effective panicley = 0.691x + 0.2061.1310.0150.793 **
Relative grains per panicley = 0.268x + 0.6941.108−0.0080.764 **
Relative seed setting ratey = −0.136x + 1.1001.1170.0010.827 **
Relative 1000 grain weighty = 0.119x + 0.8641.066−0.0500.506 **
60DAT
(panicle initiation)
Relative effective panicley = 0.523x + 0.4321.0670.0140.766 **
Relative grains per panicley = 0.181x + 0.7981.0620.0090.673 **
Relative seed setting ratey = −0.103x + 1.0551.0530.0000.900 **
Relative 1000 grain weighty = 0.087x + 0.9061.0660.0130.516 **
75DAT
(heading)
Relative effective panicley = 0.509x + 0.4950.9600.0080.776 **
Relative grains per panicley = 0.194x + 0.8080.943−0.0090.722 **
Relative seed setting ratey = −0.098x + 1.0420.9520.0000.779 **
Relative 1000 grain weighty = 0.084x + 0.9170.890−0.0620.452 **
Table 4. Correlation between the NNIDM and the relative yield components of the indica hybrid rice grown from machine-transplanted bowl seedlings according to growth stage. ** indicates significance at 0.01 level.
Growth StageYield ComponentsEquationN Nutrition Index
(NNILAI) Threshold
Error Value
(Compared to the RY Threshold)
R2
15 DAT(active tillering)Relative effective panicley = 1.060x − 0.0490.981−0.0490.785 **
Relative grains per panicley = 0.407x + 0.6000.977−0.0530.736 **
Relative seed setting ratey = −0.200x + 1.1430.997−0.0330.744 **
Relative 1000 grain weighty = 0.204x + 0.8030.925−0.1050.620 **
30DAT(mid-tillering)Relative effective panicley = 1.213x − 0.1640.9540.0140.736 **
Relative grains per panicley = 0.435x + 0.5800.9450.0050.736 **
Relative seed setting ratey = −0.241x + 1.1750.9430.0030.686 **
Relative 1000 grain weighty = 0.205x + 0.8040.913−0.0270.542 **
45DAT(stem elongation)Relative effective panicley = 0.596x + 0.2841.1500.0600.672 **
Relative grains per panicley = 0.236x + 0.7201.1290.0390.742 **
Relative seed setting ratey = −0.111x + 1.0791.1370.0470.666 **
Relative 1000 grain weighty = 0.111x + 0.8701.0960.0060.570 **
60DAT(panicle initiation)Relative effective panicley = 0.493x + 0.4061.0700.0000.804 **
Relative grains per panicley = 0.205x + 0.7601.060−0.0100.713 **
Relative seed setting ratey = −0.095x + 1.0591.064−0.0060.731 **
Relative 1000 grain weighty = 0.098x + 0.8871.1000.0300.390 **
75DAT(heading)Relative effective panicley = 0.574x + 0.3721.035−0.0150.862 **
Relative grains per panicley = 0.214x + 0.7651.0560.0060.706 **
Relative seed setting ratey = −0.106x + 1.0621.0500.0000.910 **
Relative 1000 grain weighty = 0.086x + 0.9031.024−0.0260.525 **
Publisher’s Note: MDPI stays neutral with regard to jurisdictional claims in published maps and institutional affiliations.

