Article

The Potential of Pig Sludge Fertilizer for Some Pasture Agricultural Lands’ Improvement: Case Study in Timiș County, Romania

1
Environmental Engineering, Banat University of Agricultural Sciences and Veterinary Medicine “King Michael I of Romania”, 300645 Timisoara, Romania
2
Remote Sensing and GIS, Banat University of Agricultural Sciences and Veterinary Medicine “King Michael I of Romania”, 300645 Timisoara, Romania
3
Soil Science and Plant Nutrition, Banat University of Agricultural Sciences and Veterinary Medicine “King Michael I of Romania”, 300645 Timisoara, Romania
*
Author to whom correspondence should be addressed.
Agronomy 2022, 12(3), 701; https://doi.org/10.3390/agronomy12030701
Submission received: 23 February 2022 / Revised: 10 March 2022 / Accepted: 10 March 2022 / Published: 14 March 2022

Abstract

:
In the context of the current energy crisis, pig sludge may be a more accessible fertilizer resource for different categories of farmers and agro-ecosystems, in order to support soil fertility and agricultural production. The present study presents results regarding the influence of pig sludge on soil quality and the spatial and temporal variability of a pasture agro-ecosystem, in the area of Ciacova locality, Timiș County, Romania. The pig sludge was fermented for a period of 6 months in fermentation tanks and was applied at a rate of 80 m3 ha−1 y−1 between 2013 and 2019, on two pasture plots (P808, P816). In the study period (2013–2019), the agrochemical indices studied presented the values: pH = 5.90 ± 0.09 (P816-6-13) and pH = 6.90 ± 0.06 (P808-7-18); P = 10.20 ± 2.26 ppm (P808-4-13) and P = 69.10 ± 3.04 ppm (P808-5-19); K = 176.00 ± 7.44 ppm (P816-4-13) and K = 429.00 ± 7.33 ppm (P816-3-19); NI = 2.45% ± 0.08% (P816-6-13) and NI = 3.87% ± 0.06% (P816-6-19). The variability of the land, i.e., the pasture category, evaluated based on the NDVI index (seven NDVI classes were generated, C1 to C7) decreased under the influence of pig sludge, the values of the variation coefficients being CVNDVI = 17.5098 in 2019 compared to CVNDVI = 41.5402 in 2013 for P808 and CVNDVI = 32.0685 in 2019, compared to CVNDVI = 52.2031 in 2013 for P816. It was found that the land area decreased (2019 compared to 2013) from classes C1 to C4 NDVI (low NDVI values, NDVI < 0.5) and the area increased within classes C6 and C7 NDVI (high NDVI values, NDVI > 0.5).

1. Introduction

According to various studies, strategies, and syntheses, regarding population dynamics and the need for food resources [1,2,3], it is estimated, according to some representative scenarios, that there will be an increase in the global demand for food of between 35% and 56% between 2010 and 2050 [4]. The intervals presented may undergo some changes due to climate change [4] to which may be added the energy crisis and also other disruptive elements with manifestation on a regional or global scale.
Agriculture is the basic production system for providing food, with a variable productivity and contribution, in relation to the sustainability of food production [5]. Some of the scenarios considered to ensure food production, food security, and safety, are the intensification of agriculture [6,7], circular food production systems [3,8,9,10], or alternative food production systems [11,12]. In the circular economy of food production, grasslands play an important role [3]. Grasslands have been studied in relation to various elements of importance for this category of agricultural land, such as biodiversity [13,14], composition, productivity, and feed quality [15], which largely depend on soil quality [16,17]. Soils provide about 98.8% of human food [7] and are complex ecosystems with high and dynamic spatial and temporal variability. Agricultural production processes are highly sensitive to changes in energy prices, and synthetic chemical fertilizers, as closely related energy inputs, strongly influence agricultural technologies and farm profitability [18].
In the context of the current energy crisis and fertilizer prices, the attractiveness of more accessible fertilizer resources in agricultural production processes, such as by-products or waste from various industrial sectors, animal husbandry, or urban ecosystems, is of interest. Pig manure (sewage sludge, pig sludge, manure) is a residual product from pig breeding systems and has drawn the attention of researchers for a long time, both from a technological and management perspective [19,20], as well as as a fertilizer resource [21,22], and from some environmental aspects [23,24]. Pig farming in industrialized systems has been studied from the perspective of environmental issues, by assessing the impact of pig waste associated with soil, water, and crops [25]. The use of pig sludge has been considered potentially environmentally hazardous if the sludge is not properly treated [26,27], but this can also be considered a positive part of this resource (porcine sludge) under the conditions of an adequate treatment and management technology (physical, chemical, and biological aspects). The use of pig manure after digestion [28] is considered a much more environmentally friendly option. Anaerobic digestion technologies with the addition of various mineral additives are recent considerations to improve the quality of pig manure in order to reduce its impact on the environment [29].
According to various studies, the proper management of pig manure, by fermentation, treatment, pretreatment, and/or filtration, to reduce the content of nitrates, heavy metals, drugs, microorganisms, etc., is an element of the integrated management of these manures to turn them into resources usable in agriculture and to minimize their potential impact on the environment [19,20,21,22,23,24,25,26,27,28]. Among the treatment methods, anaerobic digestion reduces the organic load of the biomass in the absence of oxygen, generating biogas and organic fertilizer. Favorable effects of pig slurry and manure have been reported in different crops of interest and in different soil and climatic conditions [30,31], and some studies have evaluated the effect of pig slurry on the agrochemical properties of the soil, the regime of organic matter in the soil, or of some mineral elements in the soil [32,33]. There have also been some studies that have evaluated the benefits and risks of using sewage sludge in agriculture [34].
The present study evaluated the influence of pig sludge as a potential fertilizer resource for the improvement of agricultural land of the pasture category. In order to achieve the purpose of the study, the influence of pig sludge application, between 2013 and 2019 on soil quality indices (pH, P, K, NI) and on NDVI vegetation index (RapidEye satelite system) was evaluated. Spatial and temporal variability in agricultural land of the pasture category was quantified based on soil quality indices and NDVI in association with the pig sludge application.

2. Materials and Methods

2.1. General Characterization of the Area

The agricultural land of the pasture category, under study is located in the area of Ciacova locality, Timiș County, Romania, Figure 1. The researched area falls within the Western Plain of Romania, being the eastern compartment of the Great Pannonia Depression. The area of the studied agricultural land is located in the Timiş Plain, which is mostly a recent plain, drained by rivers with a permanent water regime, “Timiş”, “Bega”, and all their tributaries and branches. Taken as a whole, the relief appears as a relatively flat area, but taken in detail, it presents accentuated variability of the relief microforms, with change from positive to negative forms over a short distance, sometimes only a few meters. The perimeter of the researched agricultural land is part of the river basin of the “Timiş” River, the sub-basin “Timişul Mort” (unchanged, it flows at high floods), and “Lunca Birda” (former erosion valley “Vena Mare”, collector channel). The groundwater level is at the depth at which the pedogenetic processes are influenced. By sewerage and draining, the excess groundwater was drained in time. The soil gleic phenomenon still persists, and in some areas, it is very pronounced. In micro-depressions the groundwater is at depths of 1.00–1.50 m, and in the flat areas at 1.50–3.00 m, respectively, on the ground forms at 3.00–5.00 m. Groundwater, through its variations, has led to a great diversification of soils from this point of view.

2.2. General Climatic Conditions for the Area Characterization

The data recorded at the Timisoara Meteorological Resort were used to characterize the climatic conditions. The average annual temperature was 10.7 °C, and the multiannual average rainfall was 631.00 mm. For the vegetation season, the climatic conditions showed temperature values of 17.25 °C, precipitation of 347.9 L m−2 (year 2013); temperature of 18.10 °C, precipitation of 328.3 L m−2 (year 2018), respectively; and temperature of 18.16 °C, precipitation of 278.2 L m−2 (year 2019).

2.3. General Soil Conditions for the Area Characterization

Soil classification was carried out in accordance with the current soil classification systems [35,36]. In order to characterize the soil in the studied area, two soil profiles were made, and based on the samples and data, the main soil types were characterized, in terms of physical and chemical properties.

2.4. Description of the Pig Sludge Used

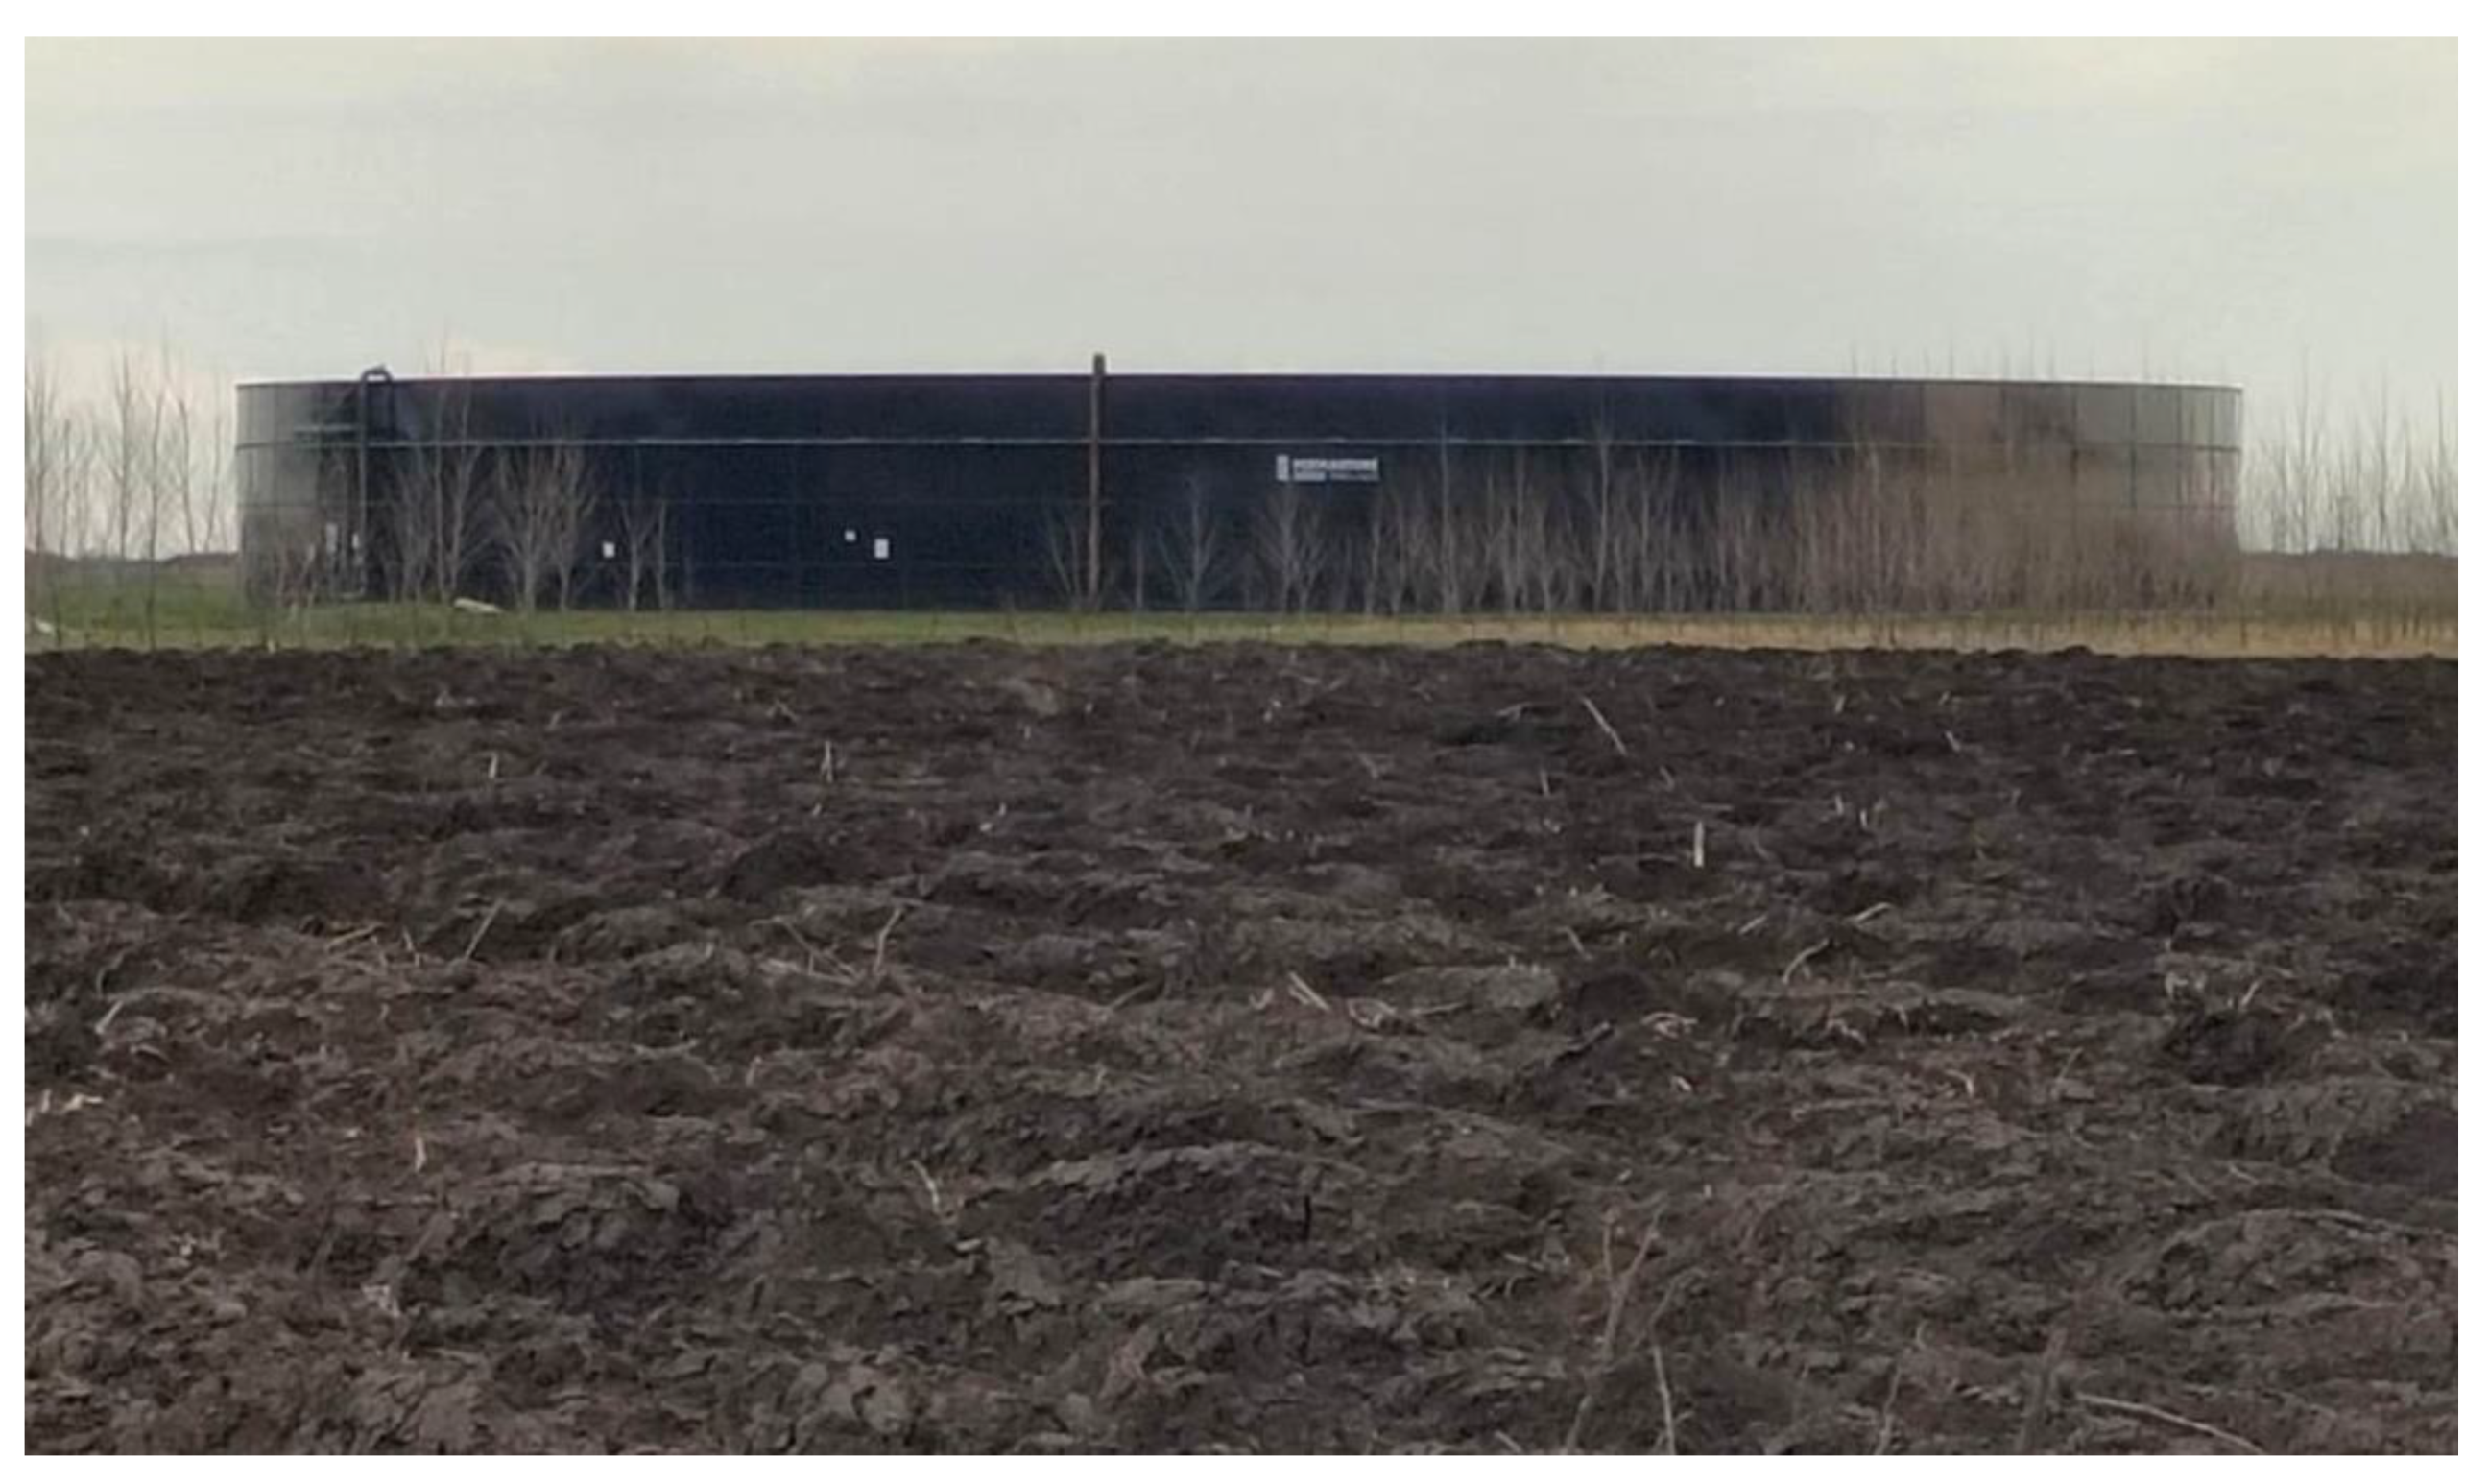
For the ameliorating fertilization of the agricultural land under study (pasture category), pig sludge from S.C. Smithfield Romania SRL production units, Timiș County, was used. The pig sludge underwent a fermentation process for a period of 6 months, in fermentation tanks (Figure 2), and was characterized, in terms of fertilizer, based on pH, organic matter (%), moisture (%), Nt content (%), soluble phosphorus (P2O5, %), and soluble potassium (K2O, %), and the average values are presented in Table 1. Pig sludge was applied annually, in the first ten days of April, in an amount of 80 m3 ha−1 y−1, according to the fertilization plan recommended by OSPA Laboratory in practical conditions for reference region. The singular use of pig sludge was considered for the purpose of quantifying its sole influence on the agricultural land of the pasture category. Mineral fertilizers are usually applied by farmers in the area for agricultural crops.

2.5. Soil Agrochemical Indices

For the characterization of the two pasture plots studied (P808, P816), agrochemical indices represented by soil pH, phosphorus content (P, ppm), potassium content (K, ppm), and nitrogen index (NI, %) were taken into account. Soil samples were taken in each year of study (2013, 2018, and 2019), in the spring (March) before the application of pig sludge as fertilizer. The soil samples were taken at a depth of 0–20 cm. Each soil sample consisted of 20 partial sub-samples, randomly collected from an average area of 9.88 ha in the case of P808 and 8.84 ha in the case of P816. The soil samples were analyzed in the OSPA Timisoara Laboratory, RENAR accredited, by specific laboratory methods, in relation to each index taken into account; soil pH: potentiometric, H2O, pH meter Mettler Toledo; total nitrogen: Kjeldahl method, Kjeldahl mineralization/distillation unit; extractable phosphorus: ammonium acetate-lactate, UV–VIS spectrophotometer CINTRA 101; extractable potassium: ammonium acetate-lactate, atomic absorption spectrophotometer VARIAN. The granulometric composition of the soil was determined by sieving for coarse fractions (>0.02 mm) and by pipetting for fine fractions (≤0.02 mm).

2.6. Satellite Images

To characterize the study area, the location and evolutionary situation and the spatial and temporal variability under the influence of pig sludge fertilization, satellite images were taken in July of each year of study and the NDVI vegetation index was determined [37]. The RapidEye remote sensing system was used to capture satellite images. The RapidEye system consists of five spectral bands: blue, green, red, red edge, and NIR, with a spatial resolution of 5 m. The remote sensing scenes were taken from the portal www.planet.com [38], on the following dates: 21 July 2013, 16 July 2018, and 07 July 2019.

2.7. Statistical Data Processing

For the processing and analysis of the spatial and temporal variation of the data (values of agrochemical indices, NDVI index) in relation to the pig sludge fertilization of the two parcels of agricultural land of the pasture category, the software PAST [39] and ArcGIS [40] were used.

3. Results

3.1. Soil Characterization Based on Soil Profiles

The characterization of the soil within the pasture plots studied was made on the basis of two soil profiles (soil profile—SP), depth 0–100 cm, one profile on each plot (SP1 for P808, SP2 for P816). The soil profiles were made at the beginning of the study, in 2013. According to the SP1 profile, for plot P808, a soil of type sodicized Eutricambosol was identified, weakly gleyed, weakly sodicized, with weak sodicization between 50 and 100 cm, endocalcaric, developed on medium carbonate fluvial materials, medium clay, with the general formula (EC ac G2-A23-k3 Tf m LL/LL). The horizons were identified on the soil profile, according to the in situ characteristics (color, texture, settlement, structure), and subsequently confirmed by laboratory analyses: Aț-Ao-AB-Bv-BCkg-CBkacGo3, with the description in Table 2.
In terms of physical and hydrophysical properties, the soil showed medium texture on the profile, total porosity (TP) medium between 0 and 35 cm and low between 35 and82 cm, apparent density (AD) medium between 0 and 82 cm, moderate degree of compaction between 0 and 82 cm, medium field capacity between 0 and 82 cm, and medium withering coefficient between 0 and 82 cm. In terms of chemical properties, the soil reaction was slightly acidic between 0 and 35 cm, slightly alkaline between 35 and 82 cm, and moderately alkaline between 82 and 100 cm; humus reserve in the first 50 cm was very high, and the nitrogen index had an average value between 0 and 50 cm (Table 3).
In the case of the agricultural plot P816, pasture category, based on the soil profile (SP2), it was identified as a soil of type Eutricambosol gleic, moderately gleyed, developed on medium fine non-carbonated fluvial materials, medium clayey clay, with the general formula (EC gc G3 Tf t TT/TT). The horizons were identified on the soil profile, according to the in situ characteristics (color, texture, settlement, structure), and subsequently confirmed by laboratory analyses: Aț-Ao-AB-Bvg-BCg2-CBGo3, with the description in Table 4.
In terms of physical and hydrophysical properties, the soil showed medium texture on the profile, total porosity (TP) low between 0 and70 cm, apparent density (AD) medium between 0 and 7 cm and high between 7 and 70 cm, moderate settlement compacted between 0 and 70 cm, medium field capacity between 0 and 70 cm, medium withering coefficient between 0 and 55 cm and high with a range between 55 and 70 cm. In terms of chemical properties of the soil profile, the soil reaction was acidic between 0 and 40 cm, neutral between 40 and 55 cm, and slightly alkaline between 55 and 100 cm; the humus reserve in the first 50 cm was moderate, and the nitrogen index (NI) was medium between 0 and 7 cm and small between 7 and 55 cm. A complete description of the physical and chemical properties of the SP2, P816 soil profile is presented in Table 5.
Against the background of these general properties of the soil in the two pasture plots (P808 and P816), the pig sludge was applied annually in doses of 80 m3 ha−1 y−1, in the spring in the first ten days of April. During the study period, the spatial and temporal variability of the land was evaluated under the influence of pig sludge, based on soil samples and agrochemical indices considered representative.

3.2. Soil Characterization Based on Agrochemical Indices under the Influence of Pig Sludge

The variation of the agrochemical indices during the study period, under the influence of the pig sludge applied annually, in doses of 80 m3 ha−1 y−1, is represented in Table 6.
In 2013, the pH values were between 6.44 and 6.71 ± 0.05 (P808) and 5.90 and 6.63 ± 0.09 (P816). In 2018, the pH values ranged from 6.48 to 6.90 ± 0.06 (P808) and 6.49 to 6.84 ± 0.05 (P816), and in 2019, the pH values ranged from 6.30 to 6.55 ± 0.03 (P808) and 6.38 to 6.60 ± 0.02 (P816).
The phosphorus values in 2013 ranged from 10.20 to 25.60 ± 2.26 ppm (P808) and 28.60 to 37.90 ± 1.41 ppm (P816). In 2018, the phosphorus values ranged from 28.10 to 36.60 ± 1.22 ppm (P808) and 42.60 to 69.10 ± 3.21 ppm (P816), respectively. In 2019, the values of phosphorus content were in the range 45.60−69.10 ± 3.04 ppm (P808) and r 45.50−60.40 ± 2.06 ppm (P816). The increase of the phosphorus content (P, ppm), differentiated during the study period, in the two plots of land of the pasture category, can be associated with the variation of the pH and the increase of the bioavailability of P from the total soil reserve, and partially with the amount of phosphorus from the applied pig sludge.
Potassium content was identified in 2013 in the range 230.00−310.00 ± 12.62 ppm (P808) and 176.00−235.00 ± 7.44 ppm (P816). In 2018, the values of potassium content ranged from 273.00 to 315.50 ± 5.31 ppm (P808) and 276.00 to 320.00 ± 6.38 ppm (P816), and in 2019, the values of potassium content ranged from 299.00 to 350.00 ± 7.07 ppm (P808) and 372.00 to 429.00 ± 7.33 ppm (P816).
Nitrogen index (NI) had values in 2013 in the range 2.89−3.27 ± 0.05% (P808) and 2.45−3.16 ± 0.08% (P816). In 2018, NI values varied in the range of 3.40−3.90 ± 0.07% (P808) and 3.07−3.30 ± 0.03% (P816), and in 2019, NI values varied in the range of 2.96−3.18 ± 0.02% (P808) and in the range 3.48−3.87 ± 0.06% (P816). The complete data set for the studied agrochemical indices during the study period and the two pasture plots (P808, P816) are presented in Table 6.
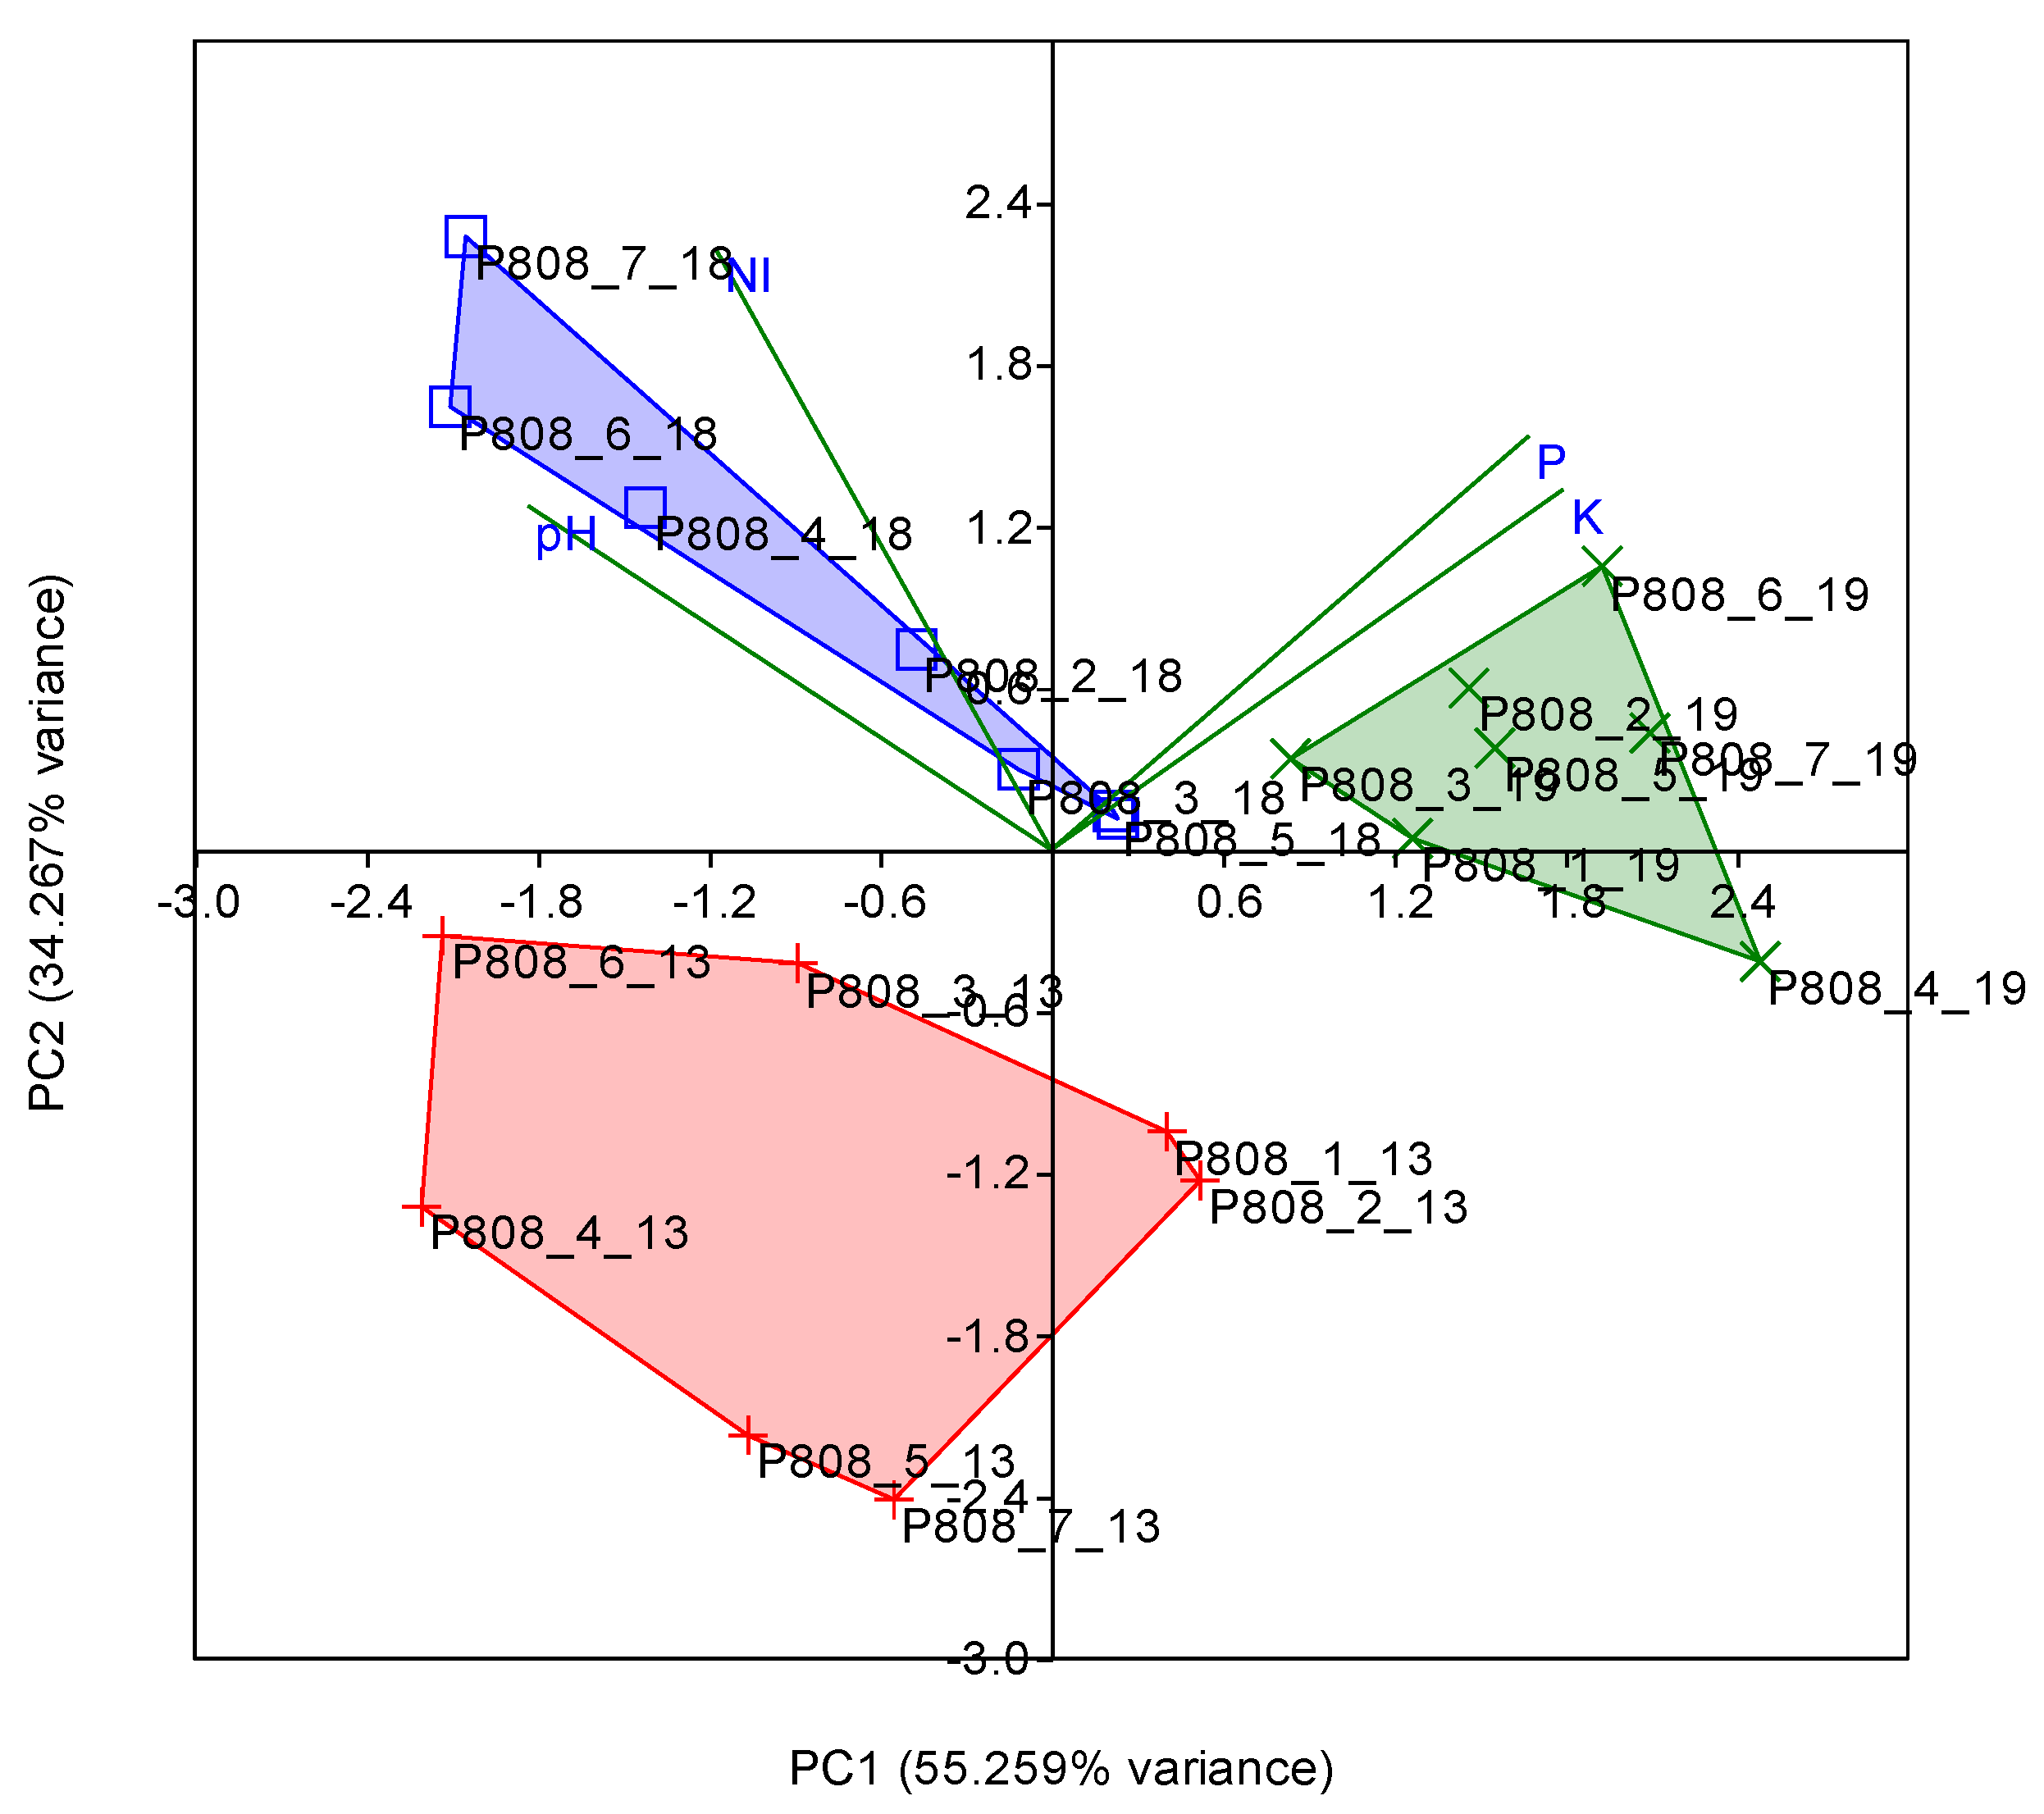
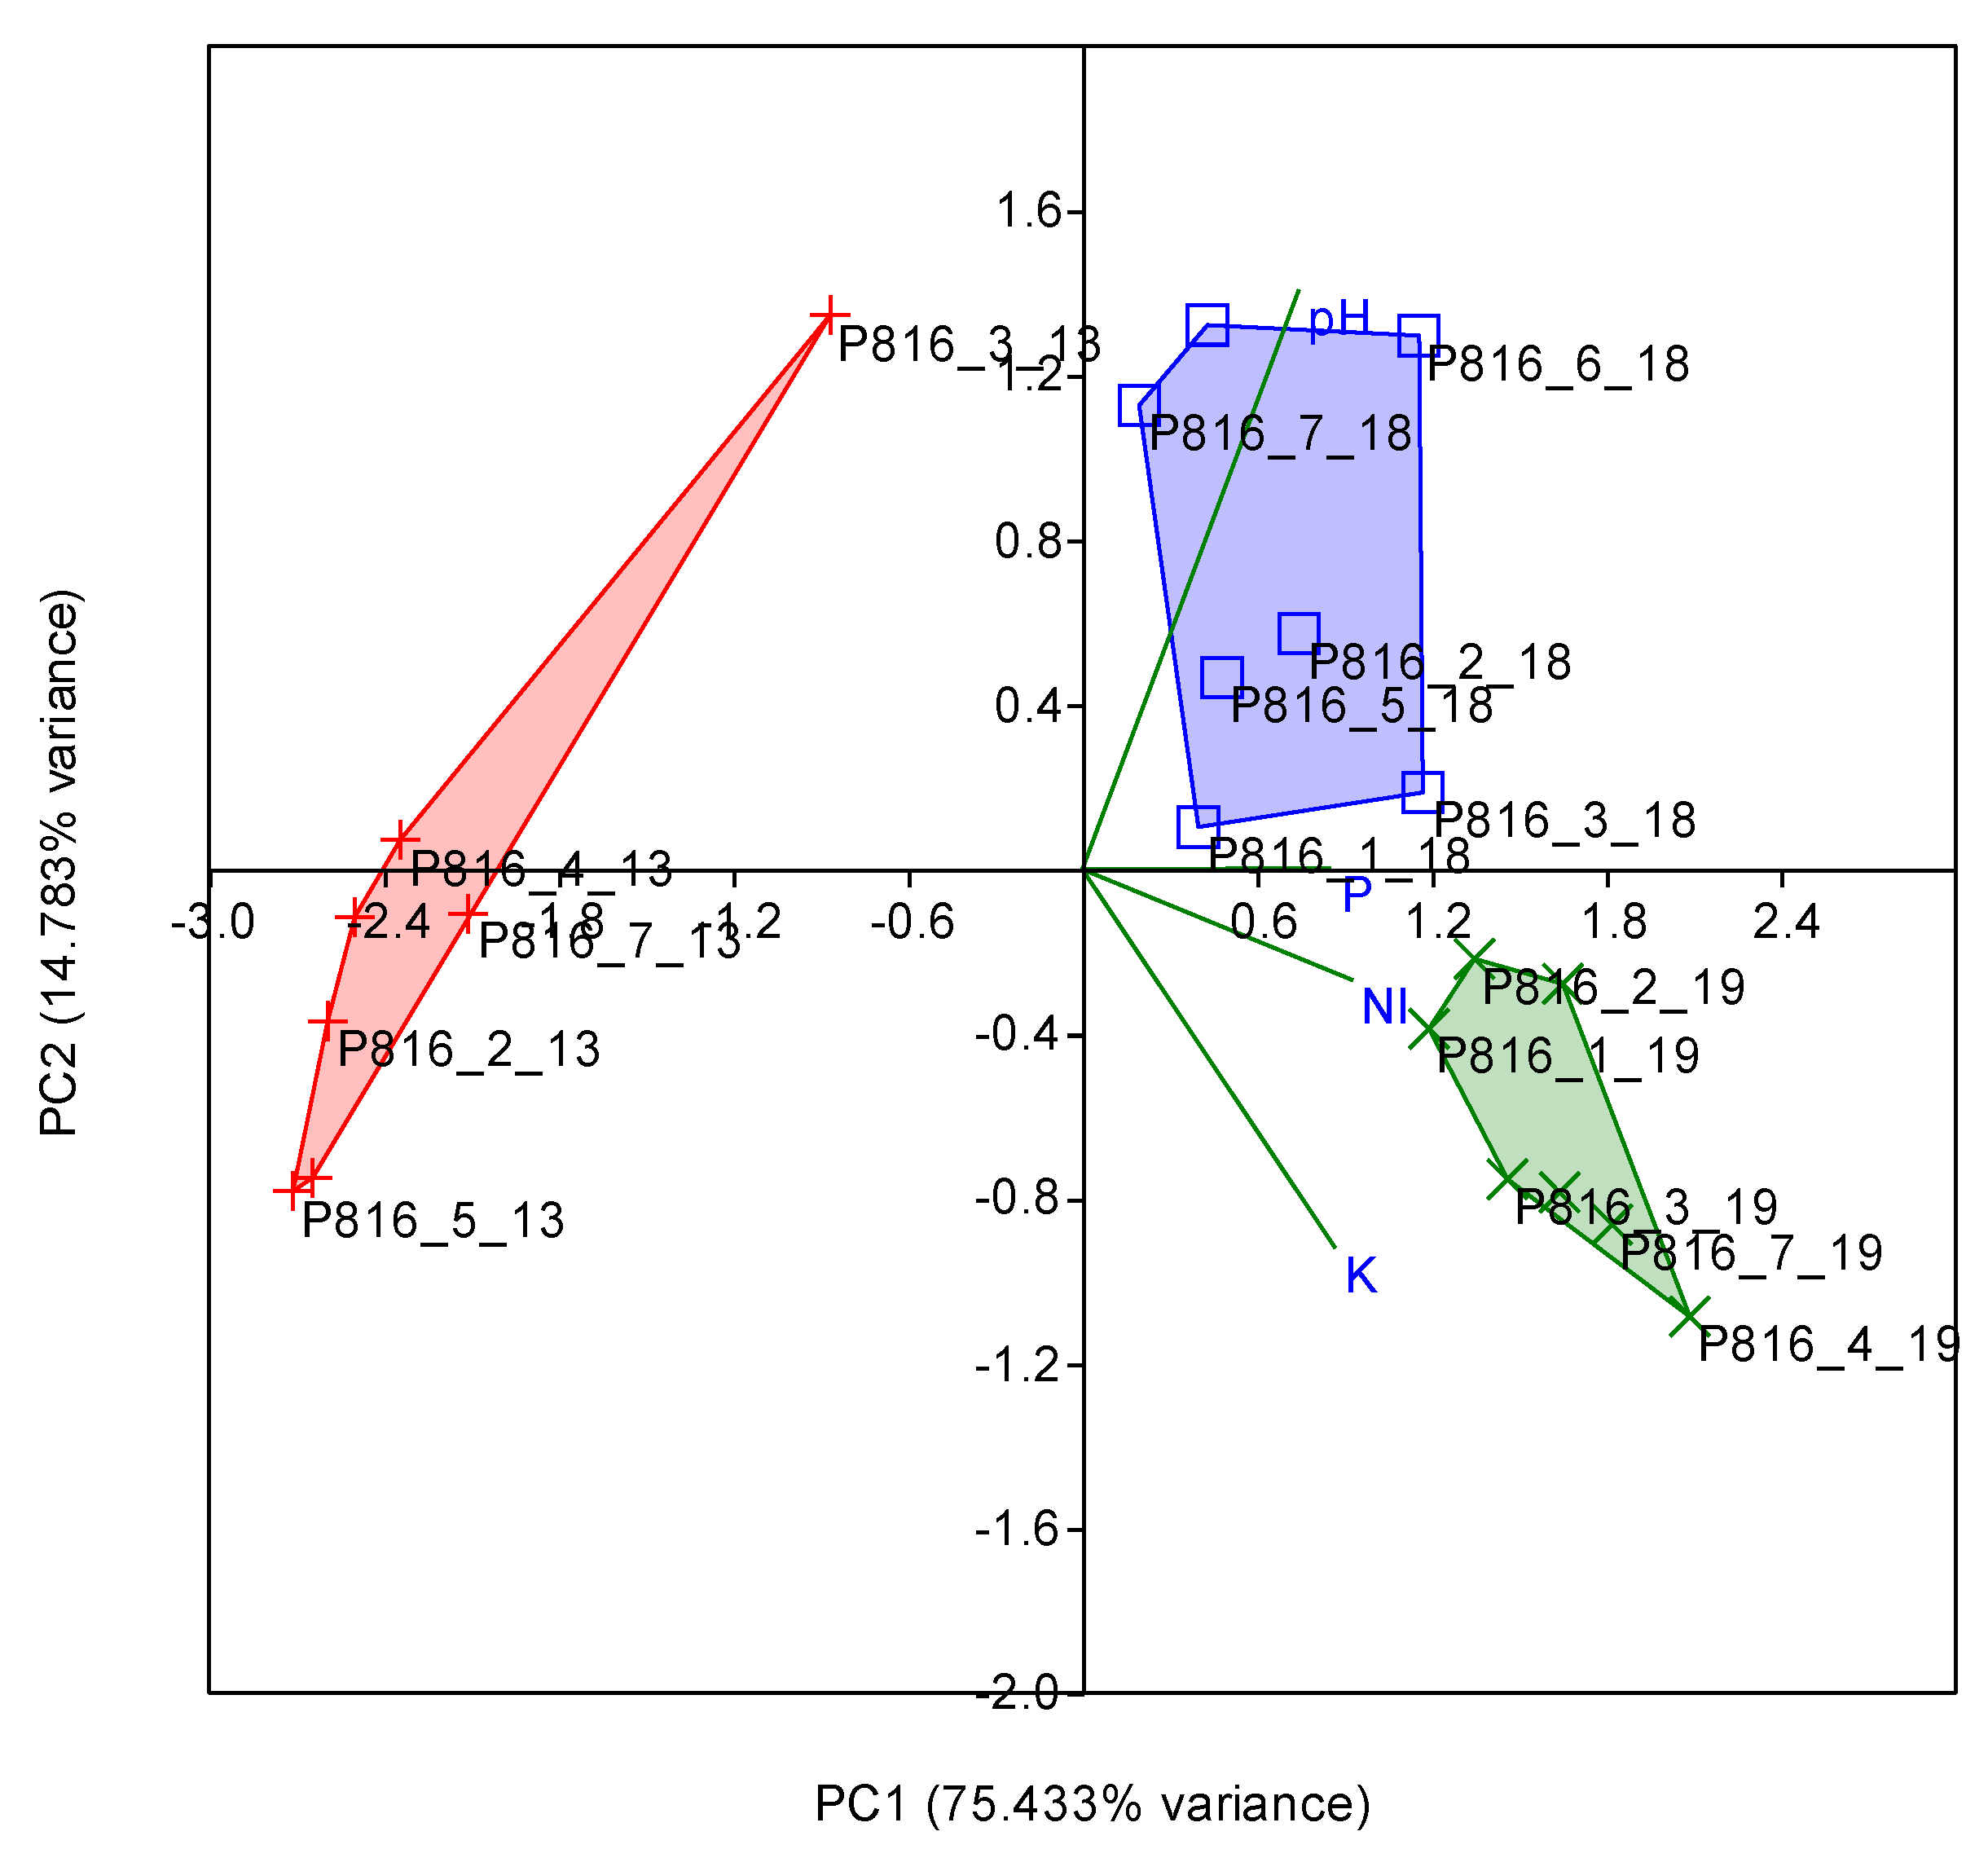
As a result of the annual application of the pig sludge on the two pasture plots under study, variation in time of the values of the agrochemical indices for the characterization of the soil was found. PCA correlation led to the positioning of soil samples (as an expression of soil quality under the influence of pig sludge) in relation to agrochemical indices and time, according to PCA diagrams in Figure 3 (plot P806) and Figure 4 (plot P816).
In the case of plot P806, PC1 explained 55.259% of variance, and PC2 explained 34.267% of variance). From the positioning of soil samples in relation to agrochemical indices and time (during the study period), it was found that the situation of 2018 (soil samples from 2018) was associated with soil pH and NI (as biplot), and soil samples from 2019 were associated with P and K (as biplot). This may suggest the order in which the agrochemical indices considered have changed over time (study period) in terms of their improvement. First, there was an improvement in pH values (as important in relation to the initial values), and then there was an improvement in P and K, most likely and associated with changes in soil pH.
In the case of plot P816, PC1 explained 75.433% of variance, and PC2 explained 14.783% of variance. A similar analysis shows that, in the case of plot P816, there was an improvement in pH first (soil samples from 2018 being associated with pH as biplot), and then followed an improvement of the other indices (P, NI, K, as biplot), which correlated with soil samples from 2019.

3.3. Variability of Pasture Lands Studied Based on NDVI under the Influence of Pig Sludge

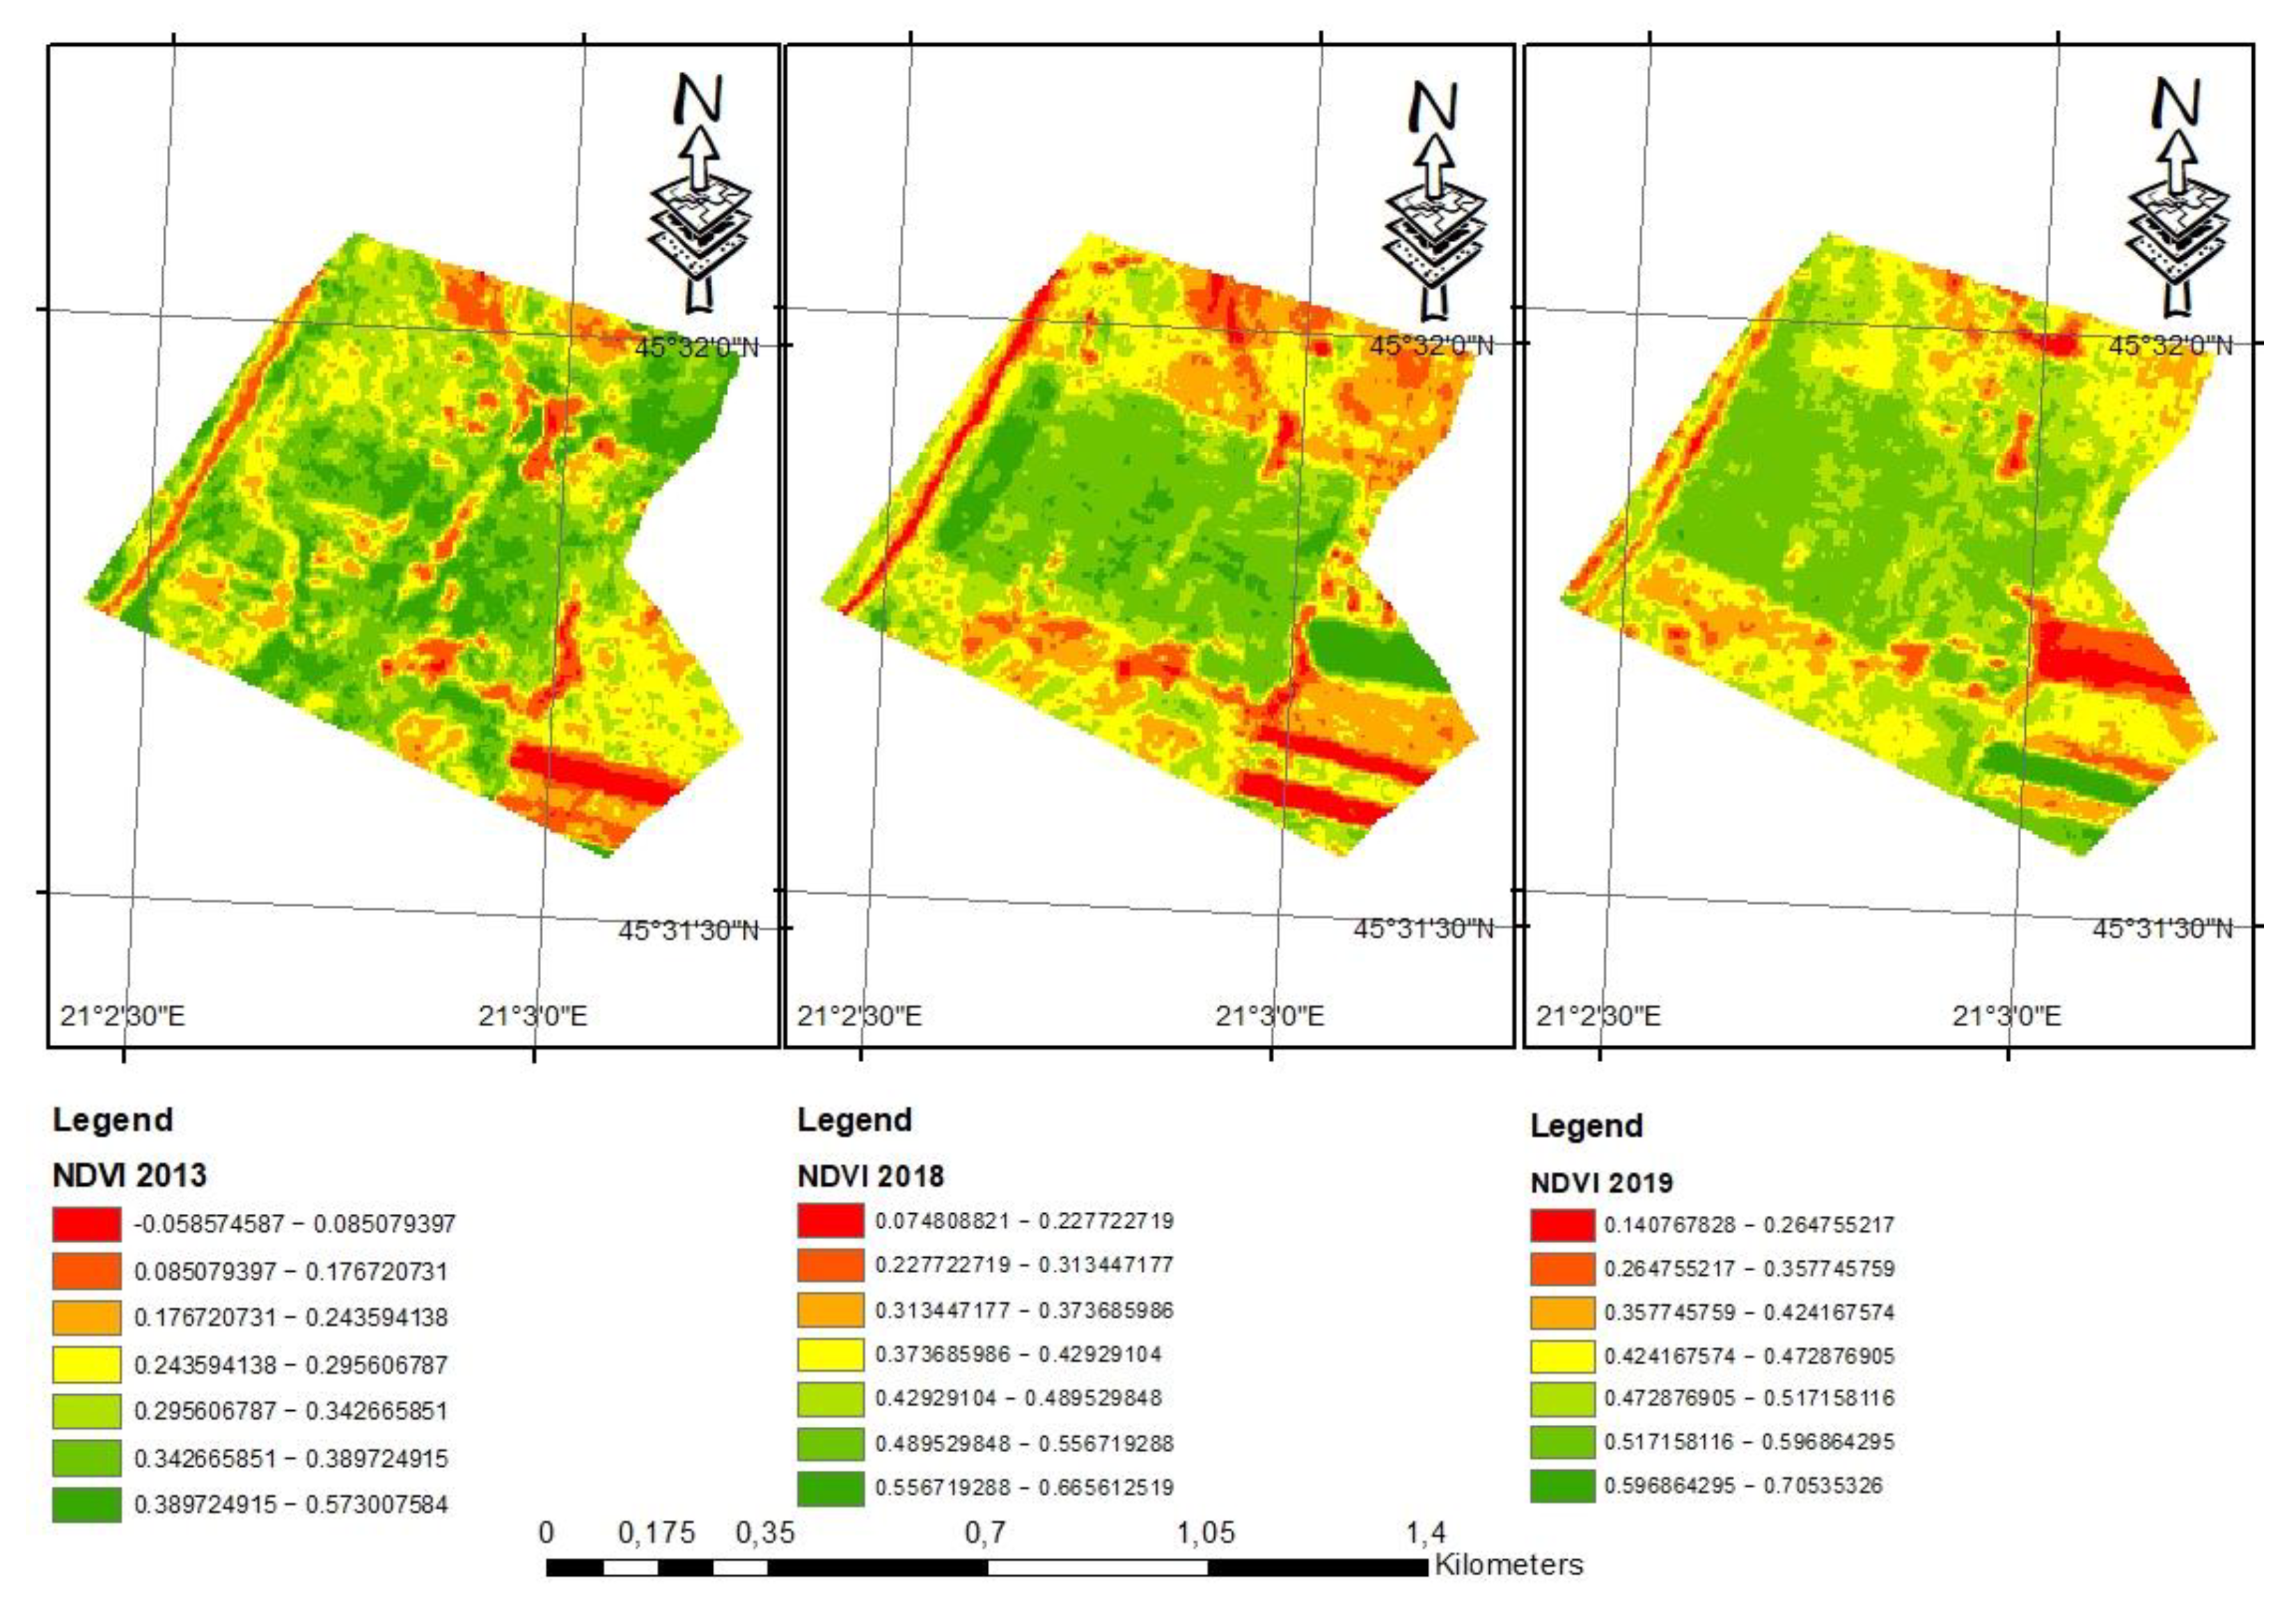
The spatial and temporal variability of the agricultural land of the pasture category, under the influence of pig sludge, was evaluated based on the NDVI index, which expresses the vegetation state, in direct relation of the vegetation with the soil quality. The NDVI index was calculated on each pasture plot studied (P808, P816) and was classified into seven classes. The low values of NDVI (NDVI < 0.5) express a poorly developed vegetation, and the high values (NDVI > 0.5, toward 1) indicate a quality vegetation that is well developed.
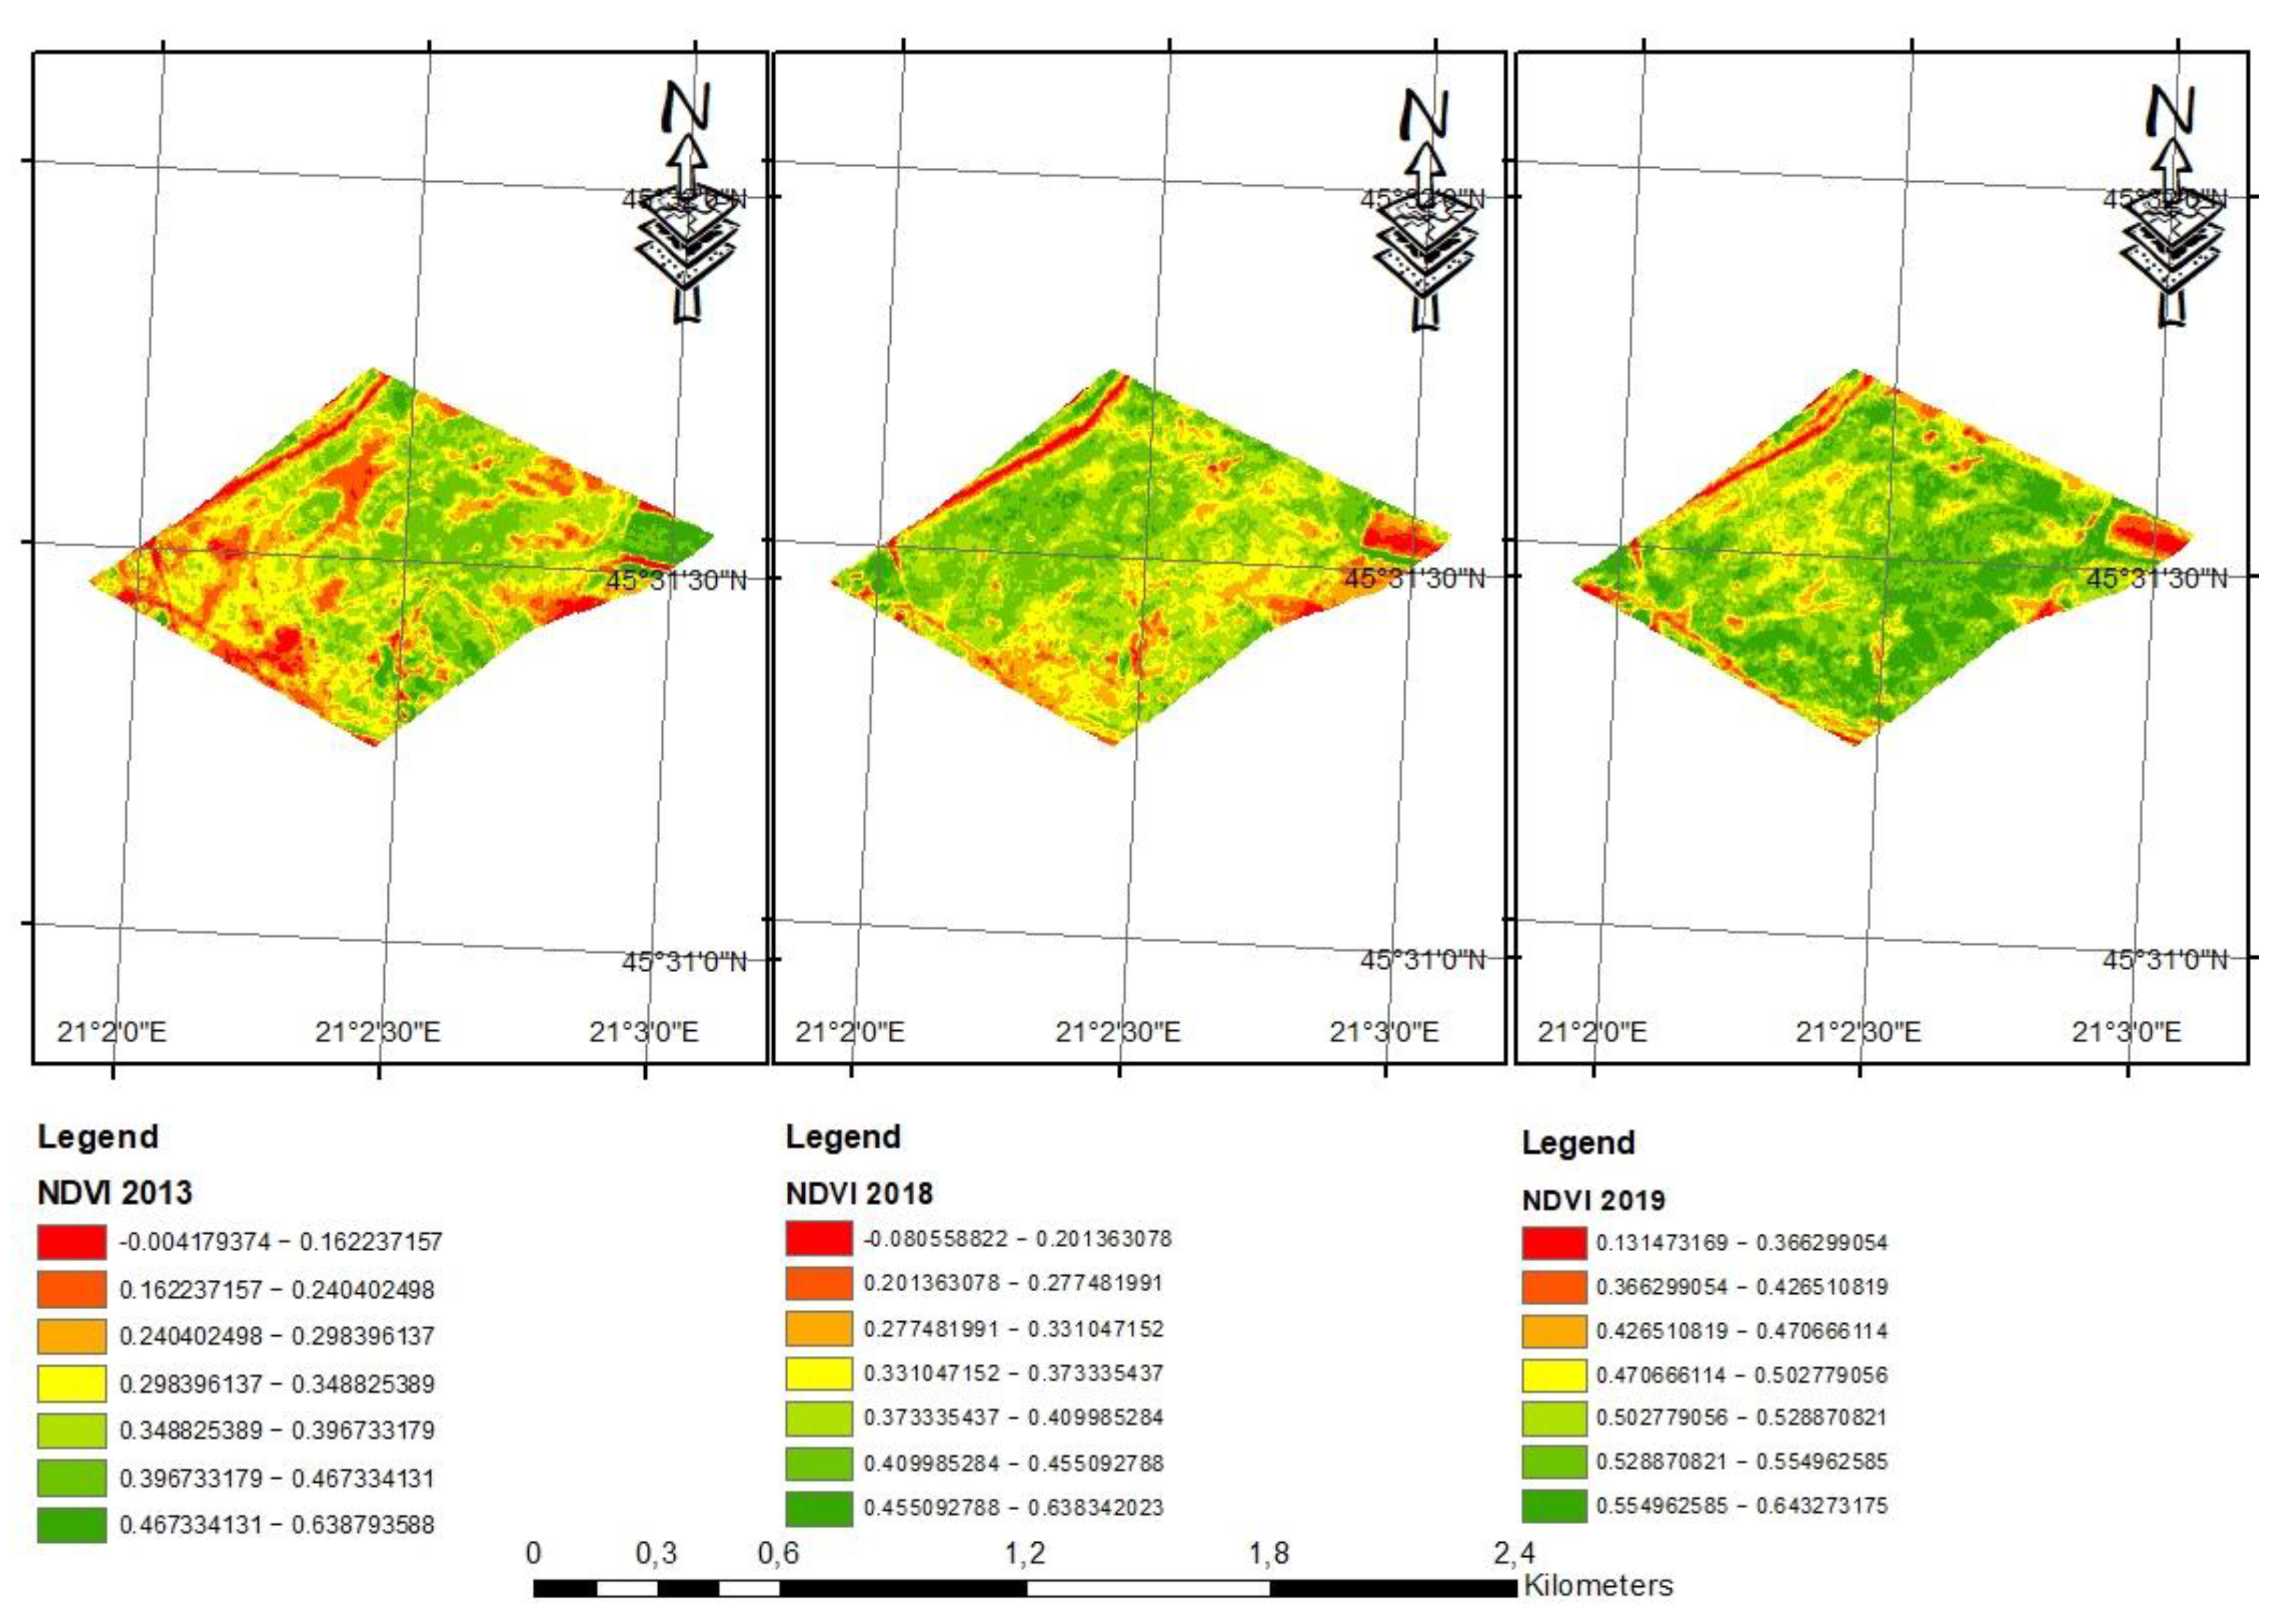
In the case of plot P808, the values for the NDVI index and the related land areas for each class and year of study are shown in Table 7, and the map of NDVI values is shown in Figure 5. In the case of plot P816, the values for the NDVI index and the related land areas for each class and year of study are shown in Table 8, and the map of NDVI values is shown in Figure 6.
The analysis in dynamics (spatial and temporal) of the variation of the land surface afferent to each NDVI class, during the study interval, showed how class C1, which expressed the weakest vegetation, registered a decrease, from 23,153.95 m2 (year 2013) to 12,851.99 m2 (year 2019), and this occurred in the conditions in which the average value of NDVI registered an increase in the C1 class representation, from 0.118941 in 2013 to 0.333843 in 2019.

4. Discussion

By applying the pig sludge in doses of 80 m3 ha−1 y−1 on the two plots (P808 and P816) of the pasture category, taken into study, it was found that there was variation in the agrochemical indices between 2013 and 2019.
The agricultural land showed a high spatial variability, quantified both on the basis of agrochemical indices and on the basis of NDVI values. The analysis of the variability of the two pasture plots, under the influence of the annual application of pig sludge, based on the NDVI index showed the reduction of spatial variability, by comparing the values of the coefficient of variation (CV) from 2019 to 2013.
Thus, in the case of plot P808, the value of CVNDVI = 17.5098 in 2019 compared to CVNDVI = 41.5402 in 2013, and in the case of plot P816, the value of CVNDVI = 32.0685 for 2019 compared to CVNDVI = 52.2031 in 2013 were found.
More important is the fact that, associated with the NDVI values grouped into seven classes, increasing variation was found in the values of the land surfaces afferent to the superior NDVI classes (C5–C7), differentiated on the two plots. Moreover, there was an increase in NDVI values in all classes, over time during the study period, which shows that inclusively the quality of vegetation on the surfaces classified in the C1–C2 NDVI classes has improved.
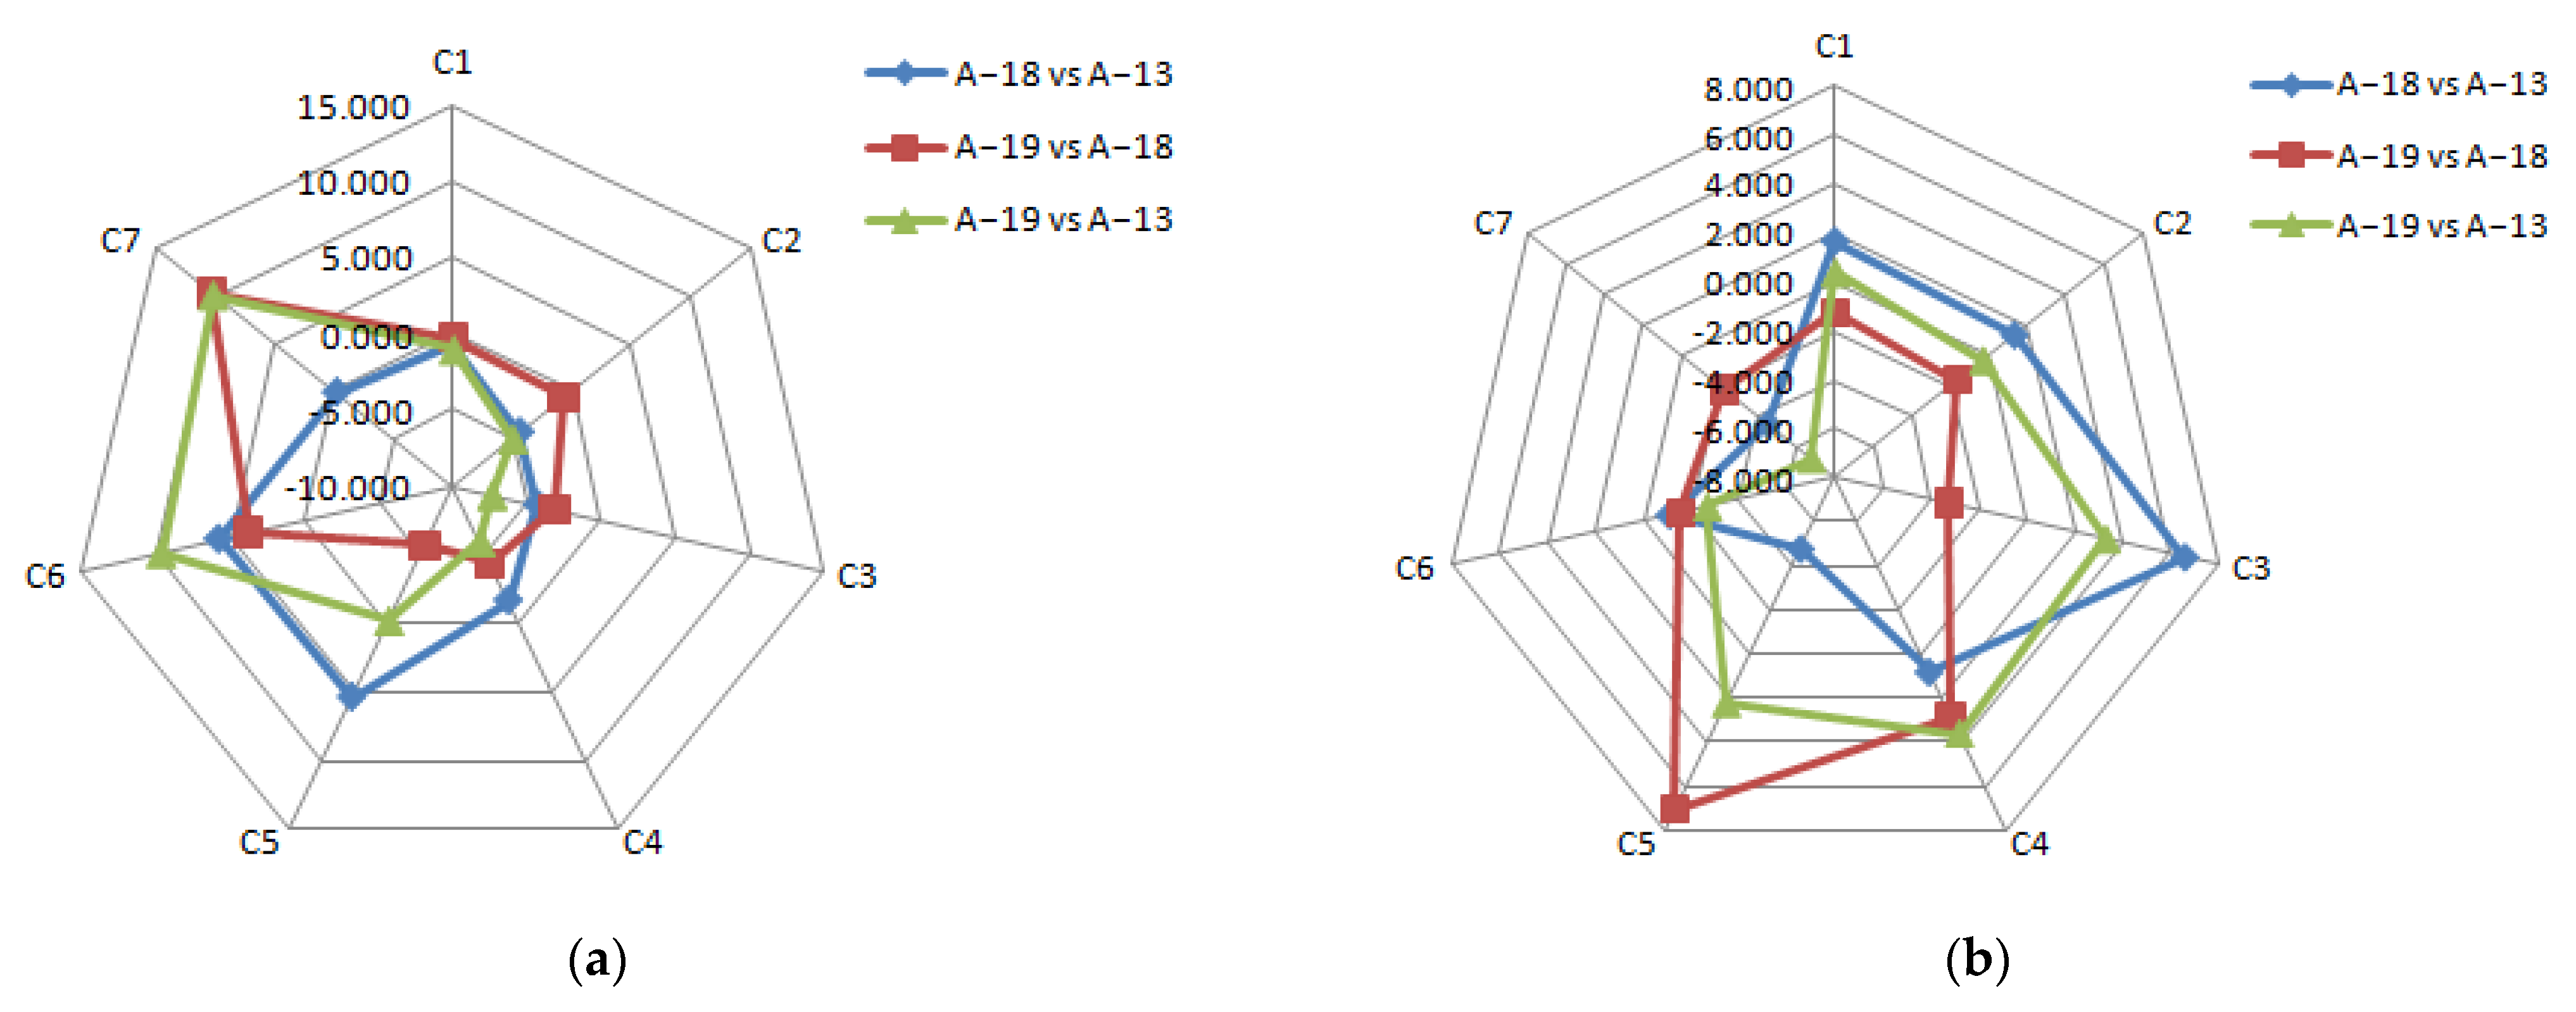
Within the plot P808, from the comparative analysis of the variation of the land surface included in each NDVI class by years of study, the surface area was found to decrease from classes C1 to C4 NDVI (low NDVI values) and to increase within classes C6 and C7 (NDVI high, NDVI > 0.5) in 2018 and 2019 compared to 2013, Figure 7a. In the case of plot P816, the surface area was found to increase in the middle classes NDVI (C3–C5) in 2018 and 2019 compared to 2013, Figure 7b.
In the case of soil pH, the values of the coefficient of variation (CV) decreased in 2019 (CVpH = 1.3003) compared to 2013 (CVpH = 2.1851) for plot P808 and CVpH = 1.2169 in 2019 compared to CVpH = 3.9592 in 2013 for plot P816.
By the annual application of pig slurry (arable land), in doses of 60 and 120 m3 ha−1, Ndayegamye and Côté [32] did not register a significant change in soil pH, N content, and C:N ratio, comparative to the control variant. Park et al. [24] concluded that the use of pH-controlled pig sludge (acidified) is an effective way to reduce the potential impact on the environment, provided that plant growth yields were not affected (medicinal plant experiment). According to long-term studies on two types of soil (Cambisol and Luvisol), pig slurry has improved the yields of field peas, without having negative effects on soil pH [22].
Under the influence of the application of pig sludge on the two pasture plots (P808, P616), the nitrogen index changed, and the spatial and temporal variability decreased for this soil index. The values of the coefficient of variation were CVNI = 2.3774 in 2019 compared to CVNI = 4.8960 in 2013 for plot P808 and CVNI = 4.4084 in 2019 compared to CVNI = 8.8759 in 2013 for plot P816.
Pig slurry, as a solid fraction, prepared in the form of compost (mixture with cotton gin waste), was tested on sandy-loam soil and led to an increase in total nitrogen (NT) and available phosphorus content, without a significant increase in Cu and Zn, and with a favorable influence on biomass production [21]. Park et al. [24] found the differentiated variation of ammoniacal ( NH 4 + ) and nitric ( NO 3 ) nitrogen in the soil in relation to the type of pig sludge used (pig sludge with acidified pH/unchanged pH). The authors also reported favorable effects of acidified pH pig sludge on nitrogen in the soil (delayed nitrification, reduction of NH3 and N2O emissions, and reduction of NO 3 leaching).
In the case of phosphorus content (P, ppm), there was a decrease in CV values in 2019 (CVP = 14.3059) compared to 2013 (CVP = 33.3410) for plot P808 and CVP = 10.3857 in 2019 compared to CVP = 11.3154 in year 2013 for plot P816.
Pig manure application positively influenced the phosphorus regime in the soil, and the available phosphorus had a better qualitative effect on the soil nematode communities, compared to other soil properties, with a favorable influence for healthy agro-ecosystems [41]. Under the condition of using the pig sludge for 15 years (doses between 25 and 200 m3 ha−1 y−1) on an Oxisol, Boitt et al. [33] found the accumulation of phosphorus mainly in inorganic forms, especially in the layer 0−20 cm, in relation to the dose used. Pig slurry variably influenced the soil P content in relation to soil type (Cambisol and Luvisol) and how it was applied (singular, together with PK, or together with NPK) [22]. Under Cambisol conditions, pig sludge did not significantly influence the concentration of P in the soil on single application but was a more consistent influence in condition of application associated with PK or NPK. In contrast, when applied on Luvisol, pig slurry had a significant influence on P, both in single application and in combination with PK and NPK [22].
In the case of potassium (K, ppm), the coefficient of variation, under the influence of pig sludge, had the value CVK = 5.7091 in 2019 compared to CVK = 12.5965 in 2013 on plot P808 and CVK = 4.8447 in 2019 compared to CVK = 9.6086 in 2013, in the case of plot P816. Pig slurry led to significant variations in soil potassium content, both applied singly and more obviously on application associated with PK and NPK, under experimental conditions on Cambisol and Luvisol [22].
Applied in greenhouse conditions to tomato and cucumber crops, three types of swine slurry (basic fertilization, based on soil tests), after a period of 5 years of use, did not affect the physical and chemical properties of the soil (including phosphates and trace elements) [42].
By applying the liquid swine manure, for variable periods, for an interval of 0–10 years, the positive influence on the soil porosity, the organic matter content, and some exchangeable cations (Ca, Mg, K, Al) was found [43]. At the same time, there were favorable effects on the production of soybeans, cultivated under the study conditions.
Organic fertilization with pig sludge, in different application rates, over a period of 17 years (tropical soil, no-tillage soybean–corn cropping system), positively favored the carbon balance, mineralization of organic matter, formation of humic substances, and improvement of the size of the soil aggregates [44].
Pig slurry and pig deep litter (swine manure and rice husk), tested with other organic and mineral fertilizers, in a long experiment (2004−2020), led to an increase in soil pH by up to one unit, increasing the C content of the soil, and the level of mineral elements in the soil (P, K, Ca, Mg) [45].
Comparing fertilizer variants (fertilizer groups) that included pig slurry, along with complexes (PK, NPK) or combinations thereof, the ANOVA test found groups of fertilizers with obvious effects on soil indices (pH, P, K, etc.), which demonstrated the fertilizing effect of pig slurry [22].
The results of this study, analyzed in terms of soil quality indices (pH, P, K, NI) and vegetation (NDVI), are in line with other studies and research in the field, on the influence of various forms of pig sludge on agro-ecosystems.

5. Conclusions

Pig sludge applied on agricultural land of the pasture category, at a dose of 80 m3 ha−1 y−1 during the period 2013−2019, influenced the soil quality indices (pH, P, K, and NI) and the NDVI vegetation index determined on the basis of satellite scenes.
Soil pH initially registered a slight upward trend, followed by a decrease in the average values on the two plots (P808, P816), depth 0−20 cm, and the agrochemical indices P, K, and NI registered an increasing tendency, under the influence of the pig sludge in the applied dose, period 2013−2019. At the same time, there was a decrease in the variability of pH values over time (study interval), based on the coefficient of variation (CV).
According to PCA, the temporal variability of soil agrochemical indices, agricultural land of the pasture category, under the influence of pig sludge, study interval 2013−2019, showed the association of the soil sample from the year 2018 with soil pH and the soil sample from the year 2019 with P and K, which suggests a certain order of cumulating of the effects induced by the pig sludge (positive-cumulative effects) in the pasture lands, in the study conditions.
Based on the NDVI index and the coefficient of variation of the NDVI values in the period 2013−2019, the spatial variability of the terrain decreased, simultaneously with the increase of the surfaces classified in NDVI upper classes (NDVI > 0.5), in the seventh generated NDVI class.
Overall, the favorable effect of the application of pig sludge on soil (Eutricambosol) in agricultural land conditions of the pasture category can be appreciated, which recommends pig sludge as a fertilizing resource for different agricultural systems and categories of farmers, in relation to the conditions of this study.

Author Contributions

Conceptualization, F.S. and R.B.; methodology, F.S.; software, M.H.; validation, R.B., D.D., and M.H.; formal analysis, M.H.; investigation, R.B.; resources, D.D.; data curation, F.S.; writing—original draft preparation, F.S.; writing—review and editing, M.H.; visualization, D.D.; supervision, R.B. All authors have read and agreed to the published version of the manuscript.

Funding

This research received no external funding.

Data Availability Statement

Not applicable.

Acknowledgments

The authors thank the GEOMATICS Research Laboratory, BUASMV “King Michael I of Romania” from Timisoara, for the facility of the software use for this study. The conduct of the research was supported by contract no. 6327/08.10.2018. This research paper is supported by the project “Increasing the impact of excellence research on the capacity for innovation and technology transfer within USAMVB Timișoara” code 6PFE, submitted in the competition Program 1—Development of the national system of research development, Subprogram 1.2—Institutional performance, Institutional development projects—Development projects of excellence in RDI.

Conflicts of Interest

The authors declare no conflict of interest.

References

  1. Cole, M.B.; Augustin, M.A.; Robertson, M.J.; Manners, J.M. The science of food security. NPJ Sci. Food 2018, 2, 14. [Google Scholar] [CrossRef] [PubMed]
  2. Knorr, D.; Augustin, M.A.; Tiwari, B. Advancing the role of food processing for improved integration in sustainable food chains. Front. Nutr. 2020, 7, 34. [Google Scholar] [CrossRef]
  3. Vågsholm, I.; Arzoomand, N.S.; Boqvist, S. Food security, safety, and sustainability—getting the trade-offs right. Front. Sustain. Food Syst. 2020, 4, 16. [Google Scholar] [CrossRef]
  4. Van Dijk, M.; Morley, T.; Rau, M.L.; Saghai, Y. A meta-analysis of projected global food demand and population at risk of hunger for the period 2010–2050. Nat. Food 2021, 2, 494–501. [Google Scholar] [CrossRef]
  5. Pawlak, K.; Kołodziejczak, M. The role of agriculture in ensuring food security in developing countries: Considerations in the context of the problem of sustainable food production. Sustainability 2020, 12, 5488. [Google Scholar] [CrossRef]
  6. Friedrich, T.; Kassam, A. Food security as a function of sustainable intensification of crop production. AIMS Agric. Food 2016, 1, 227–238. [Google Scholar] [CrossRef]
  7. Kopittke, P.M.; Menzies, N.W.; Wang, P.; McKenna, B.A.; Lombi, E. Soil and the intensification of agriculture for global food security. Environ. Int. 2019, 132, 105078. [Google Scholar] [CrossRef] [PubMed]
  8. Jurgilevich, A.; Birge, T.; Kentala-Lehtonen, J.; Korhonen-Kurki, K.; Pietikäinen, J.; Saikku, L.; Schösler, H. Transition towards circular economy in the food system. Sustainability 2016, 8, 69. [Google Scholar] [CrossRef] [Green Version]
  9. Van Zanten, H.H.E.; van Ittersum, M.K.; de Boer, I.J.M. The role of farm animals in a circular food system. Glob. Food Sec. 2019, 21, 18–22. [Google Scholar] [CrossRef]
  10. Koppelmäki, K.; Helenius, J.; Schulte, R.P.O. Nested circularity in food systems: A Nordic case study on connecting biomass, nutrient and energy flows from field scale to continent. Resour. Conserv. Recycl. 2021, 164, 105218. [Google Scholar] [CrossRef]
  11. Mancini, M.C.; Arfini, F.; Antonioli, F.; Guareschi, M. Alternative agri-food systems under a market agencements approach: The case of multifunctional farming activity in a peri-urban area. Environments 2021, 8, 61. [Google Scholar] [CrossRef]
  12. Vicente-Vicente, J.L.; Doernberg, A.; Zasada, I.; Ludlow, D.; Staszek, D.; Bushell, J.; Hainoun, A.; Loibl, W.; Piorr, A. Exploring alternative pathways toward more sustainable regional food systems by foodshed assessment—City region examples from Vienna and Bristol. Environ. Sci. Policy 2021, 124, 401–412. [Google Scholar] [CrossRef]
  13. Roellig, M.; Sutcliffe, L.M.; Sammul, M.; von Wehrden, H.; Newig, J.; Fischer, J. Reviving wood-pastures for biodiversity and people: A case study from western Estonia. Ambio 2016, 45, 185–195. [Google Scholar] [CrossRef] [Green Version]
  14. Envall, I.; Bengtsson, J.; Jakobsson, S.; Rundlöf, M.; Åberg, C.; Lindborg, R. What is the effect of giving the grazers access to additional nutrient sources on biodiversity in semi-natural pastures? A systematic review protocol. Environ Evid. 2021, 10, 16. [Google Scholar] [CrossRef]
  15. Wezel, A.; Stöckli, S.; Tasser, E.; Nitsch, H.; Vincent, A. Good pastures, good meadows: Mountain farmers’ assessment, perceptions on ecosystem services, and proposals for biodiversity management. Sustainability 2021, 13, 5609. [Google Scholar] [CrossRef]
  16. Burak, D.L.; Monteiro, E.d.C.; Passos, R.R.; Mendonça, E.d.S. Soil quality index for extensive pastures in hilly landforms region of highly weathered soils in an Atlantic forest biome, Brazil. Afr. J. Range Forage Sci. 2021, 1–12. [Google Scholar] [CrossRef]
  17. Karaca, S.; Dengiz, O.; Turan, I.D.; Özkan, B.; Dedeoğlu, M.; Gülser, F.; Sargin, B.; Demirkaya, S.; Ay, A. An assessment of pasture soils quality based on multi-indicator weighting approaches in semi-arid ecosystem. Ecol. Indic. 2021, 121, 107001. [Google Scholar] [CrossRef]
  18. Sands, R.; Westcott, P.; Price, J.M.; Beckman, J.; Leibtag, E.; Lucier, G.; McBride, W.; McGranahan, D.; Morehart, M.; Roeger, E.; et al. Impacts of Higher Energy Prices on Agriculture and Rural Economies; ERR-123; U.S. Department of Agriculture, Economic Research Service: Washington, DC, USA, 2011. [Google Scholar]
  19. Choudhary, M.; Bailey, L.D.; Grant, C.A. Review of the use of swine manure in crop production: Effects on yield and composition and on soil and water quality. Waste Manag. Res. 1996, 14, 581–595. [Google Scholar] [CrossRef]
  20. Imbeah, M. Composting piggery waste: A review. Bioresour. Technol. 1998, 63, 197–203. [Google Scholar] [CrossRef]
  21. Santos, A.; Fangueiro, D.; Moral, R.; Bernal, M.P. Composts produced from pig slurry solids: Nutrient efficiency and N-leaching risks in amended soils. Front. Sustain. Food Syst. 2018, 2, 8. [Google Scholar] [CrossRef]
  22. Hlisnikovský, L.; Menšík, L.; Čermák, P.; Křížová, K.; Kunzová, E. Long-term effect of pig slurry and mineral fertilizer additions on soil nutrient content, field pea grain and straw yield under winter wheat–spring barley–field pea crop rotation on cambisol and luvisol. Land 2022, 11, 187. [Google Scholar] [CrossRef]
  23. Loyon, L. Overview of animal manure management for beef, pig, and poultry farms in France. Front. Sustain. Food Syst. 2018, 2, 36. [Google Scholar] [CrossRef]
  24. Park, S.H.; Lee, B.R.; Jung, K.H.; Kim, T.H. Acidification of pig slurry effects on ammonia and nitrous oxide emissions, nitrate leaching, and perennial ryegrass regrowth as estimated by 15N-urea flux. Asian-Australas. J. Anim. Sci. 2018, 31, 457–466. [Google Scholar] [CrossRef] [PubMed]
  25. Zhang, D.; Wang, X.; Zhou, Z. Impacts of small-scale industrialized swine farming on local soil, water and crop qualities in a Hilly Red soil region of Subtropical China. Int. J. Environ. Res. Public Health 2017, 14, 1524. [Google Scholar] [CrossRef] [Green Version]
  26. Venglovsky, J.; Sasakova, N.; Gregova, G.; Papajova, I.; Toth, F.; Szaboova, T. Devitalisation of pathogens in stored pig slurry and potential risk related to its application to agricultural soil. Environ. Sci. Pollut. Res. Int. 2018, 25, 21412–21419. [Google Scholar] [CrossRef] [PubMed] [Green Version]
  27. Terrero, M.A.; Muñoz, M.Á.; Faz, Á.; Gómez-López, M.D.; Acosta, J.A. Efficiency of an integrated purification system for pig slurry treatment under Mediterranean Climate. Agronomy 2020, 10, 208. [Google Scholar] [CrossRef] [Green Version]
  28. Zhang, Y.; Jiang, Y.; Wang, S.; Wang, Z.; Liu, Y.; Hu, Z.; Zhan, X. Environmental sustainability assessment of pig manure mono- and co-digestion and dynamic land application of the digestate. Renew. Sustain. Energ. Rev. 2021, 137, 110476. [Google Scholar] [CrossRef]
  29. Silva, H.L.d.C.E.; Barros, R.M.; Santos, I.F.S.d.; Lora, E.E.S.; Alcântara, M.A.K.d.; Andrade, R.V. A review of Brazilian agro-industrial pig farming systems: Environmental impacts and applied anaerobic digestion processes with mineral additives. Res. Soc. Dev. 2022, 11, e6811121720. [Google Scholar] [CrossRef]
  30. Poole, D.B.R.; McGrath, D.; Fleming, G.A.; Moore, W. Effects of applying copper-rich pig slurry to grassland: 4. Sheep feeding experiments. Irish J. Agric. Res. 1990, 29, 35–40. Available online: https://www.jstor.org/stable/25556253 (accessed on 19 January 2022).
  31. Stevens, C.G.; Ugese, F.D.; Baiyeri, K.P. Effect of pig manure on growth and productivity of twenty accessions of Moringa oleifera in Nigeria. Agro-Sci. J. Trop. Agric. Food Environ. Ext. 2018, 17, 19–26. [Google Scholar] [CrossRef] [Green Version]
  32. Ndayegamye, A.; Côté, D. Effect of long-term pig slurry and solid cattle manure application on soil chemical and biological propenies. Can. J. Soil Sci. 1989, 69, 39–47. [Google Scholar] [CrossRef]
  33. Boitt, G.; Schmitt, D.E.; Gatiboni, L.C.; Wakelin, S.A.; Black, A.; Sacomori, W.; Cassol, P.C.; Condron, L.M. Fate of phosphorus applied to soil in pig slurry under cropping in southern Brazil. Geoderma 2018, 321, 164–172. [Google Scholar] [CrossRef]
  34. Ekane, N.; Barquet, K.; Rosemarin, A. Resources and risks: Perceptions on the application of sewage sludge on agricultural land in Sweden, a case study. Front. Sustain. Food Syst. 2021, 5, 647780. [Google Scholar] [CrossRef]
  35. FAOUN. World reference base for soil resources 2014. In International Soil Classification System for Naming Soils and Creating Legends for Soil Maps; Food and Agriculture Organization of the United Nations: Rome, Italy, 2014; ISBN 9789251083697. [Google Scholar]
  36. Florea, N.; Munteanu, I. Sistemul Roman de Taxonomie a Solului (SRTS); Editura Sitech: Craiova, Romania, 2012; ISBN 978-606-11-2090-1. [Google Scholar]
  37. Rouse, J.W.; Haas, R.H.; Schell, J.A.; Deering, D.W. Monitoring vegetation systems in the great plains with ERTS. In Proceedings of the Third Earth Resources Technology Satellite-1 Symposium, Greenbelt, MD, USA, 10–14 December 1974; pp. 3010–3017. [Google Scholar]
  38. Planet Team. Planet Application Program Interface: In Space for Life on Earth; Planet Team: San Francisco, CA, USA, 2017; Available online: https://api.planet.com (accessed on 10 December 2020).
  39. Hammer, Ø.; Harper, D.A.T.; Ryan, P.D. PAST: Paleontological statistics software package for education and data analysis. Palaeontol. Electron. 2001, 4, 1–9. [Google Scholar]
  40. ESRI. ArcGIS Desktop: Release 10; Environmental Systems Research Institute: Redlands, CA, USA, 2011. [Google Scholar]
  41. Yang, Y.R.; Li, X.G.; Zhou, Z.G.; Zhang, T.L.; Wang, X.X. Differential responses of soil nematode community to pig manure application levels in Ferric Acrisols. Sci. Rep. 2016, 6, 35334. [Google Scholar] [CrossRef] [Green Version]
  42. Seo, Y.H.; Cho, B.O.; Choi, J.K.; Kang, A.S.; Jeong, B.C.; Jung, Y.S. Impact of continuous application of swine slurry on changes in soil properties and yields of tomatoes and cucumbers in a greenhouse. Korean J. Soil Sci. Fert. 2010, 43, 446–452. [Google Scholar]
  43. Antoneli, V.; Mosele, A.C.; Bednarz, J.A.; Pulido-Fernández, M.; Lozano-Parra, J.; Keesstra, S.D.; Rodrigo-Comino, J. Effects of applying liquid swine manure on soil quality and yield production in tropical soybean crops (Paraná, Brazil). Sustainability 2019, 11, 3898. [Google Scholar] [CrossRef] [Green Version]
  44. Tavares, R.L.M.; Assis, R.L.; Ferreira, R.V.; Menezes, J.F.S.; Simon, G.A.; Boldrin, P.F.; Cantão, V.C.G. Long term application of pig manure on the chemical and physical properties of Brazilian Cerrado soil. Carbon Manag. 2019, 10, 541–549. [Google Scholar] [CrossRef]
  45. Ferreira, P.A.A.; Ceretta, C.A.; Lourenzi, C.R.; de Conti, L.; Marchezan, C.; Girotto, E.; Tiecher, T.L.; Palermo, N.M.; Parent, L.-É.; Brunetto, G. Long-term effects of animal manures on nutrient recovery and soil quality in acid typic hapludalf under no-till conditions. Agronomy 2022, 12, 243. [Google Scholar] [CrossRef]
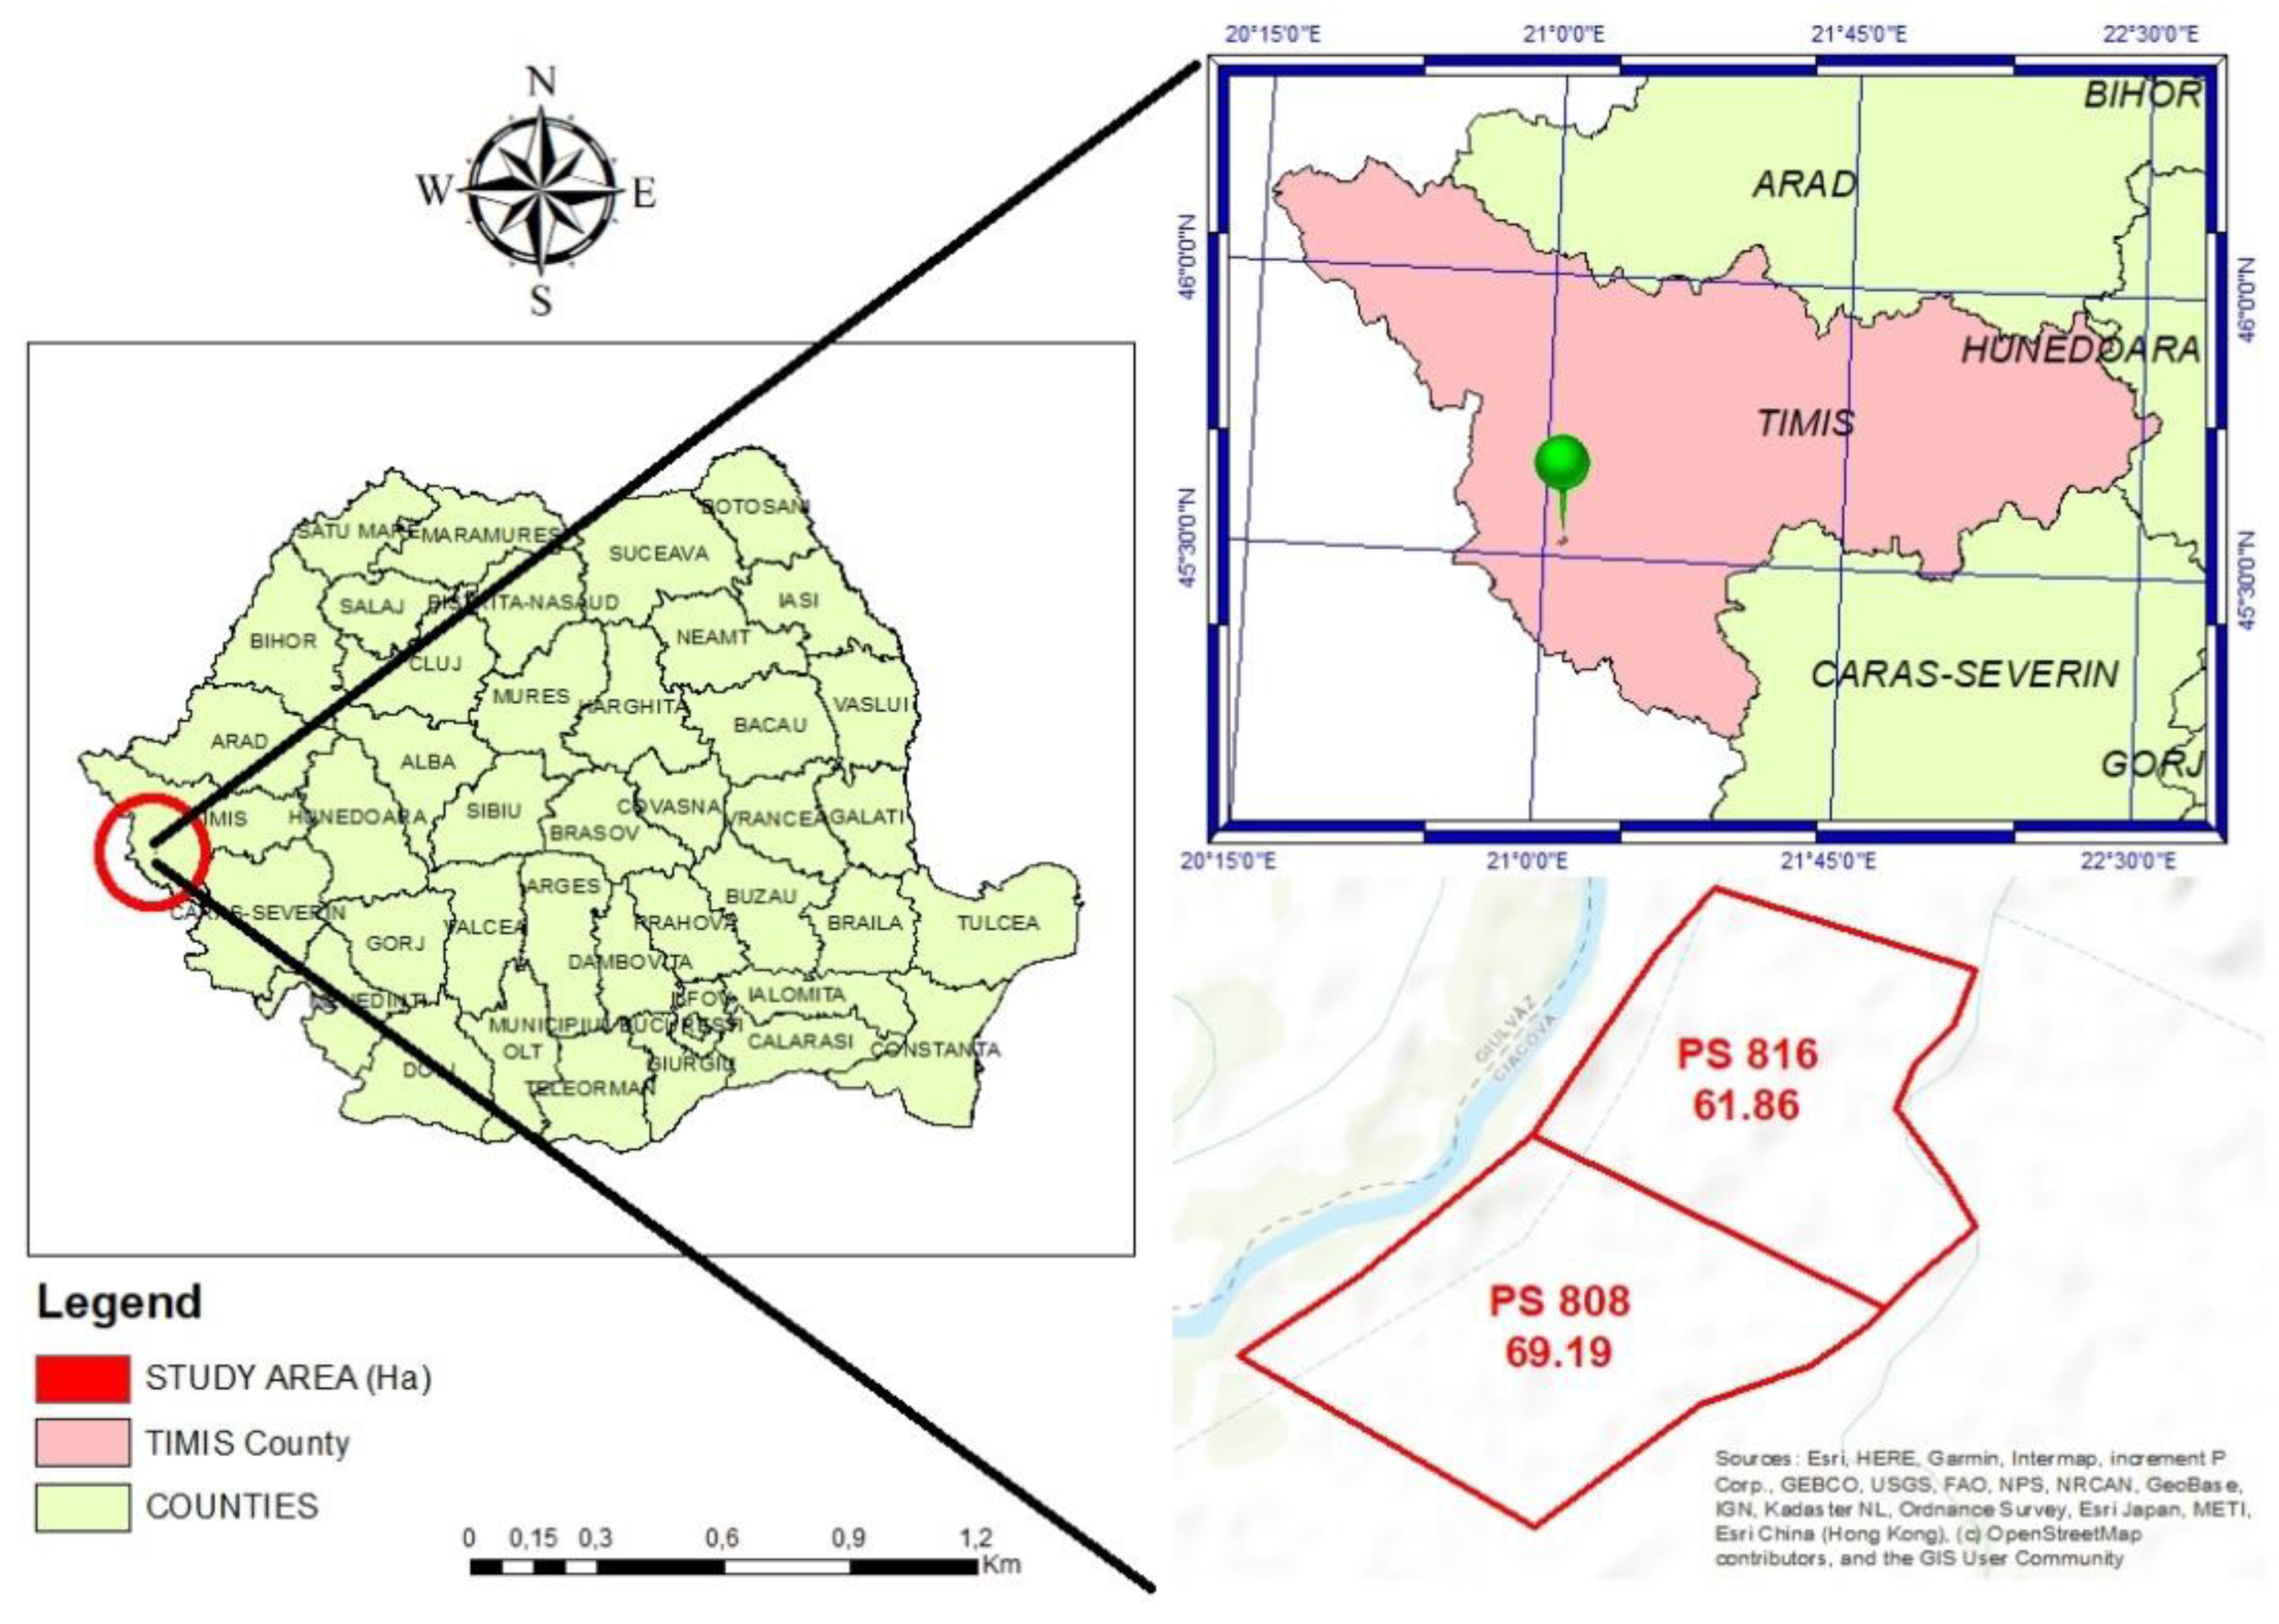
Figure 1. Location of the studied agricultural land of the pasture category, Ciacova locality, Timiș County, Romania.
Agronomy 12 00701 g001
Figure 2. Pig sludge fermentation tank, SC Smithfield Romania SRL, Timiș County, Romania.
Agronomy 12 00701 g002
Figure 3. PCA (correlation) diagram, pasture plot P808, Ciacova, Timiș County, Romania, 2013–2019 period.
Agronomy 12 00701 g003
Figure 4. PCA (correlation) diagram, pasture plot P816, Ciacova, Timiș County, Romania, 2013–2019 period.
Agronomy 12 00701 g004
Figure 5. NDVI map for plot P808, pasture category, under the influence of pig sludge.
Agronomy 12 00701 g005
Figure 6. NDVI map for plot P816, pasture category, under the influence of pig sludge.
Agronomy 12 00701 g006
Figure 7. Circular chart of comparative variation of land areas of the pasture category, in relation to NDVI quality classes; (a) plot P808; (b) plot P816.
Agronomy 12 00701 g007
Table 1. Quality indices for pig sludge used to fertilize the studied land, pasture category.
Pig Sludge Quality IndexesMeasure UnitsValuesMethod/Standard
pH (H2O)pH units7.76Potentiometric, according to PS-03 1
T °C22.1
Organic matter% of dry substance49.26Calcinations at 600 °C, according to PL-01 1
Moisture%89.46Drying at 105 °C, according to PS-05 1
Nitrogen total (Nt)%0.10Kjeldahl, according to PS-08 1
Soluble phosphorus (P2O5)%0.048SR 11411-2:1998, according to PS-02 1
Soluble potassium (K2O)%0.10SR 11411/3-86, according to PS-06 1
1 PS-03, PL-01, PS-05, PS-08, PS-06 represent the codes of standard laboratory procedures for laboratory methods (OSPA Laboratory), approved by RENAR (Certification Institution in Romania).
Table 2. Presentation of the soil profile horizons SP1, P808, pastures agricultural category.
Soil HorizonDepth
(cm)
Properties
0–8Medium clay (LL), dark gray-brown, glomerular structure
Ao8–35Medium clay (LL), brown, large glomerular structure
AB35–50Medium clay (LL), yellowish brown, small prismatic structure
Bv50–65Medium clay (LL), yellowish brown, small prismatic structure
BCkg65–82Medium clay (LL), yellowish brown with rust spots (≤5%), small prismatic structure, weakly effervescent
CBkacGo382–100Medium clay (LL), rusty yellow (16–30%), slightly effervescent
Table 3. Values of physical, hydrophysical, and chemical parameters for the description of the soil profile SP1, pasture plot P808, Ciacova, Timis County, Romania.
ParametersMeasurement UnitsSoil Profile Horizon
AoABBvBCkgCBkacGo3
Depthcm835506582100
Coarse sand (2.0–0.2 mm)%3.63.843.53.14.1
Fine sand (0.2–0.02 mm)%44.646.442.74345.242.2
Dust (0.02–0.002 mm)%26.924.62523.72022.3
Colloidal clay (under 0.002 mm)%24.925.228.329.831.731.4
Physical clay (under 0.01 mm)%41.639.242.943.46444.3
Texture LLLLLLLLLLLL
Specific density (SD)g/cm32.632.632.622.632.65
Apparent density (AD)g/cm31.421.471.511.531.53
Total porosity (TP)%46.0144.1142.3741.8342.26
Aeration porosity (AP)%13.4911.337.946.797.07
Compaction degree (CD)%6.2210.1814.6116.1115.75
Hygroscopicity coefficient (HC)%5.845.916.646.997.43
Withering coefficient (WC)%8.778.879.9610.4811.15
Field capacity (FC)%22.922.322.822.923
Total capacity (TC)%32.4030.0028.0627.3427.62
Useful water capacity (UWC)%14.1413.4312.8512.4211.86
Hydraulic conductivity (HC)mm/h32.21.81.11
Calcium carbonates% 0.861.281.92
pH (H2O)pH units6.476.697.277.938.218.51
Humus%4.223.182.63
Nitrogen index (NI)%3.622.802.46
Humus reserveto/ha47.94126.2159.57
Table 4. Presentation of the soil profile horizons SP2, P816, pastures agricultural category.
Soil horizonDepth
(cm)
Properties
0–7Medium clayey loam (TT), dark gray-brown, glomerular structure
Ao7–25Medium clayey loam (TT), brown, large glomerular structure
AB25–40Medium clayey loam (TT), brown, small prismatic structure
Bvg40–55Medium clayey loam (TT), yellowish with rare rust spots (≤5%), small prismatic structure
BCg255–70Medium clayey loam (TT), slightly yellowish rust (6–15%), small prismatic structure
CBGo370–100Medium clayey loam (TT), yellowish rust (16–30%), small prismatic structure
Table 5. Values of physical, hydrophysical, and chemical parameters for the description of the soil profile SP2, pasture plot P816, Ciacova, Timiș County, Romania.
ParametersMeasurement UnitsSoil Profile Horizon
AoABBvgBCg2CBGo3
Depthcm725405570100
Coarse sand (2.0–0.2 mm)%0.30.30.50.30.30.4
Fine sand (0.2–0.02 mm)%39.139.238.435.535.535
Dust (0.02–0.002 mm)%27.527.727.328.72628.7
Colloidal clay (under 0.002 mm)%33.132.833.835.538.235.9
Physical clay (under 0.01 mm)%55.955.450.352.954.454.4
Texture TTTTTTTTTTTT
Specific density (SD)g/cm32.62.632.652.682.7
Apparent density (AD)g/cm31.441.491.541.531.52
Total porosity (TP)%44.6243.3541.8942.9143.70
Aeration porosity (AP)%10.638.936.477.578.44
Compaction degree (CD)%11.4713.9017.0715.5114.69
Hygroscopicity coefficient (HC)%7.767.697.928.328.95
Withering coefficient (WC)%11.6411.5311.8812.4813.42
Field capacity (FC)%23.623.12323.123.2
Total capacity (TC)%30.9829.0927.2028.0528.75
Useful water capacity (UWC)%11.9711.5711.1210.639.78
Hydraulic conductivity (HC)mm/h1.51.20.70.80.75
Calcium carbonates% 0.210.21
pH (H2O)pH units6.426.486.687.047.357.64
Humus%4.592.131.220.55
Nitrogen index%3.911.831.070.50
Humus reserveto/ha46.2757.1328.918.42 140.72
Table 6. Values of agrochemical soil characterization indices, pasture category (P808, P816), under the influence of pig sludge, Ciacova, Timiș County, Romania.
P808P816
TrialpHPKNITrialpHPKNI
(ppm)(%) (ppm)(%)
2013
P808-1-136.5122.20310.002.96P816-1-136.1029.00201.002.64
P808-2-136.4825.60301.002.92P816-2-136.0428.60216.002.58
P808-3-136.6921.80286.003.16P816-3-136.6334.60189.003.16
P808-4-136.7110.20230.003.17P816-4-136.1135.30176.002.65
P808-5-136.5115.50230.002.96P816-5-135.9329.90235.002.48
P808-6-136.8220.10249.003.27P816-6-135.9035.60218.002.45
P808-7-136.4410.60250.002.89P816-7-136.1037.90200.002.64
SE±0.05±2.26±12.62±0.05SE±0.09±1.41±7.44±0.08
2018
P808-1-186.4828.10315.003.40P816-1-186.5048.30320.003.21
P808-2-186.6029.40308.003.56P816-2-186.5956.60287.003.24
P808-3-186.5235.50293.003.46P816-3-186.4969.10305.003.17
P808-4-186.7432.50286.003.71P816-4-186.8048.30276.003.07
P808-5-186.4835.60300.003.40P816-5-186.5951.20311.003.10
P808-6-186.8433.20273.003.82P816-6-186.8455.60286.003.30
P808-7-186.9036.60290.003.90P816-7-186.7542.60280.003.13
SE±0.06±1.22±5.31±0.07SE±0.05±3.21±6.38±0.03
2019
P808-1-196.4845.60325.003.11P816-1-196.5248.20390.003.49
P808-2-196.5253.30336.003.16P816-2-196.5550.40372.003.59
P808-3-196.5549.60312.003.18P816-3-196.4850.60429.003.48
P808-4-196.3058.30325.002.96P816-4-196.3860.40416.003.83
P808-5-196.4869.10299.003.11P816-5-196.4158.60396.003.59
P808-6-196.5363.30349.003.16P816-6-196.6045.50389.003.87
P808-7-196.4454.50350.003.09P816-7-196.4454.50412.003.77
SE±0.031±3.04±7.07±0.02SE±0.02±2.06±7.330.06
Note: P808-1-13, P816-1-13, represents: P808 and P816—the names of the pasture plots; 1—sample 1, consisting of 20 soil sub-samples (2 to 7 other soil samples); 13—year 2013 (18 and 19 represent 2018, and 2019, respectively).
Table 7. Variation of land area of the pasture category, by NDVI classes, under the influence of pig sludge application, plot P808.
NDVI Class201320182019
Area (m2)NDVI 2013Area (m2)NDVI 2018Area (m2)NDVI 2019
C123,153.950.11894115,717.020.15501412,851.990.333843
C273,893.170.20764830,117.460.24864823,533.720.400956
C3121,440.40.27258978,506.040.30814347,126.060.453363
C4162,656.40.324222146,258.10.354927103,053.60.489111
C5161,9840.372804216,130.40.392646159,579.50.516977
C6122,351.70.421276180,715.80.427479218,380.90.541779
C724,394.340.51138422,481.090.481683125,483.20.568601
Table 8. Variation of land area of the pasture category, by NDVI classes, under the influence of pig sludge application, plot P816.
NDVI Class201320182019
Area (m2)NDVI 2013Area (m2)NDVI 2018Area (m2)NDVI 2019
C111,936.340.03516028,536.970.18212516,215.200.222648
C243,250.920.14173156,581.010.28982240,472.440.332932
C368,502.370.216512134,458.900.350527101,754.000.414478
C4120,301.900.272824128,399.000.408898156,796.700.462809
C5142,063.000.32052594,327.740.470395164,844.700.509165
C6152,217.200.365342141,099.000.528135125,760.500.545250
C777,805.430.4111732,717.550.59895710,328.020.663606
Publisher’s Note: MDPI stays neutral with regard to jurisdictional claims in published maps and institutional affiliations.