
Soil—Plant Relationships in Soybean Cultivated under Conventional Tillage and Long-Term No-Tillage

 ,
,  ,
,  ,
,  and
and 
Abstract
1. Introduction
2. Materials and Methods
2.1. Site Description
2.2. History and Experimental Design
2.3. Management and Analysis in Soybean Plant
2.3.1. Physiological Traits
2.3.2. Root Development
2.3.3. Yield Components
2.3.4. Yield
2.4. Soil Analysis
2.4.1. Soil Water Storage
2.4.2. Soil Physical Properties
2.4.3. Infiltration and Rate of Water Infiltration into the Soil
2.5. Data Analysis
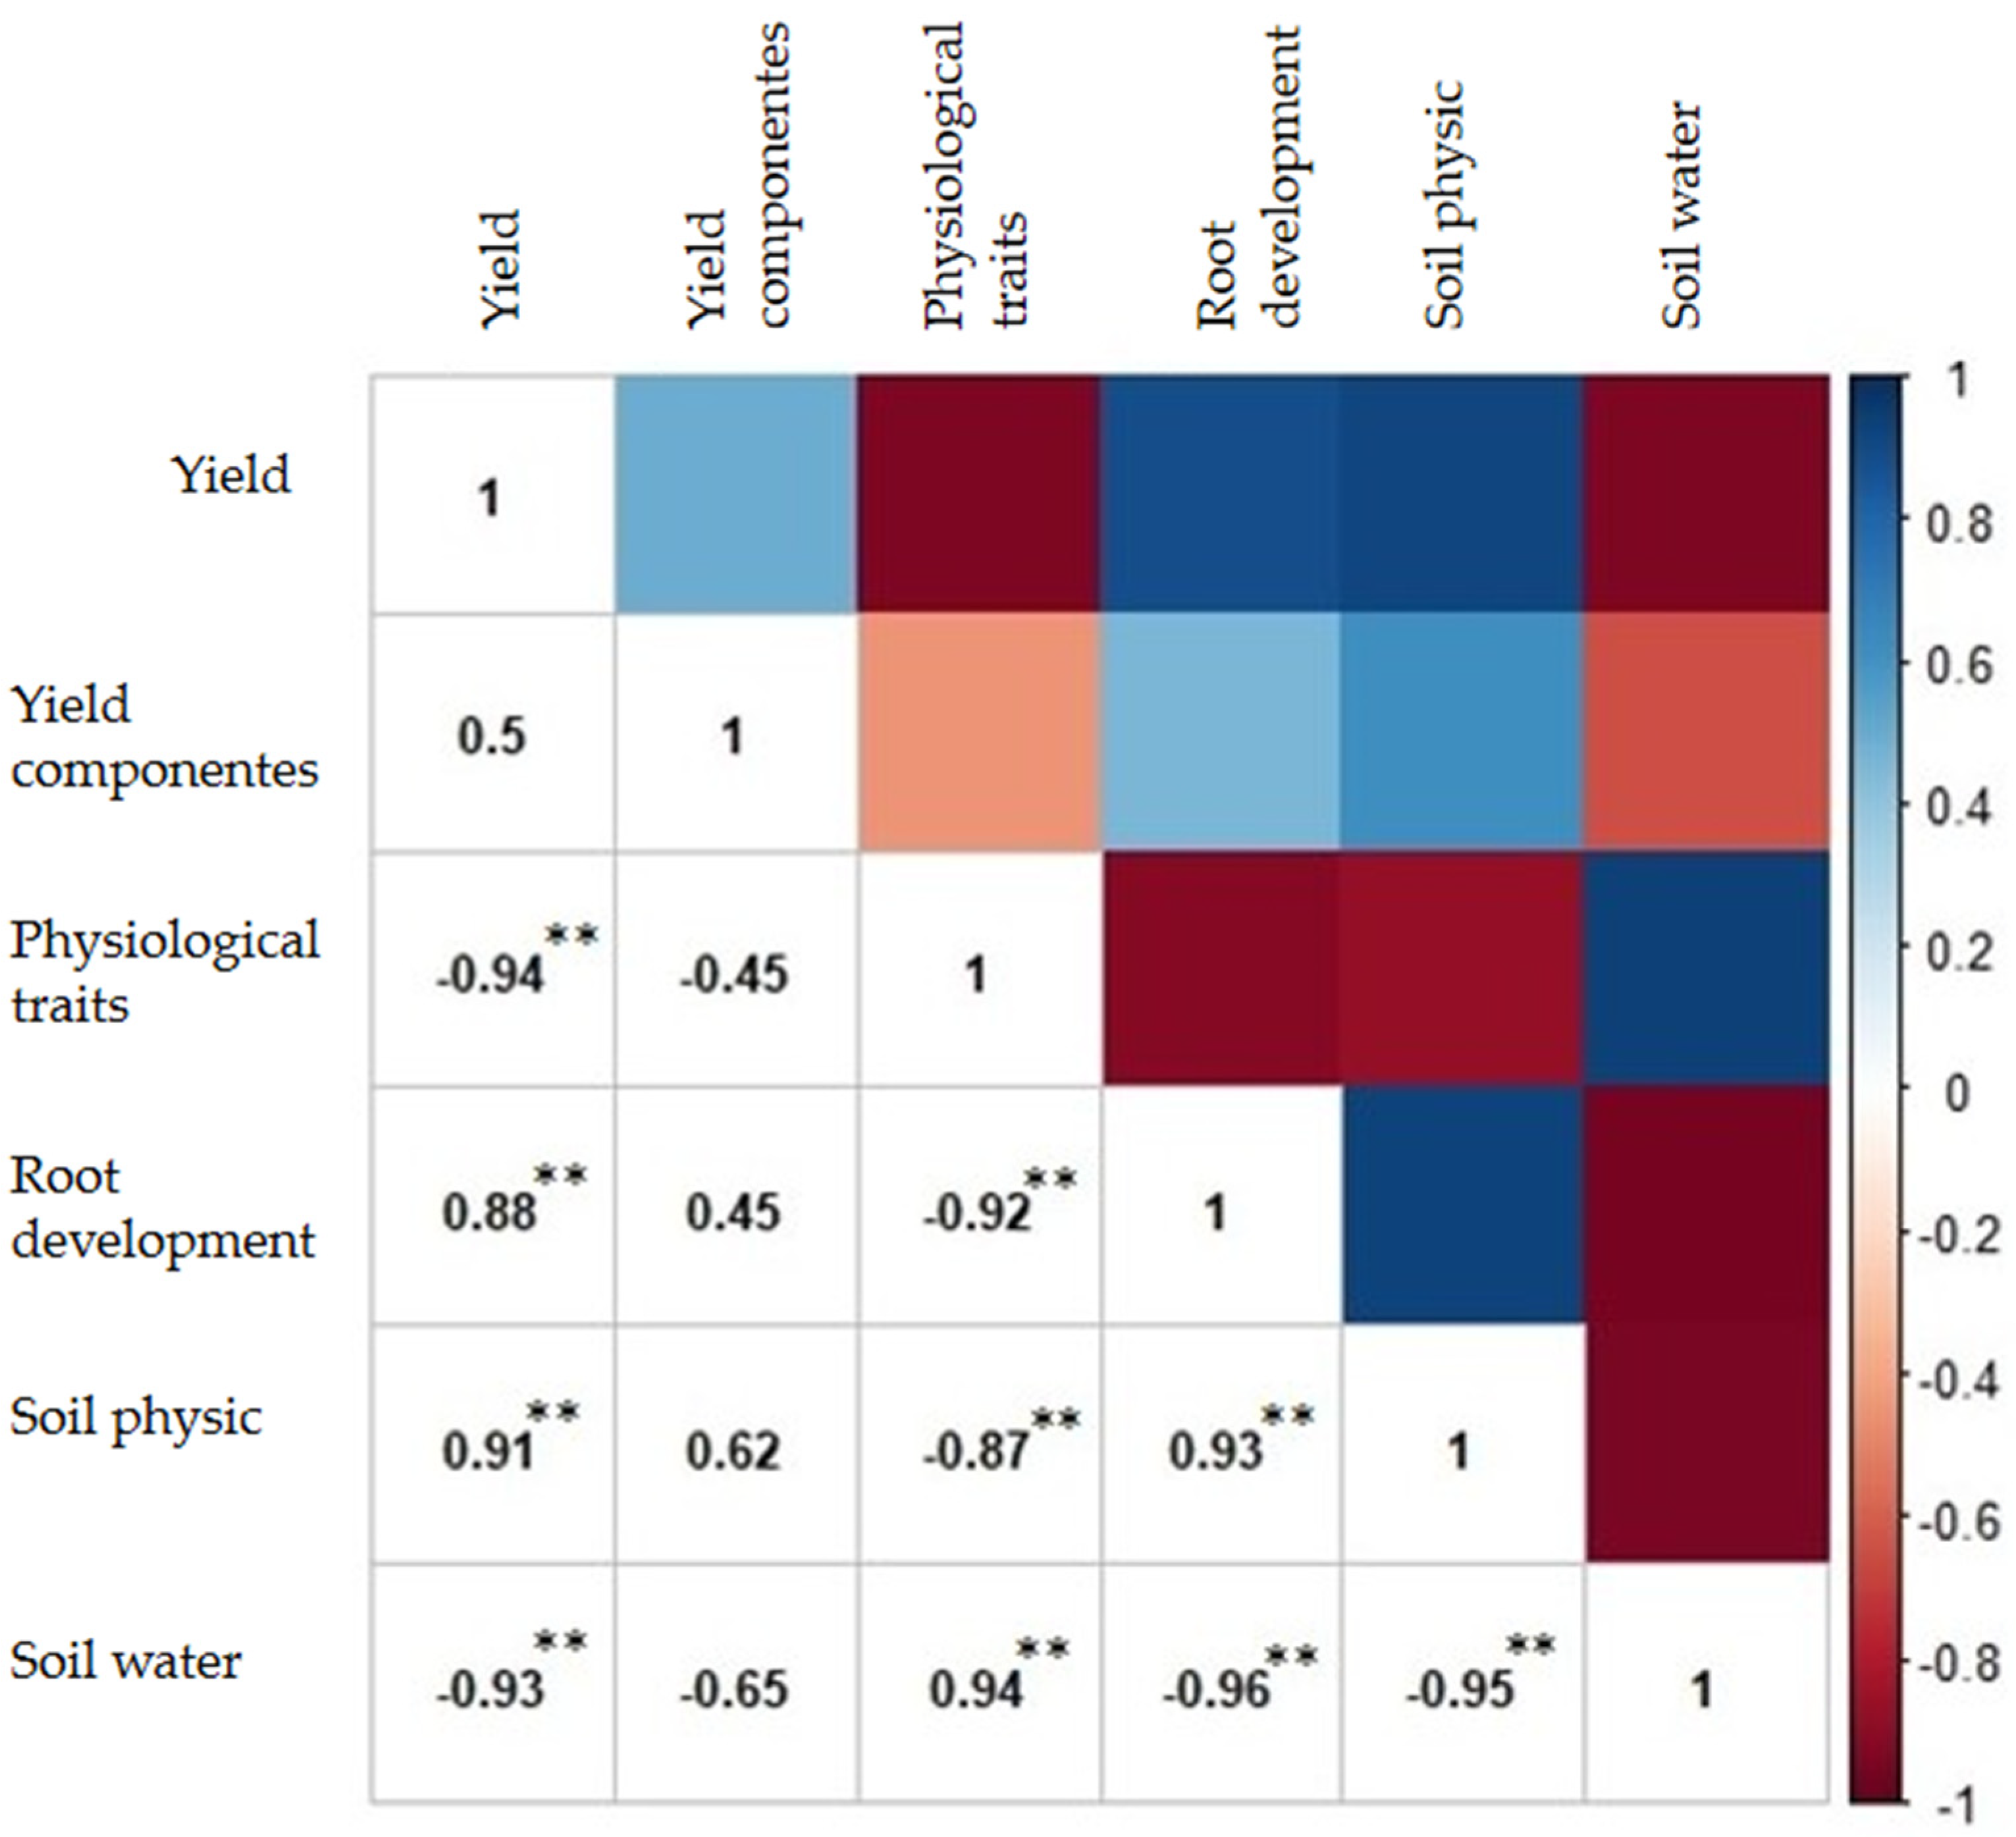
3. Results
4. Discussion
5. Conclusions
Author Contributions
Funding
Institutional Review Board Statement
Informed Consent Statement
Data Availability Statement
Acknowledgments
Conflicts of Interest
References
- Blanco-Canqui, H.; Ruis, S.J. No-tillage and soil physical environment. Geoderma 2018, 326, 164–200. [Google Scholar] [CrossRef]
- Reichert, J.M.; Rosa, V.T.; Vogelmann, E.S.; Rosa, D.P.; Horn, R.; Reinert, D.J.; Sattler, A.; Denardin, J.E. Conceptual framework for capacity and intensity physical soil properties affected by short and long-term (14 years) continuous no-tillage and controlled traffic. Soil Tillage Res. 2016, 158, 123–136. [Google Scholar] [CrossRef]
- Castellini, M.; Fornaro, F.; Garofalo, P.; Giglio, L.; Rinaldi, M.; Ventrella, D.; Vitti, C.; Vonella, A. Effects of no-tillage and conventional tillage on physical and hydraulic properties of fine textured soils under winter wheat. Water 2019, 11, 484. [Google Scholar] [CrossRef]
- Deuschle, D.; Minella, J.P.G.; Hörbe, T.d.A.N.; Londero, A.L.; Schneider, F.J.A. Erosion and hydrological response in no-tillage subjected to crop rotation intensification in southern Brazil. Geoderma 2019, 340, 157–163. [Google Scholar] [CrossRef]
- Ferreira, C.J.B.; Tormena, C.A.; Severiano, E.D.C.; Zotarelli, L.; Betioli Júnior, E. Soil compaction influences soil physical quality and soybean yield under long-term no-tillage. Arch. Agron. Soil Sci. 2021, 67, 383–396. [Google Scholar] [CrossRef]
- Galdos, M.V.; Pires, L.F.; Cooper, H.V.; Calonego, J.C.; Rosolem, C.A.; Mooney, S.J. Assessing the long-term effects of zero-tillage on the macroporosity of Brazilian soils using X-ray Computed Tomography. Geoderma 2019, 337, 1126–1135. [Google Scholar] [CrossRef]
- Patrignani, A.; Godsey, C.B.; Ochsner, T.E.; Edwards, J.T. Soil water dynamics of conventional and no-till wheat in the southern great plains. Soil Sci. Soc. Am. J. 2012, 76, 1768–1775. [Google Scholar] [CrossRef]
- Yang, X.; Zheng, L.; Yang, Q.; Wang, Z.; Cui, S.; Shen, Y. Modelling the effects of conservation tillage on crop water productivity, soil water dynamics and evapotranspiration of a maize-winter wheat-soybean rotation system on the Loess Plateau of China using APSIM. Agric. Syst. 2018, 166, 111–123. [Google Scholar] [CrossRef]
- Fiorini, A.; Boselli, R.; Amaducci, S.; Tabaglio, V. Effects of no-till on root architecture and root-soil interactions in a three-year crop rotation. Eur. J. Agron. 2018, 99, 156–166. [Google Scholar] [CrossRef]
- Sivarajan, S.; Maharlooei, M.; Bajwa, S.G.; Nowatzki, J. Impact of soil compaction due to wheel traffic on corn and soybean growth, development and yield. Soil Tillage Res. 2018, 175, 234–243. [Google Scholar] [CrossRef]
- Haruna, S.I.; Anderson, S.H.; Nkongolo, N.V.; Zaibon, S. Soil hydraulic properties: Influence of tillage and cover crops. Pedosphere 2018, 28, 430–442. [Google Scholar] [CrossRef]
- Hubert, F.; Hallaire, V.; Sardini, P.; Caner, L.; Heddadj, D. Pore morphology changes under tillage and no-tillage practices. Geoderma 2007, 142, 226–236. [Google Scholar] [CrossRef]
- Osunbitan, J.A.; Oyedele, D.J.; Adekalu, K.O. Tillage effects on bulk density, hydraulic conductivity and strength of a loamy sand soil in southwestern Nigeria. Soil Tillage Res. 2005, 82, 57–64. [Google Scholar] [CrossRef]
- Nouri, A.; Yoder, D.C.; Raji, M.; Ceylan, S.; Jagadamma, S.; Lee, J.; Walker, F.R.; Yin, X.; Fitzpatrick, J.; Trexler, B.; et al. Conservation agriculture increases the soil resilience and cotton yield stability in climate extremes of the southeast US. Commun. Earth Environ. 2021, 2, 155. [Google Scholar] [CrossRef]
- Abdallah, N.A.; Moses, V.; Prakash, C. The impact of possible climate changes on developing countries: The needs for plants tolerant to abiotic stresses. GM Crops Food 2014, 5, 77–80. [Google Scholar] [CrossRef] [PubMed][Green Version]
- Takahashi, S.; Badger, M.R. Photoprotection in plants: A new light on photosystem II damage. Trends Plant Sci. 2011, 16, 53–60. [Google Scholar] [CrossRef]
- Levitt, J. Responses of Plants to Environmental Stress, 2nd ed.; Academic Press: Orlando, FL, USA, 1980. [Google Scholar]
- Salehi-Lisar, S.Y.; Bakhshayeshan-Agdam, H. Drought stress in plants: Causes, consequences, and tolerance. In Drought Stress Tolerance in Plants, Vol. 1; Hossain, M.A.H., Wani, S.H., Bhattachajee, S., Burritt, D.J., Tran, L.-S.P., Eds.; Springer International Publishing: Cham, Switzerland, 2016; pp. 1–16. [Google Scholar]
- Freitas, R.M.O.; Dombroski, J.L.D.; Freitas, F.C.L.; Nogueira, N.W.; Pinto, J.R.D.S. Physiological responses of cowpea under water stress and rewatering in no-tillage and conventional tillage systems. Rev. Caatinga 2017, 30, 559–567. [Google Scholar] [CrossRef]
- Abrahão, G.M.; Costa, M.H. Evolution of rain and photoperiod limitations on the soybean growing season in Brazil: The rise (and possible fall) of double-cropping systems. Agric. For. Meteorol. 2018, 256–257, 32–45. [Google Scholar] [CrossRef]
- Soil Survey Staff. Keys to Soil Taxonomy, 12th ed.; USDA-Natural Resources Conservation Service: Washington, DC, USA, 2014; Volume 12.
- Raij, B.V.; Andrade, J.C.; Cantarella, H.; Quaggio, J.A. Análise Química Para Avaliação da Fertilidade de Solos Tropicais; IAC: Campinas, Brazil, 2001. [Google Scholar]
- EMBRAPA. Manual de Métodos de Análise de Solo, 3rd ed.; Teixeira, P.C., Donagemma, G.K., Fontana, A., Teixeira, W.G.T., Eds.; Embrapa: Brasílis, Brazil, 2017. [Google Scholar]
- Escobedo, J.F.; Gomes, E.N.; Oliveira, A.P.; Soares, J. Modeling hourly and daily fractions of UV, PAR and NIR to global solar radiation under various sky conditions at Botucatu, Brazil. Appl. Energy 2009, 86, 299–309. [Google Scholar] [CrossRef]
- Malavolta, E.; Vitti, G.C.; Oliveira, S.A. Avaliação do Estado Nutricional das Plantas: Princípios e Aplicações, 2nd ed.; Potafos: Piracicaba, Brazil, 1997. [Google Scholar]
- Watson, D.J. Comparative physiological studies on the growth of field crops: I. variation in net assimilation rate and leaf area between species and varieties, and within and between years. Ann. Bot. 1947, 11, 41–76. [Google Scholar] [CrossRef]
- Watson, D.J. Comparative physiological studies on the growth of field crops: Ii. the effect of varying nutrient supply on net assimilation rate and leaf area. Ann. Bot. 1947, 11, 375–407. [Google Scholar] [CrossRef]
- Jamaux, I.; Steinmetz, A.; Belhassen, E. Looking for molecular and physiological markers of osmotic adjustment in sunflower. New Phytol. 1997, 137, 117–127. [Google Scholar] [CrossRef]
- Brasil. Regras Para Análise de Sementes; Ministério da Agricultura, Pecuária e Abastecimento: Brasília, DF, Brasil, 2009.
- Blake, G.R.; Hartge, K.H. Bulk Density. In Methods of Soil Analysis: Physical and Mineralogical Methods; Klute, A., Ed.; America Society of Agronomy: Madison, WI, USA, 1986; pp. 363–375. [Google Scholar]
- Smith, K.A.; Mullins, C.E. Soil Analysis: Physical Methods; Marcel Dekker: New York, NY, USA, 1991. [Google Scholar]
- Reeve, M.J.; Carter, A.D. Water release characteristic. In Soil Analysis: Physical Methods; Smith, K.A., Mullins, C.E., Eds.; Marcel Dekker: New York, NY, USA, 1991; pp. 111–160. [Google Scholar]
- Bernardo, S.; Mantovani, E.C.; Da Silva, D.D.; Soares, A.A. Manual de Irrigação, 9th ed.; UFV: Viçosa, Brazil, 2019. [Google Scholar]
- Hair, J.F., Jr.; Black, W.C.; Babin, B.J.; Anderson, R.E.; Tatham, R.L. Análise Multivariada de Dados, 6th ed.; Bookman: Porto Alegre, Brazil, 2009. [Google Scholar]
- Rębilas, K.; Klimek-Kopyra, A.; Bacior, M.; Zając, T. A model for the yield losses estimation in an early soybean (Glycine max (L.) Merr.) cultivar depending on the cutting height at harvest. Field Crop. Res. 2020, 254, 107846. [Google Scholar] [CrossRef]
- Klimek-Kopyra, A.; Zaja¸c, T.; Re¸bilas, K. A mathematical model for the evaluation of cooperation and competition effects in intercrops. Eur. J. Agron. 2013, 51, 9–17. [Google Scholar] [CrossRef]
- Peixoto, D.S.; da Silva, L.D.; de Melo, L.B.; Azevedo, R.P.; Araújo, B.C.; de Carvalho, T.S.; Moreira, S.G.; Curi, N.; Silva, B.M. Occasional tillage in no-tillage systems: A global meta-analysis. Sci. Total Environ. 2020, 745, 140887. [Google Scholar] [CrossRef] [PubMed]
- Taiz, L.; Zeiger, E. Fisiologia e Desenvolvimento Vegetal, 6th ed.; Artmed: Porto Alegre, Brazil, 2017. [Google Scholar]
- Henry, C.; John, G.P.; Pan, R.; Bartlett, M.K.; Fletcher, L.R.; Scoffoni, C.; Sack, L. A stomatal safety-efficiency trade-off constrains responses to leaf dehydration. Nat. Commun. 2019, 10, 3398. [Google Scholar] [CrossRef] [PubMed]
- Rosa, V.d.R.; dos Santos, A.L.F.; da Silva, A.A.; Sab, M.P.V.; Germino, G.H.; Cardoso, F.B.; de Almeida Silva, M. Increased soybean tolerance to water deficiency through biostimulant based on fulvic acids and Ascophyllum nodosum (L.) seaweed extract. Plant Physiol. Biochem. 2021, 158, 228–243. [Google Scholar] [CrossRef]
- Keller, T.; Sandin, M.; Colombi, T.; Horn, R.; Or, D. Historical increase in agricultural machinery weights enhanced soil stress levels and adversely affected soil functioning. Soil Tillage Res. 2019, 194, 104293. [Google Scholar] [CrossRef]
- Basche, A.D.; Delonge, M.S. Comparing infiltration rates in soils managed with conventional and alternative farming methods: A meta-analysis. PLoS ONE 2019, 14, e0215702. [Google Scholar] [CrossRef]
- de Andrad Bonetti, J.; Anghinoni, I.; de Moraes, M.T.; Fink, J.R. Resilience of soils with different texture, mineralogy and organic matter under long-term conservation systems. Soil Tillage Res. 2017, 174, 104–112. [Google Scholar] [CrossRef]


| Management System | pH | P | S | H + Al | Ca | Mg | K | Sand | Silt | Clay |
|---|---|---|---|---|---|---|---|---|---|---|
| CaCl2 | mg dm−3 | mmolc dm−3 | g kg−1 | |||||||
| CT | 5.0 | 61.2 | 3.6 | 36.3 | 39.5 | 12.7 | 4.7 | 147 | 239 | 614 |
| NT | 5.4 | 84.4 | 4.4 | 29.6 | 43.5 | 14.8 | 3.3 | |||
| Year | Management System | Season Fall-Winter/Spring-Summer | |||
|---|---|---|---|---|---|
| Conventional Tillage | No-Tillage | ||||
| Fall | Spring | Fall | Spring | ||
| 1985/86 | Plowing + harrowing | Plowing + harrowing | Plowing + harrowing | No-tillage | Wheat/soybean |
| 1986/87 to 1994/95 | Plowing + harrowing | Plowing + harrowing | No-tillage | No-tillage | Wheat/soybean |
| 1995/96 to 1998/99 | Without soil mobilization | Without soil mobilization | No-tillage | No-tillage | Fallow/fallow |
| 1999/00 | Plowing + harrowing | Plowing + harrowing | No-tillage | No-tillage | Black oat/maize |
| 2000/01 and 2001/02 | Without soil mobilization | Without soil mobilization | No-tillage | No-tillage | Fallow/fallow |
| 2002/03 and 2003/04 | Plowing + harrowing | Plowing + harrowing | No-tillage | No-tillage | Black oat/millet-bean |
| 2004/05 and 2005/06 | Plowing + harrowing | Plowing + harrowing | No-tillage | No-tillage | Black oat/maize |
| 2006/07 | Without soil mobilization | Without soil mobilization | No-tillage | No-tillage | Fallow/soybean |
| 2007/08 | Plowing + harrowing | Without soil mobilization | No-tillage | No-tillage | Yellow oat/bean |
| 2008/09 | Plowing + harrowing | Without soil mobilization | No-tillage | No-tillage | Yellow oat/bean |
| 2009/10 and 2011/12 | Plowing + harrowing | Without soil mobilization | No-tillage | No-tillage | Black oat/maize + brachiaria |
| 2012/13 | Without soil mobilization | Plowing + harrowing | No-tillage | No-tillage | Brachiaria/soybean |
| 2013/14 | Without soil mobilization | Plowing + harrowing | No-tillage | No-tillage | Wheat/soybean |
| 2014/15 | Without soil mobilization | Plowing + harrowing | No-tillage | No-tillage | Safflower/soybean |
| 2015/16 | Without soil mobilization | Plowing + harrowing | No-tillage | No-tillage | Safflower/maize |
| 2016/17 | Plowing + harrowing | Without soil mobilization | No-tillage | No-tillage | Black oat/maize |
| 2017/18 | Plowing + harrowing | Without soil mobilization | No-tillage | No-tillage | Black oat/soybean |
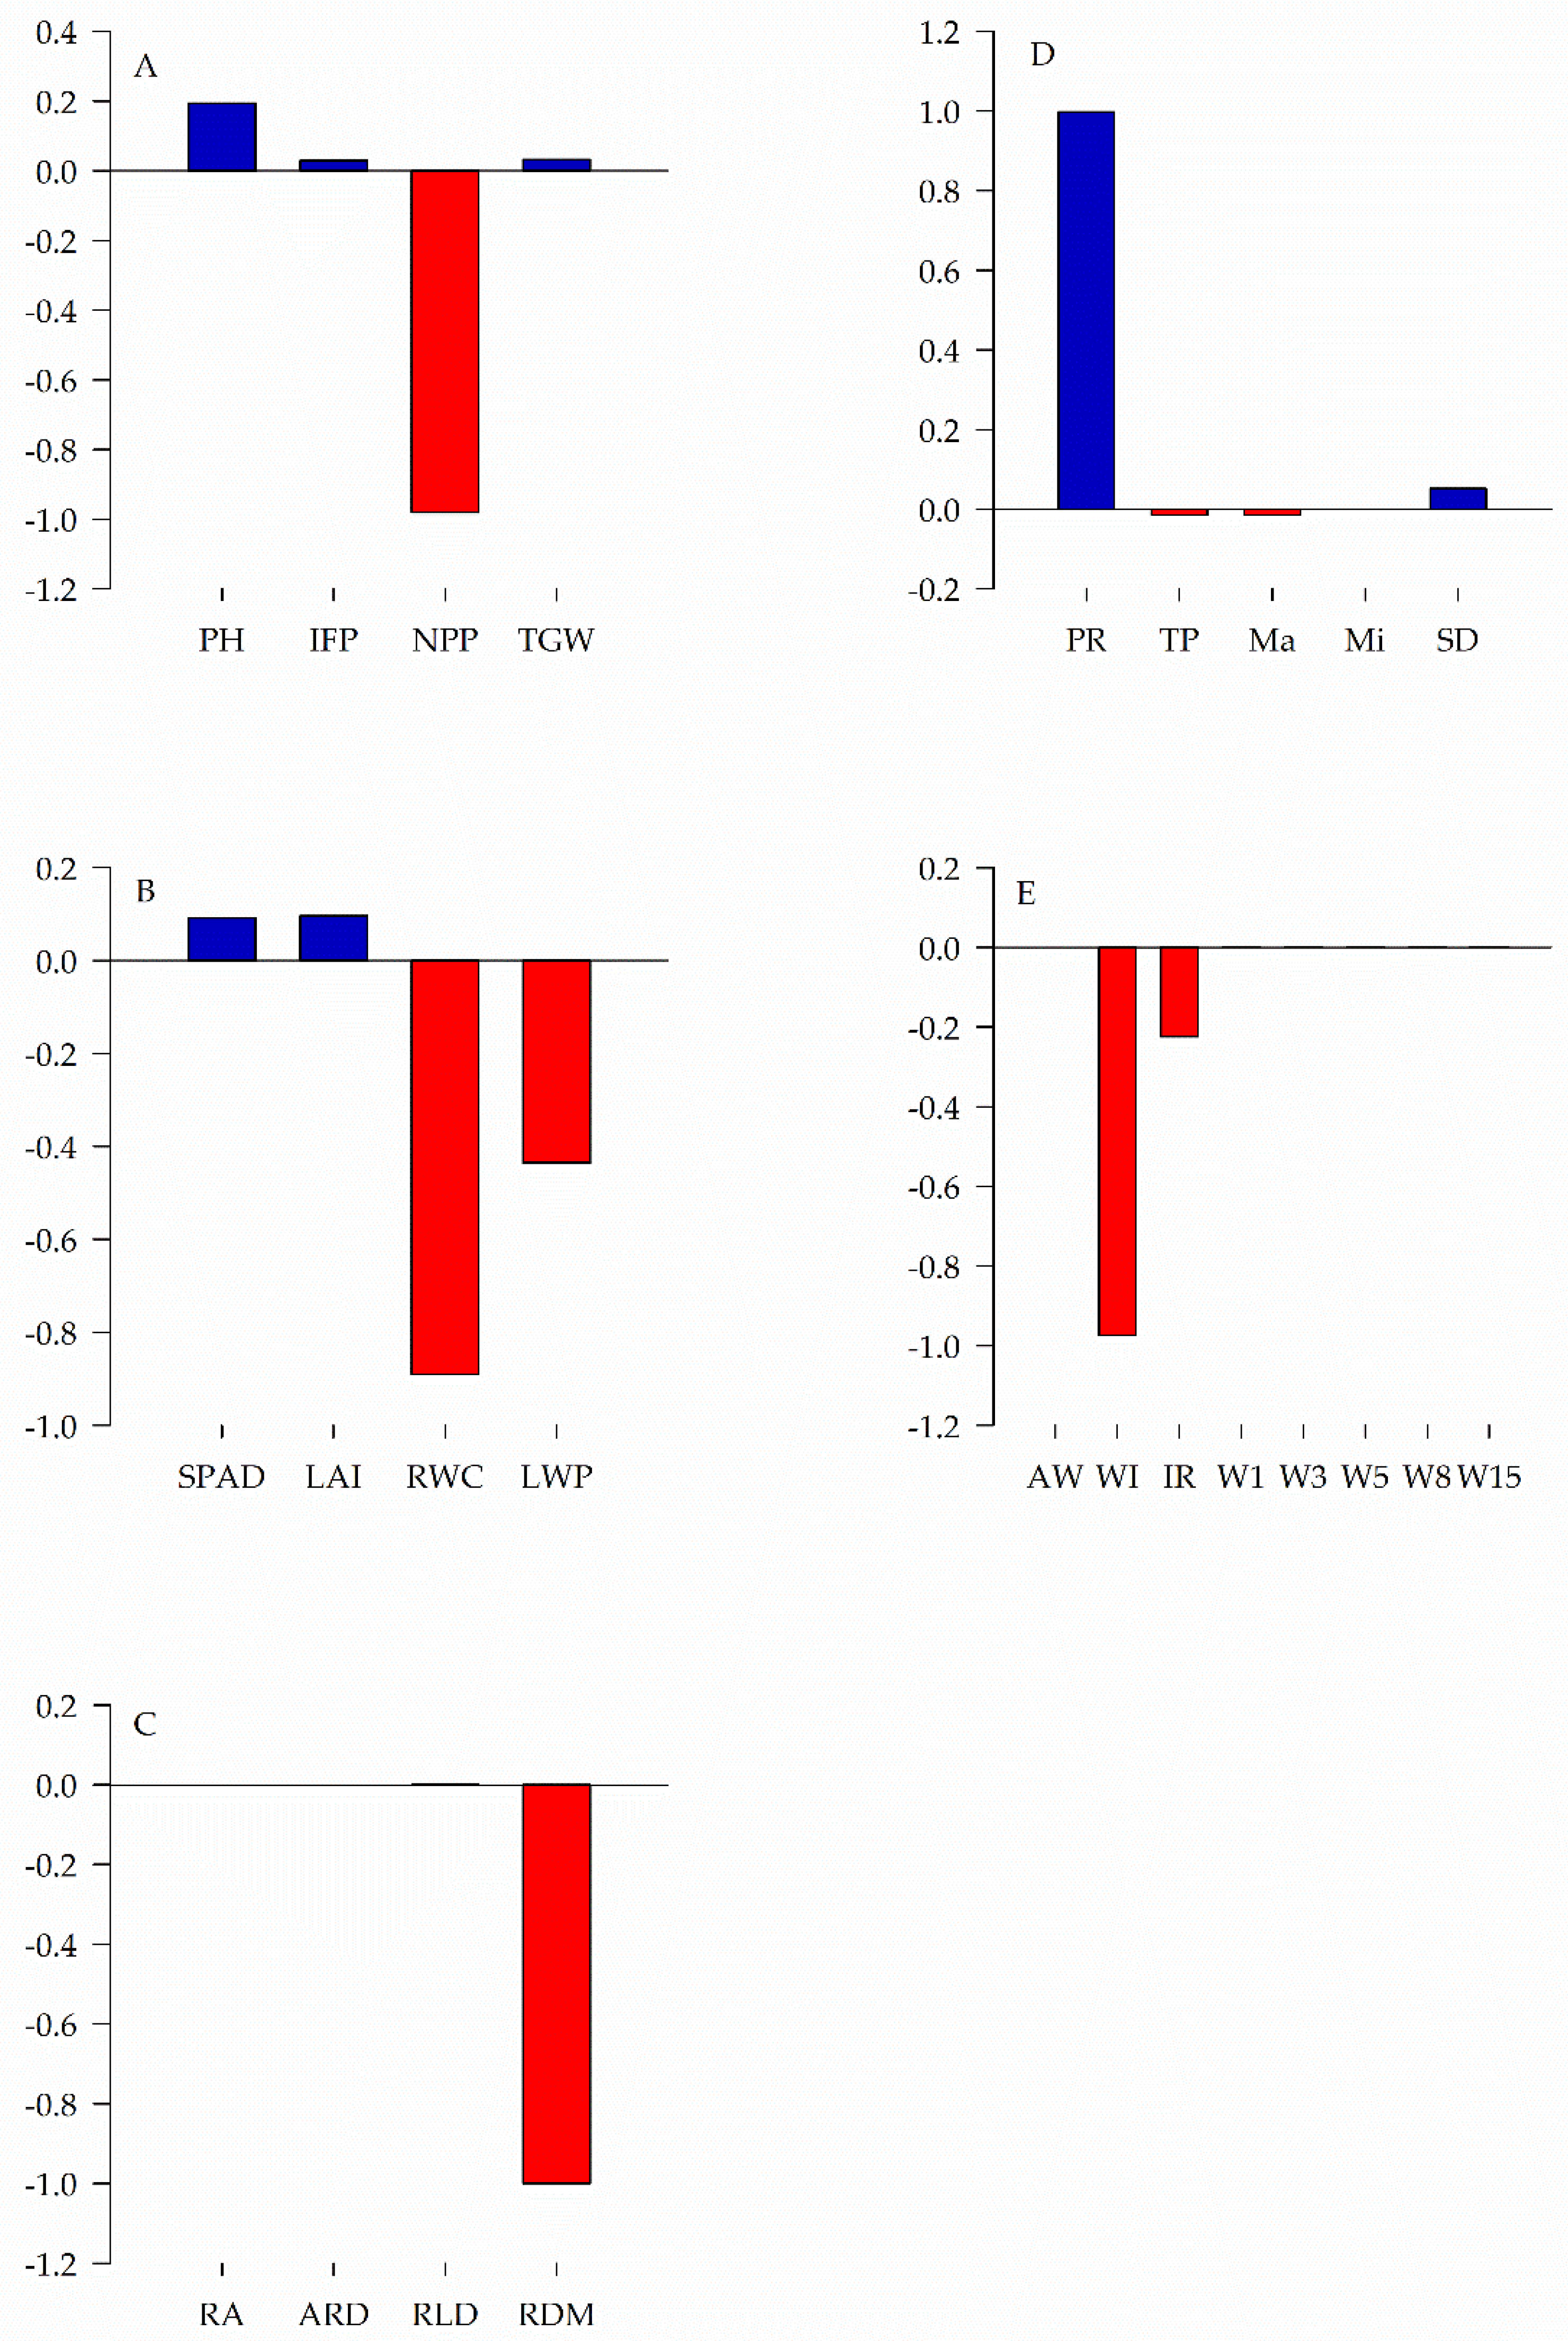
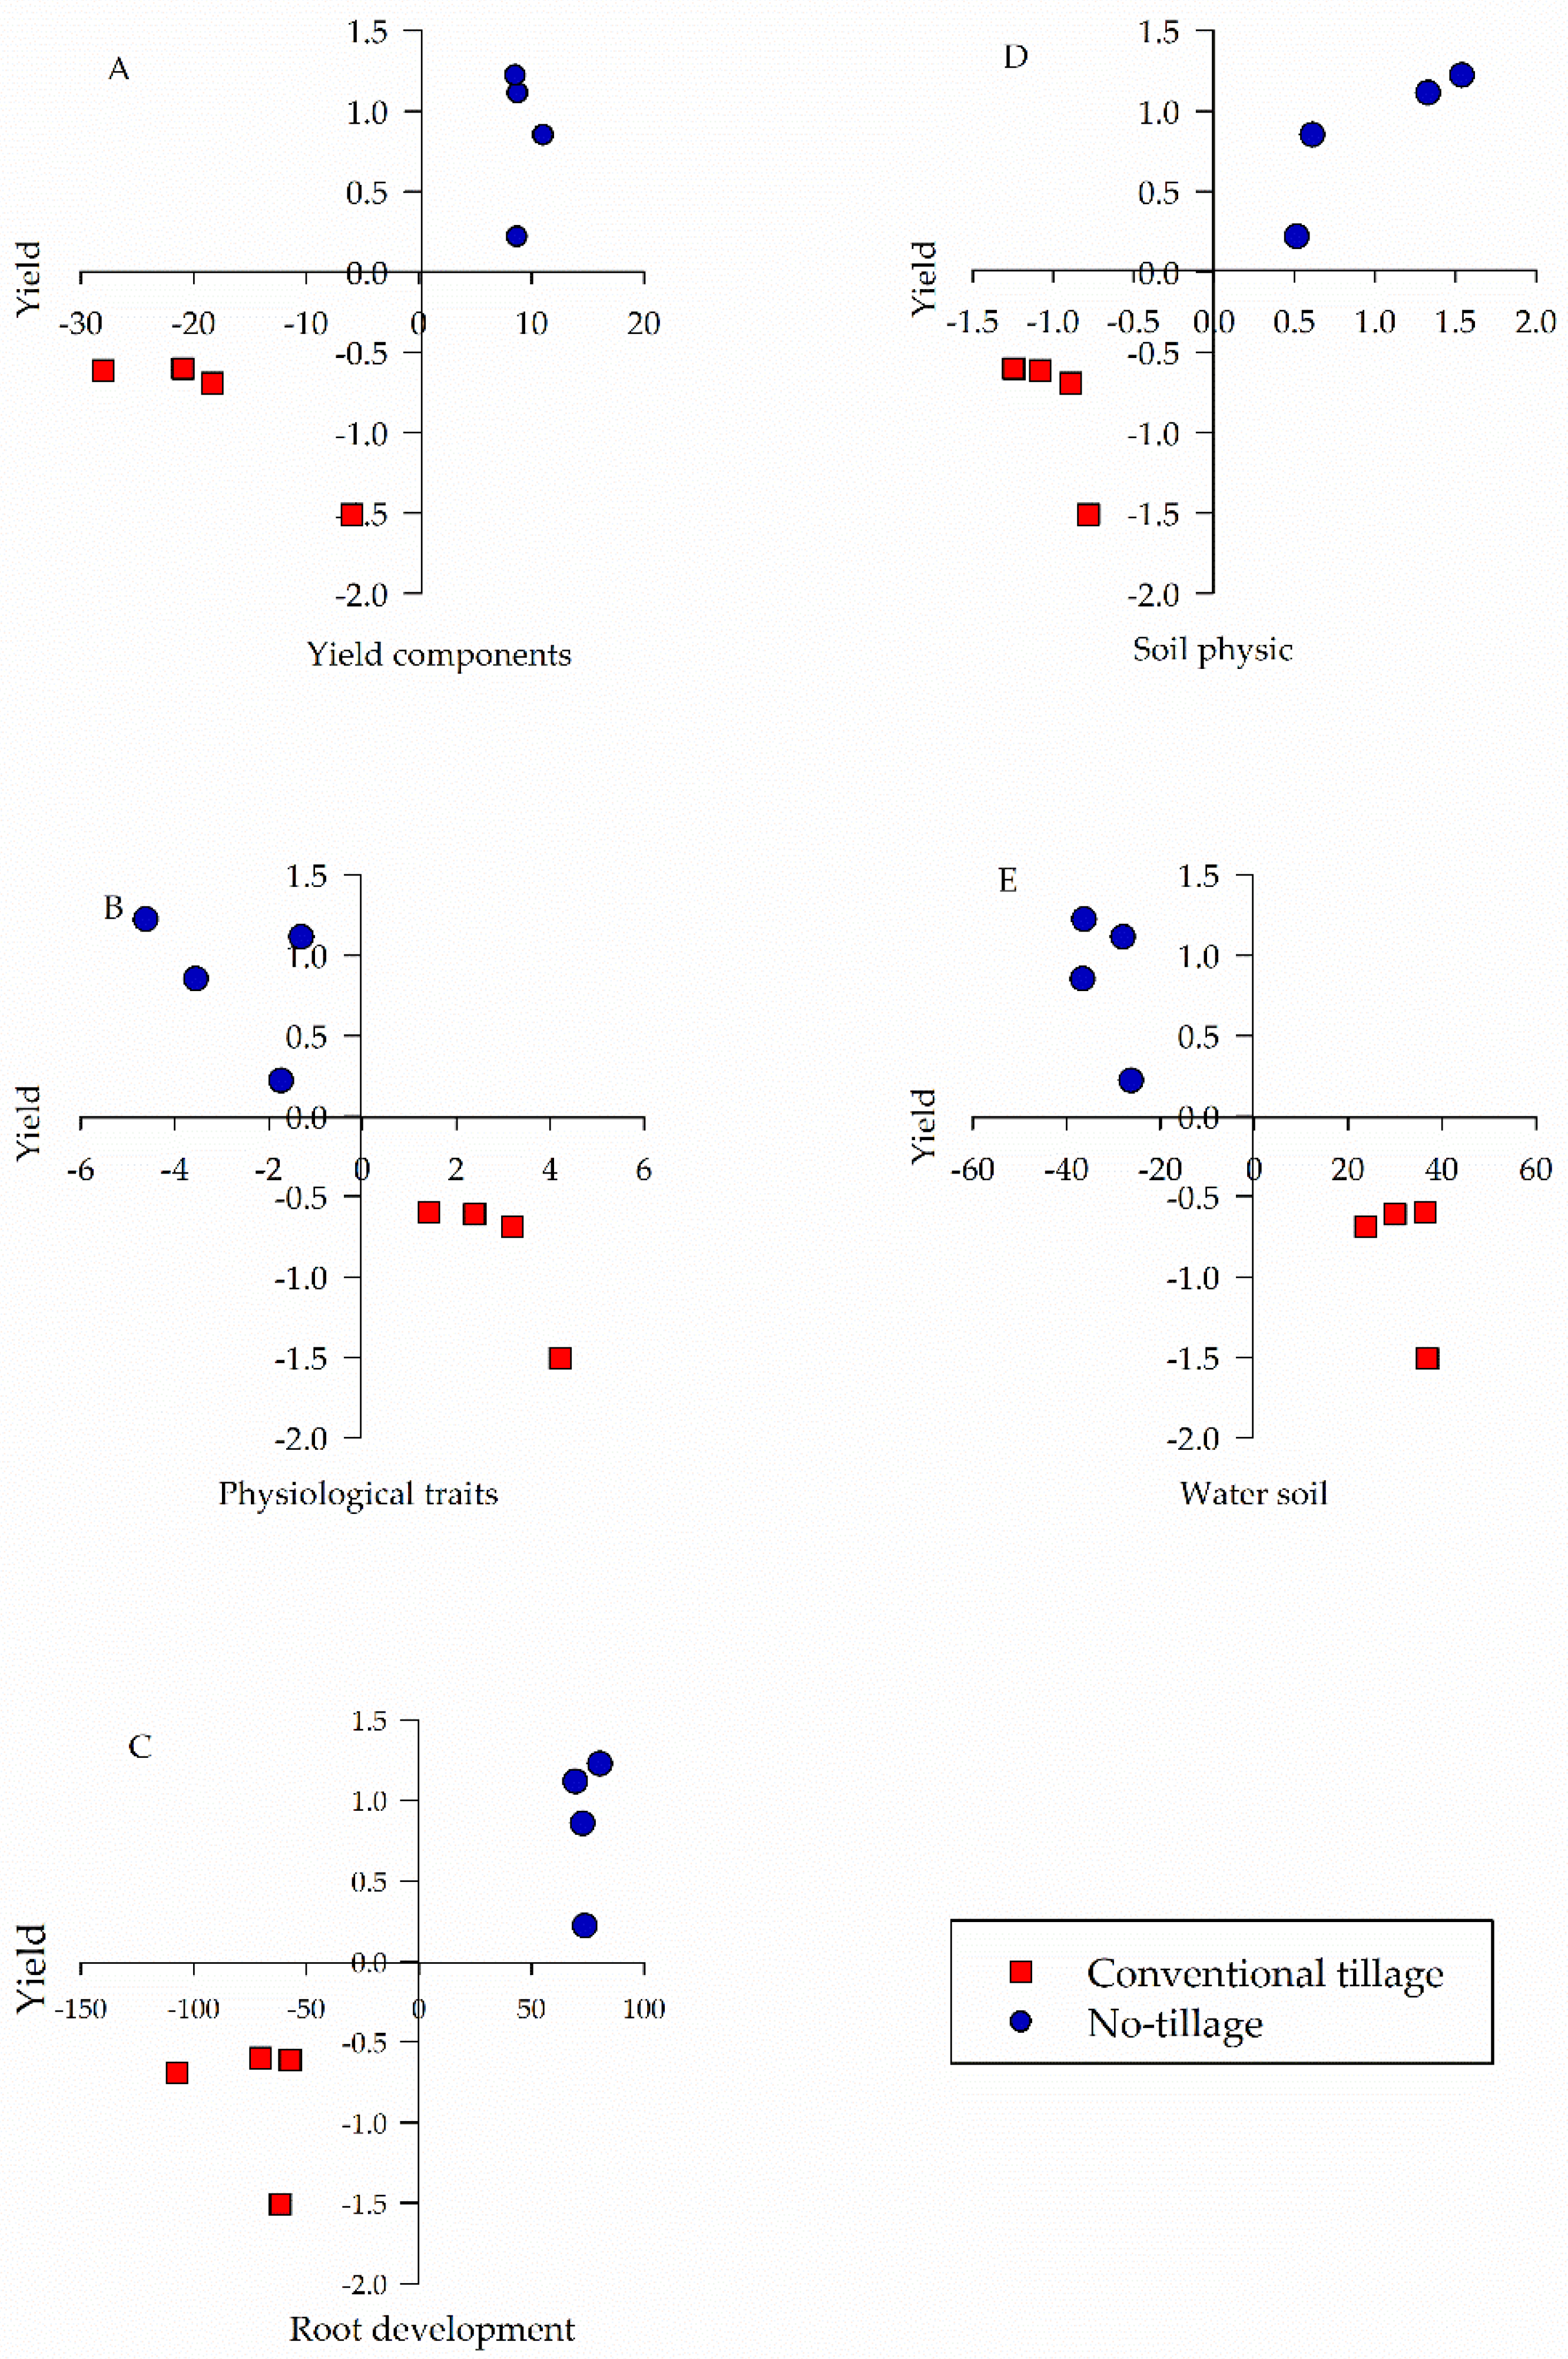
| Group of Variables | Explanation Percentage (%) |
|---|---|
| Yield components | 97.11 |
| Physiological traits | 88.71 |
| Root development | 99.99 |
| Soil physics | 99.71 |
| Soil water | 98.48 |
Publisher’s Note: MDPI stays neutral with regard to jurisdictional claims in published maps and institutional affiliations. |
© 2022 by the authors. Licensee MDPI, Basel, Switzerland. This article is an open access article distributed under the terms and conditions of the Creative Commons Attribution (CC BY) license (https://creativecommons.org/licenses/by/4.0/).
Share and Cite
da Silva, G.F.; Calonego, J.C.; Luperini, B.C.O.; Chamma, L.; Alves, E.R.; Rodrigues, S.A.; Putti, F.F.; da Silva, V.M.; de Almeida Silva, M. Soil—Plant Relationships in Soybean Cultivated under Conventional Tillage and Long-Term No-Tillage. Agronomy 2022, 12, 697. https://doi.org/10.3390/agronomy12030697
da Silva GF, Calonego JC, Luperini BCO, Chamma L, Alves ER, Rodrigues SA, Putti FF, da Silva VM, de Almeida Silva M. Soil—Plant Relationships in Soybean Cultivated under Conventional Tillage and Long-Term No-Tillage. Agronomy. 2022; 12(3):697. https://doi.org/10.3390/agronomy12030697
Chicago/Turabian Styleda Silva, Gustavo Ferreira, Juliano Carlos Calonego, Bruno Cesar Ottoboni Luperini, Larissa Chamma, Erilene Romeiro Alves, Sérgio Augusto Rodrigues, Fernando Ferrari Putti, Vicente Mota da Silva, and Marcelo de Almeida Silva. 2022. "Soil—Plant Relationships in Soybean Cultivated under Conventional Tillage and Long-Term No-Tillage" Agronomy 12, no. 3: 697. https://doi.org/10.3390/agronomy12030697
APA Styleda Silva, G. F., Calonego, J. C., Luperini, B. C. O., Chamma, L., Alves, E. R., Rodrigues, S. A., Putti, F. F., da Silva, V. M., & de Almeida Silva, M. (2022). Soil—Plant Relationships in Soybean Cultivated under Conventional Tillage and Long-Term No-Tillage. Agronomy, 12(3), 697. https://doi.org/10.3390/agronomy12030697