Article

Examination of the Effectiveness of Controlled Release Fertilizer to Balance Sugarcane Yield and Reduce Nitrate Leaching to Groundwater

by
R. H. K. Rathnappriya
1,*,
Kazuhito Sakai
1,2,*,
Ken Okamoto
3,
Sho Kimura
1,2,
Tomokazu Haraguchi
1,4,
Tamotsu Nakandakari
1,2,
Hideki Setouchi
1,2 and
W. B. M. A. C. Bandara
1
1
United Graduate School of Agricultural Sciences, Kagoshima University, 1-21-24 Korimoto, Kagoshima-shi 890-0065, Kagoshima, Japan
2
Faculty of Agriculture, University of the Ryukyus, 1 Senbaru, Nishihara-cho 903-0213, Okinawa, Japan
3
Tropical Agriculture Research Front, Japan International Research Center for Agricultural Sciences, 1091-1 Maezato-Kawarabaru, Ishigaki 907-0002, Okinawa, Japan
4
Faculty of Agriculture, Saga University, 1 Honjo-machi, Saga 840-8502, Saga-Ken, Japan
*
Authors to whom correspondence should be addressed.
Agronomy 2022, 12(3), 695; https://doi.org/10.3390/agronomy12030695
Submission received: 11 January 2022 / Revised: 7 March 2022 / Accepted: 11 March 2022 / Published: 13 March 2022

Abstract

:
Groundwater pollution by nitrate leaching from sugarcane fields in Okinawa is recognized as a critical issue. Controlled release fertilizer (CRF) has the potential to reduce N leaching from cropping systems. The study focused on confirming the effectiveness of CRF at balancing sugarcane yield and reducing nitrate leaching from sugarcane fields via a water footprint (WF) approach. A lysimeter study was conducted using four treatments: (i) bare land, (ii) P and K fertilization without N, (iii) urea fertilization, and (iv) CRF application. According to the results, for both plant cane and ratoon, the total sugarcane dry weight obtained for CRF was higher compared to urea application. The cumulative nitrate-N leaching of the plant cane season for all treatments was higher than of the ratoon season. For the total crop cycle (plant cane plus ratoon), heavier nitrate-N leaching was observed in the urea-applied condition than in the CRF-applied condition. For both crop seasons, the total sugarcane WF of the CRF application (plant cane: 192.33 m3/t, ratoon: 190.47 m3/t) was lower than that of the urea application (plant cane: 233.47 m3/t, ratoon: 237.59 m3/t). WF values indicated that the CRF application had a lower impact on the groundwater of the area.

1. Introduction

The efficiency of nitrogen (N) fertilizer use in sugarcane fields is recorded as considerably low, as about 40–60% of applied N fertilizer (urea) is lost from soil via denitrification, volatilization, leaching, and runoff [1]. This condition is of great concern in tropical and subtropical regions where rainfall is higher than 1200 mm/year [2]. The accumulation of nitrates in higher concentrations in both ground and surface water bodies causes water quality deterioration, leading to many health and environmental concerns [3].
Nitrates, which could be originated from manures, decaying of organic matter, or from fertilizers, is the primary form of N leached from the soil [4]. Nitrates do not retain soil particles very well because both nitrate ions and soil particles are negatively charged [5]. Hence, nitrates are very mobile in the soil solution and are readily moved downward with water when soil water content exceeds the water holding capacity of that soil [6]. Nitrate movement in soil is influenced by factors affecting soil moisture content such as rainfall, irrigation, and evapotranspiration, as well as the soil properties [7]. For instance, frequent nitrate losses from soils can occur in areas that have sandy or coarse-textured soils which receive heavy rainfall and have excessive irrigation [8].
N availability in soils is regulated by the N cycle which consists of the processes of: N fixation, mineralization, nitrification, denitrification, volatilization, and immobilization [9]. N fixation is the process by which atmospheric N2 is transformed to reactive nitrogen compounds (such as NO, NO2, and NH3) via natural processes (i.e., lightning and microbial N fixation by nonsymbiotic and symbiotic bacteria) or industrial process (i.e., fertilizer production and fossil fuel combustion) [10]. During the process of mineralization, soil microorganisms convert organic N from manure and crop residues and organic matter to ammonium under favorable conditions of soil temperature and moisture [9]. Mineralization takes place in two processes: aminization (process by which bacteria decompose proteins in organic matter to release amines, amino acids, and urea) and ammonification (process by which amines, amino acids, and urea (from both organic matter and fertilizer) further decompose to ammonium) [9]. During the nitrification process, nitrifying bacteria such as Nitrosomonas and Nitrosospira convert ammonia to nitrites, and Nitrobacter and Nitrospira convert nitrites to nitrates [11]. In this manner, the N entered into the soil in different chemical forms are eventually converted to nitrate and become available to plants. However, in conditions of heavy rainfall and excessive irrigation, these nitrates leach through soil with percolating water and potentially contaminate groundwater (GW) resources. Through the immobilization process, soil microorganisms balance the N amount in the soils by consuming inorganic N such as ammonium and nitrate, and converting them to organic forms [12]. During ammonium volatilization, ammonium is converted to ammonia due to pH, while during denitrification, nitrates are converted to N2 by bacteria and returns to the atmosphere [13].
The process of soil N mineralization is affected by complex interactions between multiple spatial and temporal factors [14]. According to Dawes et al. [15], an increased net N mineralization occurs with soil warming, affects plant growth, and causes N leaching. In addition, N mineralization is affected by the dynamics of biological, chemical, and physical properties of a particular soil. For instance, under the process of mineralization of soil organic matter (SOM), C and other nutrients are converted to CO2 and plant-available forms of N, P, and S. This process of C mineralization is tightly related to the mineral N, P, and S release and can be influenced by C and nutrient requirements for microbial growth [16]. According to the findings of Gan et al. [17], a positive correlation was observed between soil C:N and C mineralization, N mineralization, and leaching of dissolved organic C per unit microbial C. Further, according to Fu et al. [18], the N release rate from soils in which crop residues are added depends on different soil environmental factors including soil aeration, moisture, pH, and temperature. Among them, pH was identified as one of the most significant parameters that affect chemical and biological properties of soil [18].
Okinawa is one of the Ryukyu Islands which are located southwest of Japan. Sugarcane plays a vital role in the livelihood of the Okinawan people by supporting their economy. However, Okinawa’s sugarcane production is frequently affected by typhoons, low temperatures in winter, droughts in summer, and poor soil fertility [19]. In addition, the sugarcane industry is being severely affected by labor scarcity due to the advancing age of farmers [19] and the fact that the younger generation is not willing to engage in farming activities, which has contributed to lowering the sugarcane productivity in the region. Therefore, one of the main focuses of the sugarcane industry in the region is to strengthen the economy via sugarcane yield improvement. To achieve increased yields, sufficient irrigation, fertilization, and higher labor productivity is necessary. Under such circumstances, it is important to ensure environmental conservation while achieving economic development. Although sugarcane cultivation is associated with high N application levels to achieve higher productivity, it is associated with high N losses and subsequent low N use efficiency [20]. Thus, the sugarcane industry is under great pressure in terms of reducing N losses and ensuring higher productivity.
When surface water is scarce, the water requirements for domestic and agricultural purposes are fulfilled primarily from GW [21]. For instance, on Miyako Island in Okinawa, drinking water availability depends on the rainwater accumulated underground [22,23]. About 40% of precipitation that occurs on Miyako Island penetrates underground and becomes GW while about 10% is the surface runoff [24]. Recently, GW pollution due to human activities in the GW recharge area was identified as a major issue in the Okinawa region. In addition to health and environmental concerns, water contaminated with nitrates destroys the coral ecosystem [25], posing a great threat to the surrounding coral reefs of the Ryukyu Islands.
Fujiie et al. [26] stated that agricultural activities have contributed to increasing the nitrate-N concentration of GW. Agata et al. [27] suggested the chemical fertilizers applied to sugarcane fields as the predominant source of the increasing nitrate concentration in GW. According to the study conducted by Nakagawa et al. [28], a total amount of 63.6 kg N/ha was leached as nitrate-N from their sugarcane-cultivated lysimeter unit, and they observed large increases in leached nitrate amounts during periods of typhoons and heavy rains [28]. In addition, Shuhei [29] reported that the trend in the concentration of nitrate-N at the springs on Miyako Island was only matched with that of N emission from chemical fertilizer and inferred that GW was predominantly affected by chemical fertilizers. Thus, artificial N loads derived due to heavy fertilization rates and higher water extraction by sugarcane crops have negatively affected the quality and quantity of GW in the region.
However, the farming community in the region is now moving towards cost-effective and environmentally protective agriculture projects. For instance, controlled release fertilizers (CRFs) were initially produced to reduce the labor of farmers in sugarcane farming. Further, the application of CRFs in sugarcane fields is considered to be a yield-enhancing and GW-pollution-prevention strategy. However, GW pollution levels associated with CRFs in Okinawa have not been measured to date. Therefore, we hypothesized that CRF would balance the sugarcane yield and reduce the nitrate leaching to GW from sugarcane fields compared to conventional urea application.
The water footprint (WF) is widely utilized as an indicator that simultaneously assesses the status of water consumption and pollution. The WF of a product is the freshwater volume used over the production chain of that product, which includes the volume of water consumption by source and volume of polluted water by pollution type [30]. Thus, the WF of growing a crop is the total volume of freshwater utilized in the crop cultivation process. Several studies have been conducted on sugarcane WF (e.g., studies by Kongboon and Sampattagul [31], Scarpare et al. [32], and Jorrat, Araujo, and Mele [33]) as a tool to assess the total water requirement in sugarcane cultivation. Thus, WF assessment provides incentives for water resource management as an effective tool in the sustainable management of GW. In this study, we hypothesized that CRF fertilization would reduce the total water footprint of sugarcane cultivation when compared to the urea application.
Therefore, our research focused on the WF approach to confirm the effectiveness of CRF at balancing sugarcane yield and reducing nitrate leaching to GW. Thus, a lysimeter field experiment on four fertilizer application rates, i.e., non-vegetation or bare land (BL), phosphorus (P) and potassium (K) fertilizer application without N (N-free), urea application, and CRF application, was conducted for both sugarcane plant cane and ratoon seasons with the following aims:
  • Evaluate the effectiveness of CRF on sugarcane yield enhancement by analyzing growth and yield parameters;
  • Analyze the characteristics of nitrate-N leaching related to different fertilizer rates; and
  • Calculate the WFs of sugarcane cultivation and evaluate the potential impact of nitrate-N leaching on GW.

2. Materials and Methods

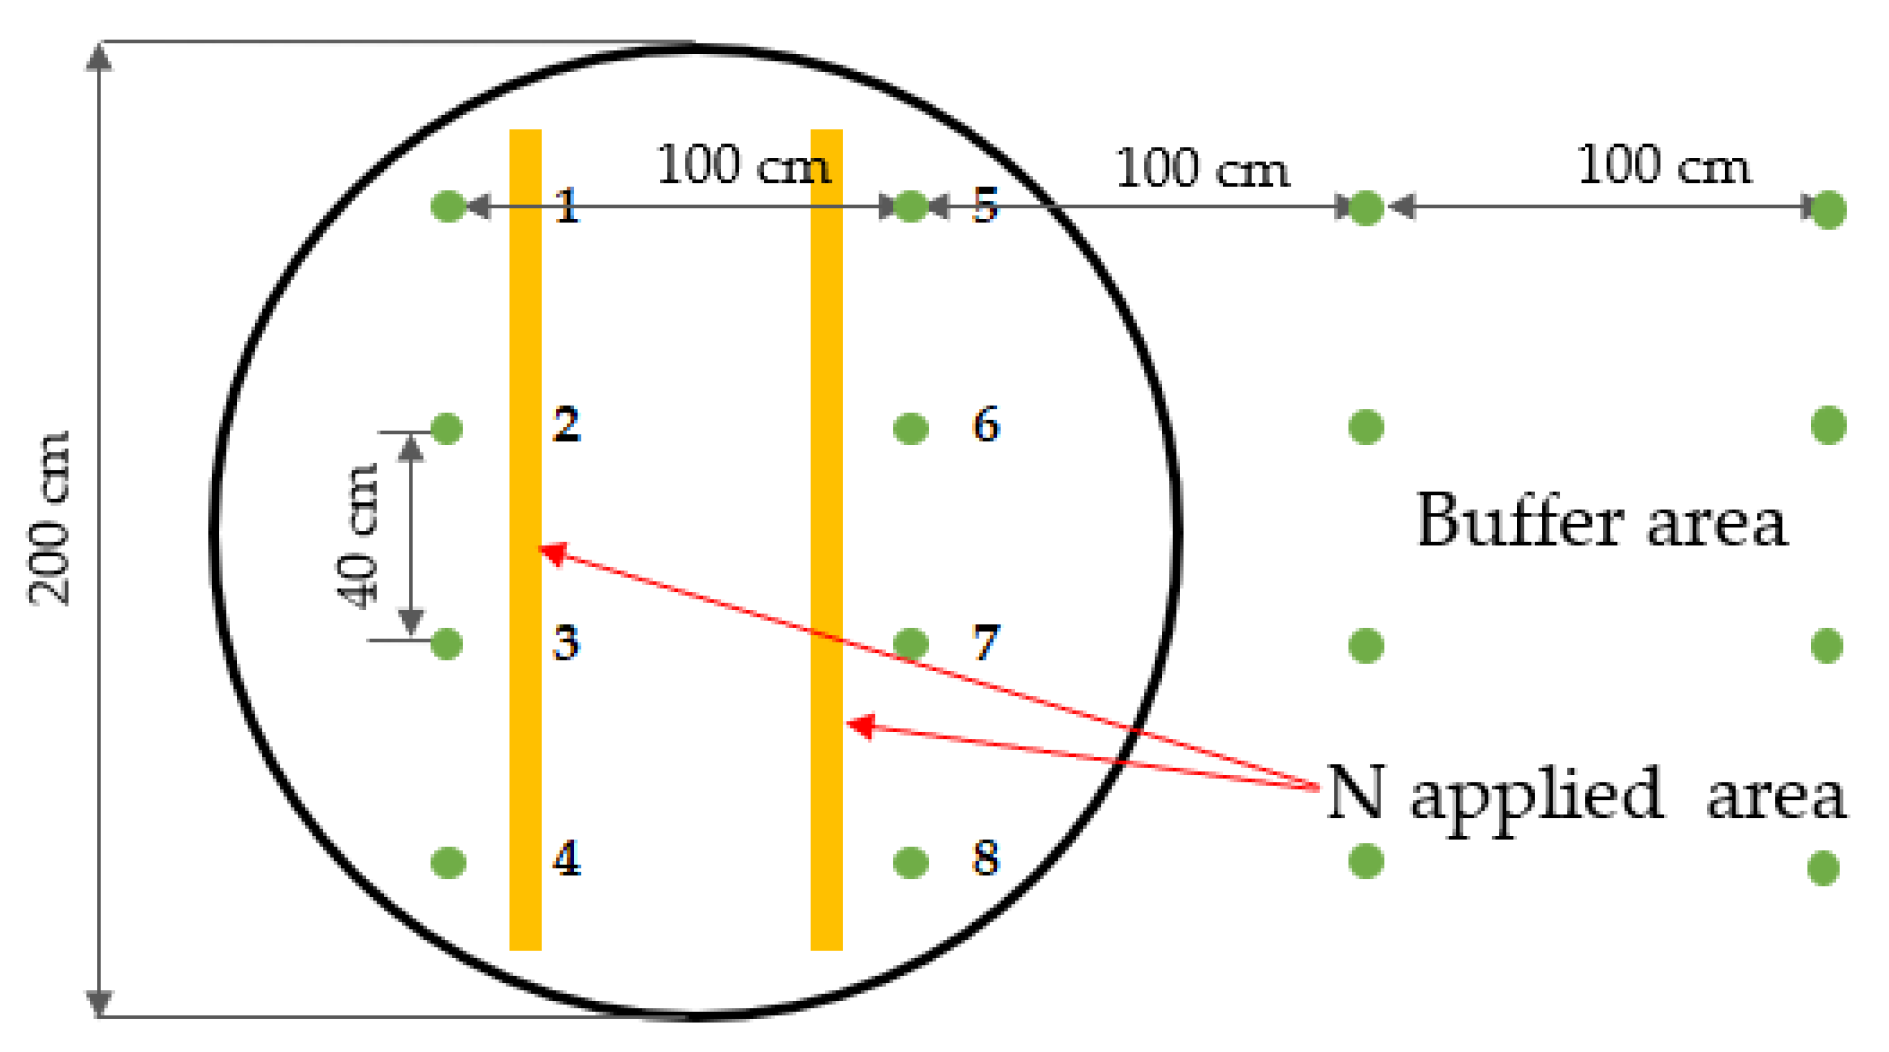
2.1. Experimental Site

A lysimeter study on the rainfed cultivation of Ni-18 sugarcane variety was conducted in the Tropical Agriculture Research Front (TARF), Japan International Research Center for Agricultural Sciences (JIRCAS), Okinawa, Japan (N 24°22′43″, E 124°11′41″). Information about daily rainfall, accumulated temperature (Accu. T), and radiation of two crop seasons in the experimental site is shown in Figure 1. Four weighing-type lysimeters were used in separated field plots in which treatments were applied. The dimensions of the lysimeters are given in Figure 2. Planting density (2546 plants/10 a) and N, P, and K fertilizer application rates were selected to represent realistic management practices of the region. Eight plants were planted in each lysimeter in two rows by maintaining 100 cm inter-row spacing and 40 cm intra-row spacing. Buffer stocks with extra plants were maintained outside of each lysimeter to minimize the physical damage that could occur due to strong winds in typhoon season. Four different fertilizer treatments were used for the experiment, as described in Table 1. The soil type of the experimental site was “Shimajirimaji” [34], which is calcaric dark red soil [35] that developed on coral limestone terraces [36]. The physical properties and texture classes of soil filled in lysimeters are given in Table 2, and the chemical characteristics of the soil filled in lysimeters are given in Table 3.
CRF is used to increase N use efficiency in sugarcane fields while minimizing GW pollution due to nitrate leaching [37]. As nutrient release from CRF is controlled by intercalating fertilizer granules within excipients, the crop nutrient supply can be improved and environmental and ecological issues are minimized [38]. According to Subbarao et al. [39], CRFs supply nutrients through a single application by controlling the rate and pattern of nutrient release over the crop growth cycle so that frequent fertilization is not required. Matsuoka [19] examined the effect of CRF on sugarcane using field experiments of several crop seasons, and they confirmed that the sugarcane yield obtained using CRF was higher than when using conventional fertilizer. In their experiment, the amount of applied N was the same in all conditions.
CRFs have different release patterns (linear or sigmoidal) based on the percentage of nutrient released at room temperature within a given time period; i.e., at a temperature of 25 °C, the nutrient release rate of CRF should not exceed 15% in 24 h or 75% in 28 days, or at least 75% should be released at the defined release time for the fertilizer (B. Cloth, as cited in Trenkel [40]). Different linear release patterns of CRF between 20 and 270 days at 25 °C issued by the fertilizer company are shown in Figure 3. “Tsuihimaijin”, the CRF used for the study, exhibits linear nutrient release for 140 days at 25 °C (shown in Figure 3 by the orange line corresponding to 140 days after application). In total, 53% of N included in Tsuihimaijin is incorporated as (NH4)2SO4, and 47% of N (in the form of urea) is coated. Thus, the application of Tsuihimaijin in sugarcane fields facilitates plant N uptake within a short period of time of application and continuously supplies N (as well as P and K) throughout the crop cycle.

2.2. Data Collection

Meteorological data: daily rainfall, maximum and minimum temperatures, relative humidity, windspeed, and solar radiation were collected from a weather station located in the TARF research facility.
Soil data: soil samples were collected from 0–30 cm and 30–60 cm soil layers of lysimeters to analyze the chemical and physical properties of soil; C:N ratio, nitrate holding capacity (NHC), pH(KCl), pH(H2O), electrical conductivity (EC), exchangeable Al (Ex. Al), available phosphorous (P), particle size distribution, bulk density (BD), and air dried soil moisture % (Air-dried MC). In addition, near-saturated soil hydraulic conductivity of each lysimeter was measured. Prior to analyzing the soil chemical properties, collected soil samples were air dried and stones, debris, and roots were removed by passing through a mesh sieve with 2 mm hole size.
The soil NHC was determined according to the method explained by Kubotera and Wada [41] to measure the retention capacity of soil for newly added nitrates. According to Wong et al. [42], evaluation of the soil nitrate retention by measuring the anion exchange capacity (AEC) would overestimate the nitrate retention of soils in fields as it also removes previously retained ions from soils. Therefore, Kubotera and Wada [41] suggested that evaluation of the actual soil nitrate retention to investigate the nitrate movement in the field should be done via determining the decrease of nitrate concentration of solutions (water and KNO3 solution) after mixing with soils. The NHC was determined as follows: 7.5 mL of 5 mmol/L KNO3 solution was added to 5 g of air-dried fine earth in a centrifuge tube and shook for 30 min and centrifuged. The NO3 concentration of supernatant was measured using the nitrate ion electrode N-2031 (DKK-TOA Corporation). The same procedure was conducted with distilled water. NHC was obtained by taking the difference between initial NO3 concentration and the NO3- concentration after shaking and centrifuging with KNO3 solution [41].
The soil pH was measured in both water and KCL, in suspensions of soil:solution ratio of 1:5 by pH electrode LAQUA F-72, HORIBA, Ltd., Kyoto, Japan. The soil EC in suspensions of soil:solution ratio of 1:5 was measured by the conductivity meter ES-51, HORIBA.
Total soil C and total soil N were measured using the dry combustion method using NC analyzer NC 220F (Sumika Chemical Analysis Service, Tokyo, Japan).
Soil available P was measured using the and Bray-1 and Bray-2 methods [43]. P concentration in the filtrate was determined by colorimetric method using a spectrophotometer UV-1800 (Shimadzu, Corp., Osaka, Japan).
Soil exchangeable Al was measured by inductively coupled plasma atomic emission spectrophotometry using ICPE-9000 (Shimadzu, Japan).
Soil bulk density was measured with the core method by taking known soil volume using a core sampler and measuring the dry soil weight.
Near-saturated soil hydraulic conductivity of lysimeters at −2 cm suction rate was measured using the mini disk infiltrometer (METER Group). Infiltration tests were conducted with undisturbed soil surface and no additional water.
Soil particle size analysis was done as follows. Soil organic matter was chemically degraded by H2O2, and sample dispersion was done with sodium hexametaphosphate. The coarse sand (0.2–2 mm) and fine sand fractions (0.02–0.2 mm) were measured by sieving; then, the silt (0.002–0.02 mm) and clay (<0.002 mm) fractions were measured with the pipette method.
Water leaching data: underground drainage rates of the experimental plots were collected at the bottom of lysimeters, and the percolation water head was calculated.
Nitrate-N leaching data: daily water samples were collected from each lysimeter throughout the experimental period and analyzed for nitrate-N using a spectrophotometer U-2000 (Hitachi, Tokyo, Japan).
Growth and harvesting surveys: growth surveys were conducted starting from 90 DAP and thereafter at an interval of 30 days, and stalk height, stalk number, leaf number, and leaf age were measured. Sugarcane yields of each treatment were measured and compared. Dry weights of stalks, tips and green leaves, and dead leaves were measured at the harvesting stage.
Data required for WF assessment (described in Section 2.4: nitrate-N leaching data, yield data, and meteorological data) were collected by the lysimeter field experiment. The maximum acceptable concentration of nitrate-N was taken as 10 mg/L based on the environmental quality standards for GW pollution published by Ministry of the Environment Government of Japan [44], and 1.4 mg/L was used as the natural background concentration of nitrate-N—the value set by Nakanishi et al. [45] for the GW of Miyako Island, Okinawa prefecture.

2.3. Statistical Analysis and Data Interpretation

2.3.1. Analysis of Growth and Harvesting Parameters

Sugarcane growth parameters (stalk height, stalk number, leaf number, and leaf age) and harvesting parameters of each lysimeter were analyzed using ANOVA with LSD multiple range test (p < 0.05) using Stats package [46] and Agricolae package [47] of R statistical software [46], and results were indicated using bar charts.

2.3.2. Analysis of Nitrate-N Leaching Data

At first, we compared the daily variation and cumulative variation of nitrate-N leaching of four fertilizer-treated conditions and tried to determine the characteristics of nitrate-N leaching events in this experiment. Then, we conducted a deep analysis on the observed data using duration curves and envelop lines.

2.4. WF Assessment

WF is an indicator of water use that expresses direct and indirect water use and helps the public to understand how their consumption affects precious freshwater resources [30]. The total WF of growing a crop is the summation of the green WF, blue WF, and grey WF associated with the crop cultivation process [30]. The green WF of a process (WFproc,green) refers to the rainwater consumed in a certain production process while the blue WF of a process (WFproc,blue) refers to the volume of ground and surface water consumed (evaporated) during that process [30], and grey WF (WFproc,grey) is the volume of freshwater required to assimilate the load of pollutants based on existing ambient water quality standards [30].
The standard procedure for WF assessment described by Hoekstra et al. [30] was used in the study. The total WF of the sugarcane cultivation process was calculated by using the equations provided by Hoekstra et al. [30]. The total WF of sugarcane with regard to the summation of green, blue, and grey components of WF associated with sugarcane cultivation was calculated using Equation (1). The green WF (Equation (2)) and blue WF (Equation (3)) of growing sugarcane were calculated by dividing the respective green and blue components of crop water use (CWU) by the crop yield. As rainfed cultivation of sugarcane was considered for the study, only the green component of CWU was used for WF calculation. The green water evapotranspiration of sugarcane crop during the growing period was estimated based on acquired climatic data and crop data using the “irrigation schedule option” of the Food and Agriculture Organization’s CROPWAT 8.0 model [48]. Grey WF was calculated by dividing the pollutant load associated with chemical fertilizer application for growing sugarcane by the difference between the maximum acceptable concentration of the pollutant and its natural concentration in the receiving water body then dividing it by the crop yield (Equation (4)). As lysimeters avoided surface runoff from agrochemicals, this study only considered the contamination of GW via nitrate-N leaching to calculate the grey WF of sugarcane cultivation.
W F p r o c , s u g a r c a n e = W F p r o c , g r e e n + W F p r o c , b l u e + W F p r o c , g r e y
W F p r o c , g r e e n = C W U g r e e n Y
W F p r o c , b l u e = C W U b l u e Y
W F p r o c , g r e y = L ( C m a x C n a t ) Y
Here, WFproc,sugarcane, WFproc,green, WFproc,blue, and WFproc,grey are the total WF, green WF, blue WF, and grey WF of the process of growing sugarcane (m3/ton), respectively; CWUgreen and CWUblue are the green and blue components of crop water use (m3/ha), respectively; L is the pollutant load (kg/ha); Cmax and Cnat are the maximum acceptable concentration (kg/m3) and natural concentration in the receiving water body for the pollutant considered (kg/m3), respectively; and Y is the crop yield (ton/ha).

3. Results

3.1. Results of the Growth and Harvesting Surveys

The evaluation of the growth and harvesting parameters of sugarcane cultivation related to the applied treatments is important to confirm the effectiveness of CRF in enhancing the productivity of sugarcane cultivation.

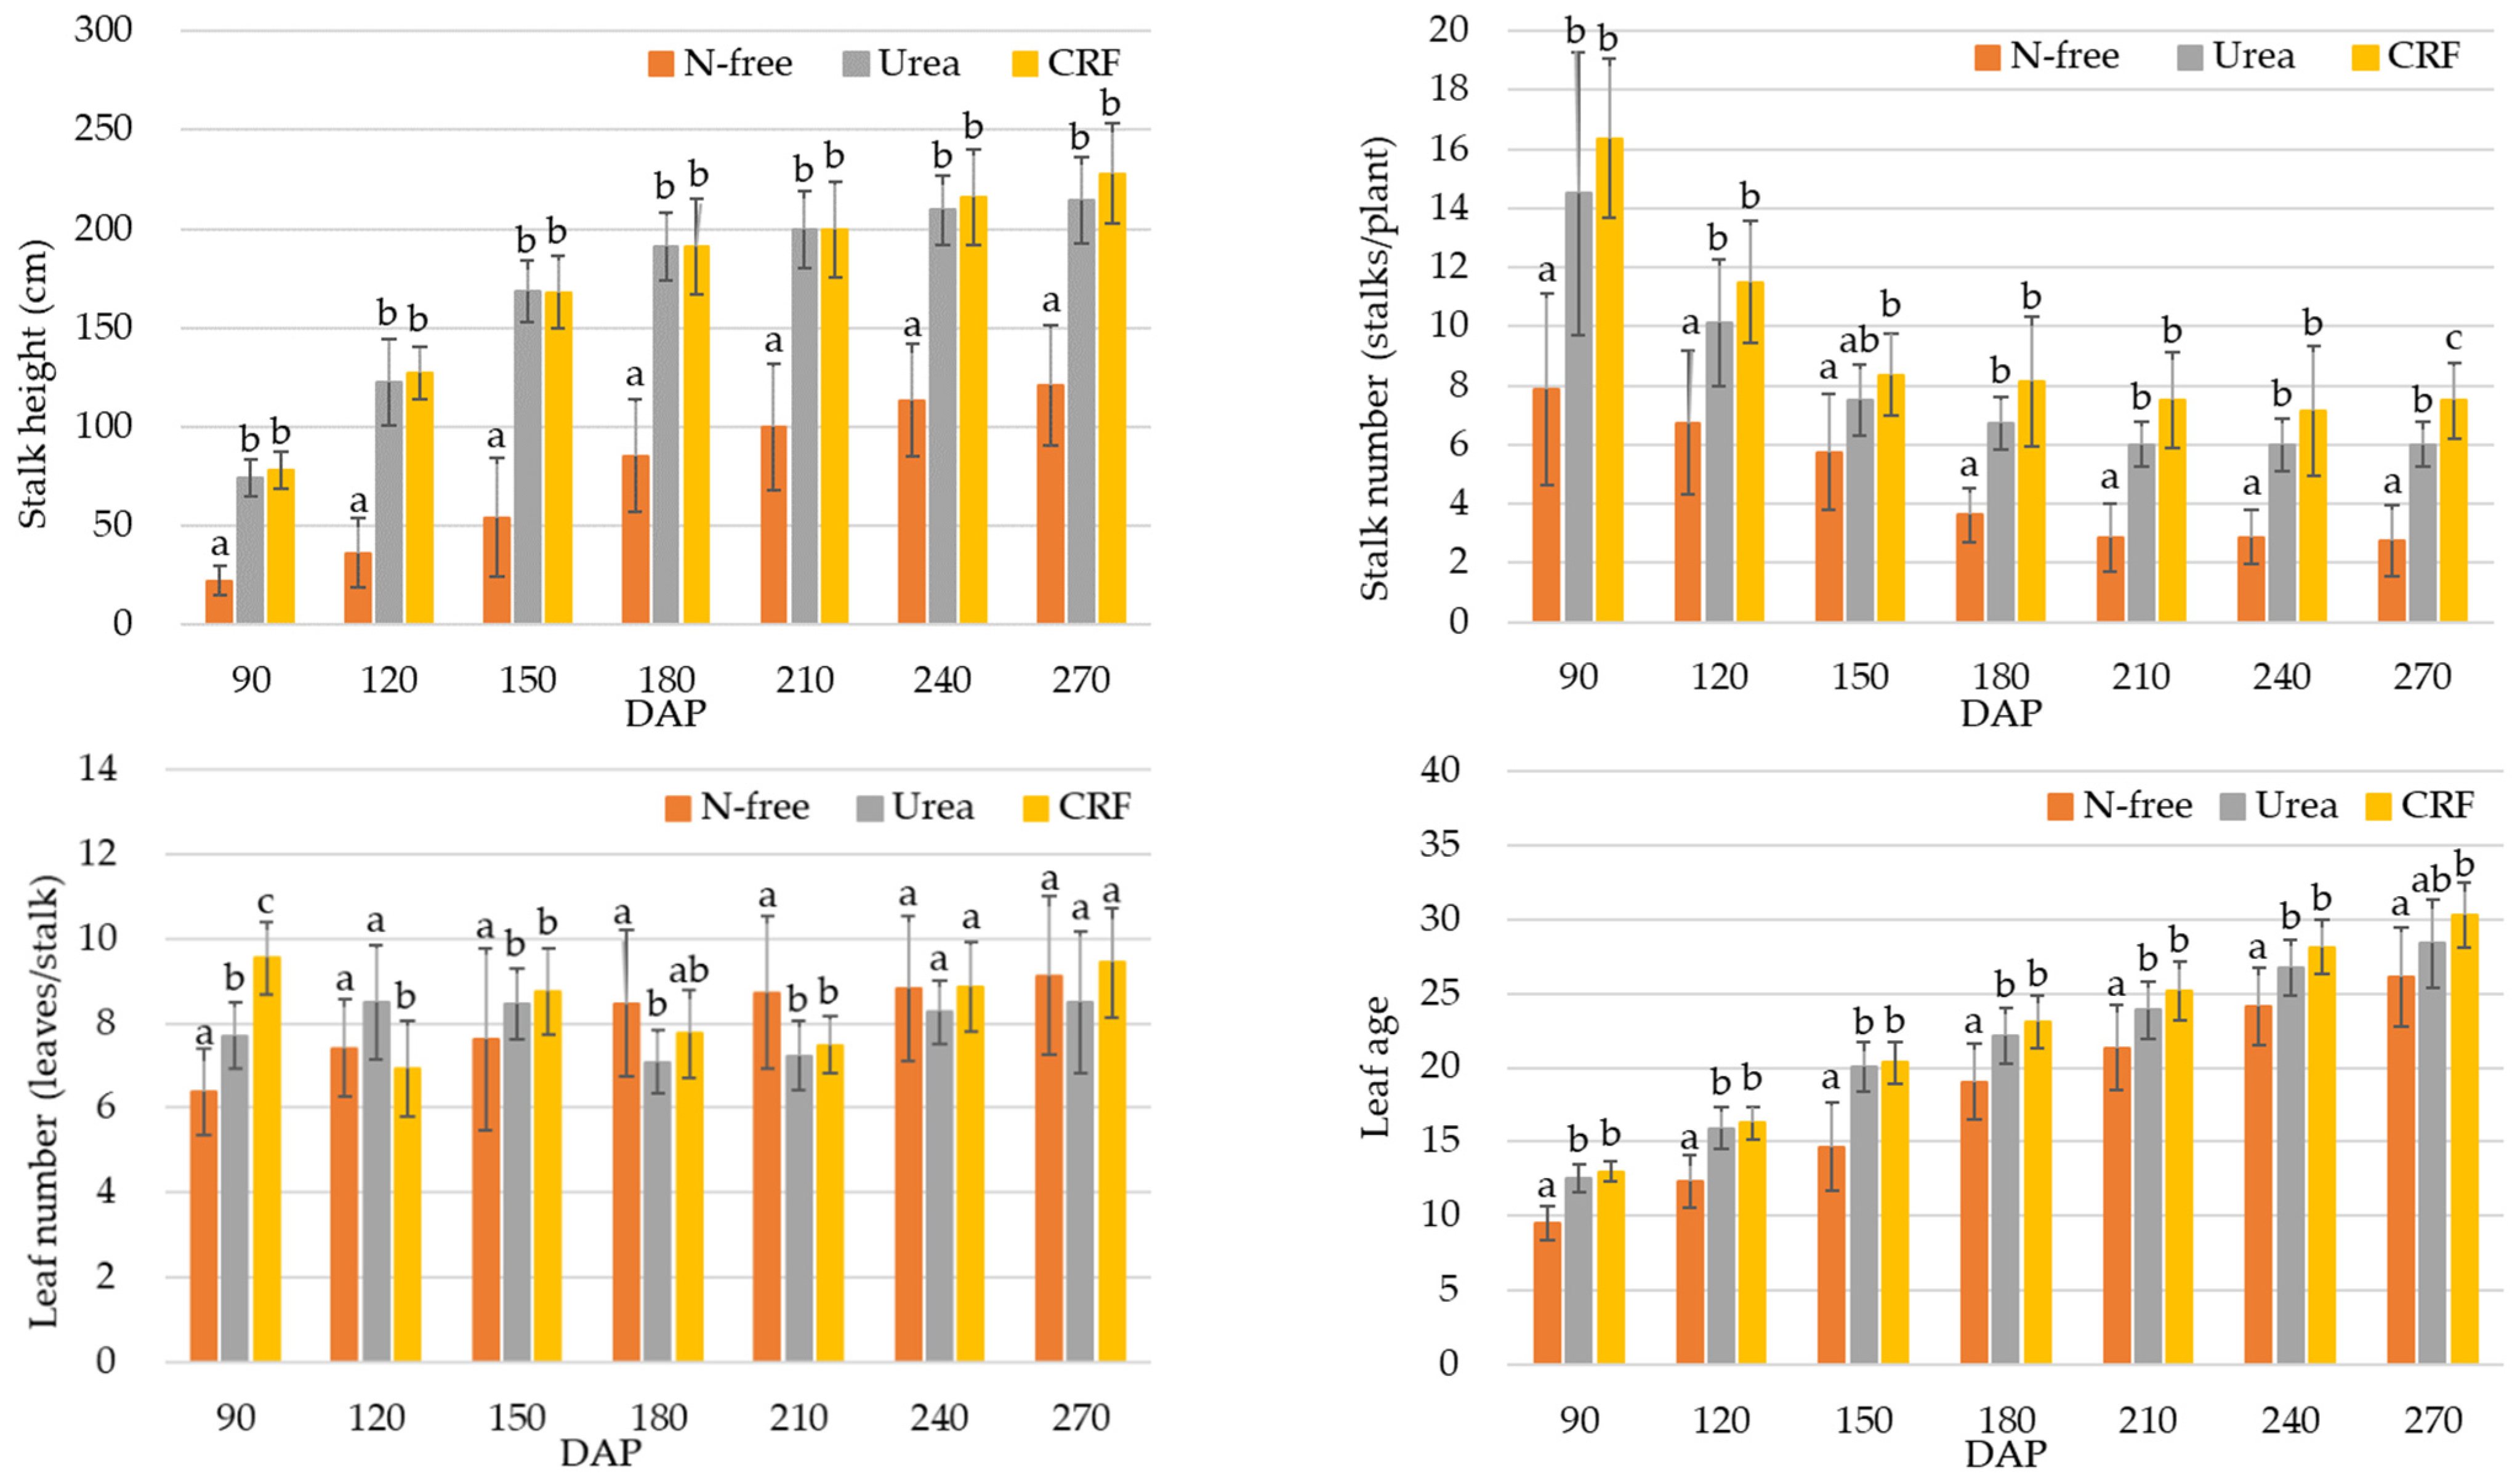
3.1.1. Results of the Growth Survey

The sugarcane stalk height and number associated with CRF and urea fertilizer did not show any significant difference in both plant cane (Figure 4) and ratoon (Figure 5) seasons (except stalk number at 270 DAP of ratoon season). However, the stalk height and number associated with N-free fertilizer application was significantly lower than with the CRF and urea applications in both crop seasons (Figure 4 and Figure 5).
In addition, in the plant cane season, a significant difference could be seen in the leaf number of both CRF and urea applications than that of N-free fertilizer application at 90 and 120 DAP and no significant differences were found after that (Figure 4), while leaf age of both CRF and urea treatments were significantly higher than that of N-free treatment for all DAPs except 240 DAP. For the ratoon, the leaf number of CRF and urea treatments were significantly higher than that of N-free treatment for 90 DAP and 150 DAP, while the leaf age of CRF and urea treatments were significantly higher than that of N-free treatment for almost all DAPs (Figure 5).

3.1.2. Results of the Harvesting Survey

For plant cane, the total dry weight (TDW) obtained for the CRF treatment was significantly higher than urea and N-free treatments as shown in Figure 6. For ratoon, the TDW obtained for the CRF and urea treatments were not significantly different from each other while the TDW of N-free treatment was significantly lower than those of CRF and urea treatments (Figure 6). However, the TDW of ratoon crop was significantly higher than that of plant cane for all N-free, urea, and CRF treatments. (Results of the statistical analysis of the harvesting survey are provided in Supplementary Material: Tables S1–S3).

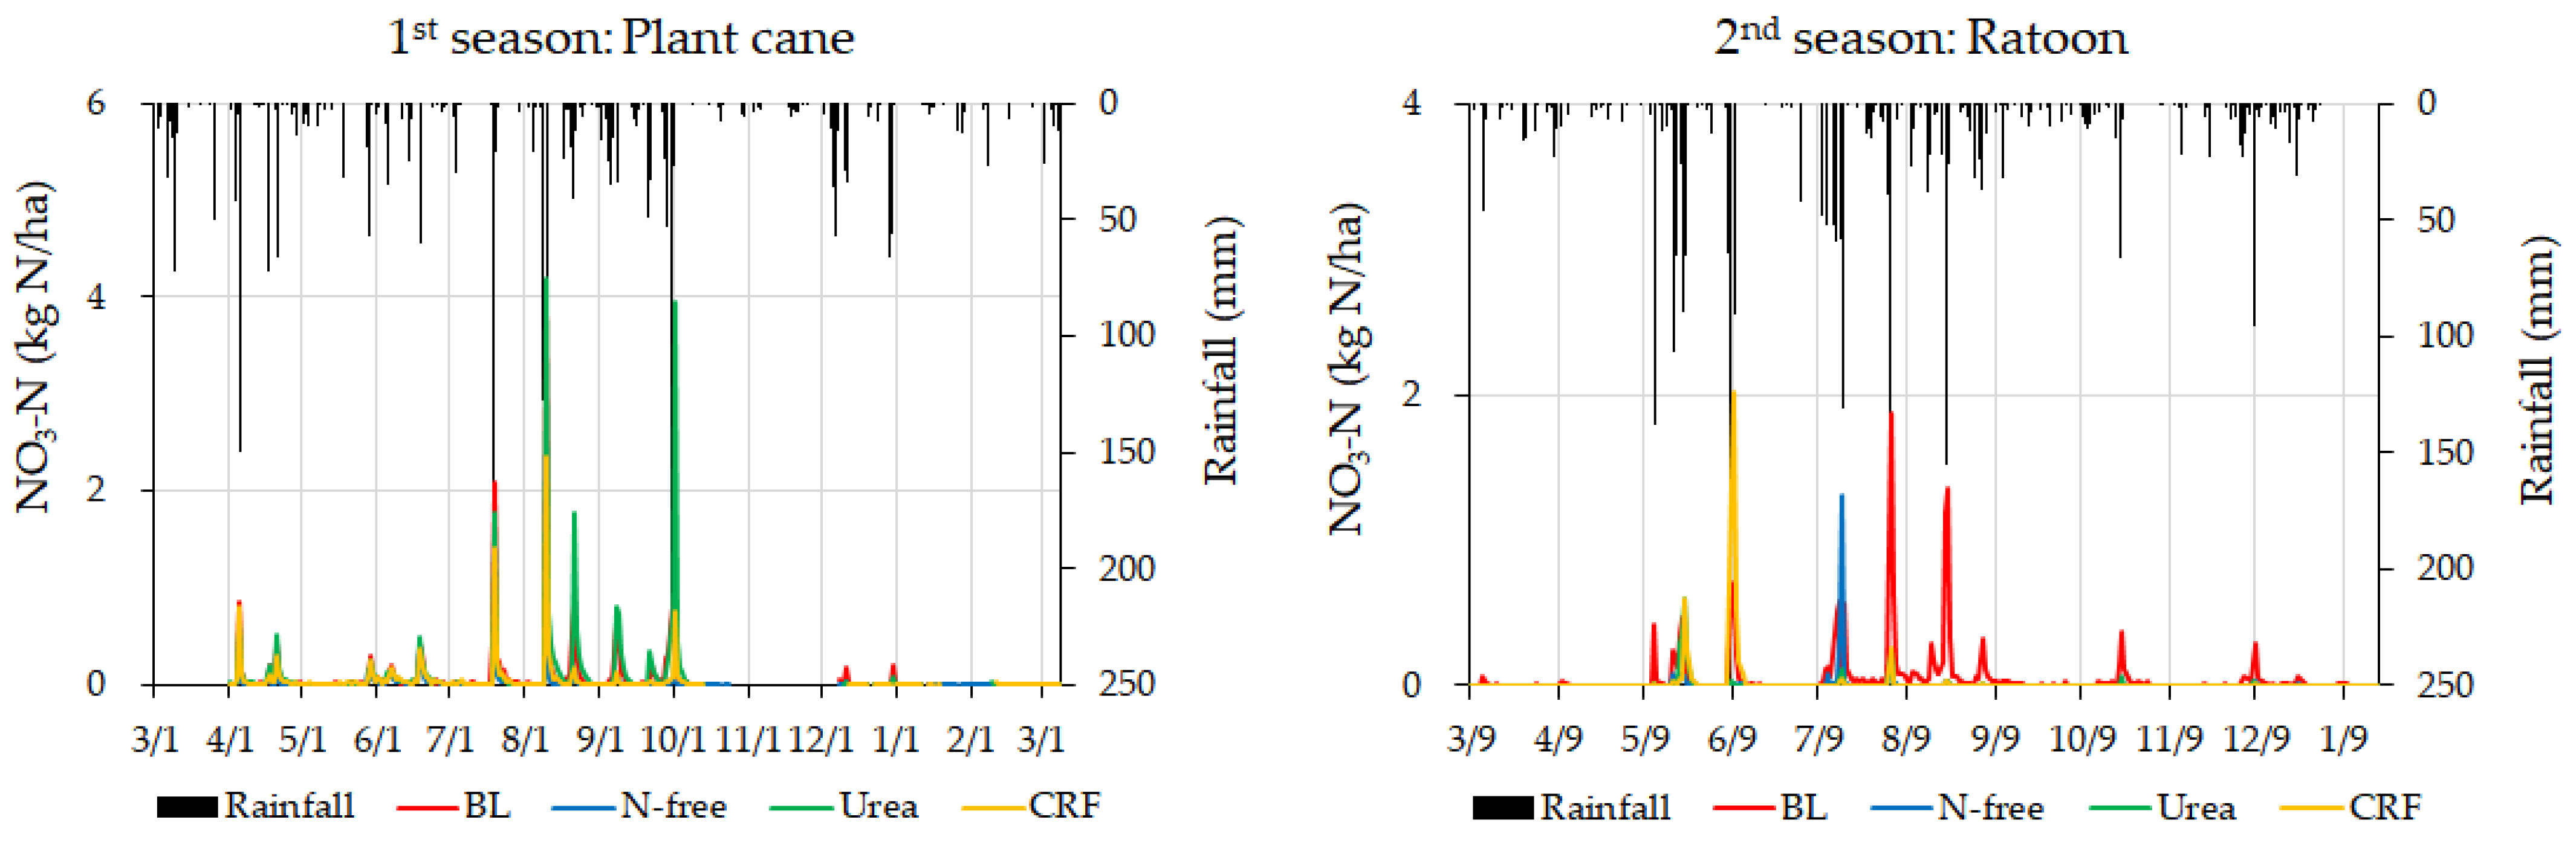
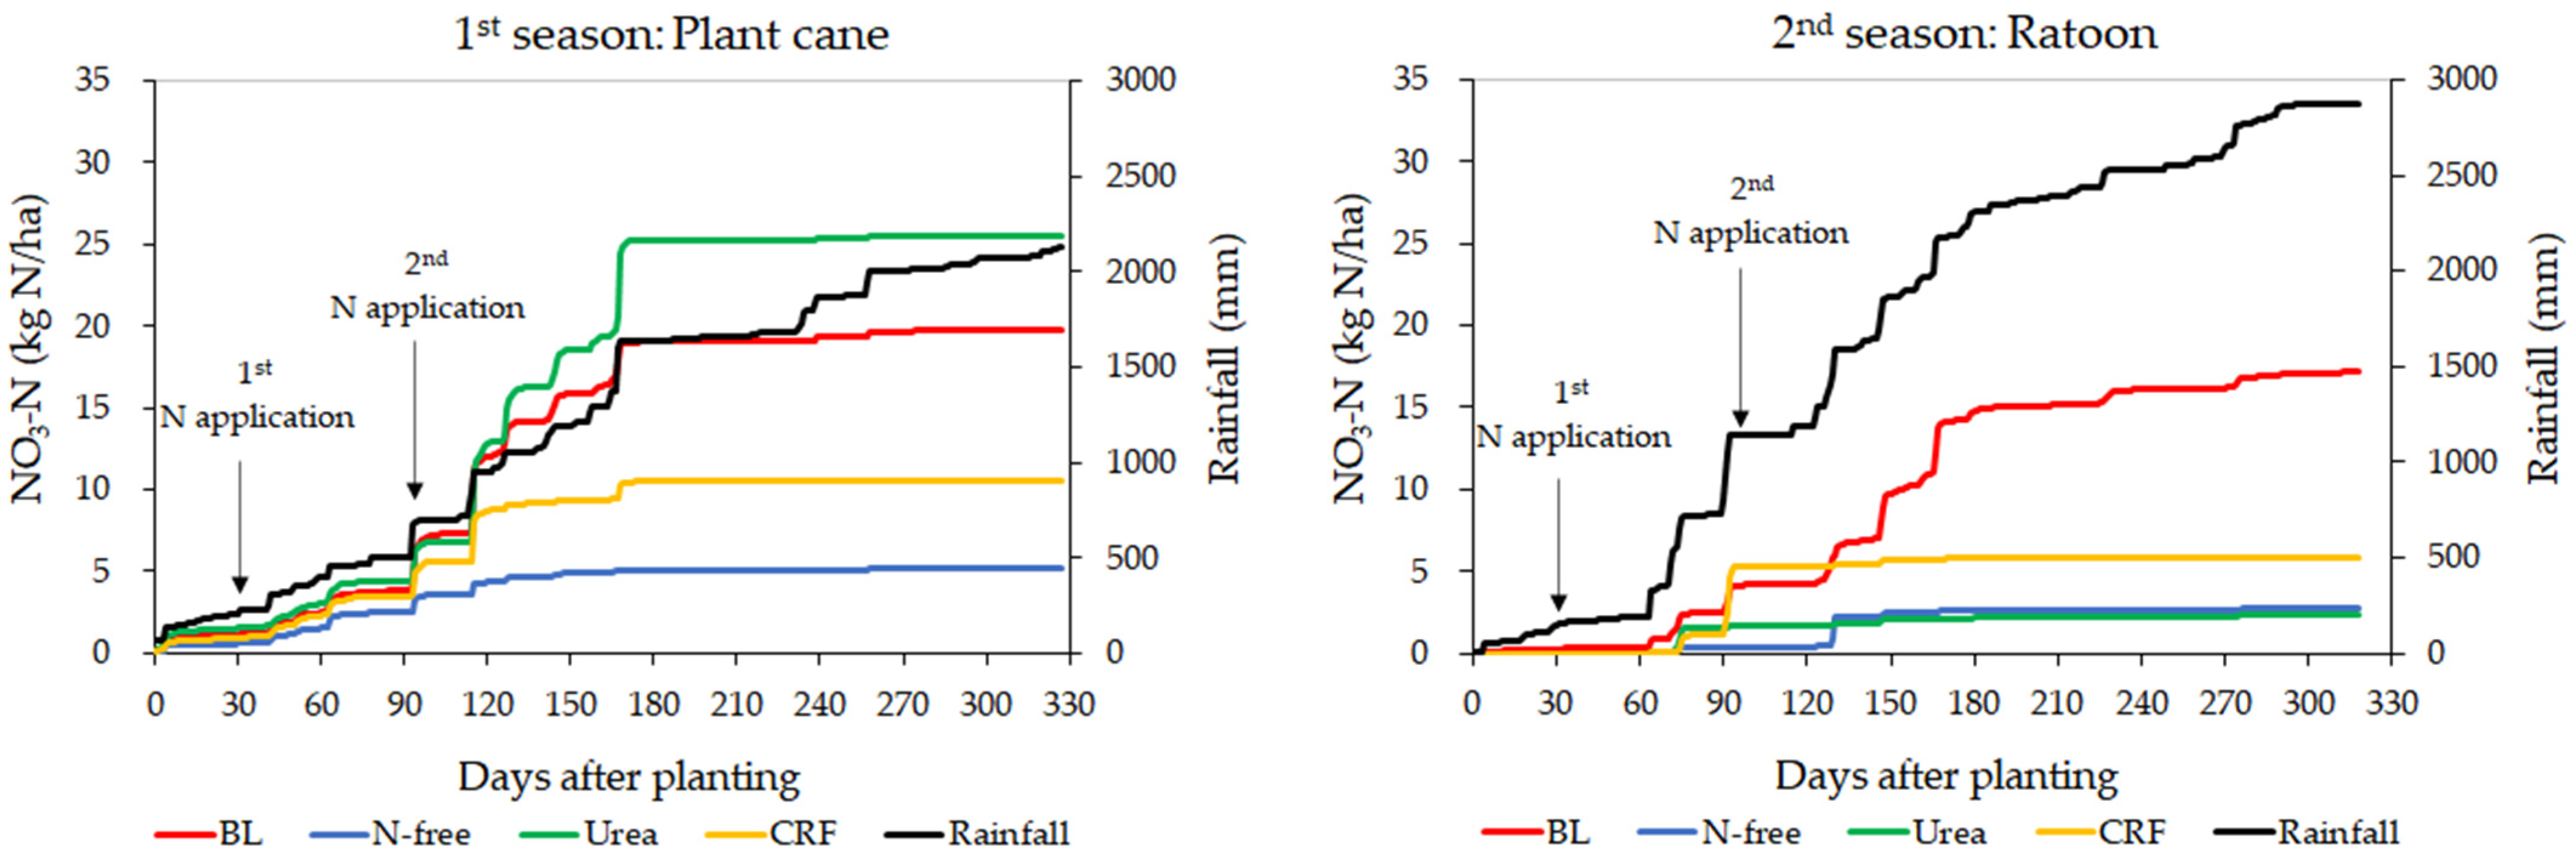
3.2. Variation of Leached Nitrate-N

Variations of daily nitrate-N leaching and cumulative nitrate-N leaching from lysimeters with rainfall for both crop seasons are shown in Figure 7 and Figure 8, respectively.
Nitrate-N leaching in all conditions in both crop seasons was sensitive to rainfall variation (Figure 7), resulting in increased nitrate-N leaching in heavy rainfall conditions. The cumulative nitrate-N leaching of the plant cane season for CRF, urea, and N-free treatments were higher than that of the ratoon season (Figure 8). The highest cumulative nitrate-N leaching was observed for urea treatment in the plant cane season and BL treatment in the ratoon season (Figure 8). However, except for urea treatment in the plant cane season, the BL condition recorded comparatively higher cumulative nitrate-N leaching than the other treatments in both crop seasons (Figure 8). In addition, cumulative nitrate-N leaching in urea application was higher than that of CRF application for plant cane while it was lower than that of CRF application for ratoon season (Figure 8).

3.3. WF of Sugarcane Cultivation

The WF of sugarcane indicates the amount of water allocated for sugarcane cultivation that cannot be allocated for another production or requirement. Table 4 indicates the estimated WFproc,green, WFproc,grey, and WFproc,sugarcane for urea and CRF treatments of the study.
The sugarcane cultivation process from crop establishment to harvesting was set as the boundary condition for WF assessment. Sugarcane stem yields of CRF and urea treatments for the plant crop season were 71.01 t/ha and 65.96 t/ha, respectively, while for the ratoon season the yields were 117.83 t/ha and 92.96 t/ha, respectively. According to our study, the total sugarcane WF of CRF application was lower than that of urea application. WFproc,sugarcane was 192.33 m3/t for the CRF application and 233.47 m3/t for the urea application for plant cane season, and WFproc,sugarcane was 190.47 m3/t for the CRF application and 237.59 m3/t for the urea application for the ratoon season.

4. Discussion

4.1. Analysis of the Growth and Harvesting Parameters

The differences of sugarcane stalk height, stalk number, leaf number, and leaf age associated with applied treatments could be explained by different nutrient availability conditions in soil under applied fertilizer treatments. A sufficient nutrient supply (N, P, and K) was ensured during the crop growth cycle for both CRF and urea applications while the N-free fertilizer application only provided K and P. The sugarcane tillering stage begins around 40 DAP and lasts about 120 days, producing the required number of stalks for good crop production, in which fertilization plays an important role [49]. As this stage is strongly influenced by soil fertility conditions, obtained values for the stalk number and height of sugarcane for the CRF and urea treatments were much higher than those of the N-free treatment (Figure 4 and Figure 5). In addition, it indicated the importance of maintaining sufficient soil N availability for sugarcane leaf development in the early crop stages. Dinh et al. [50] also reported that, under higher N application in sufficient water-available conditions, sugarcane plants exhibited a higher number of leaves in the early stages of the crop than with no N application.
The results of the analysis of harvesting parameters indicated that the TDW obtained for ratoon was significantly higher than that of plant cane for all three fertilizer treatments. This can be explained by the results of the growth survey having stalk number recorded more than three times higher in the ratoon stage than in the plant cane stage (Figure 4 and Figure 5) at 90 DAP. Similar results were reported by El-Hinnawy and Masri [51] who obtained significantly higher stalk numbers in the first and second ratoons by 22.6% and 21.6%, respectively, compared to plant cane.

4.2. Analysis of Leached Nitrate-N

4.2.1. Evaluation of Daily and Cumulative Variation of Nitrate-N Leaching

The variation in daily and cumulative nitrate-N leaching from lysimeters were different from each other. Nitrate movement through soil is closely related with physical, chemical, and biological properties of each particular soil. Generally, it is assumed that the application of fertilizers causes higher nitrate-N leaching. However, according to our results, the BL condition showed higher nitrate-N leaching in both crop seasons (except urea treatment in plant cane season), especially in the ratoon season (Figure 8). We considered the reason for the above phenomenon focusing on some points below, i.e., C:N ratio, infiltration, NHC, and N uptake by plants.

Consideration of the Relationship between N Leaching and C:N Ratio

According to the measured total soil carbon (TCsoil) and total soil nitrogen (TNsoil) of the four lysimeters at a 0–30 cm depth during both crop seasons (Table 5), the average C:N ratio of the four lysimeters was 10:1 during the experimental period. According to USDA-NRCS [52] and Swangjang [53], the C:N ratio of available substances in and on the soil can significantly affect crop residue decomposition. Brust [54] stated that the rapid mineralization of organic matter and N release occurs when the C:N ratio of an organic substrate ranges between 1 and 15. Thus, a C:N ratio of 10:1 indicates that the decomposition rate of soil organic matter was fast and the availability of soil inorganic nitrogen was high. Therefore, we considered that the BL condition showed higher nitrate-N leaching than other vegetation-available conditions because the applied amount of fertilizer N—20 g/m2—was relatively small compared to the available TNsoil.

Consideration of the Relationship between N Leaching and Infiltration

The hydraulic conductivity indicates the ability of soil to transmit water under near-saturated or saturated conditions [55]. The soil hydraulic properties at near-saturated conditions are very important for the processes of water and/or solute transport that occurs at the highest rates in the conditions of near-saturation [56]. The highest Kh was observed in the BL-treated lysimeter than the other three lysimeters (Table 2), indicating higher infiltration occurrence in the BL condition. In addition, soil texture is an important property that affects water movement through soil and therefore affects the movement of chemicals dissolved in soil water such as nitrate [57]. A rapid downward water movement occurs in coarse soils such as sandy soils which have relatively large pore spaces among the soil particles compared to the soils with appreciable amount of silt and clay [58]. When comparing the soil texture of lysimeters, coarse sandy loam texture was observed for the BL-treated lysimeter (in both soil depths: 0–30 cm and 30–60 cm), indicating higher sand % than the others (Table 2). In the N-free-treated lysimeter, sandy clay loam texture was observed for soil depth of 0–30 cm while coarse sandy loam texture was observed for soil depth of 30–60 cm (Table 2). However, for both urea- and CRF-treated lysimeters, sandy clay loam texture was observed (in both soil depths: 0–30 cm and 30–60 cm) (Table 2). Therefore, this explains the comparatively higher amount of nitrate-N leaching observed in the BL-treated lysimeter, in which higher infiltration was observed and coarse sandy loam soil was available, compared to other lysimeters.

Consideration of the Relationship between N Leaching and NHC

Nitrate ions generally leach with soil water movement as they are not well-retained by soils [41]. The highest capacity of nitrate retention was observed in the BL condition compared to other lysimeters (Table 3). The NHC of soil is due to the positive charge in soil materials which is pH-dependent [59]. Thus, the nitrate retention in soil is also influenced by soil pH. In addition, as soil biological activities are affected by soil chemical properties, it indirectly affects the N dynamics [55]. For instance, soil pH significantly influences microbial activities and associated biogeochemical processes [60]. The pH(H2O) of all the lysimeters ranged in between 5.18–6.21 (Table 3) which was within the favorable soil pH range of 5.5–8 for plant growth and most of the soil processes including microbial activities and nutrient availability [61]. In addition, soil exchangeable Al was lower than 1 cmolc/kg for all treatments except in soil depth of 0–30 cm of urea treatment (i.e., 1.42 cmolc/kg). Thus, soil pH of all the lysimeters were in the pH range that is required to sufficiently facilitate the soil nitrification process. Further, there was a positive correlation between soil EC and the nitrate-N concentration in non-saline soils [62]. We could observe only slight variation among EC values of two soil layers for the four lysimeters. However, the BL condition was maintained with no vegetation and fertilization. Therefore, although N-free, urea- and CRF-treated lysimeters had lower NHC compared to the BL treatment, lower nitrate leaching occurred for the former due to crop N uptake while the BL condition with higher NHC recorded higher nitrate leaching.

Consideration of the Relationship between N Leaching and N Uptake by Plants

Lower nitrate leaching was observed in N-free-, urea- and CRF-treated conditions due to heavy N uptake from sugarcane plants in vegetation-available lysimeters which cause subsequent reduced nitrate leaching than in the BL condition. Further, among the vegetation-available conditions, reduced nitrate leaching was recorded for the N-free condition than urea and CRF conditions because the crop N demand under N-free treatment was compensated only by the nitrate derived from the microbial nitrification process of the soil N cycle.
Comparing the cumulative values of two crop seasons (Figure 8), the nitrate-N leaching of the plant cane season for N-free, CRF, and urea treatments were higher than that of the ratoon season. It was observed that the ratoon season recorded a higher dry matter yield than plant cane (Figure 6) which caused lower N leaching in the ratoon season than in the plant cane season. In addition, according to Verburg et al. [63], more N leaching loss can usually be observed from plant canes than ratoons due to the availability of extra mineralized N during the preceding fallow period, and higher drainage occurs as a result of the higher initial water content from water stored in the profile during the same period.
In addition, in urea- and CRF-applied lysimeters, fertilizer application was conducted below the soil surface in a row close to sugarcane plants as indicated in Figure 9 by providing sufficient N availability to facilitate N uptake by plants. Therefore, considering the spatial average of N in soil, it can be stated that difference of the N in soil between the lysimeters was not large. In this condition, the area influenced by N application should be limited. Because water movement in soil layers is mainly vertical, this results in one-dimensional nitrate-N movement through soil. Iqbal [64] also concluded that nitrate loss from their experimental wheat field was dominated by vertical nitrate leaching and the potential of horizontal nitrate movement in soils was negligible. In the same study, much higher vertical nitrate leaching in a 30 cm soil layer in the control (no N application) treatment was observed than in other N fertilizer-applied treatments during the first rainfall period [64]. In addition, as shown in Figure 4 and Figure 5, the stalk number recorded in the ratoon stage was more than three times higher than in the plant cane stage at 90 DAP. From this result, we considered that N leaching in the ratoon season was small because there was an interception of rainfall by the canopy from the early growth stage and the infiltration in the area where fertilizers were applied was small.

4.2.2. Evaluation of the Relationship between Water Leaching and Nitrate-N Leaching

Nitrate-N leaching was influenced by both the rainfall and water leaching during the experimental period and a difference in the nitrate-N leaching could be observed between two crop seasons. As “Shimajirimaji” is a clay-rich soil [65], nitrate ions do not readily bind with soil and substrate colloids, which are negatively charged. This condition keeps nitrate ions highly mobile in the soil solution [66], facilitating more nitrate-N leaching. Similarly, Aranibar et al. [67] stated that rainfall and consequent soil water dynamics have a strong impact on N cycle regulation in terrestrial ecosystems. Gu and Riley [68] found that soil nitrate leachate fluxes were highly sensitive to rainfall variability in a heavy rainfall scenario. However, when evaluating Figure 7 and Figure 8, the characteristics of the relationship between water leaching and nitrate-N leaching in the two seasons cannot be clearly identified. Therefore, we conducted a detailed analysis of the observed data using duration curves and envelop lines as described below.

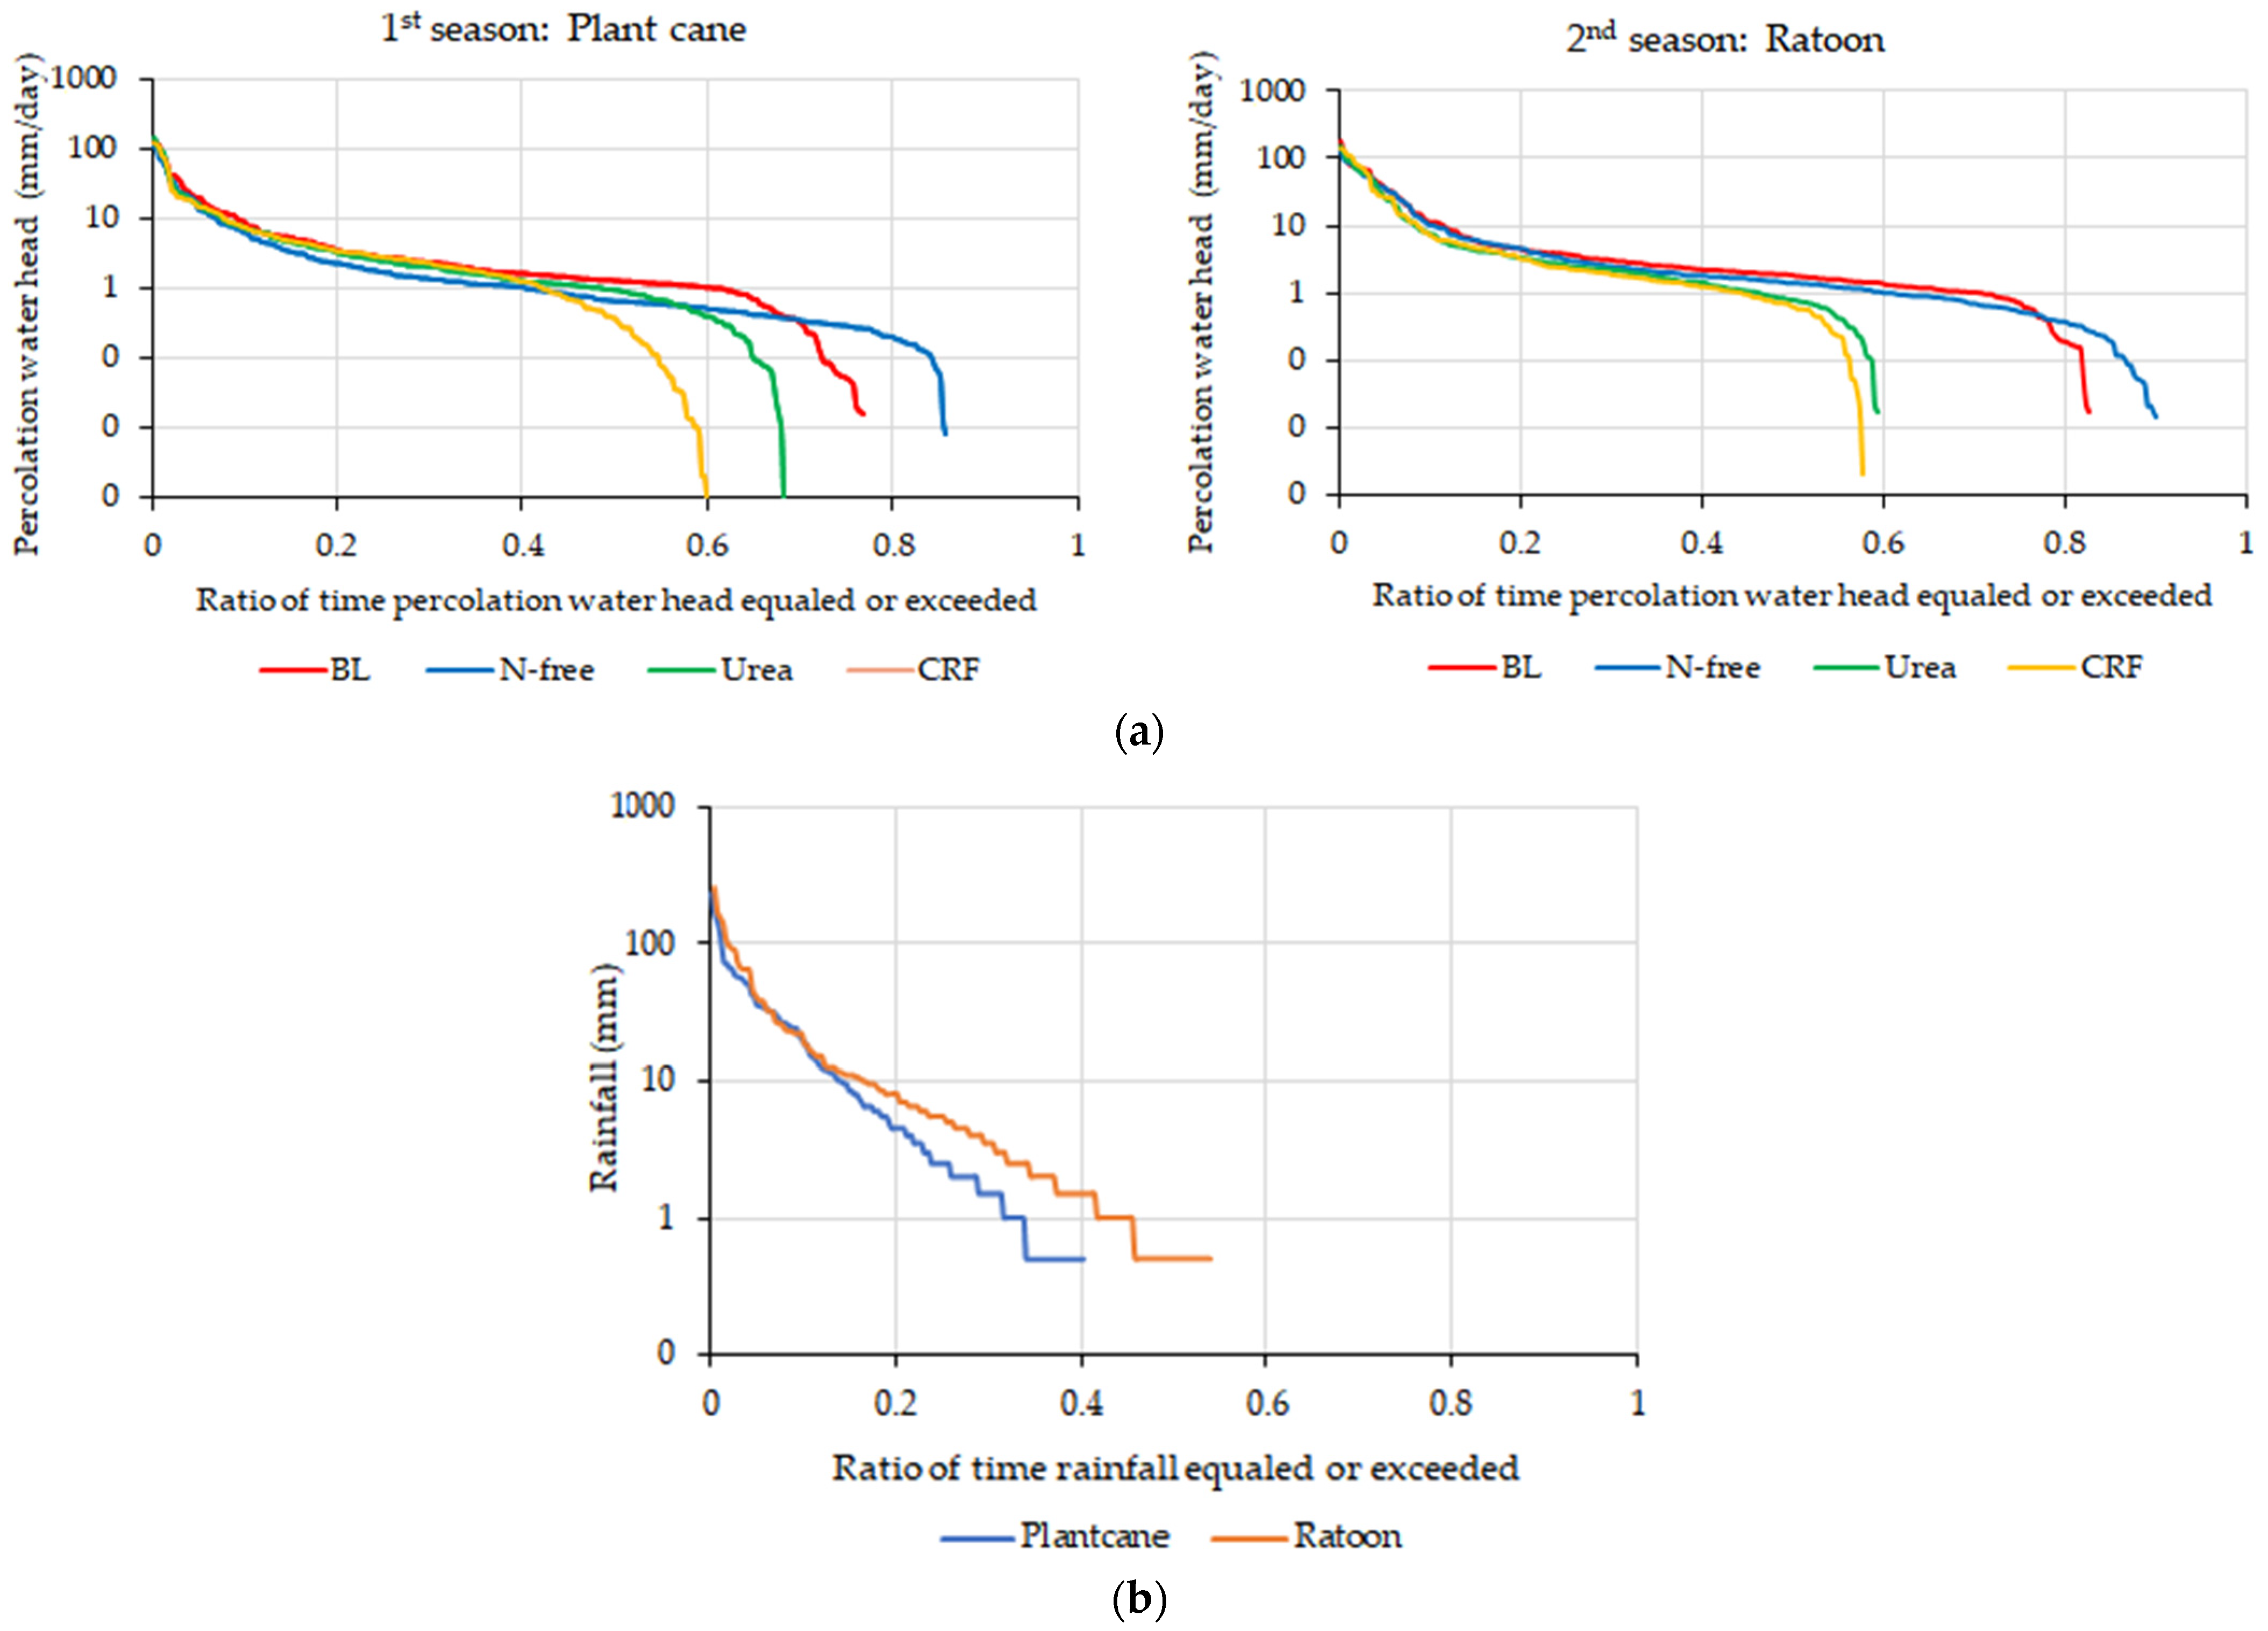
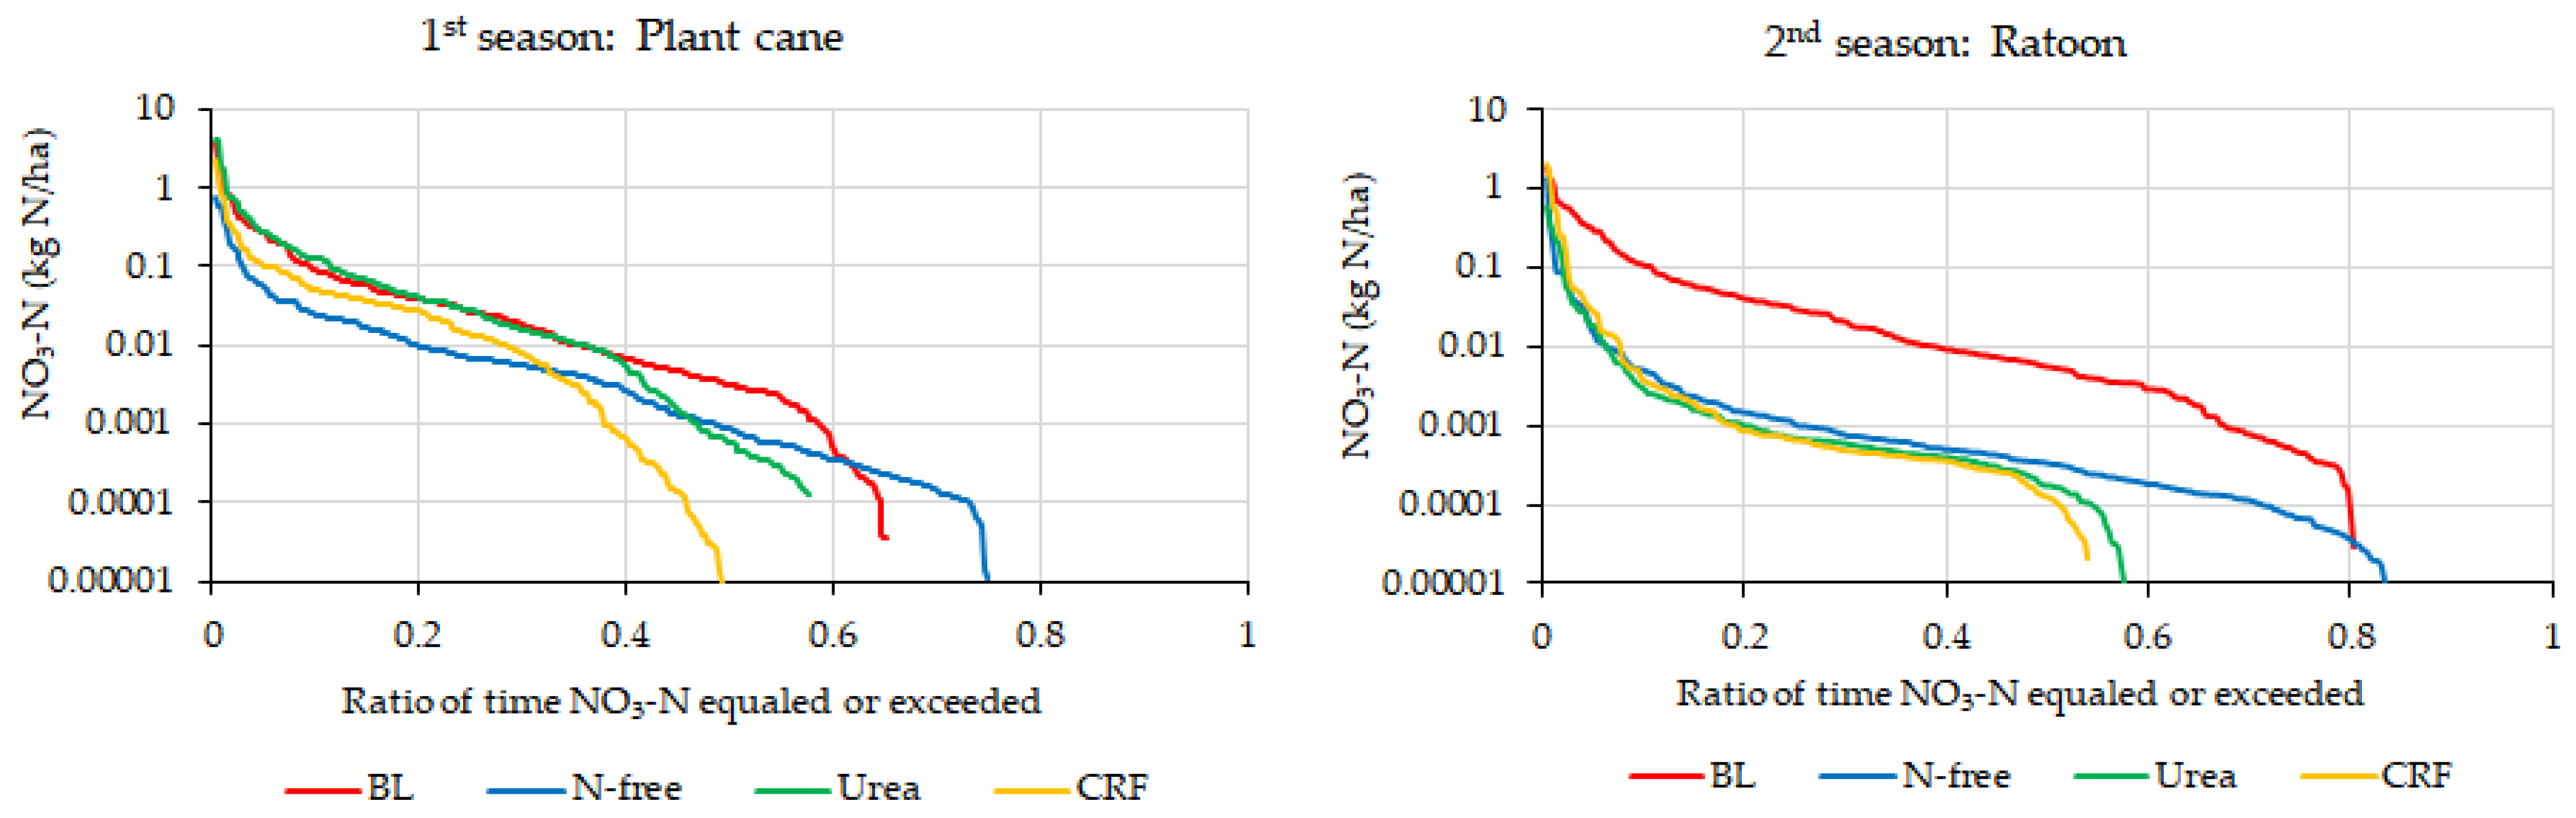
Evaluation of Duration Curves of Water Leaching and Nitrate-N Leaching

A duration curve describes the characteristics of a specific variable at a specific site during a period of interest [69]. Thus, we developed duration curves for water leaching, rainfall, and nitrate-N leaching to analyze their characteristics in differently fertilizer-treated lysimeters. Water leaching, rainfall, and nitrate-N leaching duration curves were developed by ranking the respective daily values of the leached water amount (percolation water head in mm/day), rainfall (mm), and leached nitrate-N (kg N/ha) in descending order and plotting the sorted values against the corresponding ratio of time that a particular event (of percolation water head or rainfall or leached nitrate-N) equaled or exceeded. Figure 10 presents the relationships between (a) the leached water and the ratio of time that percolation water head was equal or greater and (b) the rainfall and the ratio of time that rainfall was equal or greater, while Figure 11 presents the relationship between the leached nitrate-N and the ratio of time that leached nitrate-N was equal or greater. Using Figure 10 and Figure 11, the characteristics of water and nitrate-N leaching events are discussed.
As indicated by Figure 10a, water leaching curves of different fertilizer treatments were not exactly the same for the two crop seasons. This can be explained by the rainfall variation between the plant cane season and ratoon season which resulted in different leached water volumes in the two crop seasons; for instance, the rainfall days of the ratoon season were longer than those of the plant cane season. It was also observed that the durations of water leaching in BL and N-free conditions in the ratoon season were longer than in the plant cane season, exhibiting a similar variation to the rainfall variation, while those of urea and CRF conditions in the ratoon season were shorter than in the plant cane season. This can be explained by the larger water uptake by the sugarcane root system in the second crop season from an early stage.
In general, it can be observed that the soil nitrate leachate fluxes were highly sensitive to rainfall variability in the heavy rainfall scenario. However, according to Figure 11, the nitrate-N leaching curves of fertilizer treatments were different in the two crop seasons. No clear difference could be seen in nitrate-N leaching curves of the BL treatment with other fertilizer-applied treatments in plant cane season when the ratio of time that leached nitrate-N equaled or exceeded was less than 0.3. However, in the ratoon season, a clear difference was observed for the nitrate-N leaching curve in the BL condition than with other treatments (Figure 11). In addition, Figure 11 indicates that the N-leaching curves for the BL condition were similar in both seasons, especially when the ratio of time that leached nitrate-N equaled or exceeded was less than 0.5. The differences in sugarcane N uptake during the two crop seasons can be the result for the above observations. As the higher stalk number of ratoon has resulted in high nitrate-N uptake in vegetation-available lysimeters, it has caused lower nitrate-N leaching from them compared to the BL lysimeter in which no vegetation was maintained.

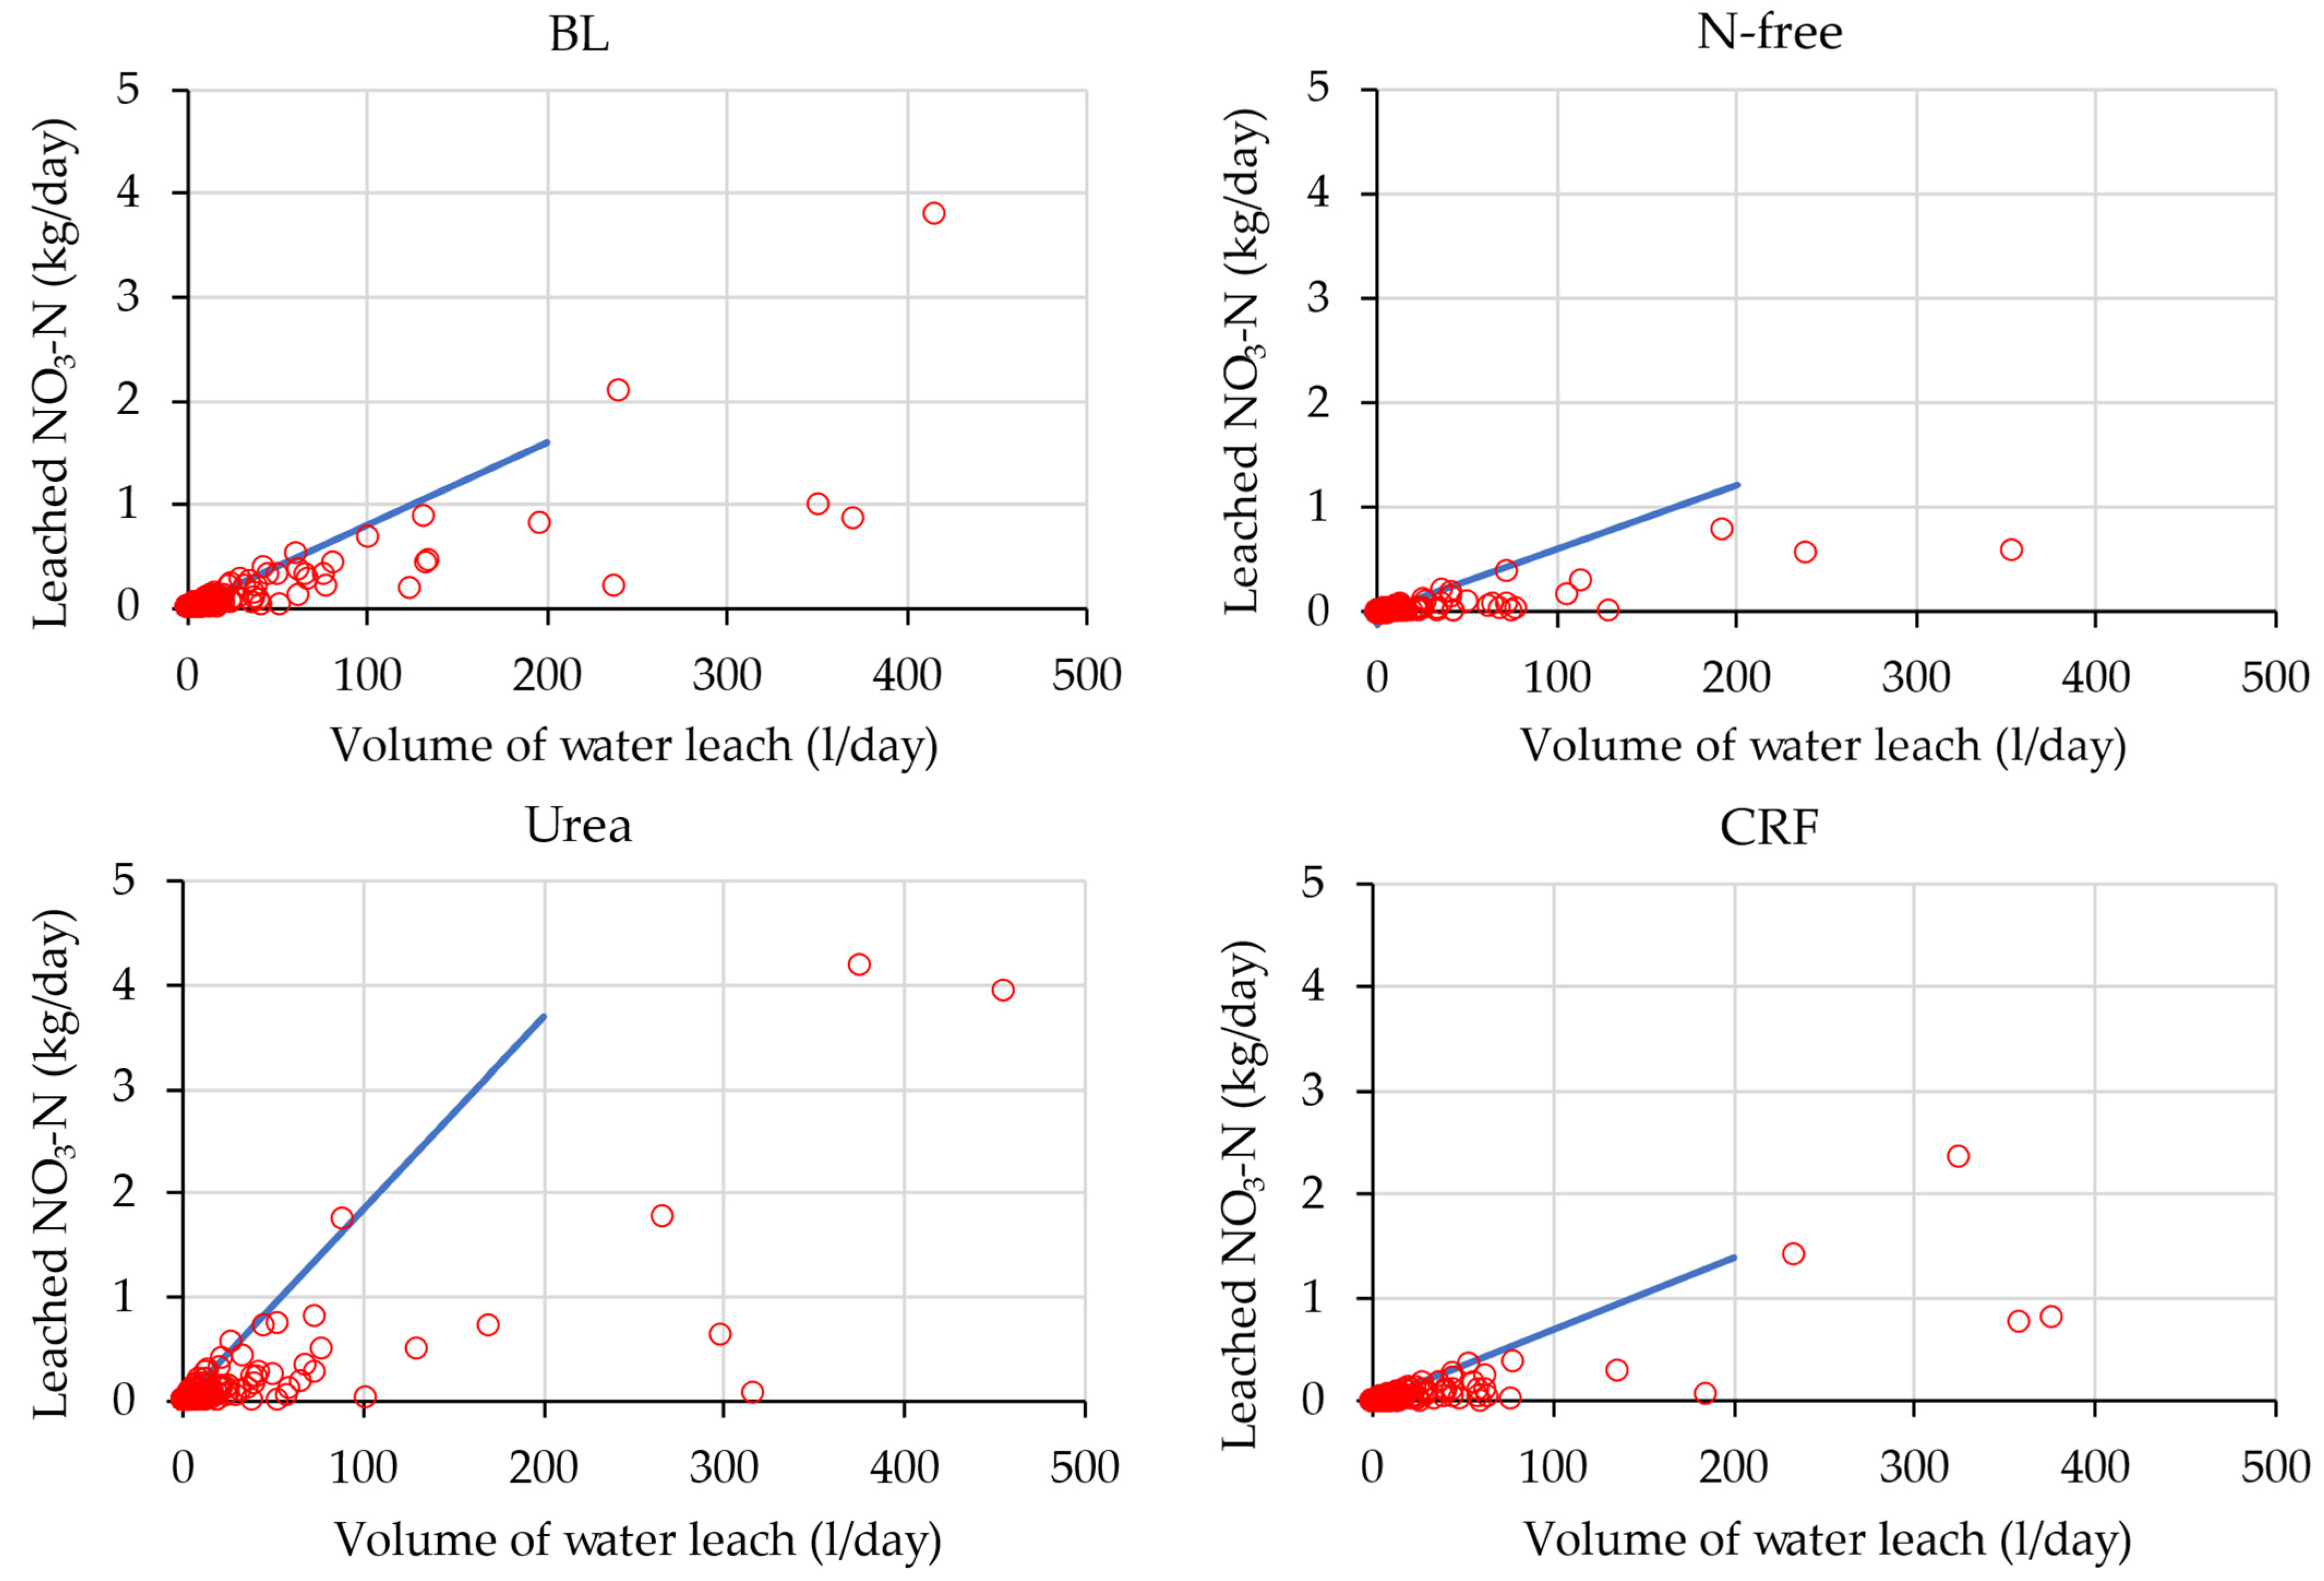
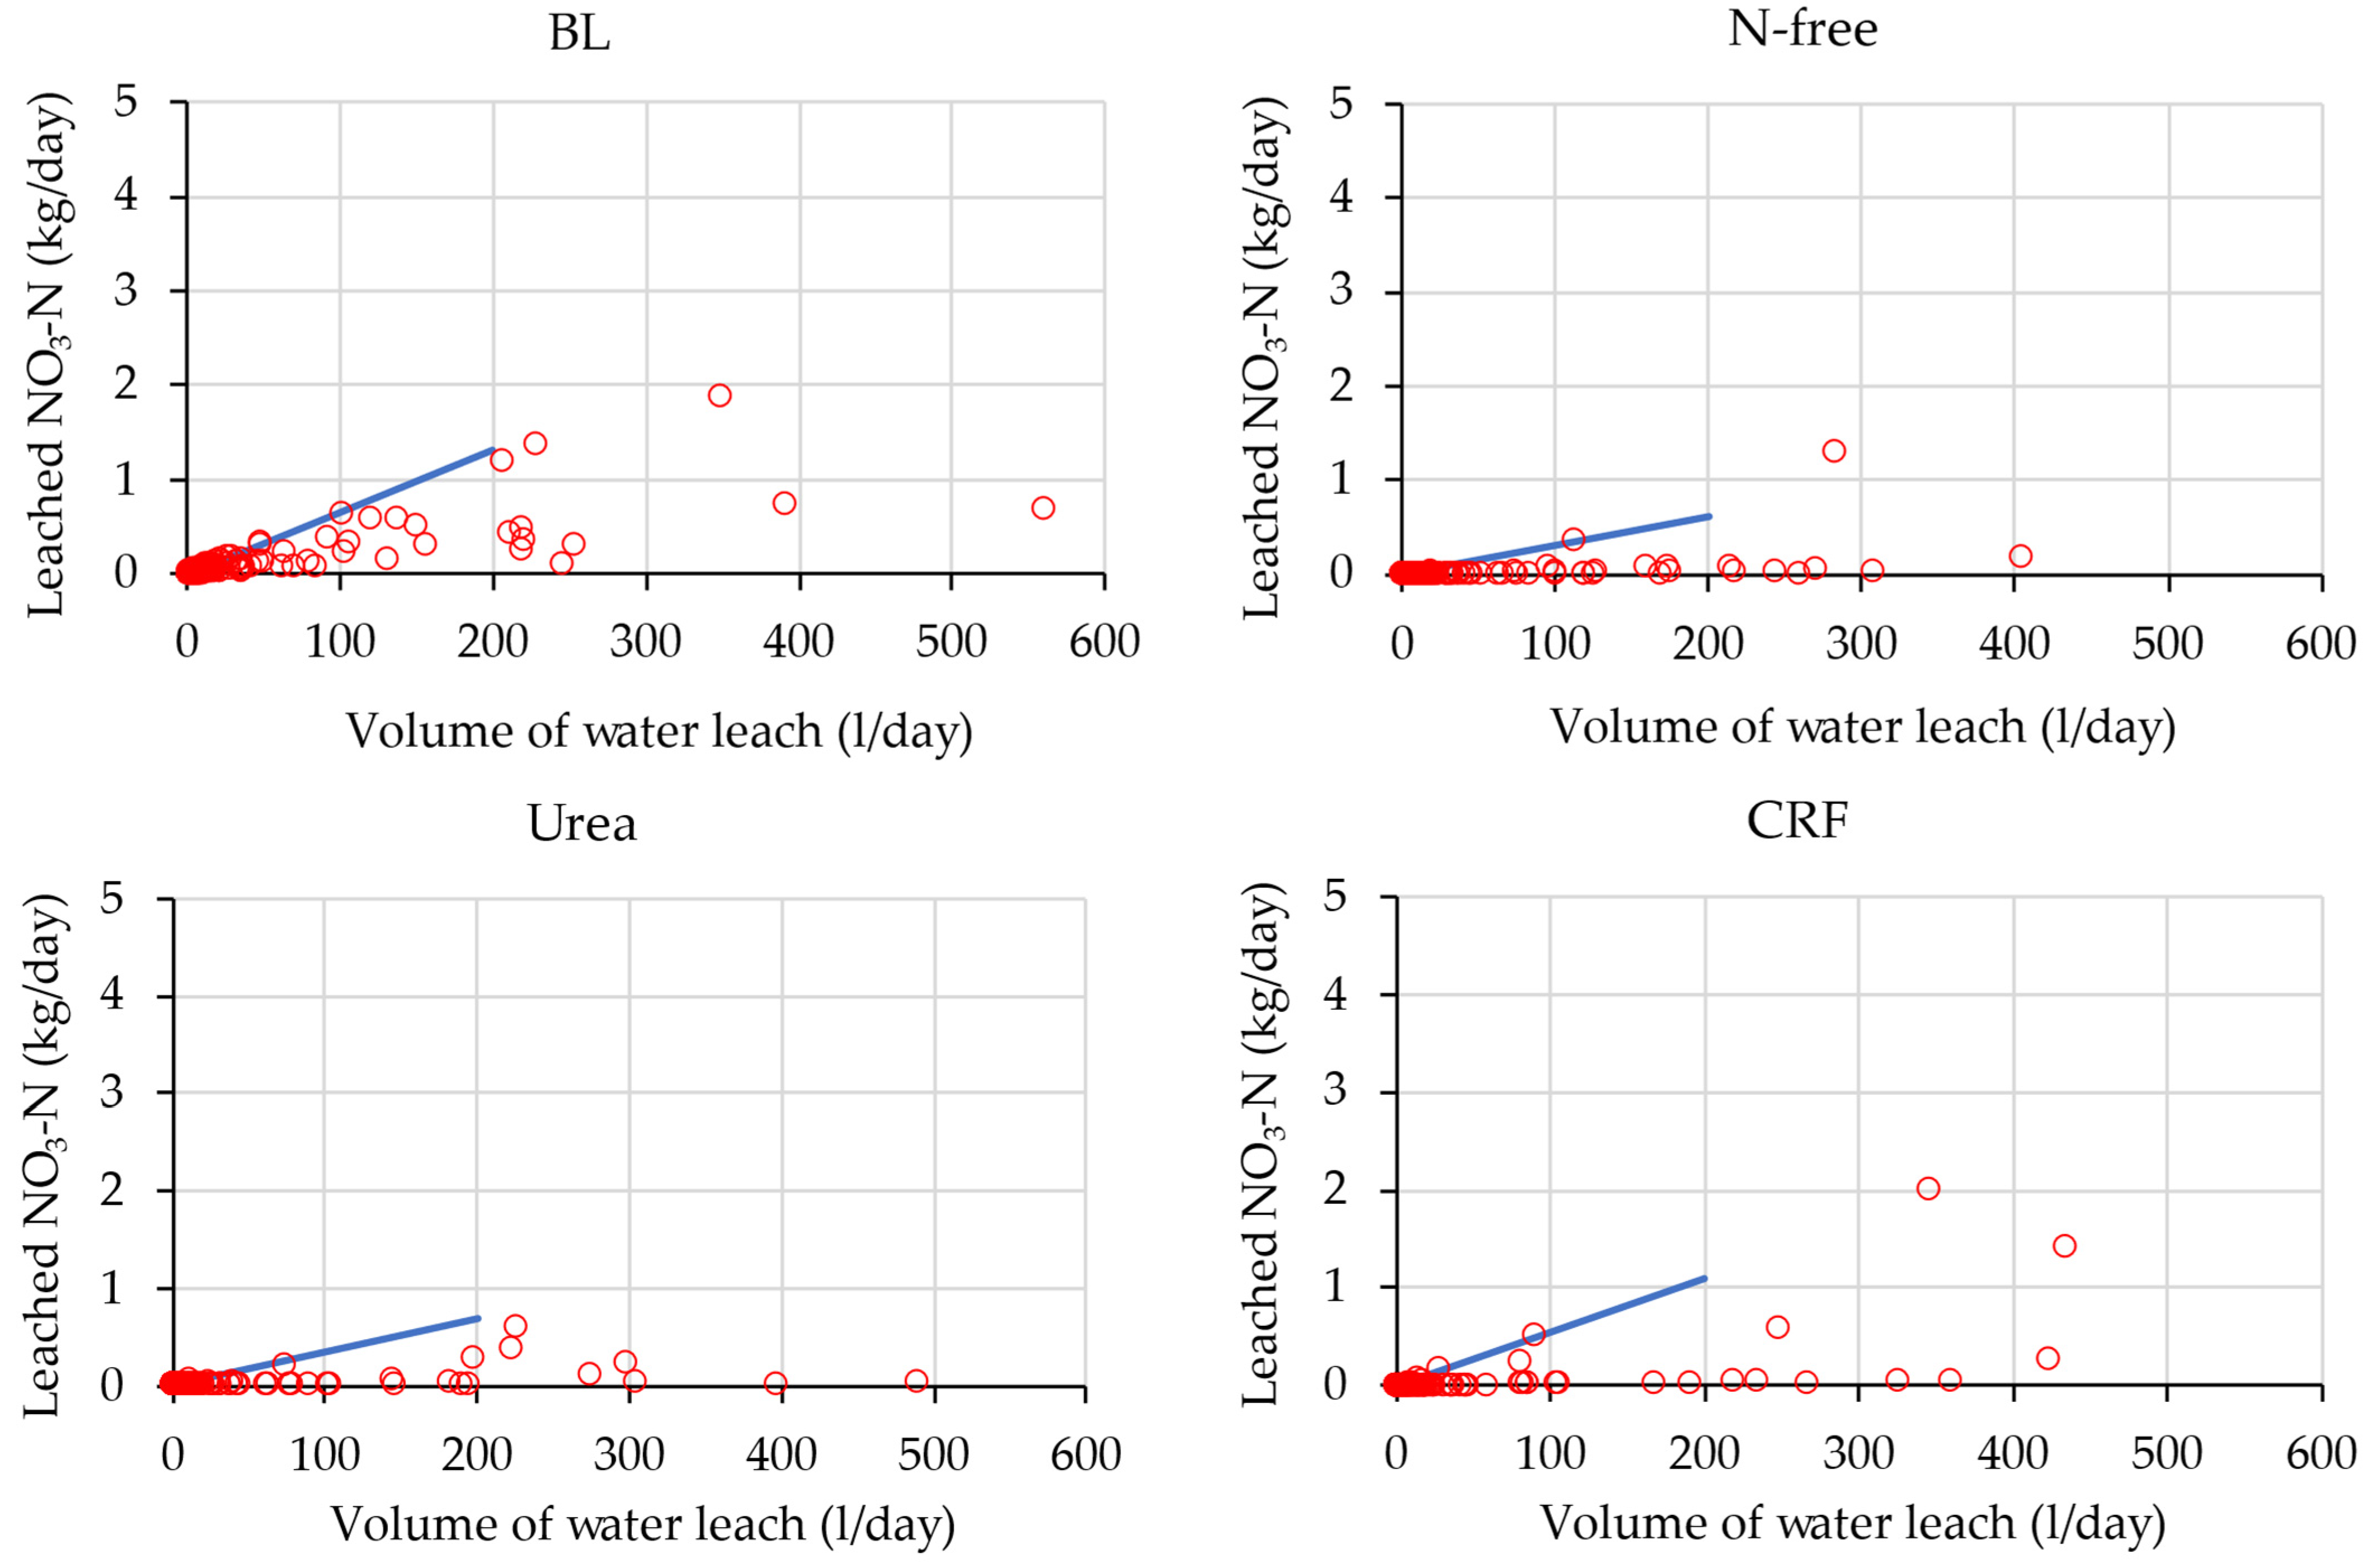
Evaluation of Envelop Lines of Water Leaching and Nitrate-N Leaching of Low Leaching Events

Nitrate leaching from soil is determined by the soil nitrate concentration and the solute transport flux [70]. It can be stated that nitrate-N leaching should be influenced by water leaching. Thus, we analyzed the characteristics of the relationship between daily water leaching and daily nitrate-N leaching in Figure 12 and Figure 13. In all graphs, no clear characteristics for the relationship between water leaching and nitrate-N leaching could be observed. The number of high leaching events whose water leaching rate was larger than 100 L/day was small. Therefore, we focused on low leaching events of under 100 L/day (Figure 12 and Figure 13). Thus, we drew upper envelop lines and compared the slope of these lines.
According to Figure 12 and Figure 13, the difference between the leaching rate of BL-treated lysimeters was not large in the two seasons. However, the characteristics of low leaching events of fertilizer-applied treatments were different in two crop seasons. For N-free-, urea-, and CRF-treated lysimeters, leaching in the ratoon season was small compared to that in the plant cane season. For instance, the urea treatment in the plant cane season showed a higher gradient of the upper envelop line (Figure 12), indicating higher leaching loss than in the ratoon season in water leaching events of the same scale. This is because, as mentioned previously, a more than three times the number of stalks was recorded in the ratoon season at 90 DAP than in the plant cane season (Figure 4 and Figure 5), which has resulted in heavy N uptake and lower nitrate leaching in plant cane compared to ratoon season.
However, comparing the two seasons, Figure 12 and Figure 13 show that the urea treatment in the plant cane season had higher leaching loss than the CRF treatment while this condition is reversed in ratoon season. Figure 8 also shows that cumulative nitrate-N leaching for urea application was higher than that for CRF application in the plant cane season, and that ratoon season was higher in CRF application compared to urea application. The N release rates of CRF and urea over the crop cycle were different from each other: Tsuihimeijin CRF controls the nutrient release rate and subsequent leaching while urea dissolves quickly in soil water and results in leaching. Therefore, higher nitrate-N leaching was observed in the urea condition compared to the CRF condition in plant cane season. Considering the ratoon, as the N uptake started in the early growth stage soon after fertilizing, nitrate leaching had become small and nitrate leaching in the urea condition and the CRF condition were similar (Figure 11). However, the higher cumulated nitrate-N leaching that occurred in the CRF condition than in urea condition in ratoon season was due to one rainfall event that occurred near 90 DAP (Figure 8). Therefore, we concluded that the characteristics of nitrate-N leaching for CRF and urea treatments in ratoon season were similar in this experiment.

4.3. WF of Sugarcane Cultivation

The sugarcane WFproc,grey of the plant cane season (CRF: 17.28 m3/t, urea: 44.99 m3/t) (Table 4) indicated that more than twice the water volume is required to assimilate the pollutant load derived from sugarcane cultivation for urea application to match the water quality standards of the area than for the CRF application. According to Scholten W, 2009, as cited in Fito et al. [71], the proportion of the grey WF to the total sugarcane WF in different countries ranges between 4% and 11%. Our obtained results for the plant cane season indicated that the contribution of the grey WF of the CRF treatment to the total WF was 8.98% while that of the urea treatment was 19.27%, more than two times higher than the former. For the ratoon season, the contribution of the grey WF of both CRF (i.e., 3.03%) and urea (i.e., 1.23%) treatments to the total WF was lower than 4% for the plant cane season as well.
The WF of sugarcane is the total water allocation for cultivating sugarcane which indicates that the same particular water amount cannot be utilized for another requirement. In Mekonnen and Hoekstra [72], 210 m3/t was listed as the global average consumptive sugarcane WF. For both crop seasons, the sugarcane WF of the CRF application (plant cane: 192.33 m3/t, ratoon: 190.47 m3/t) (Table 4) was lower than the global average consumptive WF while that of the urea application (plant cane: 233.47 m3/t, ratoon: 237.59 m3/t) (Table 4) was higher than the global average consumptive WF. Therefore, the obtained WF values clearly indicated that CRF application had a lower impact on the GW resources of the area than urea application; the results also showed the potential of CRF to reduce GW contamination.

Sustainability Assessment on Obtained WFs of Sugarcane Cultivation

According to Hoekstra et al. [30], a sustainability assessment is focused on comparing the footprints of humans with the Earth’s carrying capacity. A particular process would have an unsustainable WF if its WF were to contribute to a hotspot or the WF could be reduced or avoided [73]. Therefore, unsustainable WFs should be reduced or avoided, irrespective of the geographic context. Increasing pressure on water resources in water-scarce regions can be reduced by minimizing WFs by increasing water productivity [74]. Green WF reduction in rainfed agriculture anywhere in the world would result in an increase in productivity and help to relieve pressure on water resources in a global context [30]. Thus, there is a great need to reduce the WF per ton of products everywhere when possible.
The green WF of growing a crop in rainfed agriculture can be reduced by improving fertilizer management practices. According to our study, the adoption of CRF use in rainfed sugarcane cultivation would result in higher land productivity (yield, ton/ha), water productivity (ton/m3), and a reduced green WF (m3/ton). This may cause a reduction in production requirements as well as the threat to land and water resources in another region, which would reduce the blue WF of crop production in the global context. The grey WF in agricultural operations also can be largely reduced by adopting precision agricultural practices [75] such as applying fewer or no chemicals, optimizing the timing and techniques of chemical application, and practicing organic farming. Our study clearly indicated that there is a great potential to reduce the grey WF of sugarcane farming via CRF application instead of urea application.
Ensuring the sustainability of the WF of growing sugarcane in Okinawa is important to reduce the pressure on the limited blue water resources in the area. Improving the green water productivity of sugarcane farming in the area would reduce its green WF. Grey WF reduction would help to minimize GW pollution and conserve scarce water resources for drinking purposes. Further, this would help to achieve the United Nations Sustainable Development Goal (SGD) 6—“Clean water and sanitation: Ensure the availability and sustainable management of water and sanitation for all”—and SGD 12—“Responsible consumption and production: To ensure sustainable consumption and production patterns”.

5. Conclusions

We conducted a lysimeter field experiment on four fertilizer application rates (non-vegetation or bare land, P and K fertilizer application without N, urea application, and CRF application) for both sugarcane plant cane and ratoon seasons and confirmed the effectiveness of CRF at balancing sugarcane yield and reducing nitrate leaching to GW. For both plant cane and ratoon, the total sugarcane dry weight obtained for CRF was higher compared to urea application. Higher cumulative nitrate-N leaching was observed in the plant cane season than in the ratoon season. For the total crop cycle (plant cane plus ratoon), heavy nitrate-N leaching was observed in the urea-applied condition than in the CRF-applied condition. More importantly, for the total sugarcane crop cycle, a higher WF (plant cane: 233.47 m3/t, ratoon: 237.59 m3/t) was obtained for the urea-applied condition than the CRF-applied condition (plant cane: 192.33 m3/t, ratoon: 190.47 m3/t), indicating the negative impact of urea application on GW. Therefore, we conclude that CRF is a positive alternative to urea fertilizer application for environmental burden reduction and GW conservation while maintaining realistic yields.

Supplementary Materials

The following supporting information can be downloaded at: https://www.mdpi.com/article/10.3390/agronomy12030695/s1, Table S1: Comparison of TDW of treatments between plant cane and ratoon season; Table S2: Comparison of TDW between treatments in plant cane season; and Table S3: Comparison of TDW between treatments in ratoon season.

Author Contributions

Conceptualization, methodology and formal analysis, R.H.K.R., K.S. and K.O.; investigation and writing—original draft preparation, R.H.K.R.; writing—review and editing, R.H.K.R. and W.B.M.A.C.B.; supervision, K.S., K.O., S.K., T.H., T.N. and H.S. All authors have read and agreed to the published version of the manuscript.

Funding

This research received no external funding.

Data Availability Statement

Data is contained within the article.

Acknowledgments

We would like to acknowledge the Tropical Agriculture Research Front (TARF), Japan International Research Center for Agricultural Sciences (JIRCAS), Okinawa, Japan for the exceptional support that allowed us to conduct this research.

Conflicts of Interest

The authors declare no conflict of interest.

References

  1. Prasertsak, P.; Freney, J.R.; Denmead, O.T.; Saffigna, P.G.; Prove, B.G.; Reghenzani, J.R. Effect of Fertilizer Placement on Nitrogen Loss from Sugarcane in Tropical Queensland. Nutr. Cycl. Agroecosyst. 2002, 62, 229–239. [Google Scholar] [CrossRef]
  2. Wang, W.; Park, G.; Reeves, S.; Zahmel, M.; Heenan, M.; Salter, B. Nitrous Oxide Emission and Fertiliser Nitrogen Efficiency in a Tropical Sugarcane Cropping System Applied with Different Formulations of Urea. Soil Res. 2016, 54, 572–584. [Google Scholar] [CrossRef] [Green Version]
  3. Buss, S.R.; Rivett, M.O.; Morgan, P.; Bemment, C.D. Using Science to Create a Better Place: Attenuation of Nitrate in the Sub-Surface Environment; Waterside Drive, Aztec West Almondsbury: Bristol, UK, 2005. [Google Scholar]
  4. Killpack, S.C.; Buchholz, D. Nitrogen in the Environment: Leaching. Available online: https://extension.missouri.edu/publications/wq262 (accessed on 5 March 2022).
  5. Fernandez, F.G.; Kaiser, D.E. Understanding Nitrogen in Soils. 2021. Available online: https://extension.umn.edu/nitrogen/understanding-nitrogen-soils#nitrification-761161 (accessed on 4 March 2022).
  6. University of Nebraska. Section D: What Happens When Nitrogen Is Applied to The Soil? Available online: https://water.unl.edu/documents/Section%20D.pdf (accessed on 5 March 2022).
  7. International Plant Nutrition Institute (IPNI). Nitrate Leaching. Available online: http://www.ipni.net/publication/nitrogen-en.nsf/0/FDEE48CFF7600CE585257C13004C7BB0/$FILE/NitrogenNotes-EN-03.pdf (accessed on 4 March 2022).
  8. Provin, T.L.; Hossner, L.R. What Happens to Nitrogen in Soils? Available online: https://agrilifeextension.tamu.edu/library/gardening/what-happens-to-nitrogen-in-soils/ (accessed on 5 March 2022).
  9. Johnson, C.; Albrecht, G.; Ketterings, Q.; Beckman, J.; Stockin, K. Nitrogen Basics—The Nitrogen Cycle Agronomy Fact Sheet Series; Cornell University: New York, NY, USA, 2005. [Google Scholar]
  10. Bernhard, A. The Nitrogen Cycle: Processes, Players, and Human Impact. Nat. Educ. Knowl. 2010, 3, 25. [Google Scholar]
  11. Norton, J.M. Nitrification in Agricultural Soils. In Nitrogen in Agricultural Systems; Schepers, J.S., Raun, W.R., Eds.; American Society of Agronomy, Crop Science Society of America, Soil Science Society of America: Madison, WI, USA, 2008; Volume 49, pp. 173–199. [Google Scholar] [CrossRef]
  12. Myrold, D.D.; Bottomley, P.J. Nitrogen Mineralization and Immobilization. In Nitrogen in Agricultural Systems; Schepers, J.S., Raun, W.R., Eds.; American Society of Agronomy, Crop Science Society of America, Soil Science Society of America: Madison, WI, USA, 2008; Volume 49, pp. 157–172. [Google Scholar] [CrossRef]
  13. Plant and Soil Sciences eLibrary. Soils—Part 5: Nitrogen as a Nutrient. Available online: https://passel2.unl.edu/view/lesson/3176eba1ba31/2 (accessed on 4 March 2022).
  14. Sousa, J.R.; Cabral, F.; Coutinho, J. Assessment of N Mineralization and N Leaching in Soil Using a New in situ Incubation Method. Commun. Soil Sci. Plant Anal. 2016, 47, 2157–2167. [Google Scholar] [CrossRef]
  15. Dawes, M.A.; Schleppi, P.; Hättenschwiler, S.; Rixen, C.; Hagedorn, F. Soil warming opens the nitrogen cycle at the alpine treeline. Glob. Change Biol. 2017, 23, 421–434. [Google Scholar] [CrossRef]
  16. Vitousek, P.M.; Porder, S.; Houlton, B.Z.; Chadwick, O.A. Terrestrial phosphorus limitation: Mechanisms, implications, and nitrogen-phosphorus interactions. Ecol. Appl. 2010, 20, 5–15. [Google Scholar] [CrossRef] [Green Version]
  17. Gan, H.Y.; Schöning, I.; Schall, P.; Ammer, C.; Schrumpf, M. Soil Organic Matter Mineralization as Driven by Nutrient Stoichiometry in Soils Under Differently Managed Forest Stands. Front. For. Glob. Change 2020, 3, 99:1–99:15. [Google Scholar] [CrossRef]
  18. Fu, M.H.; Xu, X.C.; Tabatabai, M.A. Effect of pH on nitrogen mineralization in crop-residue-treated soils. Biol. Fertil. Soils 1987, 5, 115–119. [Google Scholar] [CrossRef]
  19. Matsuoka, M. Sugarcane Cultivation and Sugar Industry in Japan. Sugar Tech. 2006, 8, 3–9. [Google Scholar] [CrossRef]
  20. Verburg, K.; Harvey, T.G.; Muster, T.H.; Brennan McKellar, L.; Thorburn, P.; Biggs, J.; Di Bella, L.; Wang, W. Use of Enhanced Efficiency Fertilisers to Increase Fertiliser Nitrogen Use Efficiency in Sugarcane. In A Review of Nitrogen Use Efficiency in Sugarcane; Bell, M.J., Ed.; Sugar Research Australia: Indooroopilly, Australia, 2015; pp. 229–280. [Google Scholar]
  21. Yoshimoto, S.; Tsuchihara, T.; Ishida, S.; Masumoto, T.; Imaizumi, M. Groundwater Flow and Transport and Potential Sources of Groundwater Nitrates in the Ryukyu Limestone as a Mixed Flow Aquifer in Okinawa Island, Japan. Paddy Water Environ. 2011, 9, 367–384. [Google Scholar] [CrossRef]
  22. Seiko, S. A Report from Miyako Island: What Is Happening on the Small Islands of Okinawa? Available online: https://www.ecojesuit.com/a-report-from-miyako-island-what-is-happening-on-the-small-islands-of-okinawa/ (accessed on 10 January 2021).
  23. Shimoji, N.; Kawata, S.; Hiyane, M.; Kadekari, S. For Protecting the Life Sustaining Groundwater of Miyako Island: The Development of an Environmentally Friendly Organic Fertilizer Utilizing Phosphorus Accumulated in the Soil. In Proceedings of the 6th Pacific Islands Leaders Meeting (PALM6), Miyakojima, Japan, 23–26 May 2012. [Google Scholar]
  24. Miyakojima City Office. Miyakojima City Groundwater Quality Conservation Survey Report. 2011. (In Japanese). Available online: https://www.city.miyakojima.lg.jp/kurashi/seikatsu/kankyohozen/files/H26rep.pdf (accessed on 15 January 2021).
  25. Pastore, M. The Impact of Nitrogen Eutrophication on Caribbean Coral Reefs: A Review. Concept 2014, 37. Available online: https://concept.journals.villanova.edu/index.php/concept/article/view/1725/1592/ (accessed on 4 March 2022).
  26. Fujiie, R.; Nakagawa, Y.; Shima, T.; Shiono, T.; Shinogi, Y. Estimation of Leached Nitrate-Nitrogen in Groundwater Basin, Miyako Island [Japan]. AGRIS 2008, 127–138. Available online: https://agris.fao.org/agris-search/search.do?recordID=JP2008003564 (accessed on 4 March 2022).
  27. Agata, S. Chemical Characteristics and Isotopic Compositions of Spring and River Waters in Okinawa Island. Chikyukagaku 2001, 45, 27–41. [Google Scholar]
  28. Nakagawa, Y.; Yan, C.; Shiono, T.; Miyamoto, T.; Kameyama, K.; Shinogi, Y. Evaluating the Validity and Sensitivity of the DNDC Model for Shimajiri Dark Red Soil. Japan Agric. Res. Q. 2008, 42, 163–172. [Google Scholar] [CrossRef] [Green Version]
  29. Shuhei, Y. Dynamics of Groundwater Nitrates in Limestone Aquifer of the Southern Okinawa Island. In Agricultural and Industrial Research Report; National Agriculture and Food Research Organization (NARO): Tsukuba, Japan, 2013; Volume 52, pp. 59–110. [Google Scholar]
  30. Hoekstra, A.Y.; Chapagain, A.K.; Aldaya, M.M.; Mekonnen, M.M. The Water Footprint Assessment Manual. Setting the Global Standard; Earthscan: Longdon, UK, 2011; ISBN 978-1-84971-279-8. [Google Scholar]
  31. Kongboon, R.; Sampattagul, S. The Water Footprint of Sugarcane and Cassava in Northern Thailand. Procedia—Soc. Behav. Sci. 2012, 40, 451–460. [Google Scholar] [CrossRef] [Green Version]
  32. Scarpare, F.V.; Hernandes, T.A.D.; Ruiz-Corrêa, S.T.; Kolln, O.T.; Gava, G.J.D.C.; Dos Santos, L.N.S.; Victoria, R.L. Sugarcane Water Footprint under Different Management Practices in Brazil: Tietê/Jacaré Watershed Assessment. J. Clean. Prod. 2016, 112, 4576–4584. [Google Scholar] [CrossRef]
  33. Del Milagro Jorrat, M.; Araujo, P.Z.; Mele, F.D. Sugarcane Water Footprint in the Province of Tucumán, Argentina. Comparison between Different Management Practices. J. Clean. Prod. 2018, 188, 521–529. [Google Scholar] [CrossRef]
  34. Hossain, M.A.; Ueno, M.; Maeda, K.; Kawamitsu, Y. Potential Evapotranspiration and Crop Coefficient Estimates for Sugarcane in Okinawa. J. Agric. Mereorol. 2005, 60, 573–576. [Google Scholar] [CrossRef] [Green Version]
  35. Bellido, J.; Sakai, K.; Nakamura, S.; Kazuro, M.; Okamoto, K.; Nakandakari, T. N2O Emissions from Shimajiri-Maji (Calcaric Dark Red Soil) after Applying Two Chemical Fertilizers. Appl. Ecol. Environ. Res. 2015, 13, 339–348. [Google Scholar] [CrossRef]
  36. Hamazaki, T. Diversity of Soils and Soil Management Measures in Tropical and Subtropical Islands. In Proceedings of the JIRCAS 2005 International Symposium, Ishigaki, Japan, 11 March 2005; pp. 83–96. [Google Scholar]
  37. Verburg, K.; Muster, T.H.; Zhao, Z.; Biggs, J.S.; Thorburn, P.J.; Kandulu, J.; Wittwer-Schmid, K.; McLachlan, G.; Bristow, K.L.; Poole, J.; et al. Role of Controlled Release Fertilizer in Australian Sugarcane Systems: Final Report 2014/011; Sugar Research Australia Limited: Indooroopilly, Australia, 2017. [Google Scholar]
  38. Visiongain. Controlled-Release Fertilizers Market Report to 2031. 2021. Available online: https://www.visiongain.com/controlled-release-fertilizers-market-analysis/ (accessed on 5 March 2022).
  39. Subbarao, C.V.; Kartheek, G.; Sirisha, D. Slow Release of Potash Fertilizer through Polymer Coating. Int. J. Appl. Sci. Eng. 2013, 11, 25–30. [Google Scholar]
  40. Trenkel, M.E. Slow and Controlled-Release and Stabilized Fertilizers: An Option for Enhancing Nutrient Efficiency in Agriculture, 2nd ed.; International Fertilizer Industry Association: Paris, France, 2010; ISBN 978-2-9523139-7-1. [Google Scholar]
  41. Kubotera, H.; Wada, S.-I. An experimental method for the direct measurement of nitrate retention of soils in conditions similar to the field. Jpn. Soc. Pedol. 2008, 52, 118–125. [Google Scholar] [CrossRef]
  42. Wong, M.T.; Hughes, R.; Rowell, D.L. Retarded leaching of nitrate in acid soils from the tropics: Measurement of the effective anion exchange capacity. J. Soil Sci. 1990, 41, 655–663. [Google Scholar] [CrossRef]
  43. Bray, R.H.; Kurt, L.T. Determination of total, organic, and available forms of phosphorus in soils. Soil Sci. 1945, 59, 39–45. [Google Scholar] [CrossRef]
  44. Japanese Ministry of Environment, Environmental Quality Standards for Water Pollution. Available online: https://www.env.go.jp/en/water/wq/wp.pdf (accessed on 24 January 2021).
  45. Nakanishi, Y.; Yamamoto, Y.; Park, K.L.; Kato, S.; Kumazawa, K. Estimation and Verification of Origins of Groundwater Nitrate by Using delts 15N Values. Jpn. J. Soil Sci. Plant Nutr. 1995, 66, 544–551. (In Japanese) [Google Scholar]
  46. R Core Team. R: A Language and Environment for Statistical Computing; R Foundation for Statistical Computing: Vienna, Austria, 2021; Available online: https://www.R-project.org/ (accessed on 4 March 2022).
  47. De Mendiburu, F. Agricolae: Statistical Procedures for Agricultural Research. R Package Version 1.3-5. 2021. Available online: https://cran.r-project.org/package=agricolae (accessed on 4 March 2022).
  48. Food and Agriculture Organization (FAO). CropWat. Available online: http://www.fao.org/land-water/databases-and-software/cropwat/en/ (accessed on 24 January 2021).
  49. Santos, F.; Diola, V. Chapter 2-Physiology. In Sugarcane: Agricultural Production, Bioenergy and Ethanol; Borem, A., Caldas, C., Eds.; Academic Press: San Diego, CA, USA, 2015; pp. 13–33. ISBN 978-0-12-802239-9. [Google Scholar]
  50. Dinh, T.H.; Watanabe, K.; Takaragawa, H.; Nakabaru, M.; Kawamitsu, Y. Photosynthetic Response and Nitrogen Use Efficiency of Sugarcane under Drought Stress Conditions with Different Nitrogen Application Levels. Plant Prod. Sci. 2017, 20, 412–422. [Google Scholar] [CrossRef] [Green Version]
  51. El-Hinnawy, H.H.; Masri, M.I. Crop Cycle Effects on Genetic Variability, Heritability, and Yield of Sugarcane. J. Plant Prod. 2009, 34, 6749–6761. [Google Scholar] [CrossRef]
  52. United States Department of Agriculture (USDA)-Natural Resources Conservation Service. Carbon to Nitrogen Ratios in Cropping Systems Introduction. Available online: https://www.nrcs.usda.gov/Internet/FSE_DOCUMENTS/stelprdb1166766.pdf (accessed on 10 December 2020).
  53. Swangjang, K. Soil Carbon and Nitrogen Ratio in Different Land Use. In Proceedings of the International Conference on Advances in Environment Research, Jeju, Korea, 29–30 July 2015; pp. 36–40. [Google Scholar]
  54. Brust, G.E. Chapter 9—Management Strategies for Organic Vegetable Fertility. In Safety and Practice for Organic Food; Biswas, D., Micallef, S.A., Eds.; Academic Press: Cambridge, MA, USA, 2019; pp. 193–212. ISBN 978-0-12-812060-6. [Google Scholar]
  55. Meter Environment. How to Measure Soil Hydraulic Conductivity—Which Method Is Right for You? Available online: https://www.metergroup.com/en/meter-environment/measurement-insights/how-measure-soil-hydraulic-conductivity-which-method-right-you (accessed on 5 March 2022).
  56. Bagarello, V.; Castellini, M.; Iovino, M. Influence of the pressure head sequence on the soil hydraulic conductivity determined with tension infiltrometer. Appl. Eng. Agric. 2005, 21, 383–391. [Google Scholar] [CrossRef]
  57. Hallaq, A.H. The impact of soil texture on nitrates leaching into groundwater in the north governorate, Gaza strip. J. Soc. Sci. 2010, 38, 11–35. [Google Scholar]
  58. Magdoff, F.; Van Es, H. Building Soils for Better Crops: Ecological Management for Healthy Soils, 4th ed.; Sustainable Agriculture Research and Education (SARE) Program: Maryland, MD, USA, 2021; Volume 10. [Google Scholar]
  59. Kubotera, H.; Wada, S.-I. Factors influencing nitrate retention in 3 Andisol profiles in Kyushu, Japan. In Proceedings of the 19th World Congress of Soil Science for a Changing World, Brisbane, Australia, 1–6 August 2010; pp. 66–69. [Google Scholar]
  60. Nicol, G.W.; Leininger, S.; Schleper, C.; Prosser, J.I. The influence of soil pH on the diversity, abundance and transcriptional activity of ammonia oxidizing archaea and bacteria. Environ. Microbiol. 2008, 10, 2966–2978. [Google Scholar] [CrossRef]
  61. Soil Quality Pty Ltd. Soil Acidity|Fact Sheets. 2021. Available online: https://soilquality.org.au/factsheets/soil-acidity (accessed on 25 November 2021).
  62. Koumanov, K.S.; Stoilov, G.P.; Dochev, D.V. The ‘nitrate nitrogen—Electrical conductivity’ relationship in non-saline soils under fertigation. In Proceedings of the ICID 19th European Regional Conference “Sustainable Use of Land and Water”, Brno and Prague, Czech Republic, 4–8 June 2001. [Google Scholar]
  63. Verburg, K.; Keating, B.A.; Probert, M.E.; Bristow, K.L.; Huth, N.I. Nitrate Leaching under Sugarcane: Interactions between Crop Yield, Soil Type and Management Strategies. In Proceedings of the 9th Australian Agronomy Conference, Wagga, Australia, 20–23 July 1998; pp. 717–720. [Google Scholar]
  64. Iqbal, M.T. Study on Vertical and Lateral Leaching of Nitrate from a Wheat Field in China. Turkish J. Agric. For. 2006, 30, 59–65. [Google Scholar]
  65. Kameyama, K.; Miyamoto, T.; Shinogi, Y. Increases in Available Water Content of Soils by Applying Bagasse-Charcoals. In Proceedings of the 19th World Congress of Soil Science, Soil Solutions for a Changing World, Brisbane, Australia, 1–6 August 2010; pp. 105–108. [Google Scholar]
  66. Chen, J.; Wei, X. Controlled-Release Fertilizers as a Means to Reduce Nitrogen Leaching and Runoff in Container-Grown Plant Production. In Nitrogen in Agriculture: Updates; Amanullah, K., Fahad, S., Eds.; InTech: Rijeka, Croatia, 2018; pp. 33–52. ISBN 978-953-51-3769-6. [Google Scholar]
  67. Aranibar, J.N.; Otter, L.; Macko, S.A.; Feral, C.J.W.; Epstein, H.E.; Dowty, P.R.; Eckardt, F.; Shugart, H.H.; Swap, R.J. Nitrogen Cycling in the Soil-Plant System along a Precipitation Gradient in the Kalahari Sands. Glob. Change Biol. 2004, 10, 359–373. [Google Scholar] [CrossRef]
  68. Gu, C.; Riley, W.J. Combined Effects of Short Term Rainfall Patterns and Soil Texture on Soil Nitrogen Cycling—A Modeling Analysis. J. Contam. Hydrol. 2010, 112, 141–154. [Google Scholar] [CrossRef] [PubMed] [Green Version]
  69. Ridolfi, E.; Kumar, H.; Bárdossy, A. A methodology to estimate flow duration curves at partially ungauged basins. Hydrol. Earth Syst. Sci. 2020, 24, 2043–2060. [Google Scholar] [CrossRef] [Green Version]
  70. Cameron, K.C.H.; Di, J.; Moir, J.L. Nitrogen losses from the soil/plant system: A review. Ann. Appl. Biol. 2013, 162, 145–173. [Google Scholar] [CrossRef]
  71. Fito, J.; Tefera, N.; Demeku, S.; Kloos, H. Water Footprint as an Emerging Environmental Tool for Assessing Sustainable Water Use of the Bioethanol Distillery at Metahara Sugarcane Farm, Oromiya Region, Ethiopia. Water Conserv. Sci. Eng. 2017, 2, 165–176. [Google Scholar] [CrossRef] [Green Version]
  72. Mekonnen, M.M.; Hoekstra, A.Y. The Green, Blue and Grey Water Footprint of Crops and Derived Crop Products. Hydrol. Earth Syst. Sci. 2011, 15, 1577–1600. [Google Scholar] [CrossRef] [Green Version]
  73. Chico, D.; Zhang, G. Water Footprint Assessment of FMO’s Agribusiness Portfolio. 2015. Available online: https://waterfootprint.org/media/downloads/FMO_Sugar_supply_chain-WFN_-formatted.pdf (accessed on 4 March 2022).
  74. Chapagain, A.; Mathews, R. A Guide to Reducing the Water Footprint of Cotton Cultivation in India. 2017. Available online: https://waterfootprint.org/media/downloads/A_guide_to_reduce_water_footprint_of_cotton_cultivation.pdf (accessed on 4 March 2022).
  75. Borsato, E.; Sartori, L.; Tarolli, P.; Marinello, F. Decrease the Water Footprint using precision agriculture: A comparison between conventional and conservative agriculture. Geophys. Res. Abstr. 2018, 20, 769. [Google Scholar]
Figure 1. Variation in daily rainfall (mm), accumulated temperature (Accu. T), and radiation (MJ/m2) of two crop seasons in the experimental site.
Agronomy 12 00695 g001aAgronomy 12 00695 g001b
Figure 2. Experimental plots and lysimeter dimensions. Planting points are indicated with green dots.
Agronomy 12 00695 g002
Figure 3. Linear release patterns of CRF at 25 °C.
Agronomy 12 00695 g003
Figure 4. Variation in stalk height, stalk number, leaf number, and leaf age of plant cane. Bars represent standard error. Different letters indicate significant differences in measured growth parameters in DAP-wise related to different fertilizer applications obtained from ANOVA with LSD multiple range test (p < 0.05).
Agronomy 12 00695 g004
Figure 5. Variation in stalk height, stalk number, leaf number, and leaf age of ratoon. Bars represent standard error. Different letters indicate significant differences in measured growth parameters in DAP-wise related to different fertilizer applications obtained from ANOVA with LSD multiple range test (p < 0.05).
Agronomy 12 00695 g005
Figure 6. TDW obtained for different fertilizer treatment applications. Bars represent standard error. Different block letters indicate significant differences in TDW in season-wise (green block letters for plant cane and orange block letters for ratoon) obtained from ANOVA with LSD.
Agronomy 12 00695 g006
Figure 7. Daily variation in nitrate-N leaching of different fertilizer applications with rainfall.
Agronomy 12 00695 g007
Figure 8. Cumulative nitrate-N leaching variation in different fertilizer applications with rainfall.
Agronomy 12 00695 g008
Figure 9. Fertilizer-applied zones closed to the sugarcane plants in lysimeters.
Agronomy 12 00695 g009
Figure 10. (a) Relationship between the leached water and the ratio of the ratio of time that percolation water head equaled or exceeded during the plant cane and ratoon seasons; (b) Relationship between the rainfall and the ratio of time that rainfall equaled or exceeded during the plant cane and ratoon seasons.
Agronomy 12 00695 g010
Figure 11. Relationship between the leached nitrate-N and the ratio of time that leached nitrate-N equaled or exceeded during the plant cane and ratoon seasons.
Agronomy 12 00695 g011
Figure 12. Characteristics of the low leach events for the first season for plant cane. The blue line indicates the upper-side envelop in the low water leaching events.
Agronomy 12 00695 g012
Figure 13. Characteristics of the low leach events in the second season for the ratoon crop. The blue line indicates the upper-side envelop in the low water leaching events.
Agronomy 12 00695 g013
Table 1. Fertilizer application levels used as treatments (DAP: days after planting).
Fertilizer Treatment1st Fertilization
(at 30 DAP)
2nd Fertilization
(at 90 DAP)
NPK NPK
(kg/ha)(kg/ha)
Non-vegetation/bare land (BL)000000
P and K fertilizer application without N (N-free)0133501335
Urea/normal released fertilizer application10013351001335
Controlled release fertilizer (CRF) application2002569000
Note: N was applied as urea and (NH4)2SO4 (CRF); P was applied as P2O5; K was applied as K2O.
Table 2. Physical properties and texture classes of soil filled in lysimeters used for the study. Kh (near-saturated hydraulic conductivity at −2 cm suction rate); BL (bare land); N-free (P and K fertilizer application without N); urea; CRF (controlled release fertilizer); and Air dried MC% (Air dried moisture content %). Soil texture was derived according to the USDA classification based on soil textures.
TreatmentKh
(cm/s)
Soil DepthAir Dried MC (%)Bulk Density
(g/cm3)
Particle Size (%)Soil Texture
SandSiltClay
CoarseFine
BL0.0015615 cm1.841.3648.7815.3016.0719.85Coarse Sandy Loam
45 cm1.521.4053.5417.0511.6517.76Coarse Sandy Loam
N-free0.0003215 cm2.451.5047.3713.7410.3128.59Sandy Clay Loam
45 cm1.321.3453.5714.7416.5815.10Coarse Sandy Loam
Urea0.0002315 cm3.411.5039.8013.1512.7734.28Sandy Clay Loam
45 cm2.901.3639.4712.3914.7533.39Sandy Clay Loam
CRF0.0003415 cm2.611.6045.4413.2914.9926.28Sandy Clay Loam
45 cm2.641.5545.1514.829.7930.24Sandy Clay Loam
Table 3. Chemical properties of soil filled in lysimeters used for the study. BL (bare land); N-free (P and K fertilizer application without N); urea; CRF (controlled release fertilizer); NHC (Nitrate holding capacity); EC (Electrical conductivity); and Ex. Al (Exchangeable Al).
TreatmentSoil DepthNHC
(cmolc/kg)
pHEC
(mS/m)
P (mg/L)Ex. Al (cmolc/kg)
(KCL)(H2O)(Bray1)(Bray2)
BL15 cm0.1054.325.412.654.3236.800.78
45 cm0.1724.525.892.294.5233.160.29
N-free15 cm0.0514.726.212.694.7224.050.17
45 cm0.0544.315.831.584.3168.750.59
Urea15 cm0.0054.265.182.524.267.761.42
45 cm0.0294.685.713.914.689.860.25
CRF15 cm0.0084.595.643.454.5919.350.29
45 cm0.0064.645.952.764.6424.190.21
Table 4. WF values obtained for CRF and urea treatments for plant cane and ratoon seasons.
SeasonFertilizer
Treatment
WFproc,green
(m3/t)
WFproc,grey
(m3/t)
WFproc,sugarcane
(m3/t)
Plant caneCRF175.0517.28192.33
Urea188.4744.99233.47
RatoonCRF185.125.79190.47
Urea234.662.93237.59
Table 5. The total soil C (TCsoil) and total soil N (TNsoil) of four lysimeters at a 0–30 cm depth during the two crop seasons.
TCsoil of Lysimeters (g/m2)TNsoil of Lysimeters (g/m2)
BLN-FreeUreaCRFBLN-FreeUreaCRF
First season: plant cane239 DAP2642268224532390252239221207
329 DAP2498240822682466257252239252
Second season: ratoon66 DAP2745208821512426252171194230
127 DAP2318195323812484234194243239
184 DAP2313224625162394243230252225
253 DAP2250207524122390248203257243
Publisher’s Note: MDPI stays neutral with regard to jurisdictional claims in published maps and institutional affiliations.

