
Temporal Movement of a Dieback Front in a Population of Parkinsonia in Northern Australia


Abstract
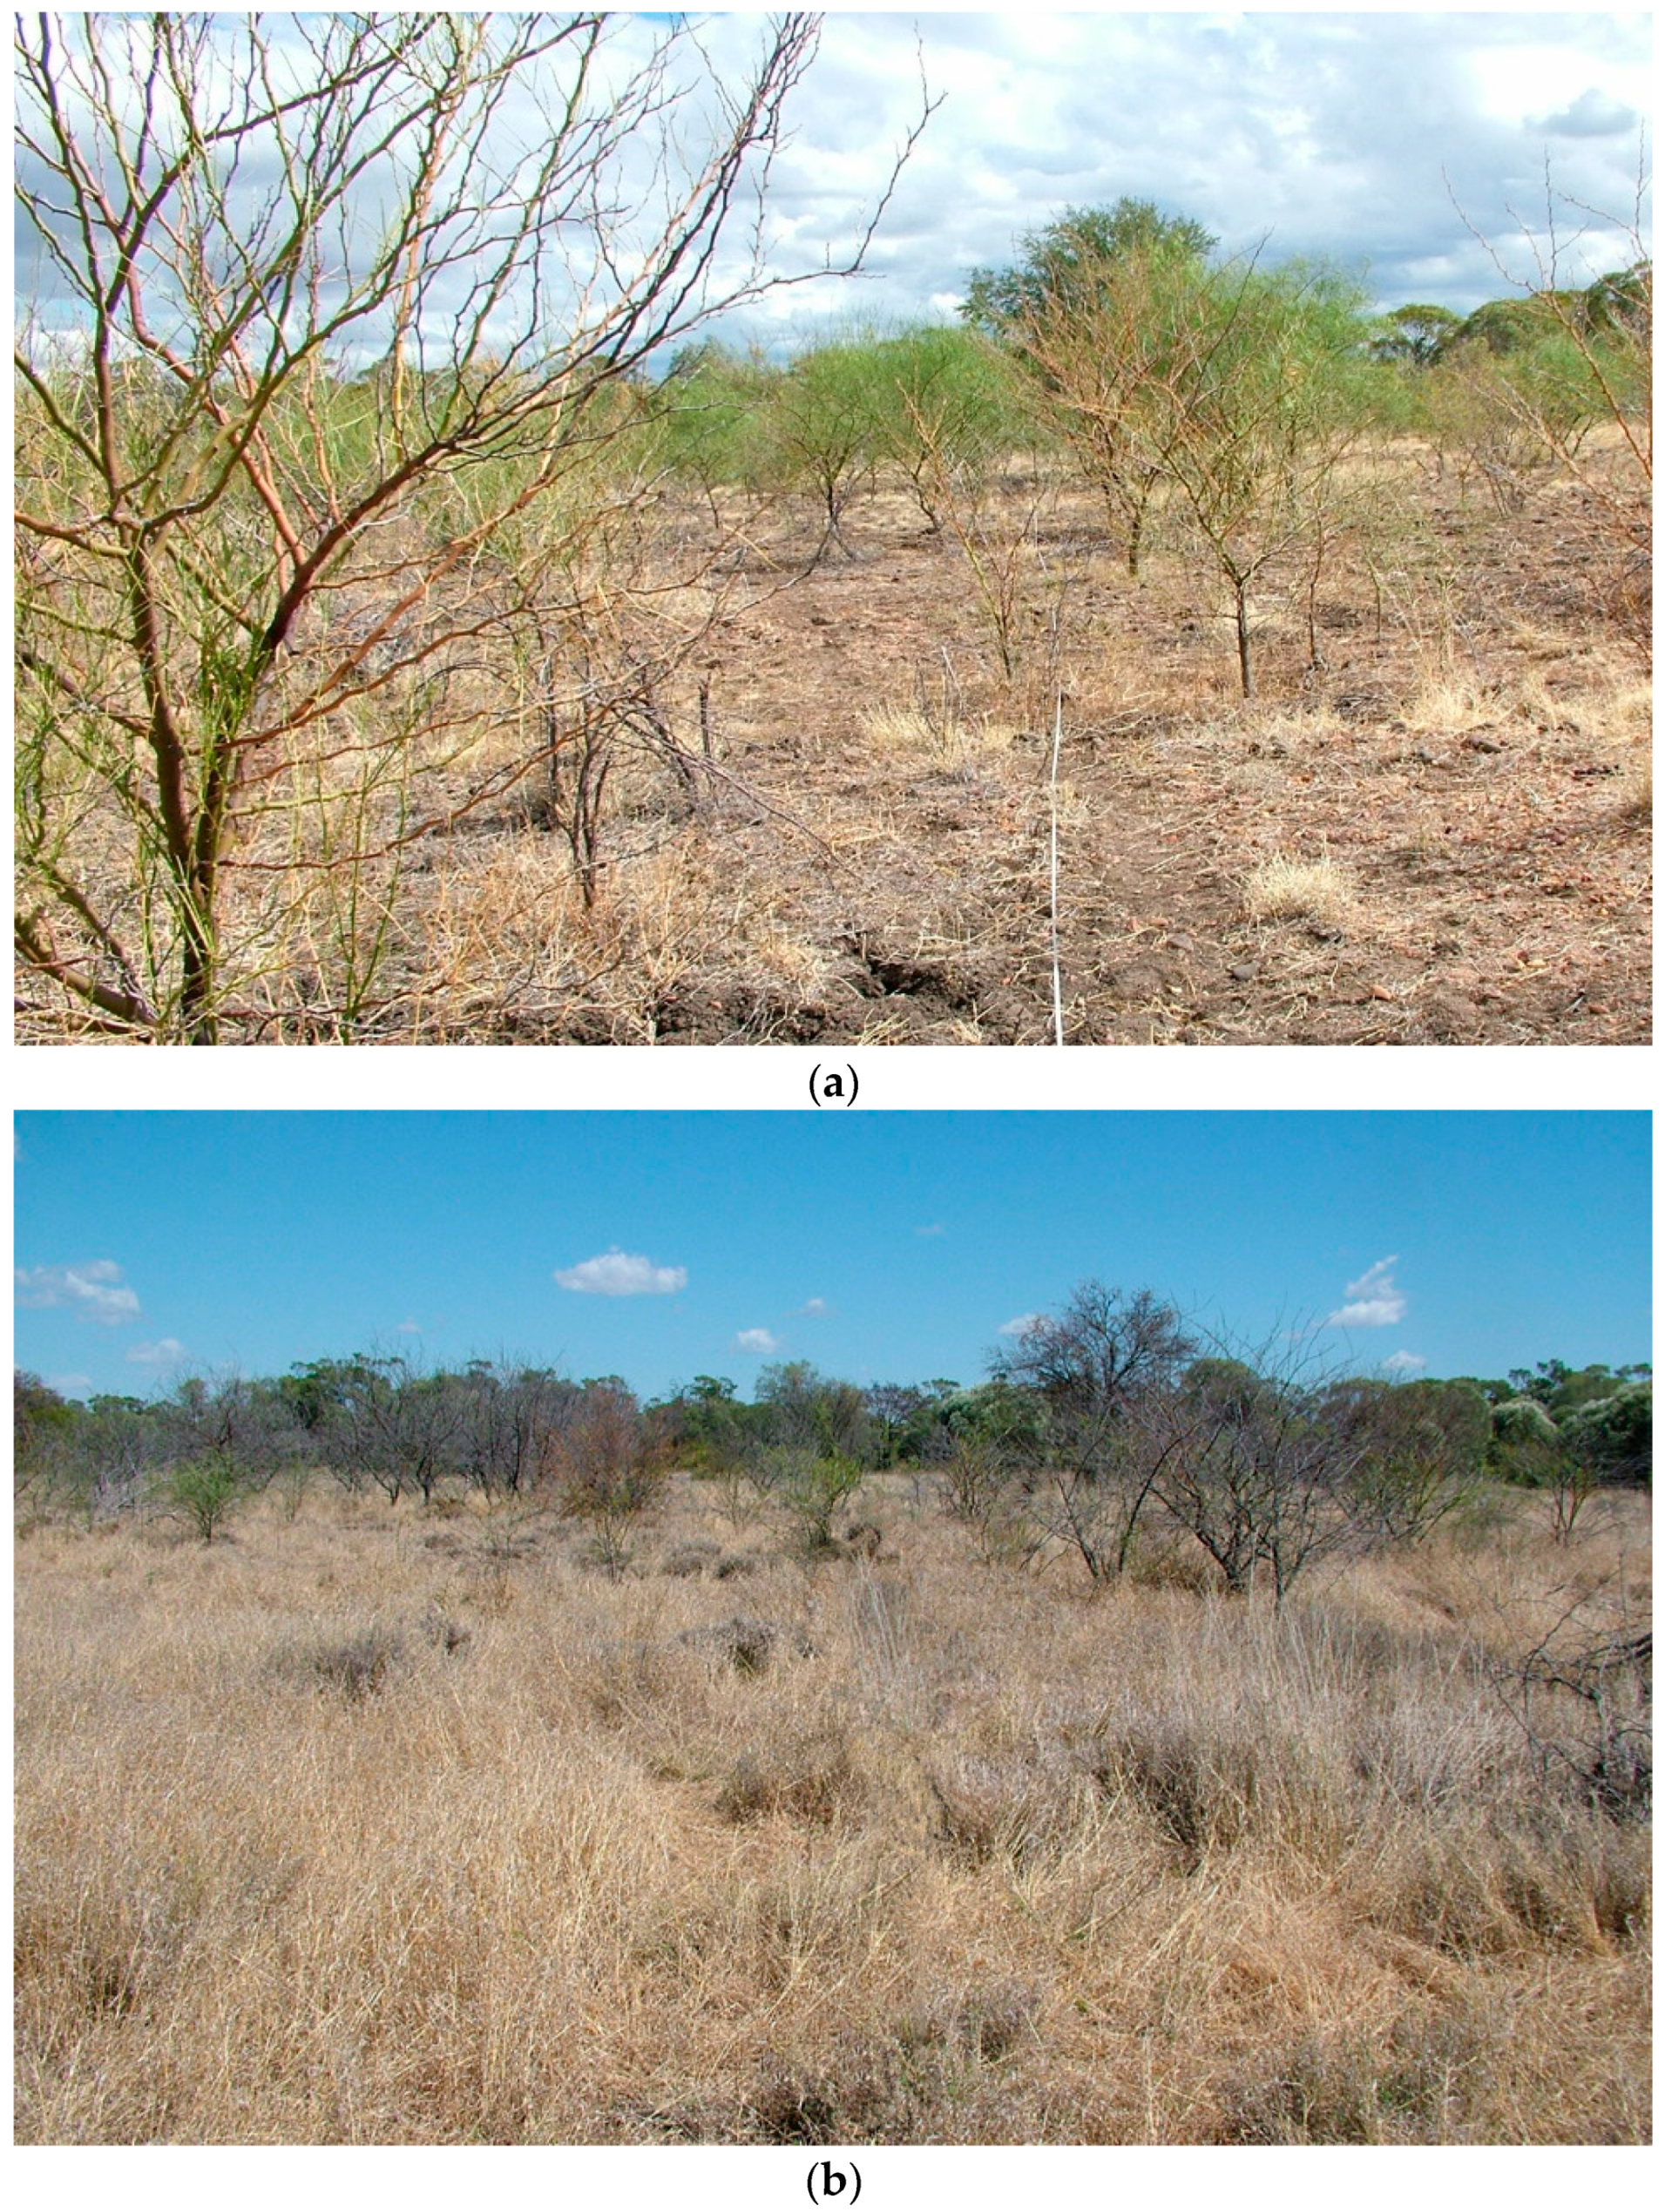
:1. Introduction
2. Materials and Methods
2.1. Plant Health Assessment
2.2. Analysis of Plant Health and Movement of Dieback
2.3. Isolation and Identification of Fungi Associated with Dieback-Affected Plants
3. Results
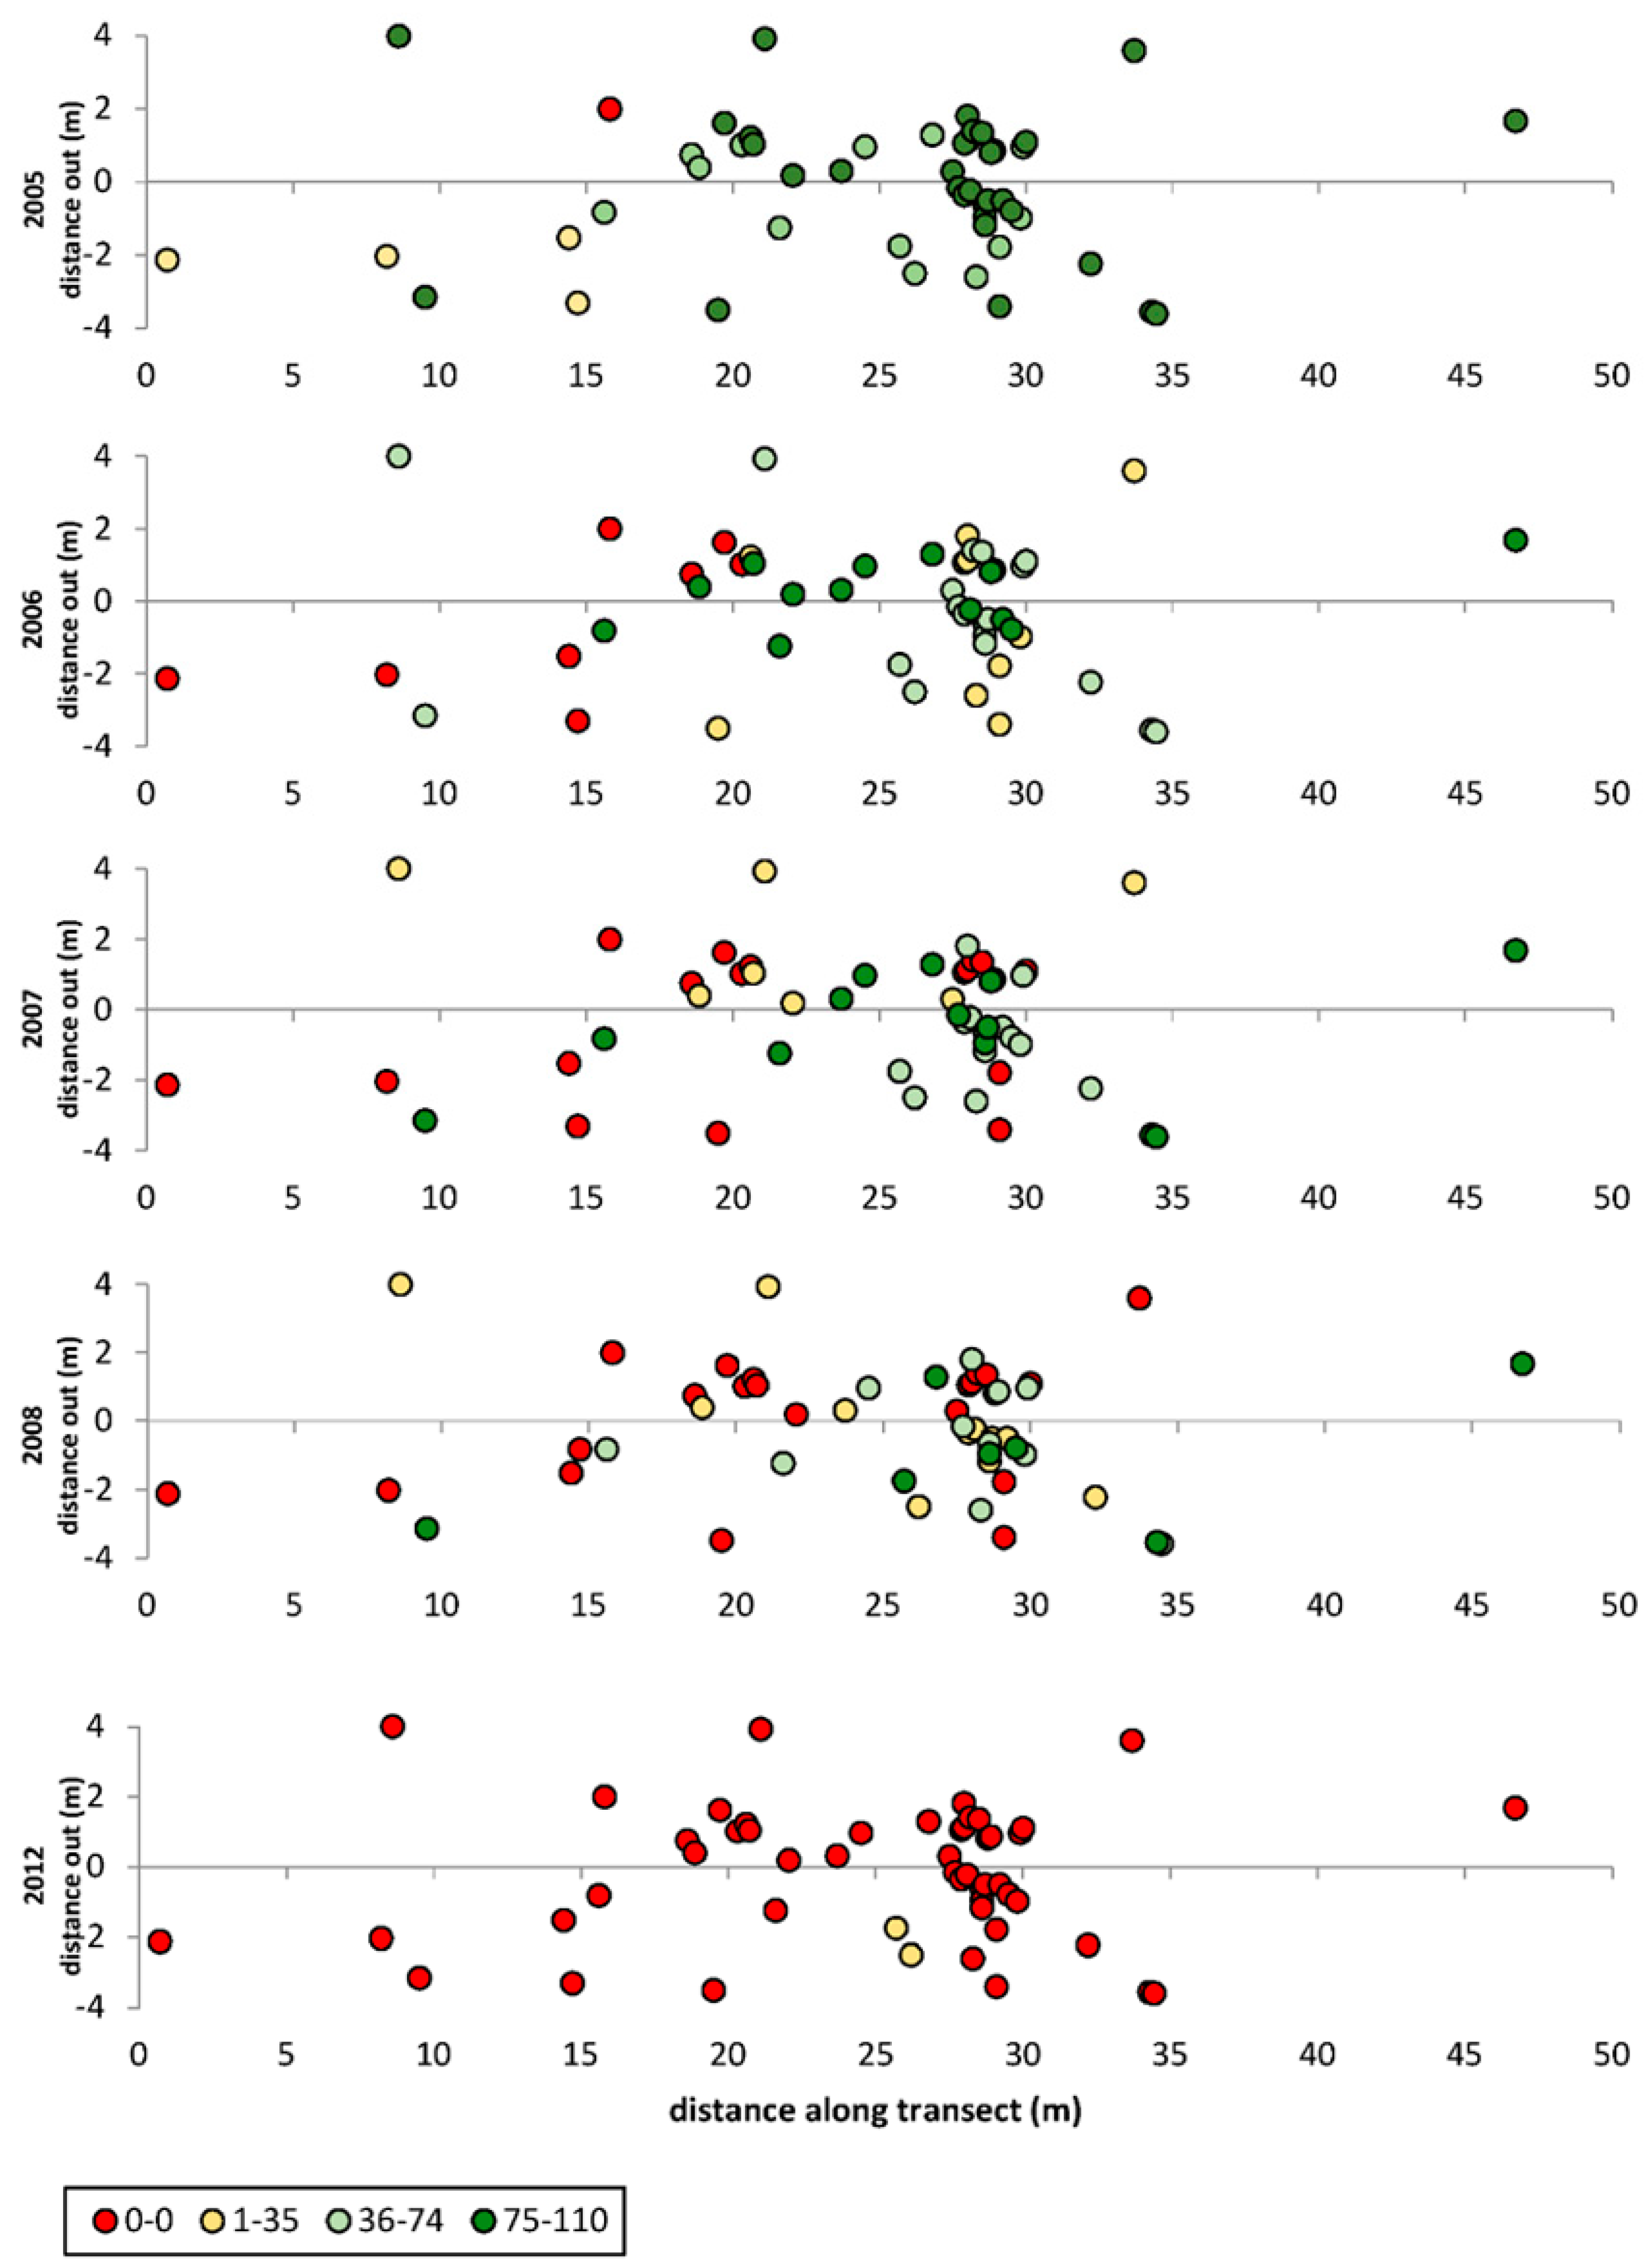
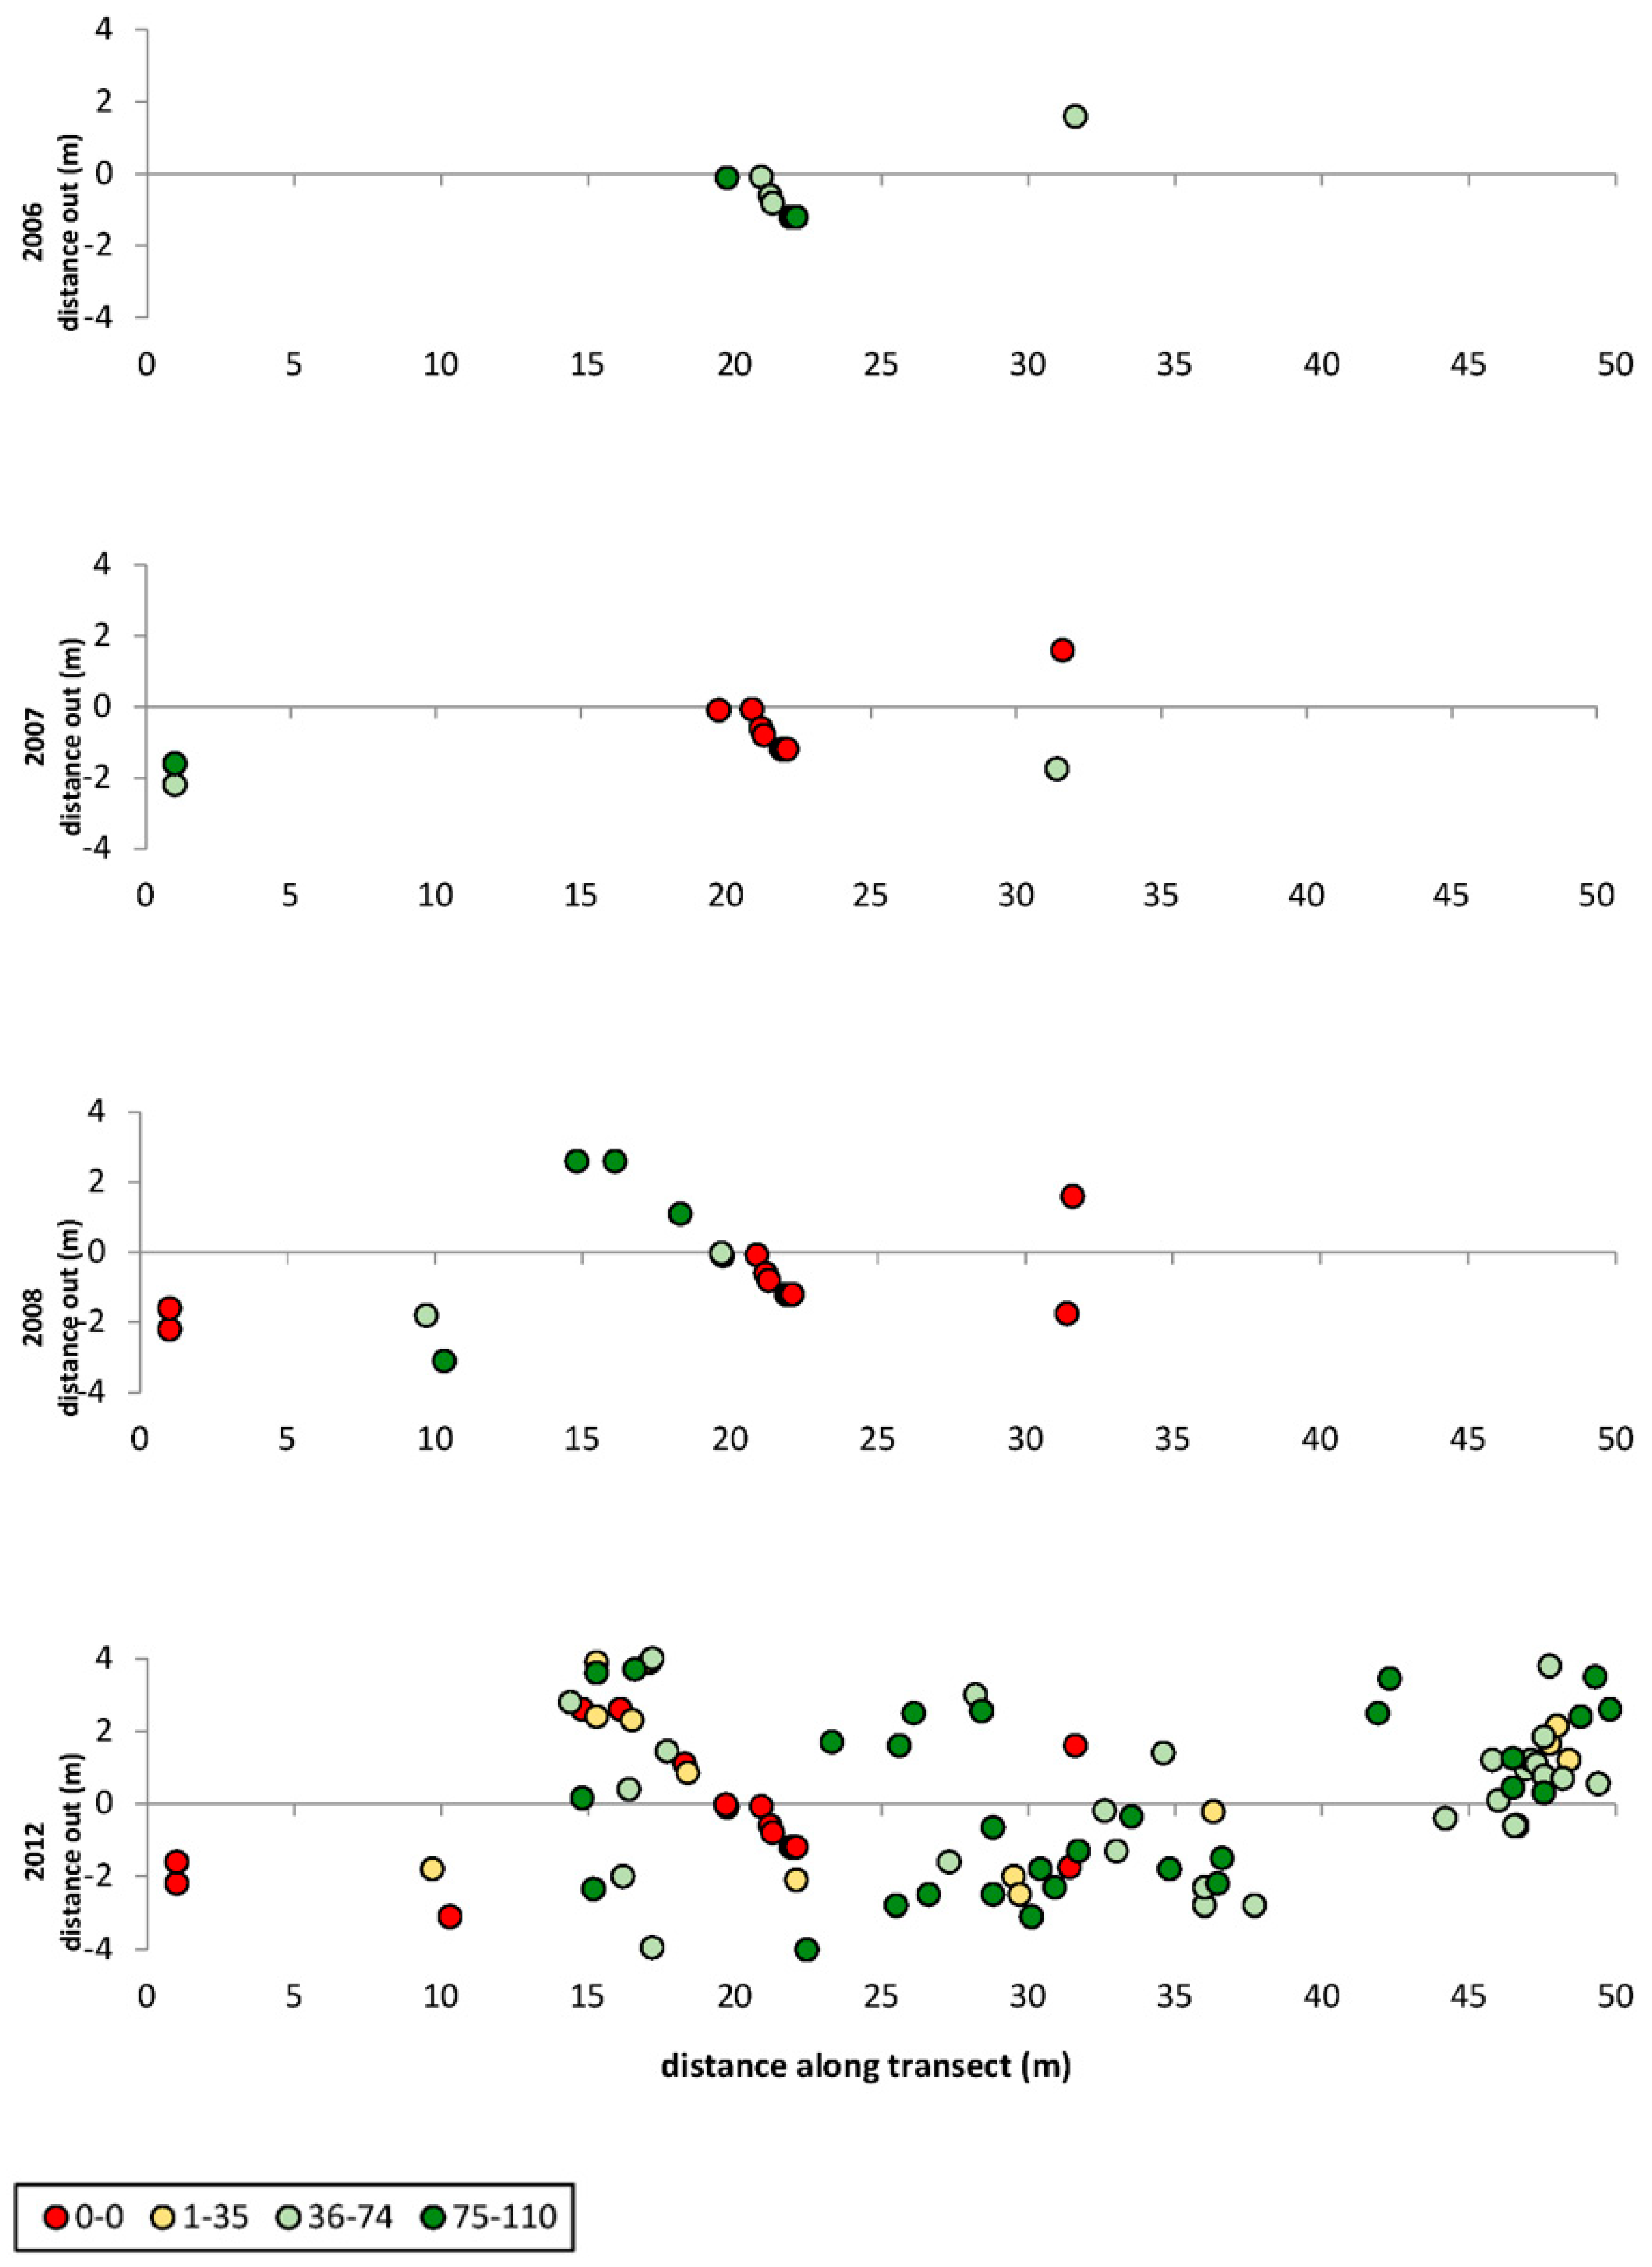
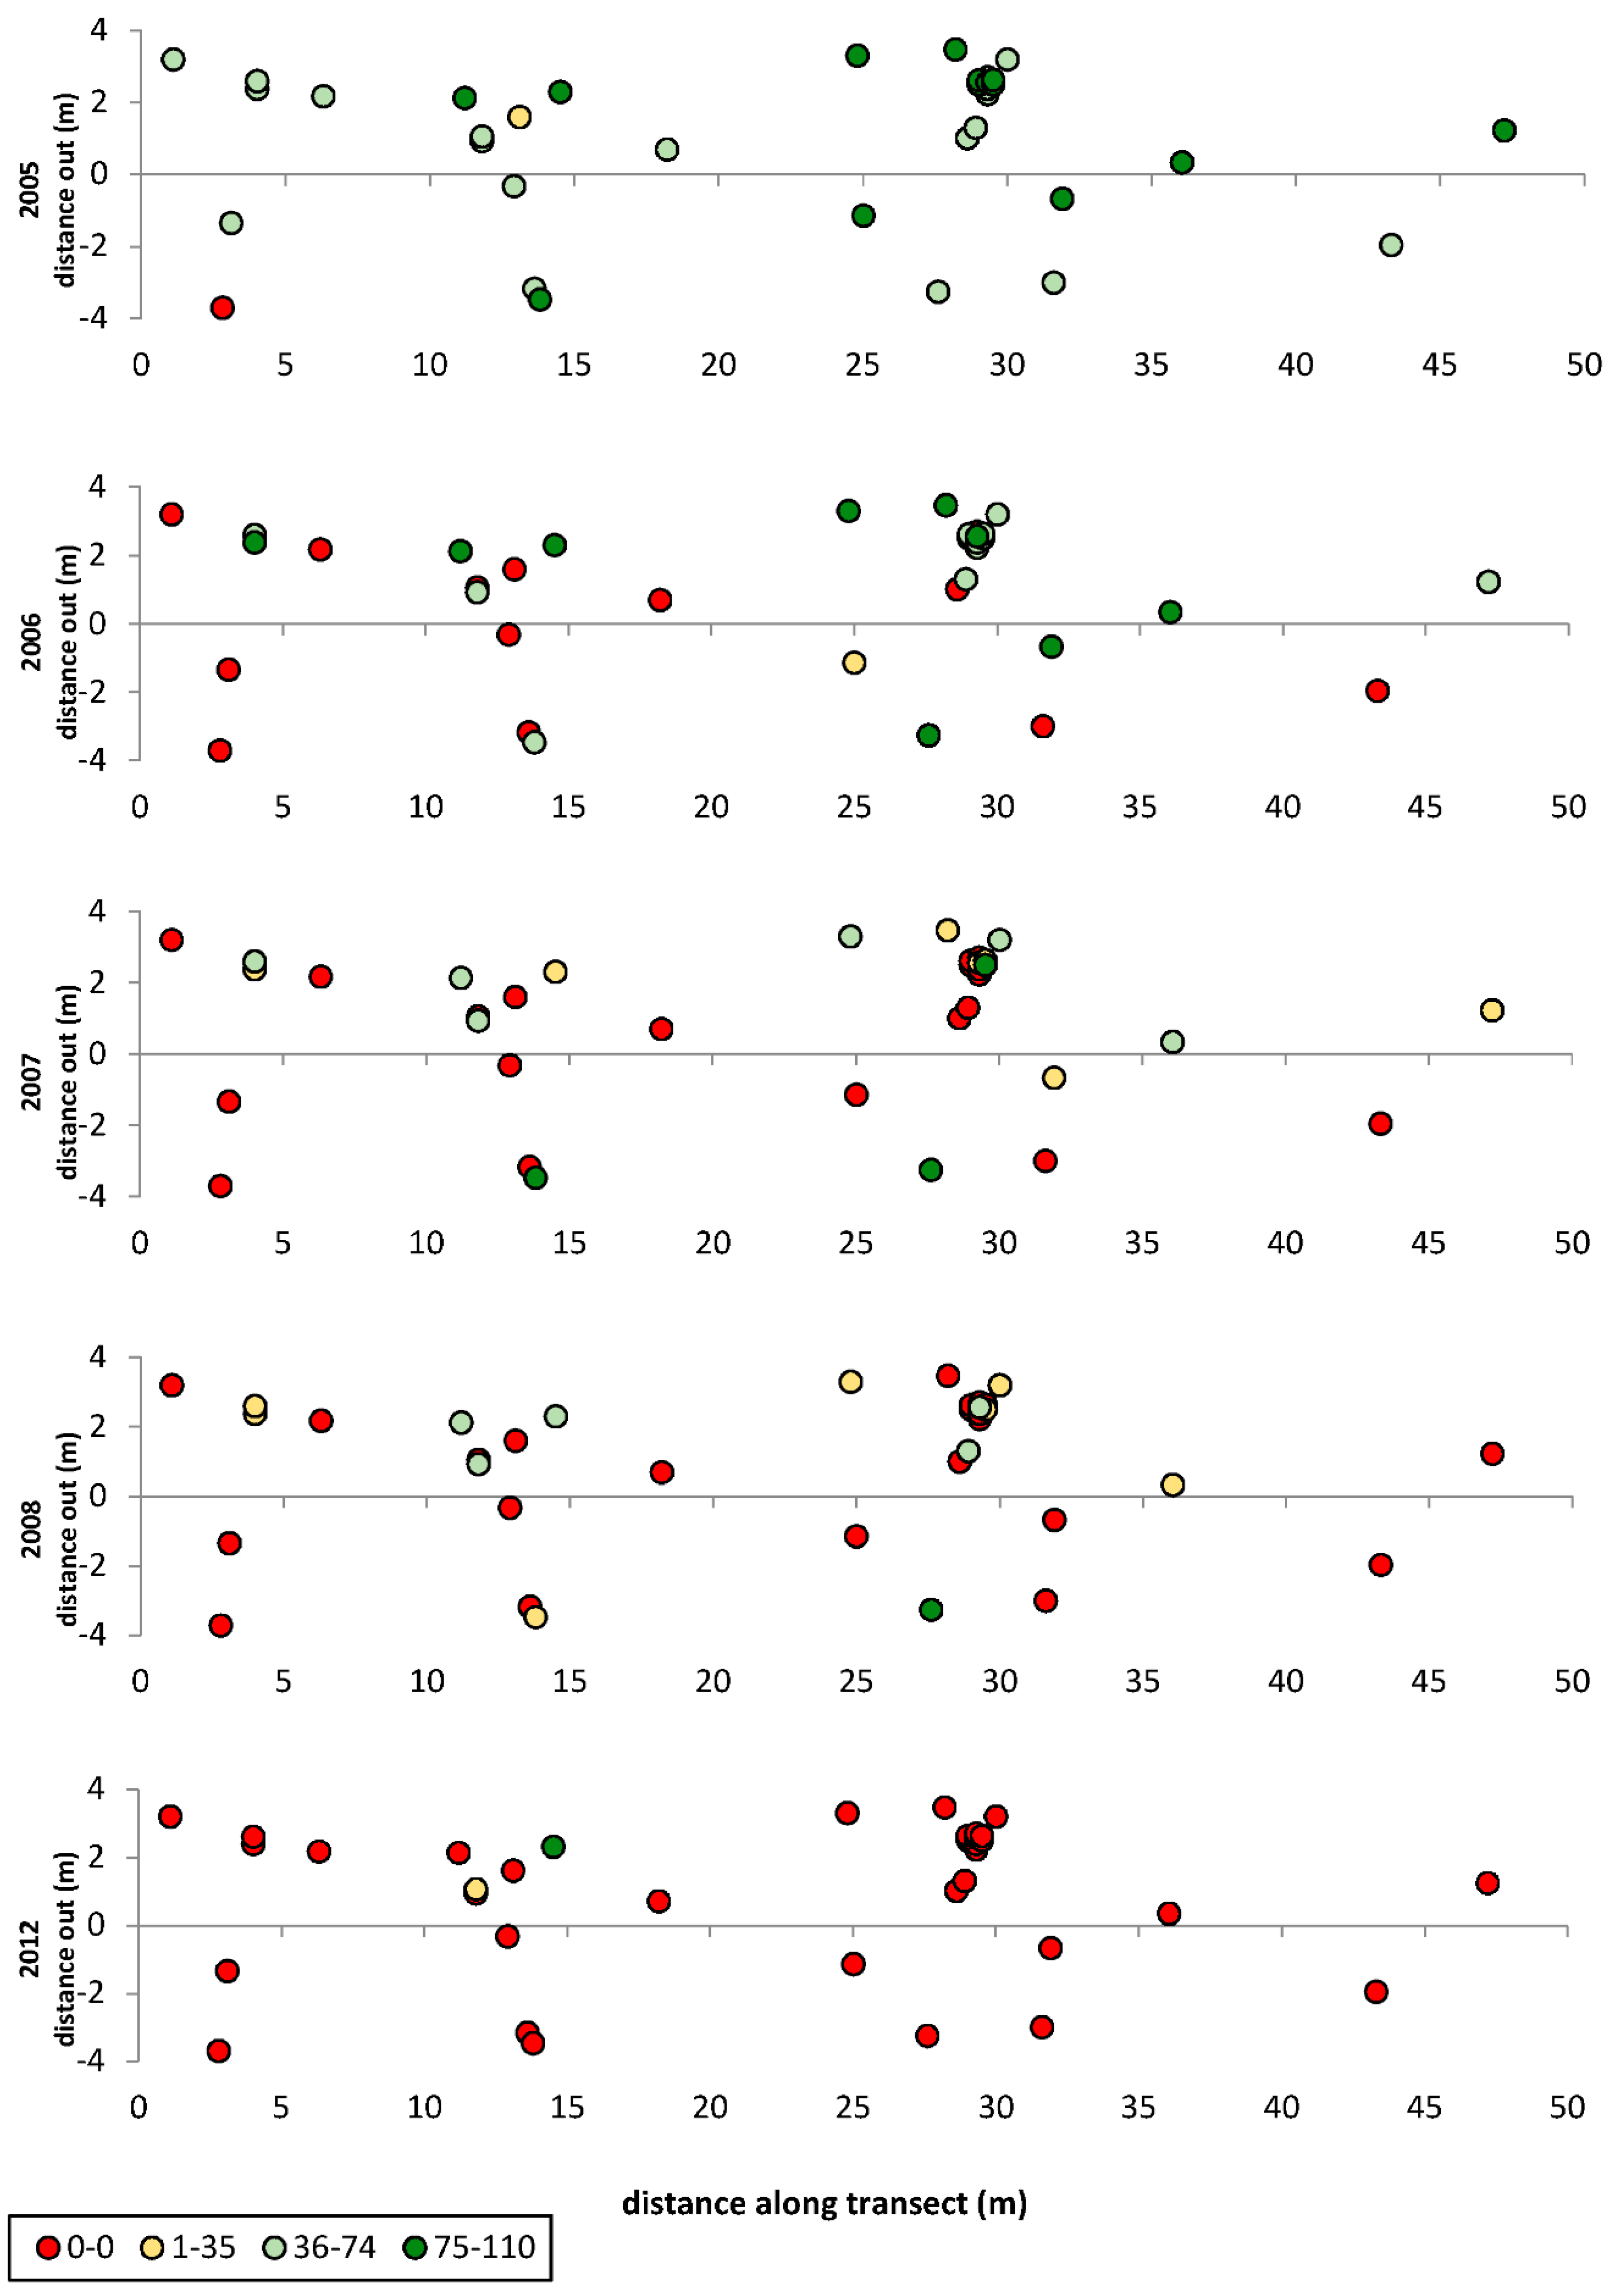
3.1. Transects
3.2. Isolation and Identification of Fungi Associated with Dieback-Affected Plants
4. Discussion
5. Conclusions
Author Contributions
Funding
Acknowledgments
Conflicts of Interest
References
- Diplock, N.; Galea, V.; van Klinken, R.D. A preliminary investigation of dieback on Parkinsonia aculeata. In Proceedings of the 15th Australian Weeds Conference: Managing Weeds in a Changing Climate, Adelaide, Australia, 24–28 September 2006; Preston, C., Watts, J.H., Crossman, N.D., Eds.; Weed Management Society of South Australia: Torrens Park, SA, Australia, 2006; pp. 585–587. [Google Scholar]
- van Klinken, R.D.; Campbell, S.D.; Heard, T.A.; McKenzie, J.; March, N. The biology of Australian weeds Parkinsonia aculeata L. Plant Prot. Q. 2009, 24, 100–117. [Google Scholar]
- Steinrucken, T.; Bissett, A.; Powell, J.; Raghavendra, A.; Klinken, R. Endophyte community composition is associated with dieback occurrence in an invasive tree. Int. J. Plant-Soil Relatsh. 2016, 405, 311–323. [Google Scholar] [CrossRef]
- van Klinken, R.; Heard, T. Parkinsonia aculeata L.-parkinsonia. In Biological Control of Weeds in Australia; Julien, M.H., McFayden, R., Cullen, J.M., Eds.; CSIRO Publishing: Canberra, Australia, 2012; pp. 437–446. [Google Scholar]
- Housten, D.R. Host-stress-saprogen model for forest dieback-decline diseases. In Forest Decline Concepts; Manion, P.D., Lachance, D., Eds.; American Phytopathogical Society: St. Paul, MN, USA, 1992. [Google Scholar]
- Diplock, N.D. Parkinsonia Dieback: Investigations into Its Cause, Ecology and Potential for Biological Control. Ph.D. Thesis, School of Agriculture and Food Sciences, The University of Queensland, Brisbane, Australia, 2016. [Google Scholar]
- Castello, J.D.; Leopold, D.J.; Smallidge, P.J. Pathogens, patterns, and processes in forest ecosystems. Bioscience 1995, 45, 16–24. [Google Scholar] [CrossRef]
- Jules, E.S.; Kauffman, M.J.; Ritts, W.D.; Carroll, A.L. Spread of an invasive pathogen over a variable landscape: A nonnative root rot on Port Orford cedar. Ecology 2002, 83, 3167–3181. [Google Scholar] [CrossRef]
- Gilbert, G.S. Evolutionary ecology of plant diseases in natural ecosystems. Annu. Rev. Phytopathol. 2002, 40, 13–43. [Google Scholar] [CrossRef] [Green Version]
- Schoeneweiss, D.F. Predisposition, stress and plant disease. Annu. Rev. Phytopathol. 1975, 13, 193–211. [Google Scholar] [CrossRef]
- Bostock, R.M.; Pye, M.F.; Roubtsova, T.V. Predisposition in Plant Disease: Exploiting the Nexus in Abiotic and Biotic Stress Perception and Response. Annu. Rev. Phytopathol. 2014, 52, 517–549. [Google Scholar] [CrossRef] [Green Version]
- Arnold, A.E.; Zuleyka, M.; Gilbert, G.S. Fungal endophytes in dicotyledonous neotropical trees: Patterns of abundance and diversity. Mycol. Res. 2001, 105, 1502–1507. [Google Scholar] [CrossRef] [Green Version]
- Bureau of Meteorology. Climate Statistics for Australian Locations. Monthly Climate Statistics-Graph. Commonwealth of Australia. Available online: http://www.bom.gov.au/jsp/ncc/cdio/cvg/av (accessed on 23 December 2021).
- Bureau of Meteorology. Climate Statistics for Australian Locations, Summary Statistics Hughenden Airport. Commonwealth of Australia. Available online: http://www.bom.gov.au/jsp/ncc/cdio/weatherData/av?p_nccObsCode=122&p_display_type=dailyDataFile&p_startYear=2005&p_c=-180486903&p_stn_num=030022 (accessed on 23 December 2021).
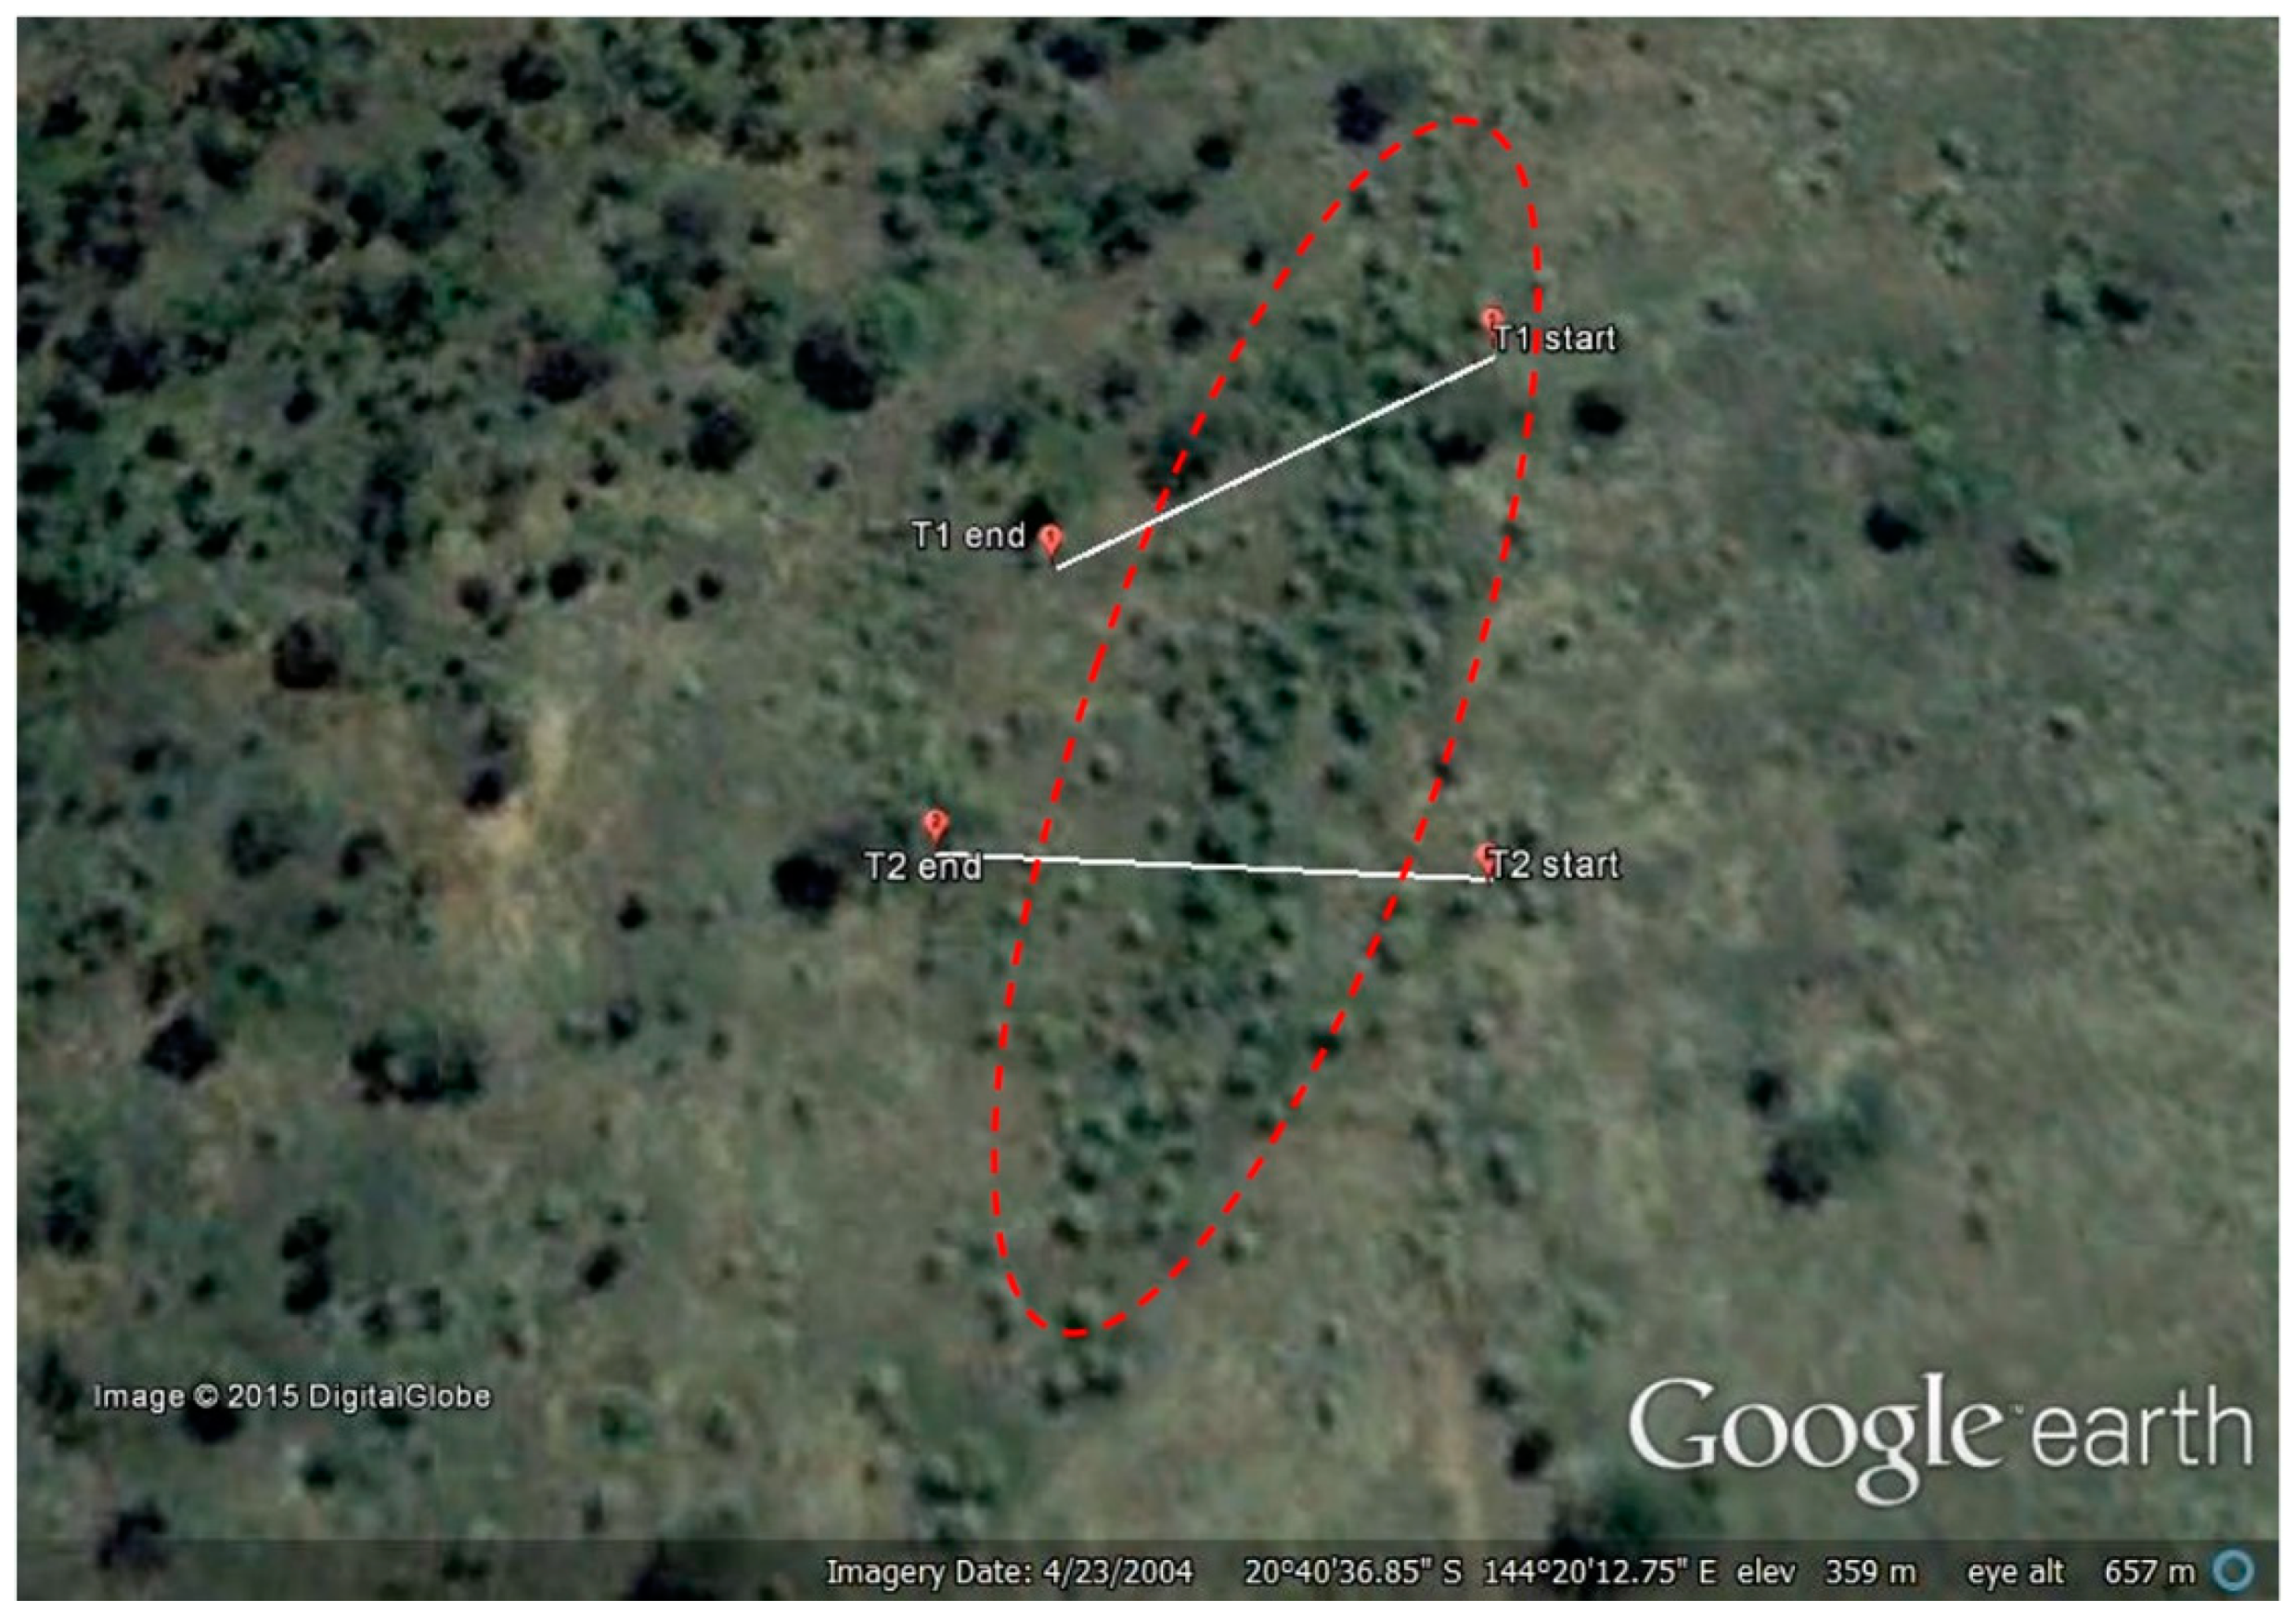
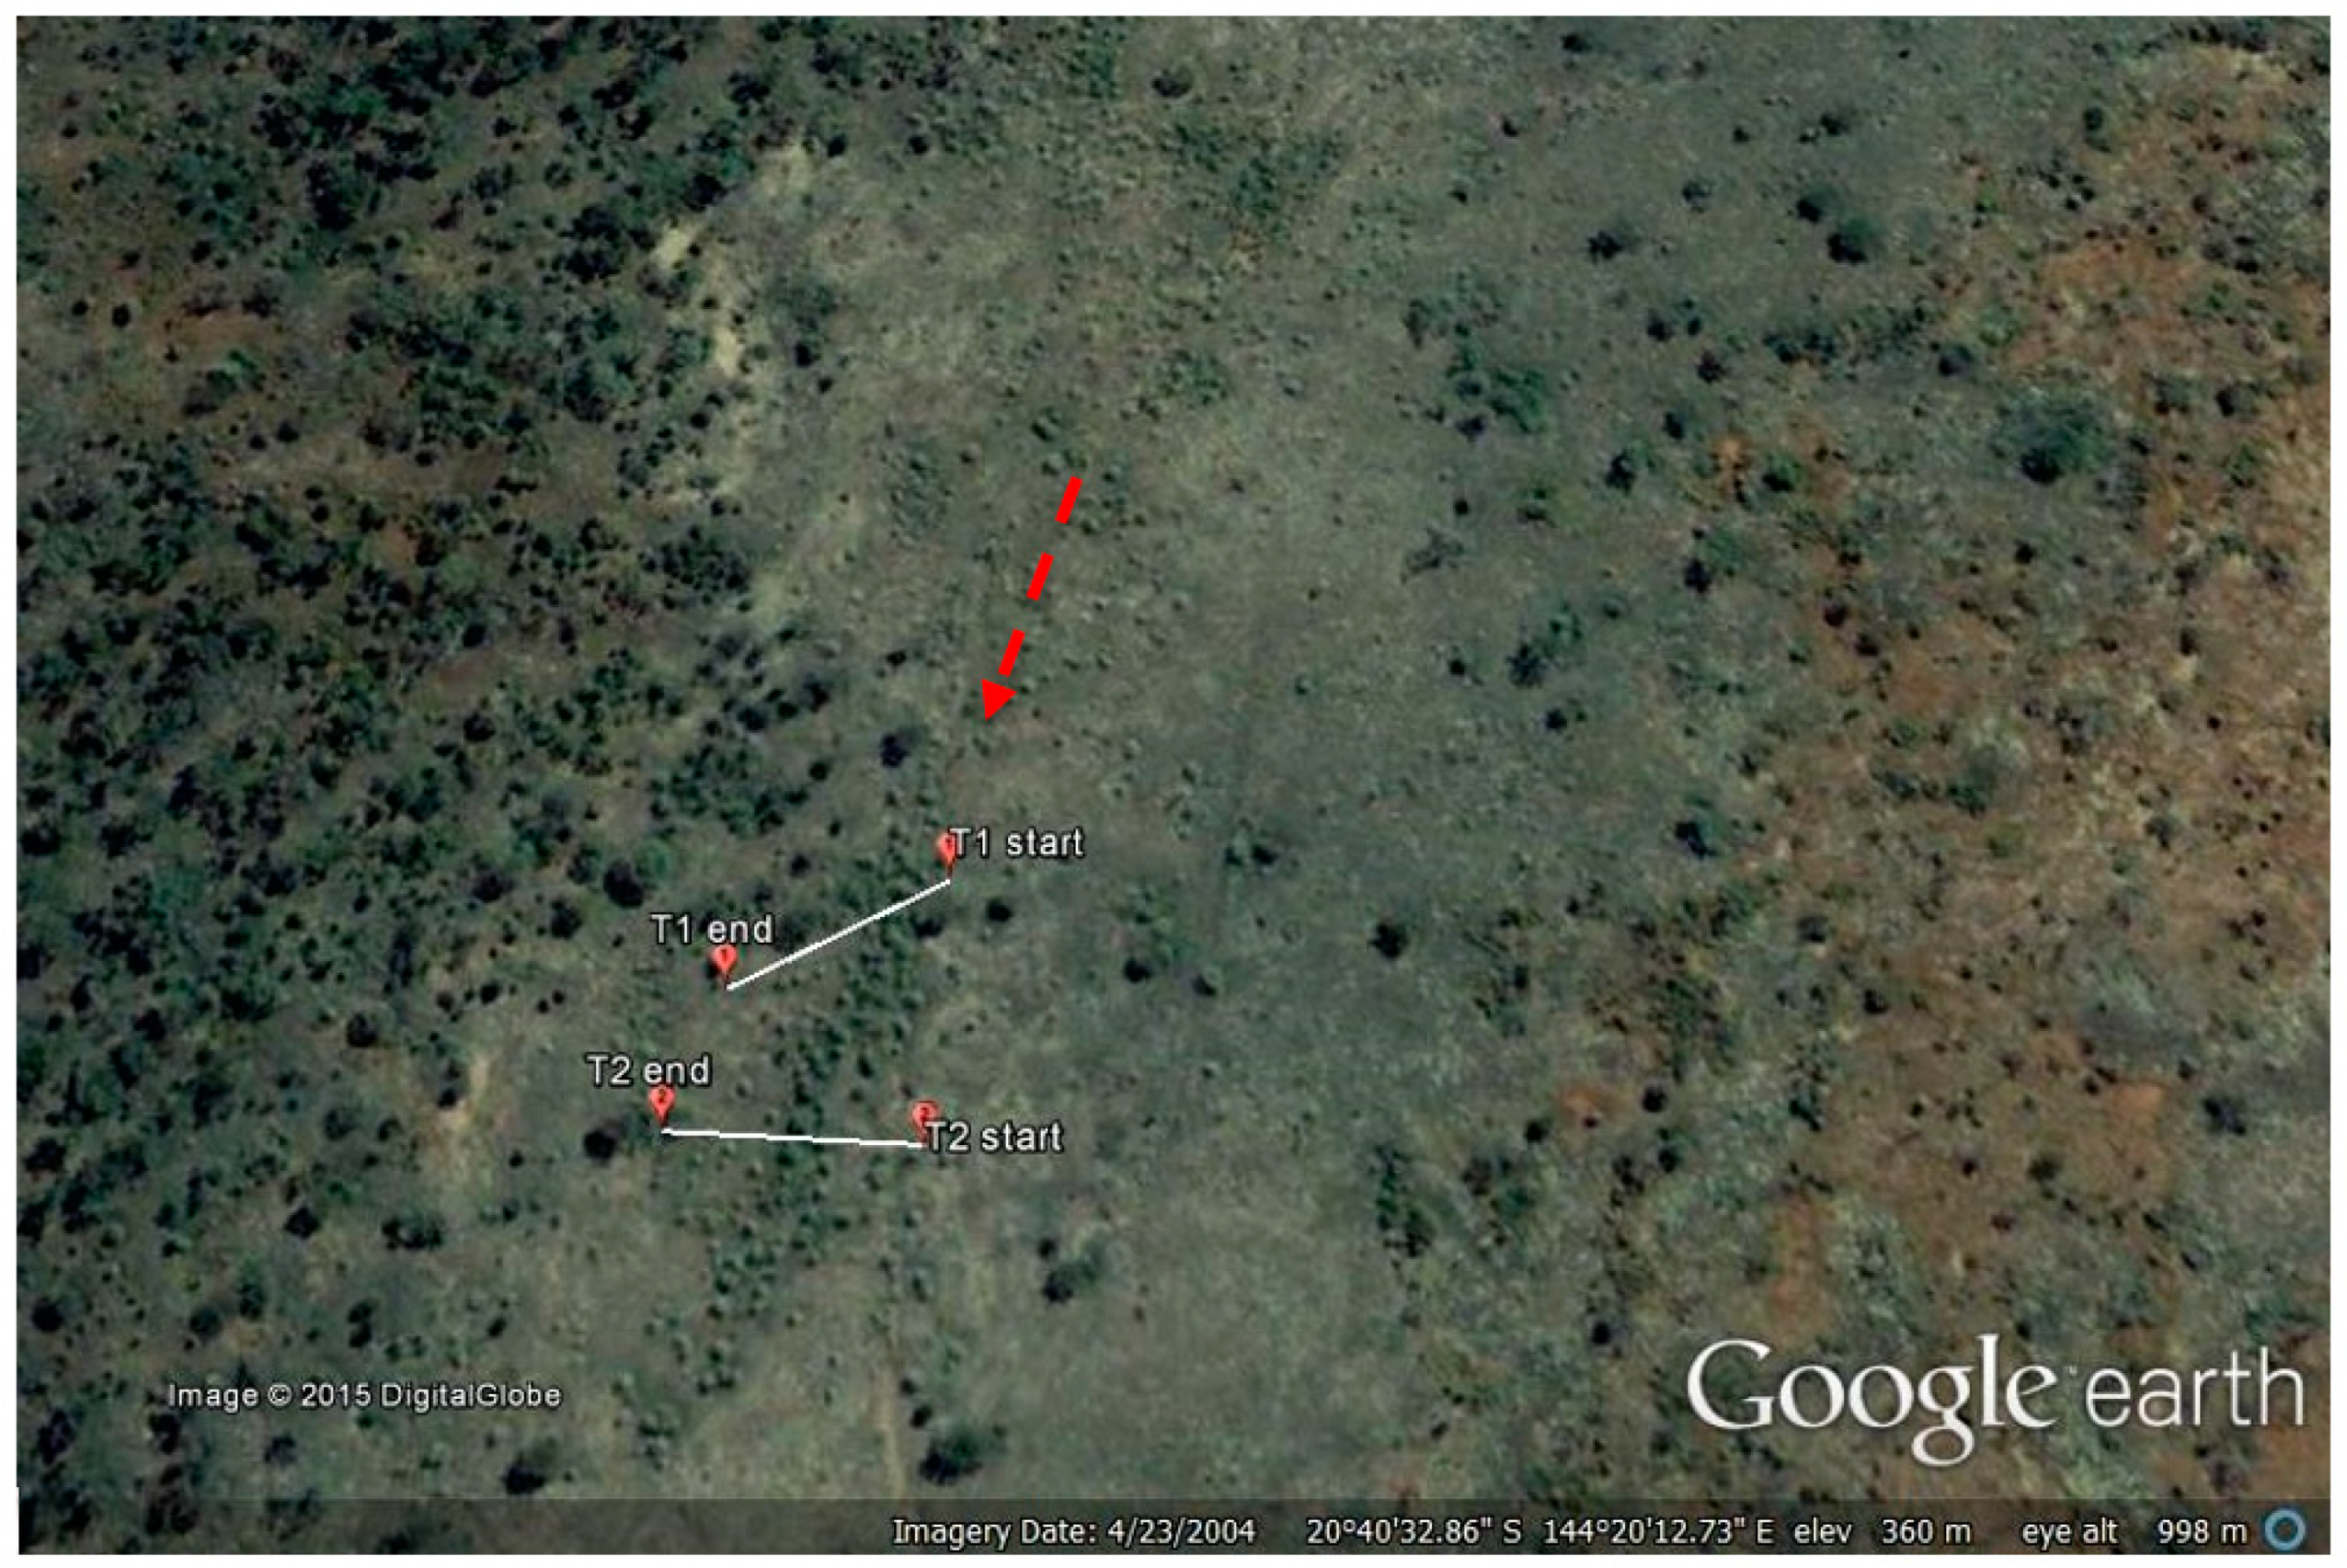
- Google Earth v7.1.2.Koon Kool Station, Australia. 20°40′36.85″ S, 144°20′12.75″ E, Eye Alt. 657 m. Digital Globe 2015. Available online: http://www.earth.google.com (accessed on 23 April 2004).
- Google Earth v7.1.2.Koon Kool Station, Australia. 20°40′36.71″ S, 144°20′13.80″ E, Eye Alt. 657 m. CNES/Astrium 2015. Available online: http://www.earth.google.com (accessed on 13 July 2013).
- Landsberg, J. Dieback of rural trees in Australia. GeoJournal 1988, 17, 231–237. [Google Scholar] [CrossRef]
- Manion, P.D. Decline diseases of complex biotic and abiotic origin. In Tree Disease Concepts; Manion, P.D., Ed.; Prentice Hall: Hoboken, NJ, USA, 1981; pp. 324–339. [Google Scholar]
- Zeilinger, S.; Gupta, V.K.; Dahms, T.E.S.; Silva, R.N.; Singh, H.B.; Upadhyay, R.S.; Gomes, E.V.; Tsui, C.K.-M.; Nayak, S.C. Friends or foes? Emerging insights from fungal interactions with plants. FEMS Microbiol. Rev. 2015, 40, 182–207. [Google Scholar] [CrossRef] [PubMed] [Green Version]
- Sturrock, R.N.; Frankelb, S.J.; Brownc, A.V.; Hennond, P.E.; Kliejunas, J.T.; Lewise, K.J.; Worrallf, J.J.; Woods, A.J. Climate change and forest diseases. Plant Pathol. 2011, 60, 133–149. [Google Scholar] [CrossRef]
- Toh, R. Investigation of Fungi Pathogenic towards Seedlings of Parkinsonia aculeata: Their Potential for Use as Mycoherbicides. Ph.D. Thesis, The University of Queensland, St. Lucia, QLD, Australia, 2009. [Google Scholar]
- Holdenreider, O.; Pautasso, M.; Weisberg, P.J.; Lonsdale, D. Tree diseases and landscape processes: The challenge of landscape pathology. Trends Ecol. Evol. 2004, 19, 446–452. [Google Scholar] [CrossRef] [PubMed]
- Islam, M.S.; Haque, M.S.; Islam, M.M.; Emdad, E.M.; Halim, A.; Hossen, Q.M.M.; Hossain, M.Z.; Ahmed, B.; Rahim, S.; Rahman, M.S.; et al. Tools to kill: Genome of one of the most destructive plant pathogenic fungi Macrophomina phaseolina. BMC Genom. 2012, 13, 493. [Google Scholar] [CrossRef] [PubMed] [Green Version]
- Rees, A.A. Infection of Pinus caribaea by Lasiodiplodia theobromae. Trans. Br. Mycol. Soc. 1988, 90, 321–324. [Google Scholar] [CrossRef]
- Mullen, J.M.; Gilliam, C.H.; Morgan-Jones, G. Canker of dogwood Caused by Lasiodiplodia theobromae, a disease influenced by drought stress or cultivar selection. Plant Dis. 1991, 75, 886–892. [Google Scholar] [CrossRef]
- Steinrucken, T.; Raghavendra, A.; Powell, J.; Bissett, A.; van Klinken, R. Triggering dieback in an invasive plant: Endophyte diversity and pathogenicity. J. Australas. Plant Pathol. Soc. 2017, 46, 157–170. [Google Scholar] [CrossRef]
- Slippers, B.; Wingfield, M.J. Botryosphaeriaceae as endophytes and latent pathogens of woody plants: Diversity, ecology and impact. Fungal Biol. Rev. 2007, 21, 90–106. [Google Scholar] [CrossRef]
- Deveze, M. Parkinsonia; Approaches to the Management of Parkinsonia (Parkinsonia aculeata) in Australia; Department of Natural Resources, Mines and Energy: Brisbane, Australia, 2004.
- Burdon, J.J.; Chilvers, G.A. Host Density as a Factor in Plant Disease Ecology. Annu. Rev. Phytopathol. 1982, 20, 143–166. [Google Scholar] [CrossRef]
- Boyce, J.S. Root Diseases. In Forest Pathology; Vaux, H.J., Ed.; McGraw-Hill Book Company: New York, NY, USA, 1961. [Google Scholar]
- Kaur, S.; Dhillon, G.S.; Brar, S.K.; Vallad, G.E.; Chand, R.; Chauhan, V.B. Emerging phytopathogen Macrophomina phaseolina: Biology, economic importance and current diagnostic trends. Crit. Rev. Microbiol. 2012, 38, 136–151. [Google Scholar] [CrossRef]
- Augspurger, C.K.; Kelly, C.K. Pathogen mortality of tropical tree seedlings- experimental studies of the effects of dispersal distance, seedling density, and light conditions. Oecologia 1984, 61, 211–217. [Google Scholar] [CrossRef]
- Dinoor, A.; Eshed, N. The role and importance of pathogens in natural plant communities. Annu. Rev. Plant Pathol. 1984, 22, 443–466. [Google Scholar] [CrossRef]
- Galea, V.J. Use of Stem Implanted Bioherbicide Capsules to Manage an Infestations of Parkinsonia aculeata in Northern Australia. Plants 2021, 10, 1909. [Google Scholar] [CrossRef] [PubMed]


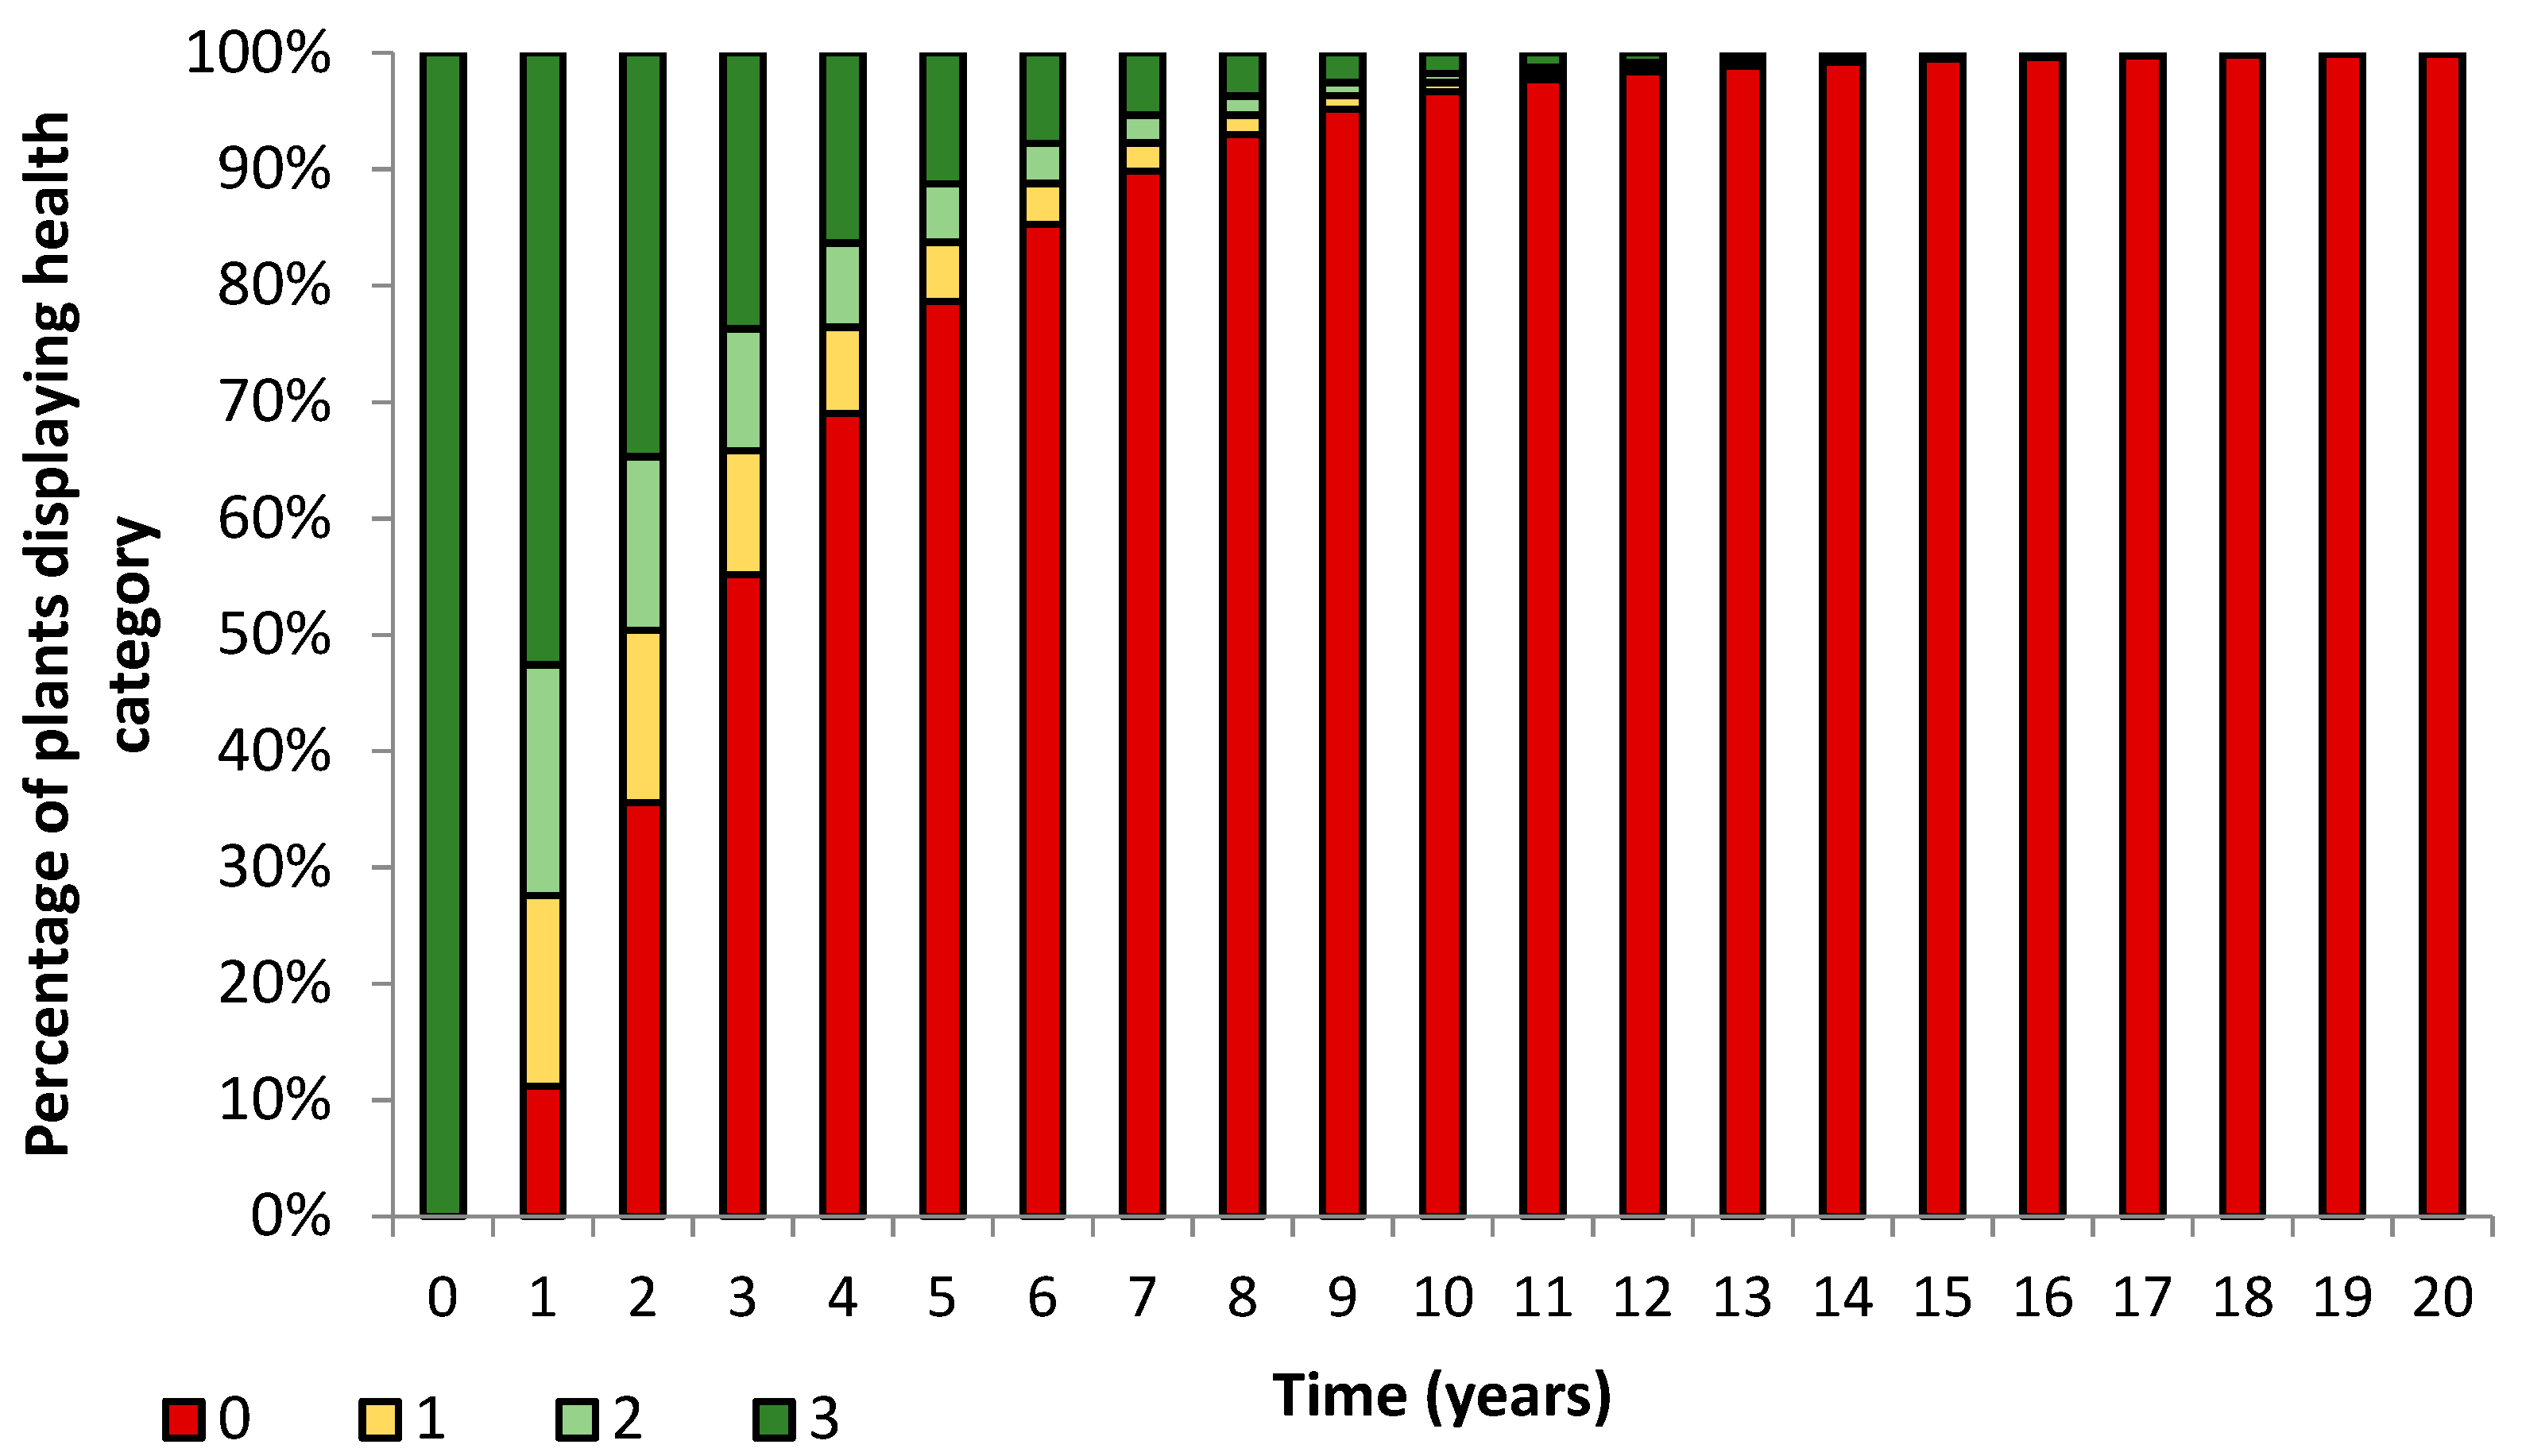
 = dead,
  = ratings 1–35,
  = ratings 36–74,
  = ratings 75–110.
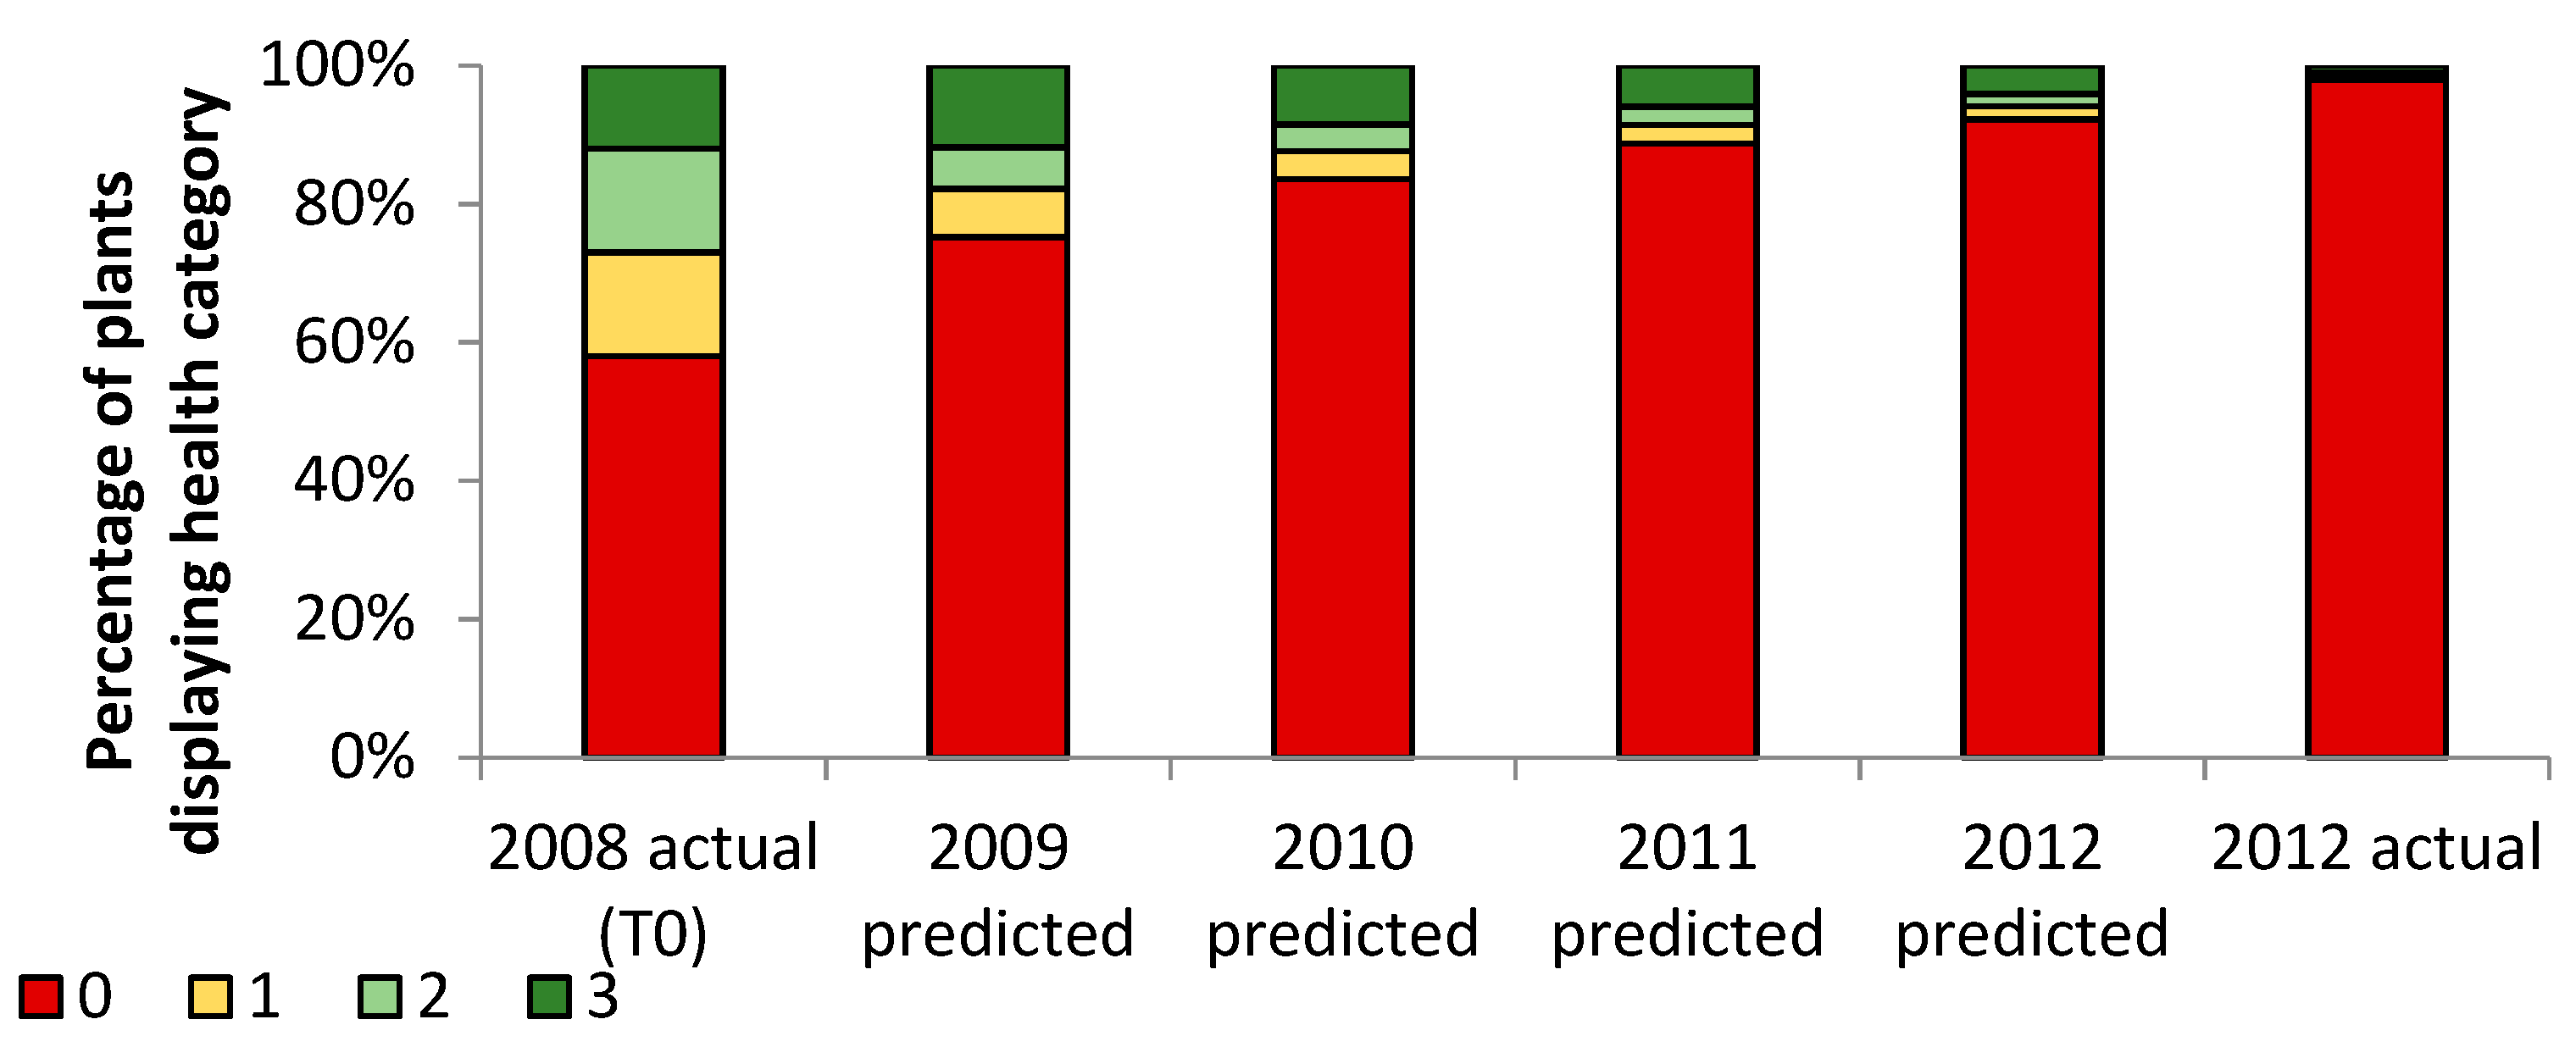
= dead, = ratings 1–35, = ratings 36–74, = ratings 75–110.
= ratings 75–110.
= dead, = ratings 1–35, = ratings 36–74, = ratings 75–110.
 = dead,
  = ratings 1–35,
  = ratings 36–74,
  = ratings 75–110.
= dead, = ratings 1–35, = ratings 36–74, = ratings 75–110.
= ratings 75–110.
= dead, = ratings 1–35, = ratings 36–74, = ratings 75–110.
 = dead,
  = ratings 1–35,
  = ratings 36–74,
  = ratings 75–110.
= dead, = ratings 1–35, = ratings 36–74, = ratings 75–110.
= ratings 75–110.
= dead, = ratings 1–35, = ratings 36–74, = ratings 75–110.
 = dead,
  = ratings 1–35,
  = ratings 36–74,
  = ratings 75–110.
= dead, = ratings 1–35, = ratings 36–74, = ratings 75–110.
= ratings 75–110.
= dead, = ratings 1–35, = ratings 36–74, = ratings 75–110.


| Assessment | Transect 1 |
|---|---|
| June 2006 | 4.6 |
| September 2007 | 9.8 |
| June 2008 | 8.4 |
| September 2012 | 13.1 |
| Average 2006–2008 | 7.7 |
| Transect | Plant Number | Identification | Method of Identification | Date Collected |
|---|---|---|---|---|
| T1 | 9 | Kabatiella bupleuri | ITS sequence | 27 June 2005 |
| 24 | Bagnisiell examinans | ITS sequence | 27 June 2005 | |
| 1 | Aspergillus niger | Morphology | 27 June 2005 | |
| 50 | Aspergillus niger | Morphology | 27 June 2005 | |
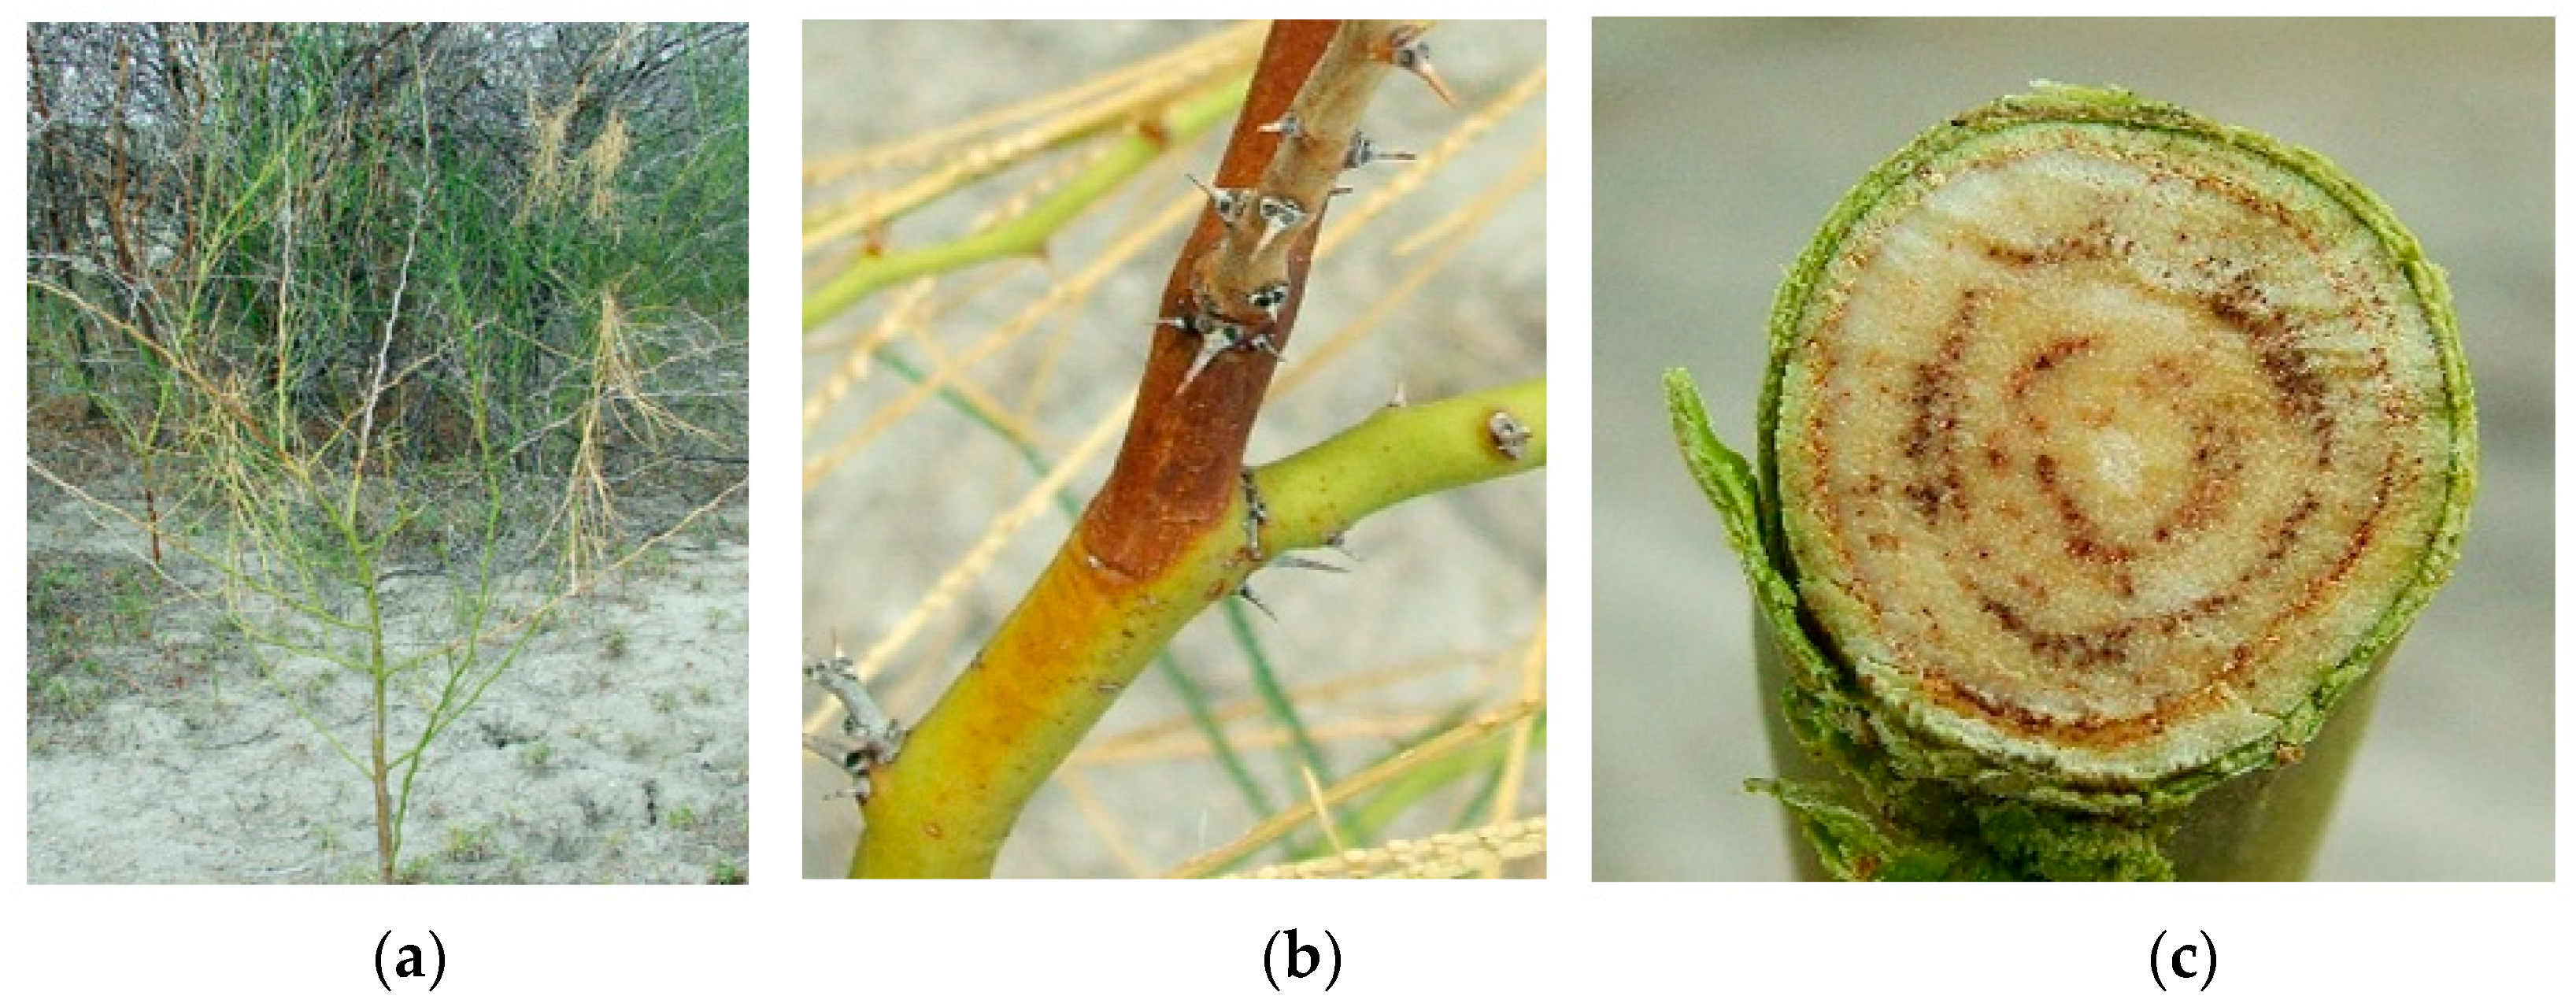
| T2 | 9 | Macrophomina phaseolina | Morphology | 27 June 2005 |
| 9 | Phoma sp. | Morphology | 27 June 2005 | |
| 36 | Peyronellea curtsii | Morphology | 27 June 2005 | |
| 19 | Phoma sp. | Morphology | 27 June 2005 |
Publisher’s Note: MDPI stays neutral with regard to jurisdictional claims in published maps and institutional affiliations. |
© 2022 by the authors. Licensee MDPI, Basel, Switzerland. This article is an open access article distributed under the terms and conditions of the Creative Commons Attribution (CC BY) license (https://creativecommons.org/licenses/by/4.0/).
Share and Cite
Diplock, N.D.; Galea, V.J. Temporal Movement of a Dieback Front in a Population of Parkinsonia in Northern Australia. Agronomy 2022, 12, 533. https://doi.org/10.3390/agronomy12020533
Diplock ND, Galea VJ. Temporal Movement of a Dieback Front in a Population of Parkinsonia in Northern Australia. Agronomy. 2022; 12(2):533. https://doi.org/10.3390/agronomy12020533
Chicago/Turabian StyleDiplock, Naomi D., and Victor J. Galea. 2022. "Temporal Movement of a Dieback Front in a Population of Parkinsonia in Northern Australia" Agronomy 12, no. 2: 533. https://doi.org/10.3390/agronomy12020533
APA StyleDiplock, N. D., & Galea, V. J. (2022). Temporal Movement of a Dieback Front in a Population of Parkinsonia in Northern Australia. Agronomy, 12(2), 533. https://doi.org/10.3390/agronomy12020533