Article

Evaluation of Methods for Measuring Fusarium-Damaged Kernels of Wheat

1
Cereal Grains Breeding and Genetics, Pee Dee Research and Education Center, Department of Plant & Environmental Sciences, Clemson University, Florence, SC 29506, USA
2
Advanced Plant Technology Program, Clemson University, Clemson, SC 29634, USA
3
Crop and Soil Environmental Science, Virginia Polytechnic Institute and State University, Blacksburg, VA 24061, USA
4
Department of Soil and Crop Sciences, Colorado State University, Fort Collins, CO 80523, USA
5
School of Plant, Environmental and Soil Sciences, Louisiana State University, Baton Rouge, LA 70803, USA
6
Department of Crop Science, North Carolina State University, Raleigh, NC 27695, USA
7
USDA-ARS, Department of Plant Pathology, North Carolina State University, Raleigh, NC 27695, USA
*
Author to whom correspondence should be addressed.
Agronomy 2022, 12(2), 532; https://doi.org/10.3390/agronomy12020532
Submission received: 10 January 2022 / Revised: 9 February 2022 / Accepted: 17 February 2022 / Published: 21 February 2022
(This article belongs to the Special Issue Wheat Breeding: Procedures and Strategies – Series Ⅱ)

Abstract

:
Fusarium head blight (FHB) is one of the most economically destructive diseases of wheat (Triticum aestivum L.), causing substantial yield and quality loss worldwide. Fusarium graminearum is the predominant causal pathogen of FHB in the U.S., and produces deoxynivalenol (DON), a mycotoxin that accumulates in the grain throughout infection. FHB results in kernel damage, a visual symptom that is quantified by a human observer enumerating or estimating the percentage of Fusarium-damaged kernels (FDK) in a sample of grain. To date, FDK estimation is the most efficient and accurate method of predicting DON content without measuring presence in a laboratory. For this experiment, 1266 entries collectively representing elite varieties and SunGrains advanced breeding lines encompassing four inoculated FHB nurseries were represented in the analysis. All plots were subjected to a manual FDK count, both exact and estimated, near-infrared spectroscopy (NIR) analysis, DON laboratory analysis, and digital imaging seed phenotyping using the Vibe QM3 instrument developed by Vibe imaging analytics. Among the FDK analytical platforms used to establish percentage FDK within grain samples, Vibe QM3 showed the strongest prediction capabilities of DON content in experimental samples, R2 = 0.63, and higher yet when deployed as FDK GEBVs, R2 = 0.76. Additionally, Vibe QM3 was shown to detect a significant SNP association at locus S3B_9439629 within major FHB resistance quantitative trait locus (QTL) Fhb1. Visual estimates of FDK showed higher prediction capabilities of DON content in grain subsamples than previously expected when deployed as genomic estimated breeding values (GEBVs) (R2 = 0.71), and the highest accuracy in genomic prediction, followed by Vibe QM3 digital imaging, with average Pearson’s correlations of r = 0.594 and r = 0.588 between observed and predicted values, respectively. These results demonstrate that seed phenotyping using traditional or automated platforms to determine FDK boast various throughput and efficacy that must be weighed appropriately when determining application in breeding programs to screen for and develop resistance to FHB and DON accumulation in wheat germplasms.

1. Introduction

Fusarium head blight (FHB) is one of the most economically destructive diseases of wheat (Triticum aestivum L.) worldwide, causing substantial yield and quality loss. Prominent hosts for FHB include all major classes of wheat and barley. In the United States, the principal species responsible for FHB is Fusarium graminearum Schwabe [1]. Fusarium infects developing kernels, causing them to become discolored, undersized, and shriveled. Fusarium damage of kernels (FDK) is a consequence of mycelium present within the grain, which leads to mycotoxin contamination of the grain, most notably deoxynivalenol (DON), a member of the trichothecene group of mycotoxins that is toxic to humans and livestock [1]. Because DON levels in commercial wheat are subject to advisory ceilings in an effort to control grain quality and safety, Fusarium infection and resulting damage to kernels (FDK, Fusarium-damaged kernels) can lead to a load of grain being downgraded or rejected at the point of sale [2]. Adding to the pressure of FHB on wheat in the United States is the increased acreage of maize (Zea mays L.), as F. graminearum’s teleomorph is a common disease of maize and persists on residue in the field [3].
While fungicide application and proper crop rotation can be effective ways to minimize FHB infection and consequently limit FDK, deployment of resistant cultivars remains the most economic and sustainable method of disease control [4]. To accomplish this, breeders must be able to take full advantage of the large variation for FHB resistance available in wheat germplasms by using the proper tools and methods to accurately phenotype and identify resistant varieties [5,6]. Host resistance to FHB is complex and has been dissected into components of resistance ranging from Type I to Type V [7,8]. The classical paper by Shroeder and Christensen (1963) initially developed criteria for Type I and II resistance, and these have consistently remained some of the most applied criteria for evaluating FHB resistance [9,10]. Type I resistance is measured in terms of incidence (percentage of infected spikes) while Type II resistance is measured as severity (percentage of damaged florets among infected spikes). Type I and Type II resistances can be assessed by a visual evaluation in the field, which provides advantages in terms of ease and quickness compared with other resistance measurements. While incidence and severity have been effective criteria for evaluating FHB resistance, Khaeim et al. (2019) points out limitations of using field ratings to evaluate Type I and II resistance: (1) incidence and severity do not always reliably correlate with accumulated toxin levels; (2) optimum timing for rating varies by genotype and environmental conditions; (3) accurate rating requires a random sample, but this is difficult to accomplish or verify in the field; and (4) ratings are likely to differ between personnel if not all done by one individual [11].
While there have been minor inconsistencies across the literature regarding the defining details of Type III, IV, and V resistance components, Type III resistance is generally defined as resistance to kernel damage (minimal FDK) and the downstream Type IV and V resistances are commonly described as DON tolerance or resistance to contamination [12,13,14]. As opposed to FHB incidence and severity, traits assessed during the growing season, FDK is enumerated post-harvest. Consequently, FDK bears a closer relationship with DON content in the physiologically mature grain and has a direct effect on test weight as FDK weigh less than healthy kernels [12,15]. For these reasons, DON and FDK are considered primary traits for their direct effect on yield, quality, and ultimate economic value of the grain, compared to FHB incidence and severity which are considered secondary traits [16].
While FDK determination is universally feasible, DON itself is both expensive and slow to phenotype, generally employing analytical chemistry to determine levels within the grain. For breeding programs evaluating large numbers of samples every year, using a visual resistance measurement correlated with DON such as FDK presents a cost-effective and high-throughput alternative to analytical chemistry. In a meta-analysis of 163 studies by Paul et al. (2005), FDK levels showed moderate to high correlation with DON content in >65% of studies, with a mean correlation of r = 0.73. While a high mean correlation across studies between FDK and DON content was observed, it is important to add that moderate variation remains possible between FDK and DON correlations, e.g., r = 0.34–0.42 in Cowger and Arellano (2013) [17]. Nevertheless, many of these relationships were found to be stronger than the mean correlations of Type I or Type II resistance with DON as determined by Paul et al. in the 2005 meta-analysis: DON with disease incidence (Type I) at r = 0.52, DON with disease severity (Type II) at r = 0.53, and disease index (Type I and Type II) at r = 0.62. This trend demonstrates the necessity of using FDK as the choice ‘proxy’ phenotype for DON resistance when compared to FHB incidence and severity [18,19].
Two traditional methods of quantifying FDK are (1) manual separation, or actual enumeration of healthy kernels and FDK, which is time-consuming and labor-intensive but accurate, and (2) visual estimation, often using prepared standards for reference, which is much faster than manual separation but at some cost in accuracy [16,20]. While traditional methods of using a human observer to determine FDK have shown success, these methods are innately prone to human error such as sample bias and lack of objectivity, as results may vary between observers, or even across time with the same observer [21]. To address these concerns, researchers have explored alternative methods of measuring FDK that limit subjectivity and potentially increase throughput. The two primary categories in which automated methods fall are the use of (1) the use of spectroscopy—sometimes using the visible spectrum, but more often the near-infrared wavelengths to detect differential reflectance, and (2) high-resolution photography and digital imaging software.
Each method of FDK determination produces an FDK dataset at varying throughput, cost, and consistency that must be weighed when electing a method of determining FDK. Additionally, it was hypothesized that FDK, when determined by different platforms, would demonstrate varying phenotypic resolution, causing direct effect on the corresponding FDK dataset’s ability to (1) uncover missing heritability in the FDK trait; (2) capture the genetic variation underpinning Type III, IV and V resistance components; (3) detect trait associations with FHB resistance QTL in genome-wide association studies (GWAS) [22]. Previously, GWAS has been used to associate FDK with major FHB resistance loci such as Fhb1 [23], F1BJ (FHB_1B_Jamestown) [4,24] and F1AN (FHB_1A_Neuse) [18]. Fhb1 has been previously detected using FDK as a trait, while F1BJ and F1AN have been previously associated with DON directly [16]. Fhb1 has been shown to reduce FDK by 32% and DON accumulation by 20% in soft red winter wheat populations [1]. F1BJ has been shown to explain as much as 11.8% of FDK and 9.2% DON variation, and F1AN has been shown to explain 11.4% of FDK and 10.9% of DON variation [18,24].
While individual markers shown to provide resistance to FDK and DON allow for marker-assisted selection (MAS), Agostinelli et al. (2012) found that phenotypic selection for FDK results in nearly the same reduction in DON as strict genotypic selection by retaining homozygous resistant lines at Fhb1 and QFhs.nau-2DL, stating that phenotypic selection over genotypic selection retains a larger effective population size and maintained a higher frequency of minor FHB resistance QTL [25]. Balut et al. (2013) also found that phenotypic selection based on FDK was more effective at reducing DON in progeny than genotypic selection using the same resistant QTL as Agostinelli et al. (2012). These trends are a consequence of the many additional small-effect QTL that confer FHB resistance and why conventional MAS strategies have largely been foregone in lieu of genomic selection methods for developing FHB resistance [26].
Compared to MAS, genomic selection has been shown to outperform phenotypic selection when selecting for resistance to DON and FDK [27]. Rutkoski et al. (2012) found that genomic estimated breeding values (GEBVs) for FHB index (INC, SEV, FDK combined) demonstrated strong prediction accuracies for DON resistance. However, the authors did not test GEBVs for FDK, and FDK was shown to have a lower correlation with DON than other observed FHB traits. The authors concluded the study by highlighting the potential in using genomic selection by employing proxy phenotypes to drive genetic gain for DON resistance. Regarding theses conclusions, a fourth hypothesis is examined in this study; (4) that automated phenotyping platforms will result in increased resolution of the FDK trait and will assist in predicting DON content as a proxy phenotype. Further, Larkin et al. (2021) found that genomic prediction for lines with unknown FDK in a validation population increased in accuracy with training population size, but did not find a similar trend for DON, attributing the lower heritability of DON as the casual factor. The authors noted the value of this phenomenon to breeding programs, as new germplasm is continually added and advanced, accuracy of forward genomic selection has the potential to correspondingly benefit. It is important to add that Zhang et al. (2020) noticed the opposite trend between FDK and DON prediction accuracies and increasing training population size [28]; however, two biparental doubled-haploid populations sharing a common parent (half-sib) were utilized in this study compared to the advanced and elite breeding lines used by Larkin et al. (2021). In respect to the research and application of genomic selection models described above, a fifth and final hypothesis is examined in this study; (5) that automated phenotyping platforms will outperform traditional methods of FDK determination, demonstrating higher prediction accuracies of unknown FDK trait values in validation populations when used to phenotype the training population.
The objective of this study is to employ five hypotheses described above to evaluate universally feasible methods that comprise the common platforms for estimating FDK, both traditional and automated: traditional methods including manual separation (MANUAL) and visual estimation (VISUAL), and the automated methods including spectroscopic phenotyping (NIR), digital imaging (VIBE). These methods for determining FDK, and the corresponding FDK dataset they produce, are henceforth collectively referred to as FDK platforms throughout this text. Additionally, a longstanding analytical chemistry method was used to obtain DON content of grain as observed values to ground truth each FDK platform’s relationship with DON content and said platform’s ability to predict and select for DON resistance among entries. The aim of this study is to characterize and compare the FDK platforms to best provide breeders information on application of methods of FDK determination capable of reliably screening large numbers of wheat lines that will better facilitate development of FHB resistance within breeding material and diverse germplasm, as well as enhancing quality control methods at grain intake points.

2. Materials and Methods

2.1. Summary of Regional Trials

In total, 460 unique lines were replicated in this study, resulting in 1266 samples. Of the 460 lines, 327 had corresponding genotypic data, and a total of 1044 samples were used for genotypic analyses. The dataset utilized for this experiment was collected in four separate trials in three separate locations (Florence, SC, Winnsboro, LA, and Mt. Holly, VA) over two years as part of the SunGrains (Southeastern UNiversity GRAINS) small grains breeding cooperative was utilized for this experiment. Trials were as follows: Uniform Southern Scab Nursery (USSN), Uniform Southern Soft Red Winter Wheat Nursery (USSRWWN) (2019 SC, 2020 SC, and 2020 LA), Gulf Atlantic Wheat Nursery (GAWN), and SunWheat (Table 1), Uniform Bread Wheat Trial (UBWT) (FSC20), and Official Variety Tests (OVT) (FSC19) (Table 1).

2.1.1. Florence, South Carolina 2019 and 2020 (FSC19, FSC20) and Winnsboro Louisiana 2020 (WLA)

The mist-irrigated FHB nursery in Florence was managed each season using a randomized complete block design, where trials (e.g., USSN) represented blocks, replicates (if any) represented sub-blocks, and entries within blocks (and sub-blocks) were completely randomized. With the exception of the USSN (2-row plot), the nursery was planted in a single headrow format that consisted of 1.2 m plot length, 0.6 m alley length, and 38 cm row spacing. The nursery was inoculated with Fusarium graminearum using infected maize kernels as a source of disease, as employed by Balut et al. (2013). To create grain spawn inoculum, isolates of F. graminearum were derived from infected spikelets collected from multiple locations in North Carolina and subsequently isolated and cultured in the Cowger Laboratory at USDA-ARS (Raleigh, NC, USA). Using two applications of 20g, at early and late heading of lines (exactly 2 weeks apart), infected maize kernel inoculum was scattered by hand on the soil surface beneath every row plot for a total of 40 g inoculum. All plots were mist-irrigated twice daily, at 9 am and 4 pm for 30 min, to increase relative humidity for Fusarium pressure to develop.

2.1.2. Mt. Holly, Virginia (MtVA19)

The uniform southern scab nursery was also evaluated in a mist-irrigated FHB nursery at Mt. Holly, VA, managed by the small grains breeding program at Virginia Tech. The trial consisted of 100, 1 m, paired row plots, representing 50 entries with two replicates planted in a randomized complete block design. The trial was inoculated at a single time point prior to heading using 25 g of corn spawn per plot, infected with isolates collected in eastern Virginia. Plots were misted daily as described for the Florence, SC and Winnsboro, LA locations.

2.2. Creation of Phenotypic Dataset

2.2.1. Harvest and Threshing

Plots were harvested and threshed using an Almaco BT-14 belt thresher without forced air to avoid losing lightweight kernels. To remove residue remaining due to the lack of forced air, a series of sieves were used to filter the samples. One thousands kernels were randomly subsampled from each harvested and threshed plot. All FDK platform results are presented as percentage FDK out of one thousand kernels comprising an experimental subsample. The same experimental subsample was used for analysis by each FDK platform.

2.2.2. Manual Separation with Electric Counting (MANUAL)

Healthy kernels and FDK were visually separated by an observer and kernels were counted using an electric counter (International Marketing and Design Corp.). FDK was divided by total kernels (1000) to produce a percentage FDK, denoted as MANUAL in this study. Sensitivity tests for quality control were performed and demonstrated in Table S1. Average throughput time for manual separation with electric counting was 14 min and 45 s.

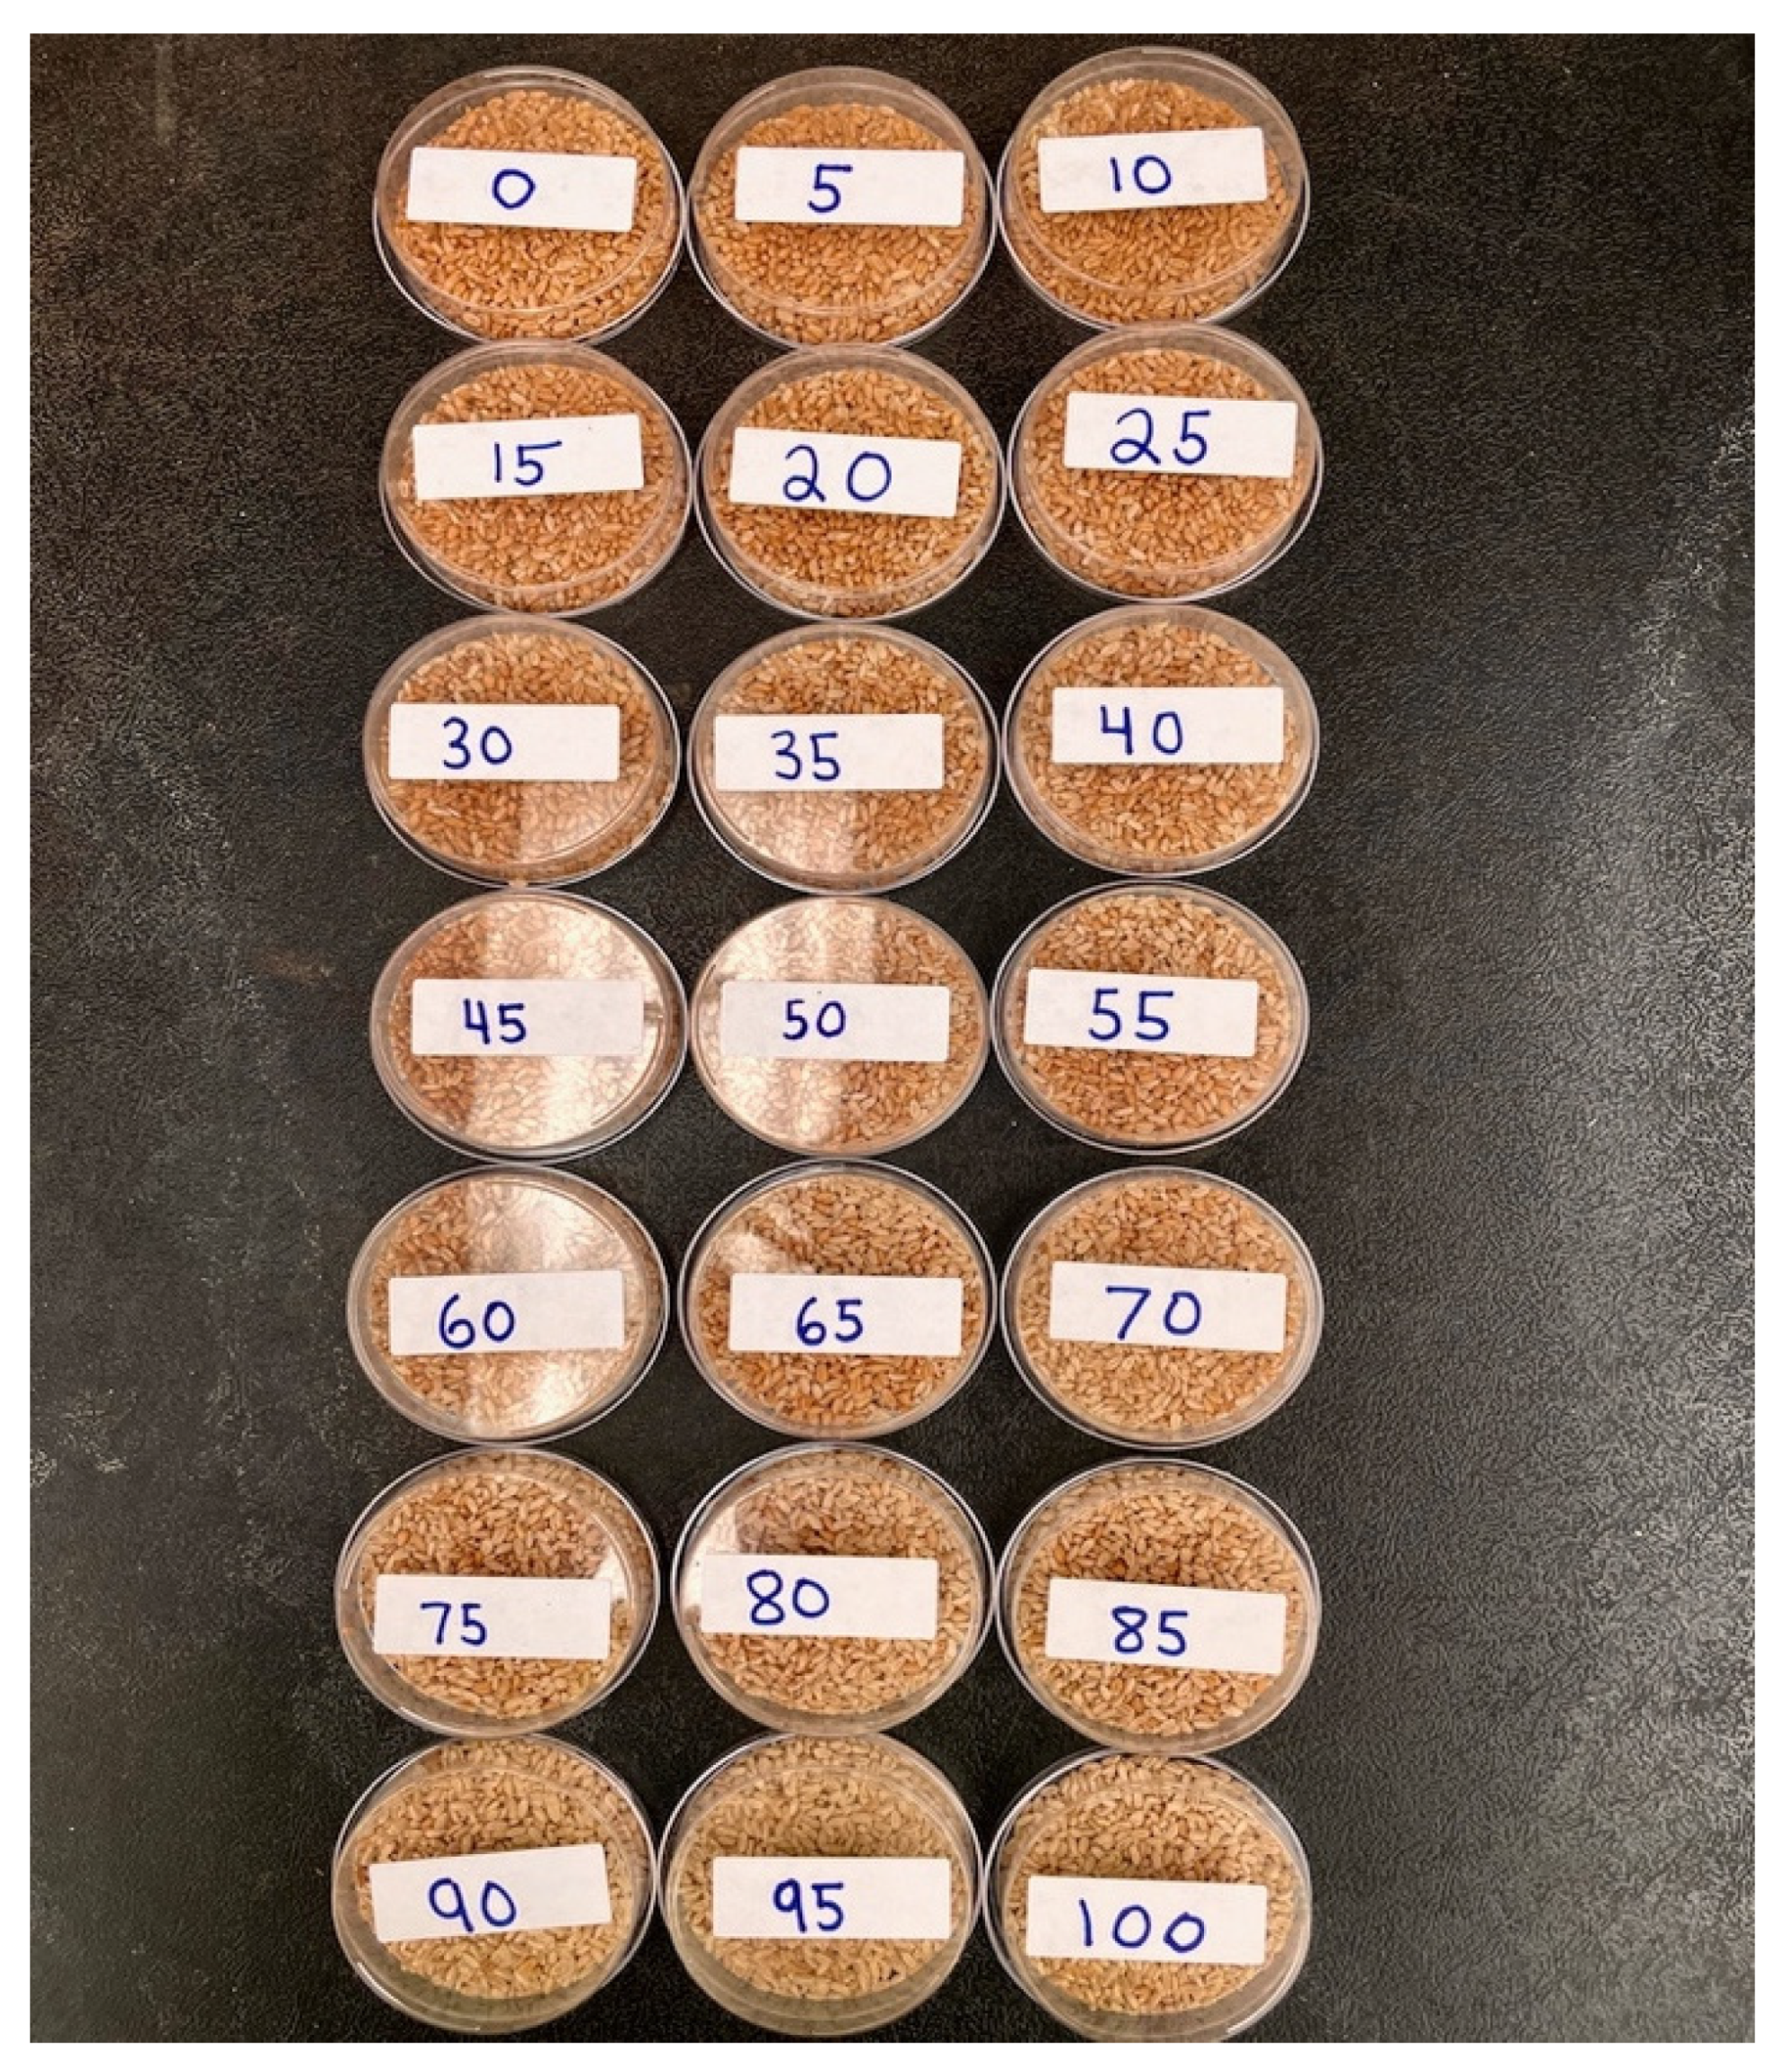
2.2.3. Visual Estimates (VISUAL)

Manually separated FDK and healthy grain fractions of the Hilliard soft red winter wheat variety were combined in lots of one thousand total kernels each to produce samples containing FDK at quantities corresponding to an exact percentage of the total sample, in increments of 5% (e.g., 50 FDK/1000 total kernels = 5%, 100 FDK/1000 total kernels = 10%). These carefully curated samples were placed in clear Petri dishes to create predetermined standards of FDK percentages to act as visual guides for an observer to administer estimations (VISUAL) of experimental subsamples (Figure 1). Average throughput of VISUAL using predetermined standards was 45 s per subsample.

2.2.4. Near-Infrared Spectroscopy (NIR)

Grain samples of Hilliard ranging from 0% FDK to 100% FDK were analyzed on a Perten DA7250 NIR analyzer (Perten Instruments) using a 950–1650 nm wavelength range. A calibration model was created for FDK analysis by analalyzing each predetermined FDK standard by filling grain to the absolute capacity of a 43 mL Teflon dish, ensuring grain was as close as possible to perfectly flush with the edges of the dish. Grain samples were analyzed starting at 100% FDK, working in 1% increments down to 0% FDK. However, healthy kernels are larger than Fusarium-damaged kernels, and consequently healthier samples fill the total volume of the 43 mL Teflon dish at a lower kernel number than samples that are a majority FDK. To account for this, the ratio of FDK to healthy kernels was separately calculated and counted out at each percentile to ensure that the Teflon dish was filled properly to 43 mL and that FDK to healthy grain ratio most closely represented each 1% percentile increment (Table S2). The standard representing 100% FDK consisted of 800 FDK and no healthy kernels, and sample 00 represented 0% FDK and 100% healthy kernels. Due to adjusting volume rather than kernel number to decrease 43 mL dish content from 100% FDK down to 0% FDK, sample 0 was 0.009 FDK. To account for this, standard 00 was included for a total of 101 standards to ensure that FDK percentage reached absolute zero. Each of the 101 total samples were analyzed three times, each time rotating the Teflon dish 1/3 of a rotation clockwise. It should be noted that these standards were not measured for DON content; consequently, the NIR curve was developed to predict the percentile of Fusarium-damaged grain within a sample rather than DON content. Ultimately, the maximum coefficient of determination obtained after extensive calibration of the NIR curve to observed values (the 101 samples of grain that most closely represent each individual percentile) in Table S2 resulted in an R2 of 0.98 (Figure S1). NIR averages 1 min and 45 s per experimental subsample.

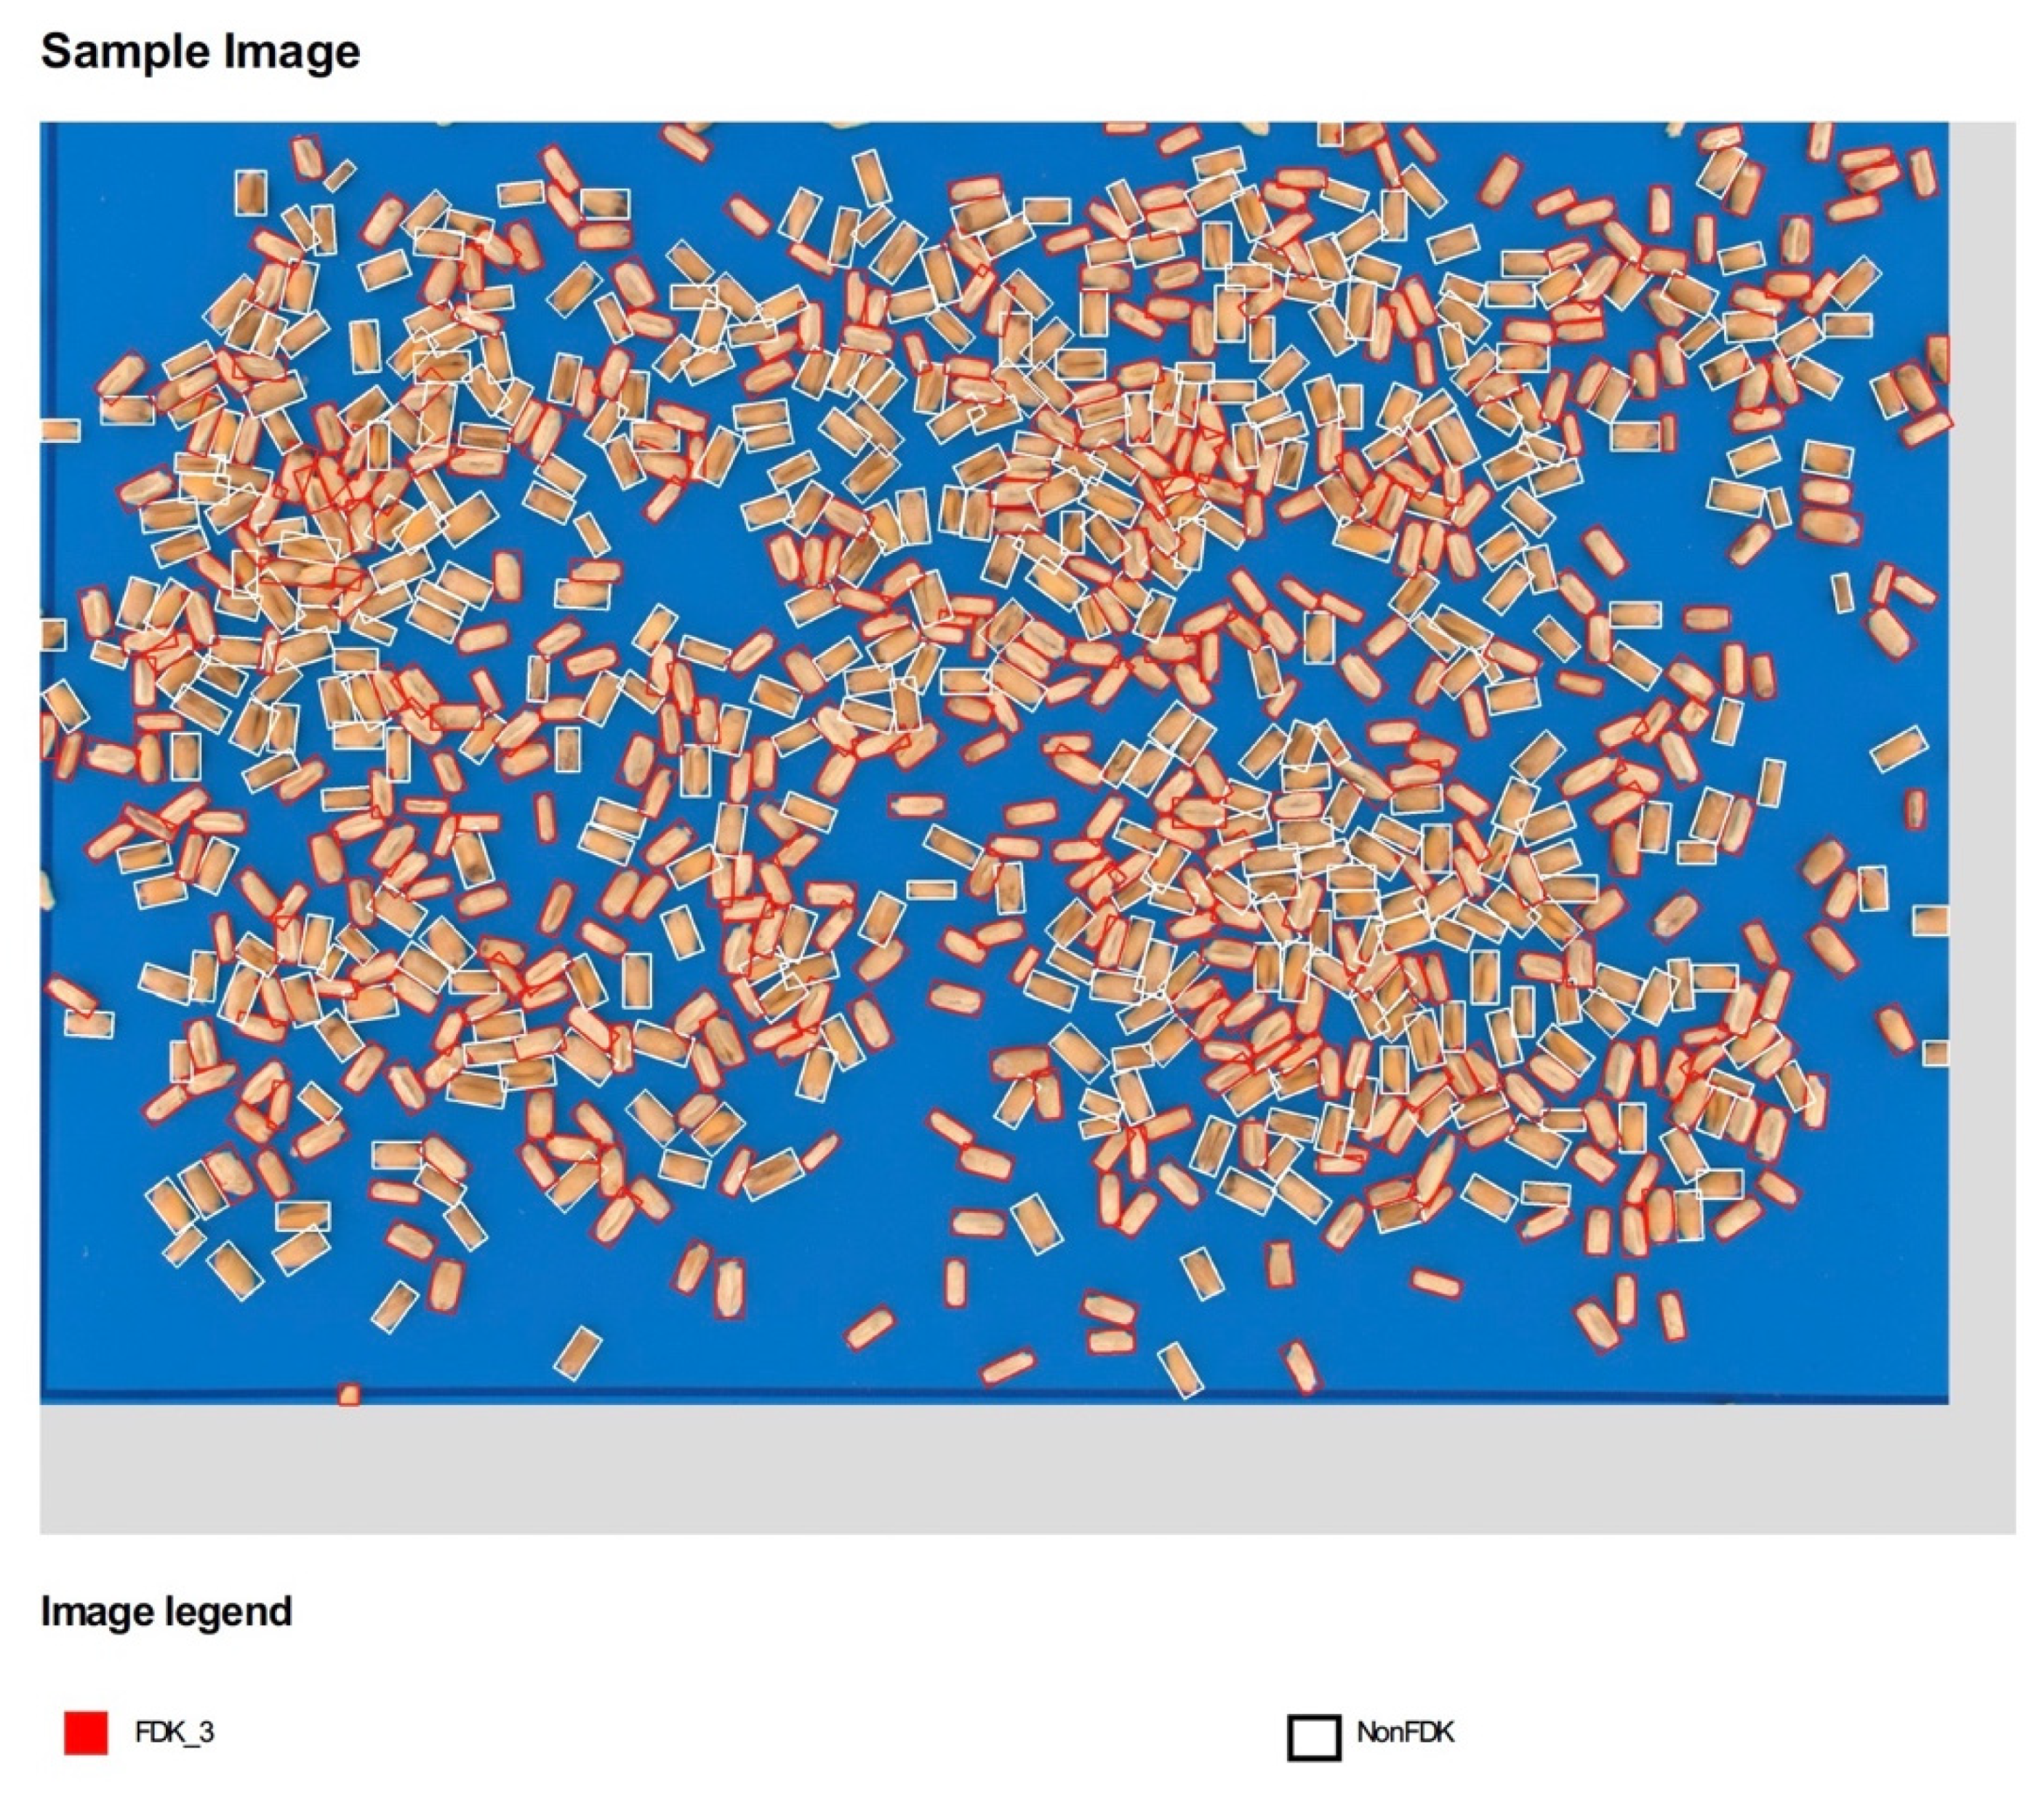
2.2.5. Vibe QM3 Grain Analyzer (VIBE)

The Vibe QM3 is a grain analyzer, developed by Vibe Imaging Analytics, that is a digital imaging platform capable of analyzing kernels to count grain number, classifying each kernel by size, shape, and color, in addition to weighing samples. Report output for Vibe QM3 analysis is shown in Figure 2 and Table S3. Vibe QM3 differentiates FDK from healthy kernels by means of a parametric calibration file calibrated for wheat kernels. Color was determined by utilizing 3000 color pixels per kernel, allowing differentiation of colors such as chalky, red, and yellow among others. Kernel size was determined at <50 micron accuracy to produce length, width, area, and length to width ratio of each individual kernel [29]. Fusarium-damaged kernels were denoted as FDK_3 and healthy kernels were denoted as nonFDK (Figure 2), names both representative of corresponding calibration files. Each day that experimental testing was performed using Vibe QM3, quality control tests were performed on the predetermined standards of 0%, 35%, 50%, 85%, and 100% FDK, by dispersing grain from Petri dishes to the Vibe QM3 loading tray. VIBE QM3-estimated FDK percentages (VIBE) of predetermined standards were shown to be highly reproducible over nine days of testing (Table 2). Time required for each analysis averaged 1 min and 49 s per subsample.

2.2.6. Deoxynivalenol (DON) Analysis

Following the determination of FDK phenotypes, 50 g of experimental subsamples were sent to the Virginia Tech Deoxynivalenol Testing lab. Samples were milled in a Hammertec™ sample mill to the consistency of flour, and 1 g was used for analytical chemistry. DON content was determined using gas chromatography and mass spectrometry (GC/MS) with an Agilent 6890/5975 based on methods from Tacke & Casper (1996) [30]. Sample results presented throughout this research are in parts per million (ppm). Sample results from FSC19 and MtVA19 were used for analysis.

2.3. Genotypic Data

The lines used in this study were genotyped at the USDA-ARS Eastern Regional Small Grains Genotyping Lab at Raleigh, NC, USA. The original genotypic dataset included 20,919 single-nucleotide polymorphisms (SNPs), filtered by requiring linkage disequilibrium (LD) < 80%, minor allele frequency greater than 5%, and maximum heterozygosity of a sample at 20%, resulting in a final dataset of 5462 SNPs. TASSEL V5.2.78 was used to analyze for population structure, the first nine principal components were found to explain >30% of population structure (0.3008) [31]. Kinship for GWAS and genomic prediction pipelines was derived from the same additive genomic relationship matrix created from the A.mat function as part of the sommer package v4.1.5 [32] using the VanRaden method [33], in order to maintain continuity between both analyses. Major FHB resistance QTL Fhb1 [34,35], F1BJ [4,24] and F1AN [18] are shown to have allele frequencies of 15.4%, 27.5%, 36.6% across entries, respectively.

2.4. Phenotypic Analysis

All analyses performed with R used version 4.1.2 [36]. Best linear unbiased estimates (BLUE) were created for all FDK platforms across all environments using the lme4 package version 1.1–27.1 in R [37], and were used in subsequent genome-wide association studies to test the mapping capabilities of each FDK dataset determined by corresponding FDK platform [38]. The following mixed model was utilized to create BLUE values:
Y J I T = μ + g e n o t y p e J + e n v i r o m e n t I + t r i a l T % i n % e n v i r o n m e n t I + g e n o t y p e J × e n v i r o n m e n t I + e J I T  
where Y J I T is the observed phenotype of line J in trial T of environment I. μ is the overall mean, genotypeJ is the fixed effect of the Jth line, environmentI is the fixed effect for the location:year combination, trialT is the random effect for the Tth trial within environmentI, genotypeJ x environmentI is the interaction between the Jth genotype in the Ith environment, and eJIT is the random error term. The emmeans package was used to extract effect estimates and create BLUEs for each genotype [39]. Because of imbalance in the DON dataset, broad-sense heritability was calculated in R by using the heritability package according to the following equation for all datasets to maintain continuity for evaluation [40]:
H 2 = σ 2 G σ 2 G + σ 2 e n
where σ 2 G is genetic variance and σ 2 e is error variance over number of observations (n) for each genotype.

2.5. Genetic Correlations between FDK Platforms and DON

The BME function in the Bayesian multi-trait and multi-environment (BMTME) R package version 1.0.19 [41] was used to create an additive genomic relationship matrix and extract genetic covariance between FDK platforms and DON. The unstructured matrix of genetic covariance (Σt) of traits (L) of order L × L, was developed using the following equation from [41]:
b 2 N M J I × L ( 0 , Σ E G g , Σ t )  
where b2 is the effect of genotype (J) × environment (I) × trait (L) interaction distributed under a matrix-variate normal distribution of NMJI×L, ΣE is the unstructured covariance matrix of order L × L where E is the matrix of residuals n × L, ⊗ is the standard vector operator of the Kronecker product, and Gg is the genomic relationship matrix of order J × J [33]. Σt is the unstructured genetic covariance matrix of traits of order L × L. The genetic covariances were extracted and converted to a correlation matrix using the cov2cor function in the R stats package version 4.1.2.

2.6. Genome-Wide Association Studies

Genome-wide association studies (GWAS) were performed for each FDK trait using the BLINK package [42] in GAPIT3 V3.1 [43] to compare the mapping capabilities of each FDK phenotype. BLUE values were used as the phenotypic dataset to account for imbalances between locations and prevent over shrinkage of genomic effect toward the mean as this study was performed in two stages: phenotypic analysis (creating BLUEs) followed by GWAS. BLUE values with corresponding genotypic data (327 total across all four environments) were used for GWAS. The additive relationship matrix described above and derived from sommer was used to account for kinship as a random covariate and maintain continuity with genomic prediction pipeline. Four principal components were used to account for population structure as determined by scree plots. A significance threshold of −log10(p) = 5.038 was used to identify significant SNP associations. FDK platforms were evaluated for the ability to detect SNPs associated with FHB resistance QTL: Fhb1, F1BJ, and F1AN with allele frequencies of 15.4%, 27.5%, 36.6% across the sampling population, respectively.

2.7. Genomic Prediction

Due to the extremely quantitative nature of the FDK trait, genomic prediction was performed using ridge-regression best linear unbiased prediction (rrBLUP) to create genomic best linear unbiased prediction (G-BLUP) genotypic values [44]. Genomic prediction was performed by inputting raw phenotypic data of all entries into the kin.blup function as part of the rrBLUP package v4.6.1 [45] in R, solving mixed models of the following form:
y = X β + [ Z 0 ] g + ϵ
where X and Z are design matrices of the form (n x p) and (n x m), respectively. β is the vector of fixed effects, g is random genotypic effect derived from the additive relationship matrix, and ϵ is the error term. Genotypic covariance was utilized as a random effect and considered additive by utilizing the additive relationship matrix developed previously from sommer. Environment was input as a categorical fixed effect consisting of single values represented by location:year combinations. The model performed a five-fold cross validation based on stratified grouping of entries, placing 80% of entries in the training set and 20% in the testing set throughout each run. The 20% of entries within the testing set were masked in the training set as “NA” while the other 80% of observations were included. This process was repeated five times for each trait, ensuring every entry was masked in the training set to create predicted values and included into the validation set as observed values throughout each five-fold run, creating an entire set of predicted G-BLUP to observed G-BLUP values. Pearson’s correlations were created for predicted G-BLUPs in the training set (where they were masked) and observed G-BLUPs in validation set. Five-fold cross validation for each trait underwent 1000 iterations for 1000 Pearson’s correlations for an entire set of observed and predicted G-BLUP values for each trait (Table S4). G-BLUPs were also developed using all observed values, to create genotypic values to utilize the entire dataset as genomic estimated breeding values (GEBVs) to predict corresponding DON resistance of lines. FDK GEBVs were tested for their relationship with GEBVs created for DON content per line, termed DON resistance rather than DON content as it represents a line’s ability to prevent DON accumulation rather than DON content of a specific sample.

3. Results

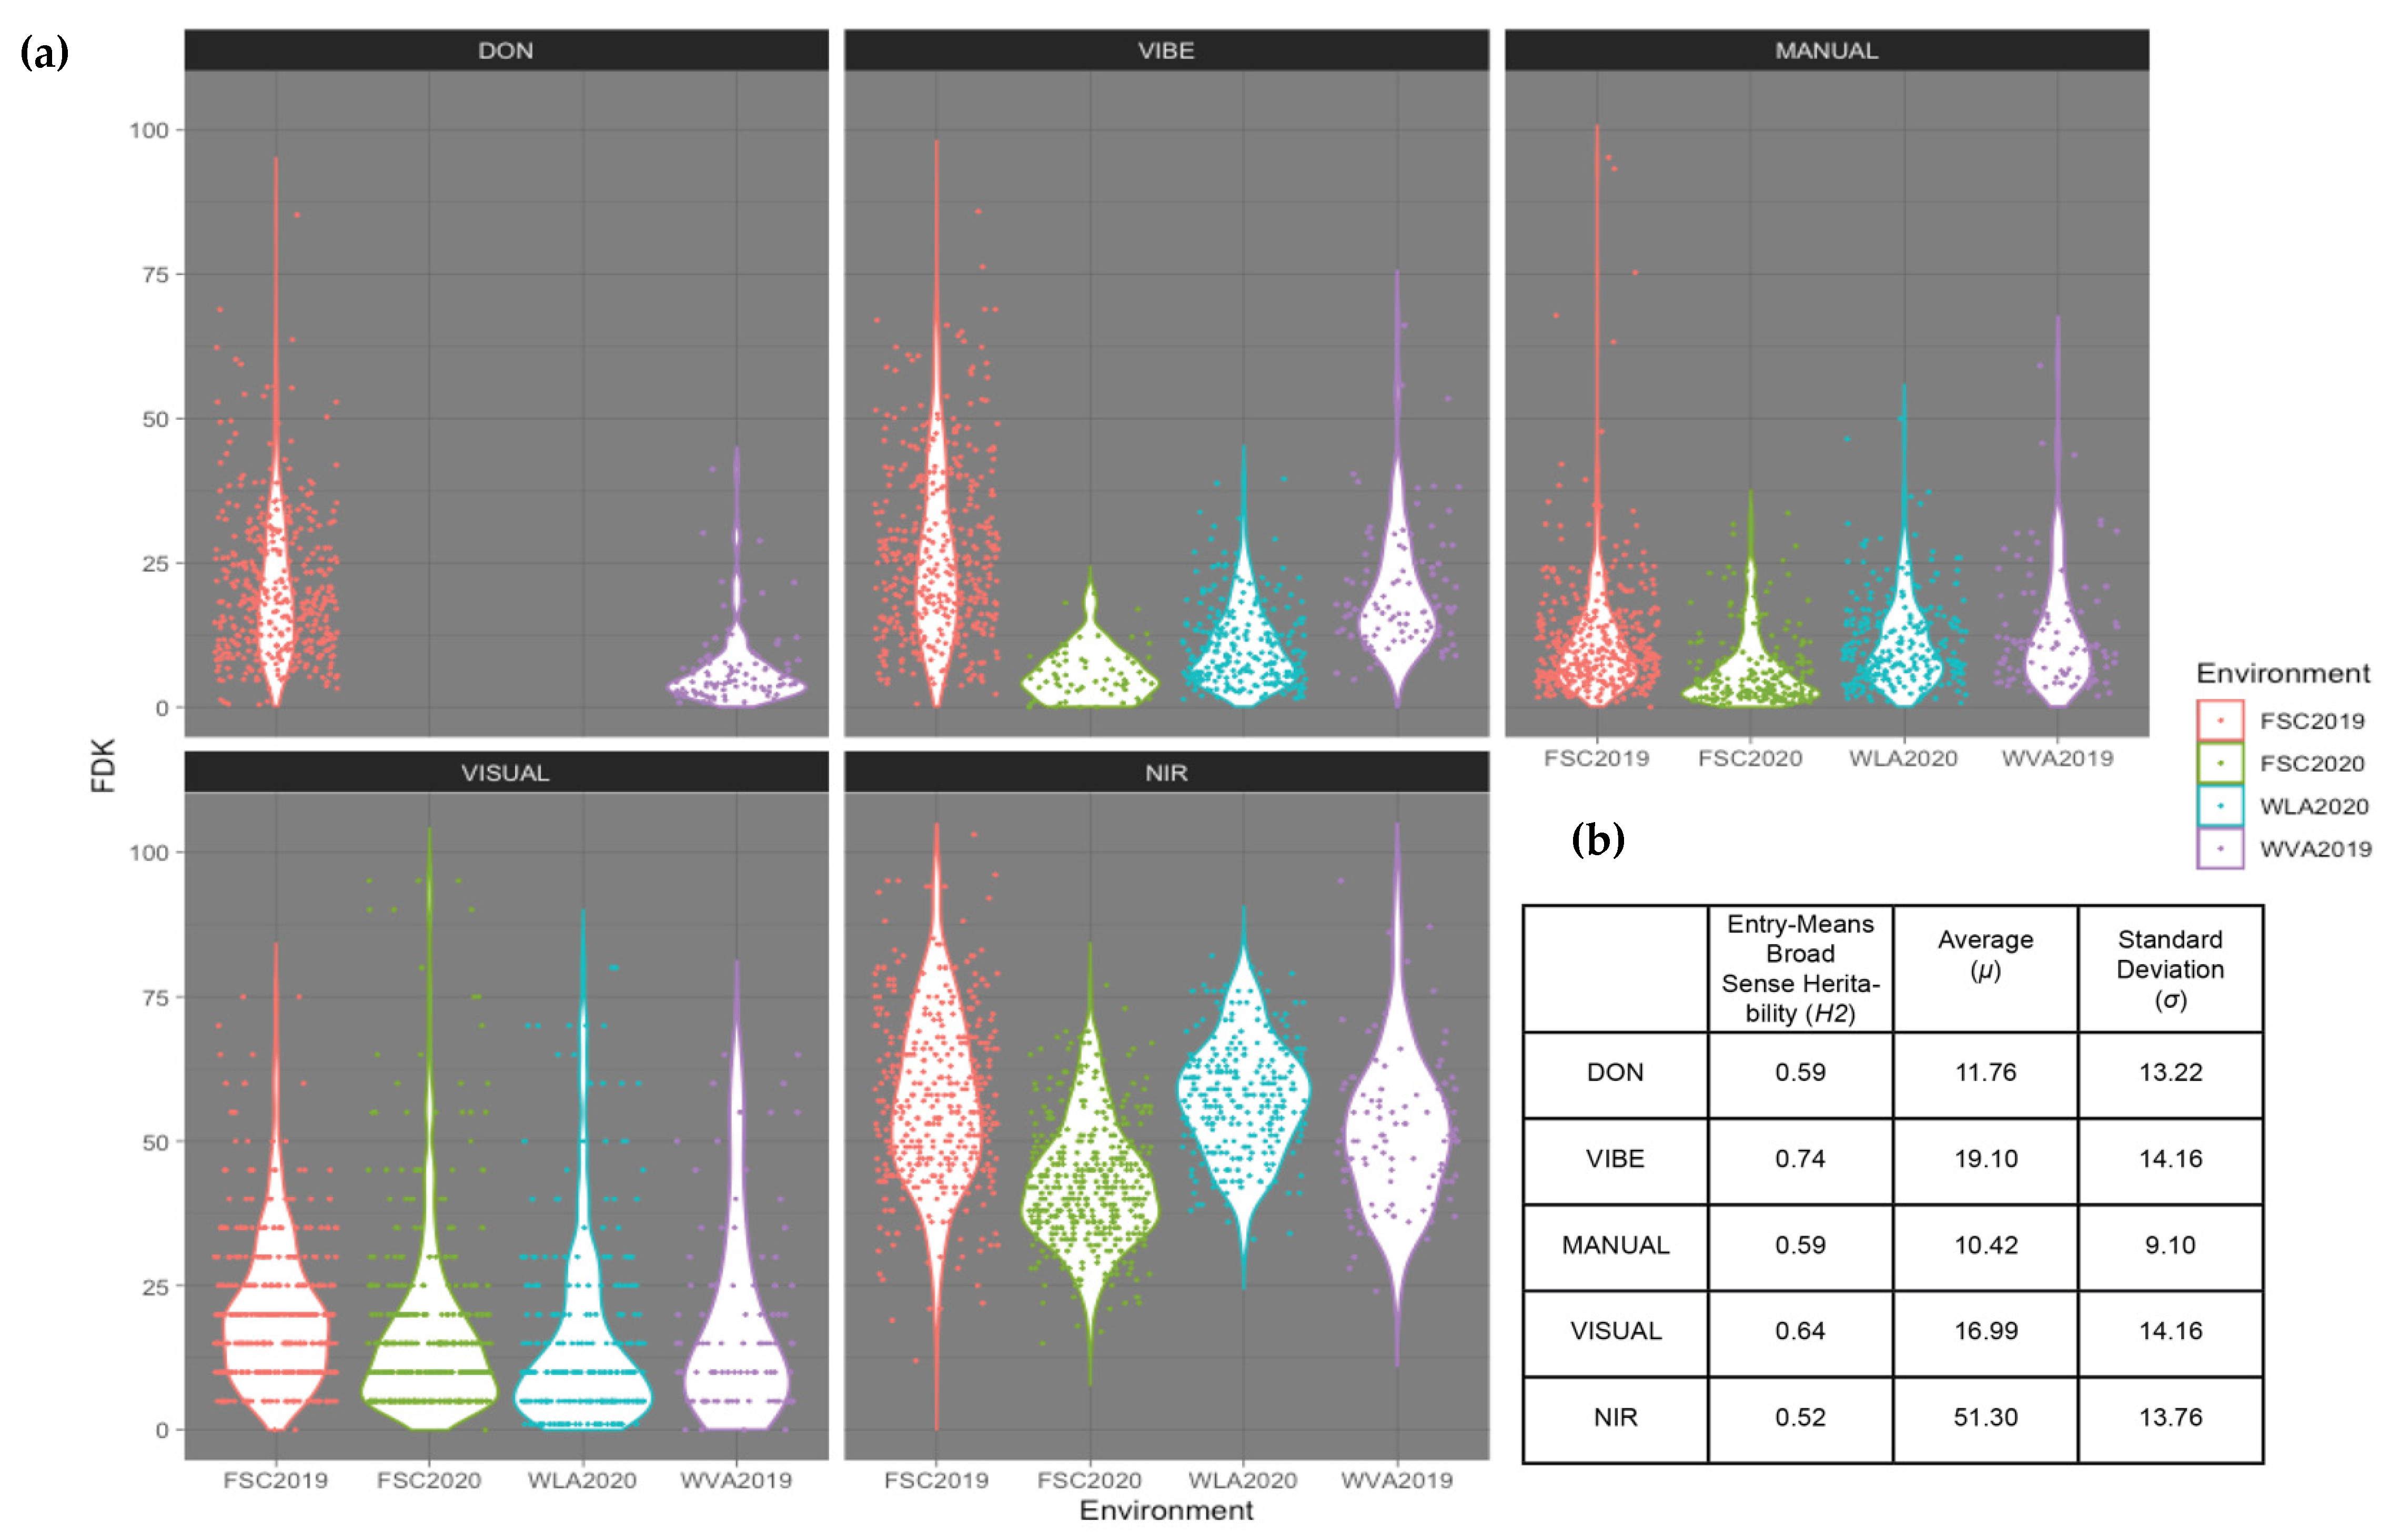
3.1. Variation among FDK Platforms and DON Content

All FDK platforms (reported as a percentage of FDK out of 1000 kernels) demonstrated continuous and unimodal distribution across subsamples (Figure 3 and Figure 4). NIR was an exception and demonstrated a higher threshold on average (min = 12%, μ = 51.46%) (Figure 3a,b). NIR failed to estimate an experimental subsample to have FDK lower than 12%. Due the higher threshold of NIR phenotypes, FDK was overestimated by a large margin by this platform, with a mean value of 51.5% FDK per experimental subsample. Additionally, NIR labeled a single sample over 100% FDK (103%), determining the sample to have a higher percentage FDK than the 100% FDK sample provided to calibrate the NIR curve. VIBE, MANUAL, and NIR all ranked this experimental subsample (LA08281C_P4_3_1, FSC19, SUNW) as having the highest FDK percentage among all samples. Similar to NIR, VIBE was unable to estimate a sample as 0% FDK, having an average error of 5.84% when analyzing the 0% FDK standard; consequently, VIBE had the second highest threshold for FDK. VIBE was shown to have a broad-sense heritability on an entry means basis of 0.74, followed by MANUAL, VISUAL, NIR and DON resistance with respective values of 0.59, 0.64, 0.52, and 0.57 (Figure 3b). Figure 4 correlation matrix was developed using Performance Analytics R package [46].

3.2. Vibe Demonstrates Strongest Association with DON Content

3.2.1. Raw Phenotypic Data Correlation with DON

DON content was shown to be moderately to highly correlated with all observed FDK platforms across all environments (r > 0.50) (Figure 4). Of the FDK platforms, VIBE had the strongest relationship with DON content, with a correlation coefficient of r = 0.81. MANUAL, VISUAL, and NIR methods produced correlation coefficients of r = 0.65, 0.75, and 0.61 with DON content, respectively. In addition to demonstrating a strong relationship with DON content, VIBE displayed a moderate relationship with the primarily visual FDK platforms as demonstrated by correlation coefficients of r = 0.64 and r = 0.67 with VISUAL and MANUAL, respectively.

3.2.2. Genetic Correlations among Platforms

Genetic correlation represents the amount of covariance two platforms share due to genetic causes [47]. Genetic correlations showed that strong genetic influences were shared between all FDK platforms with DON resistance (Figure 5a). VIBE was shown to share the highest degree of genetic overlap with resistance to DON accumulation (r = 0.87). MANUAL was shown to have a higher genetic correlation with DON (r = 0.82) than did VISUAL (r = 0.63). NIR had the lowest genetic correlation with DON resistance (r = 0.57).

3.2.3. FDK Platforms Ability to Predict DON Resistance

VIBE GEBVs produced the highest coefficient of determination with DON resistance GEBVs (R2 = 0.76) (Figure 5b). MANUAL and VISUAL demonstrated similarly strong predictive abilities at R2 = 0.75 and R2 = 0.71, respectively. NIR GEBVs demonstrated a lower predictive ability of DON GEBVs at R2 = 0.48 (Figure 5b).
VIBE as a raw phenotype demonstrated the greatest coefficient of determination (R2 = 0.63) with DON by a considerable margin, compared to MANUAL (R2 = 0.27), NIR (R2 = 0.31), and VISUAL (R2 = 0.71) (Figure 5c).

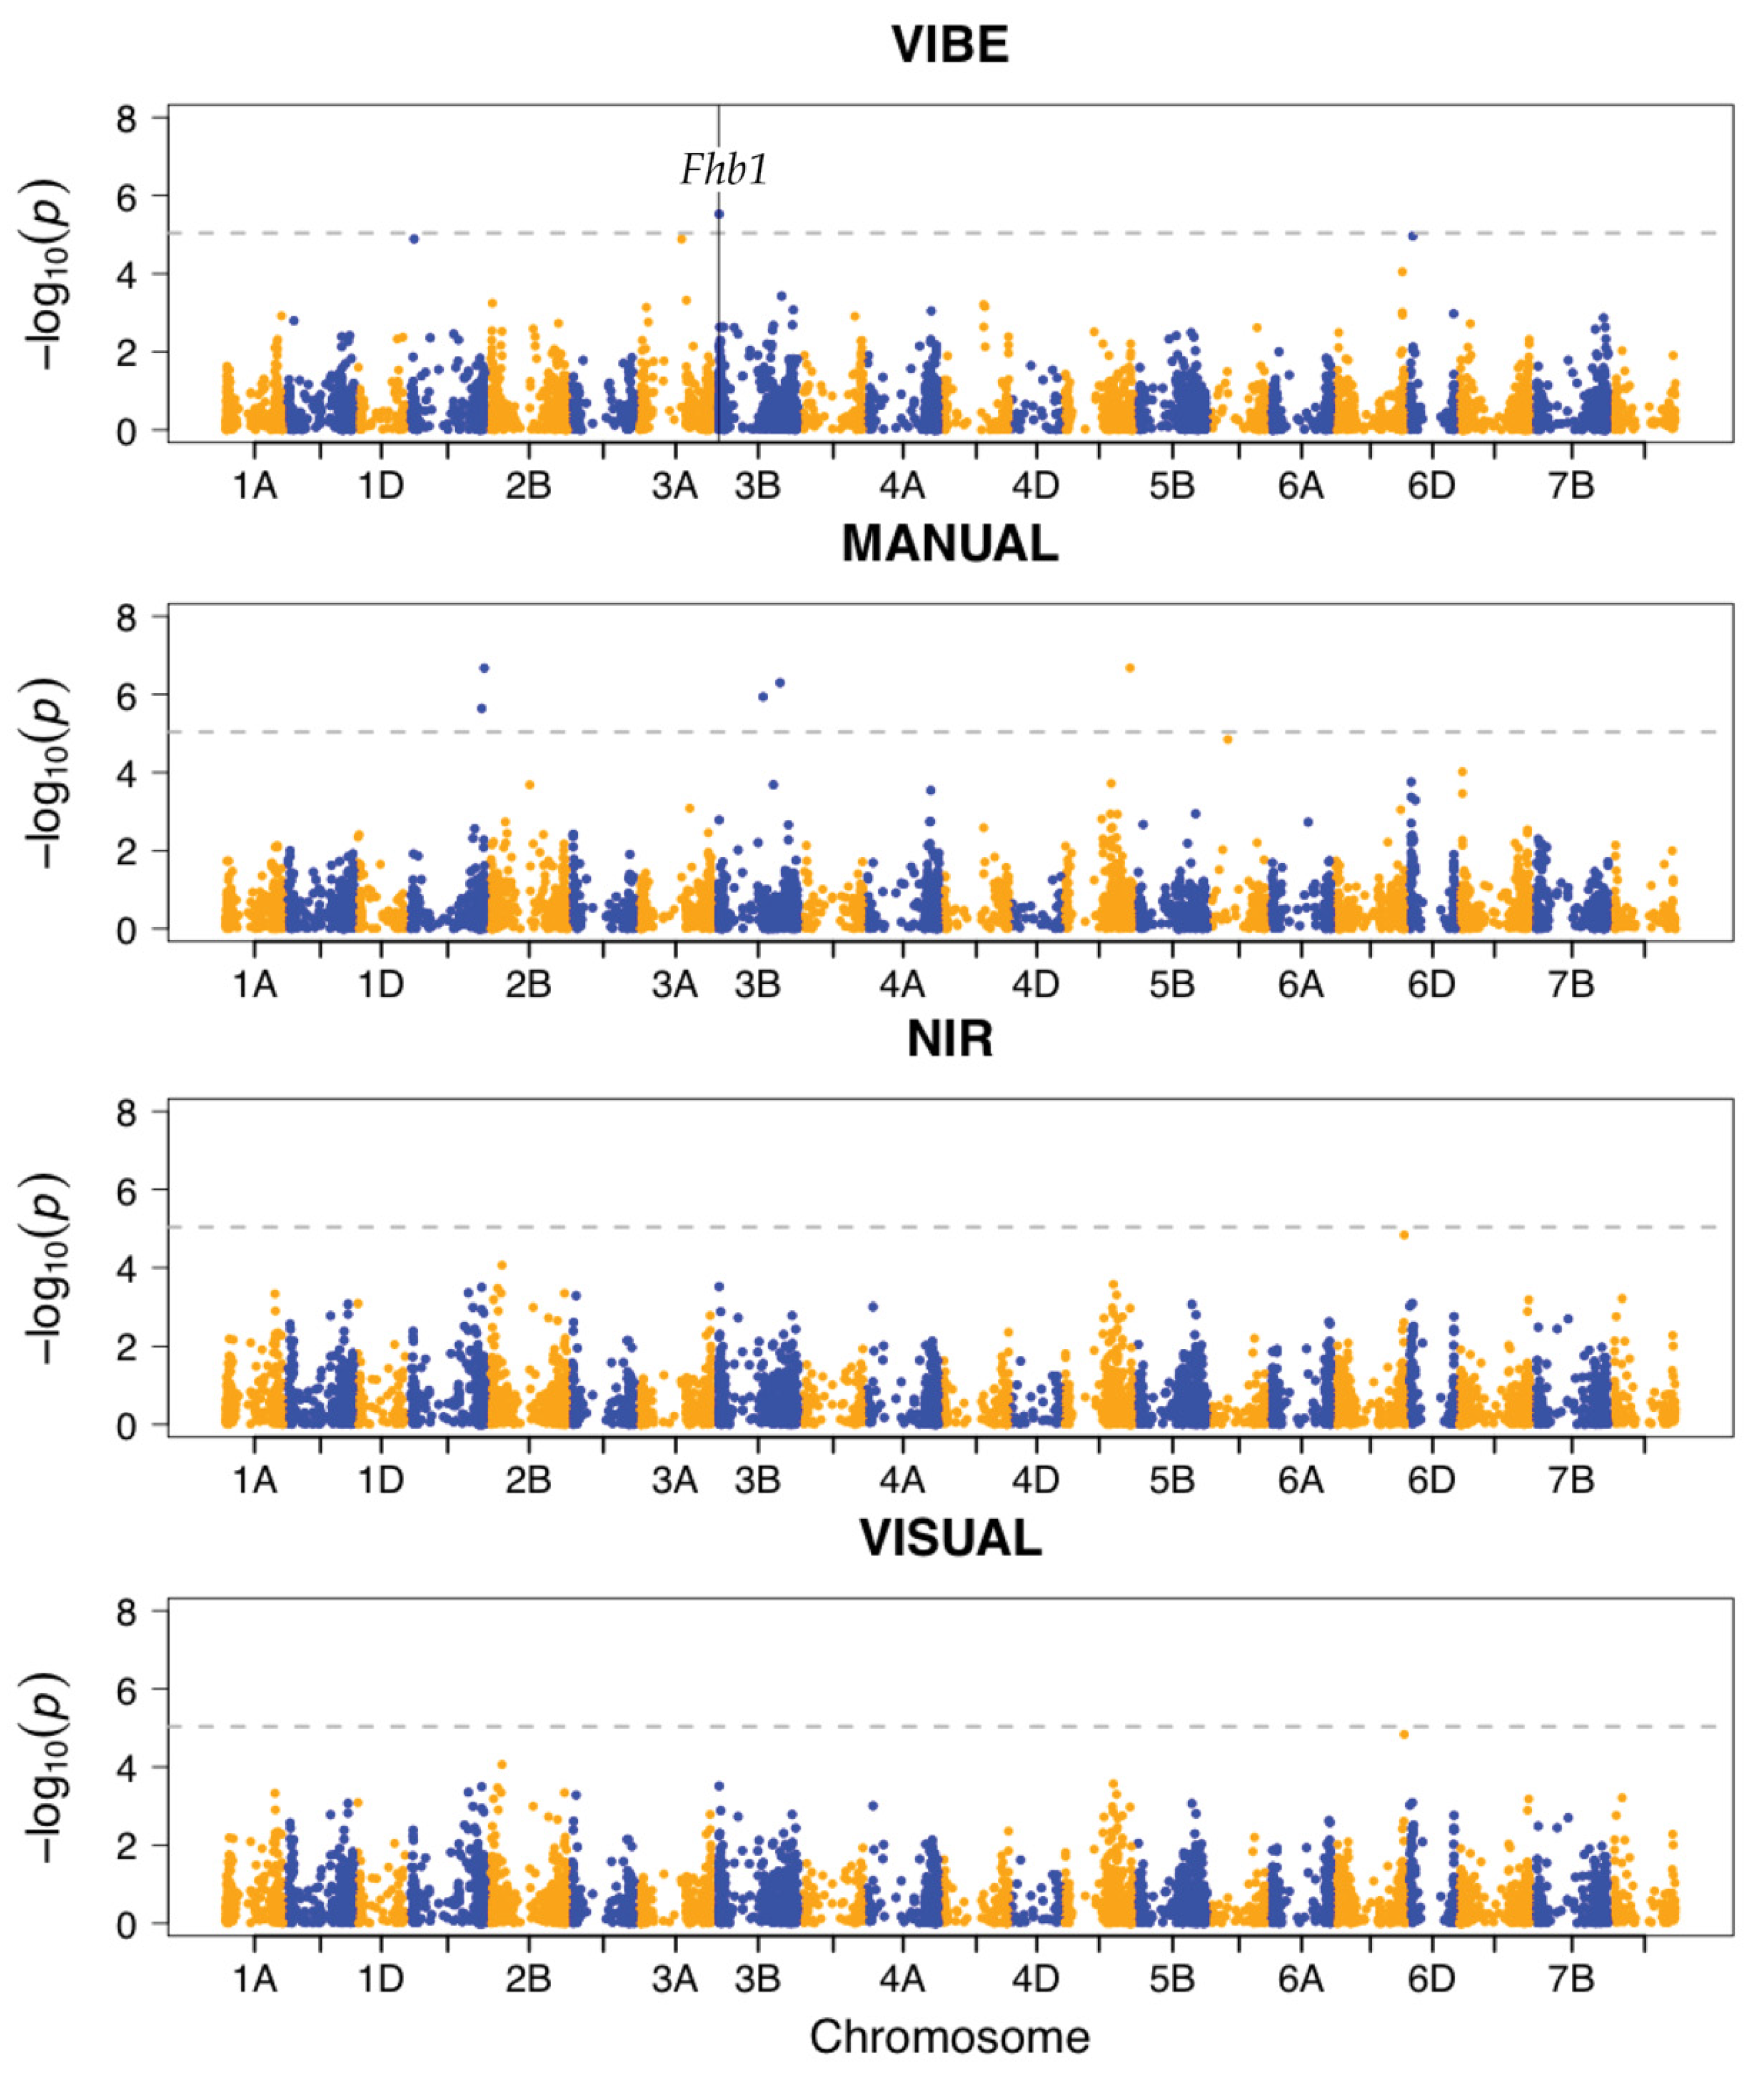
3.3. VIBE Detects Significant SNP Association in Fhb1

GWAS results showed VIBE to detect significant SNP association at locus S3B_9439629, known to be within Fhb1 QTL on chromosome 3B (Figure 6, −log10(p) of 5.53) [48]. MANUAL was unable to detect any significant associations within the major FHB resistance QTL. However, significant associations with SNPs were detected by MANUAL on chromosomes 2A, 3B, and 4D. VISUAL and NIR showed no potential associations with SNPs within major FHB resistance QTL.

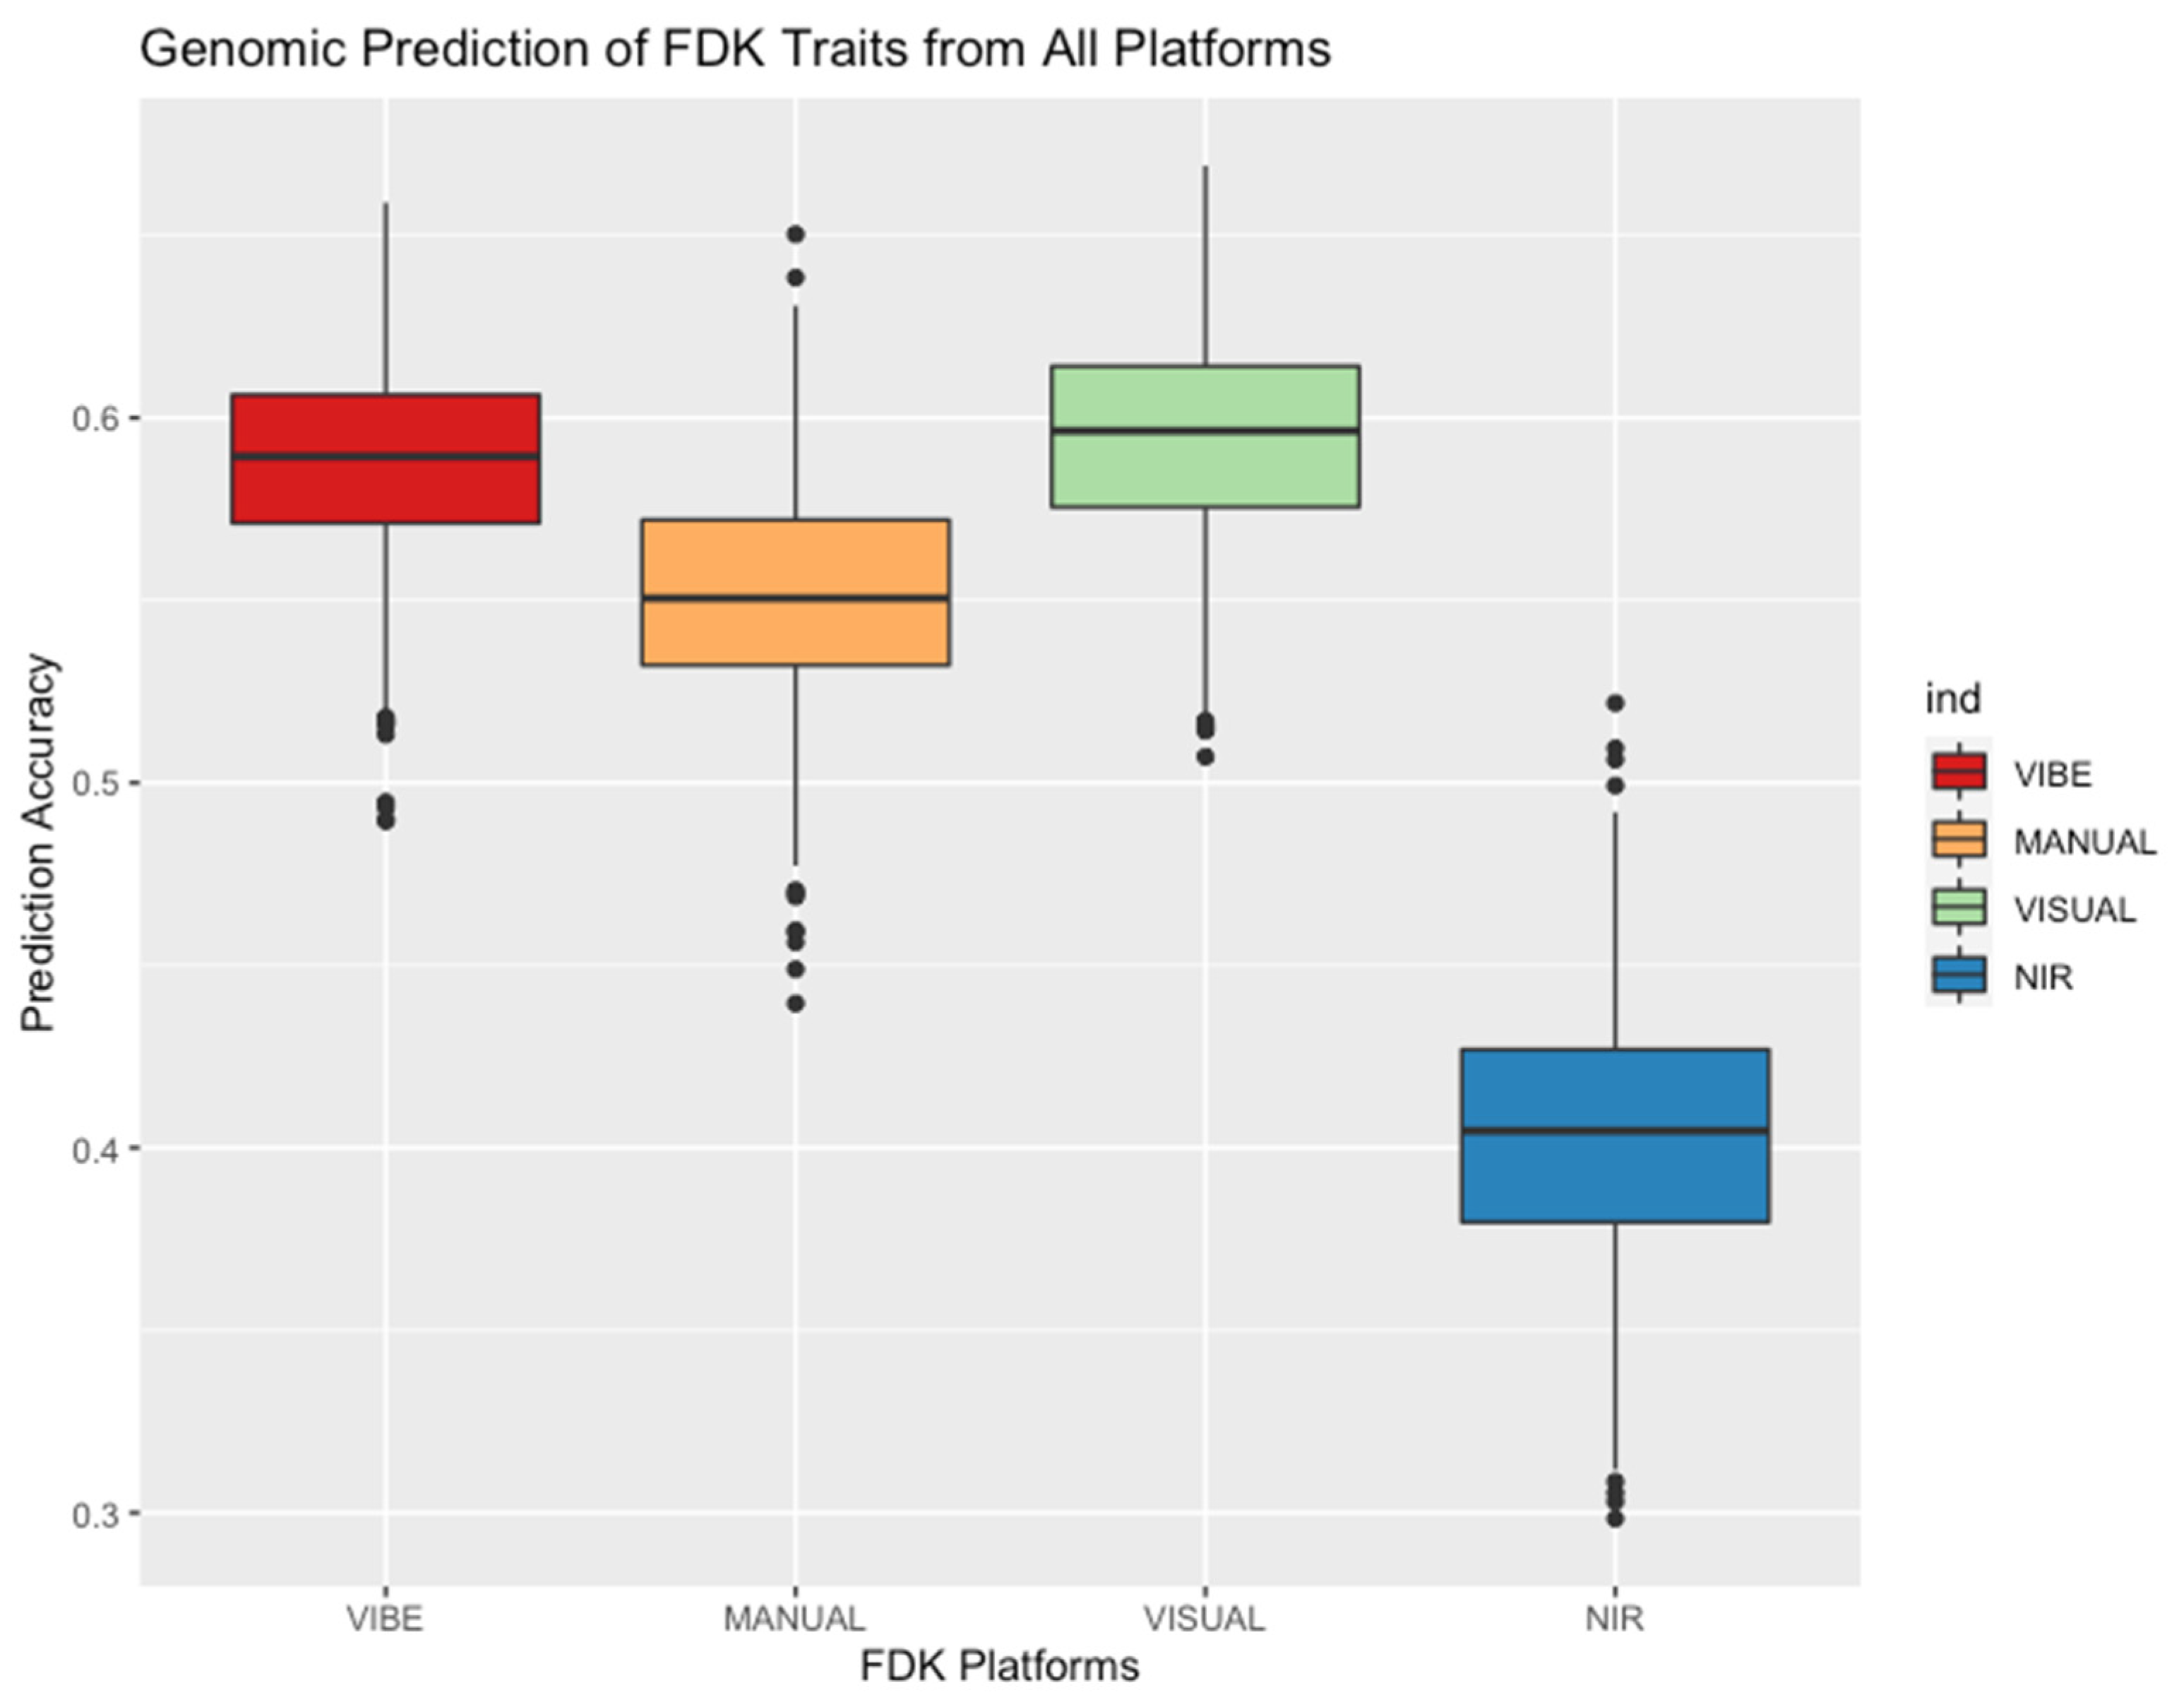
3.4. VISUAL and VIBE Show Highest Prediction Accuracy among FDK Platforms

High predictive accuracies (r > 0.50) were shown when comparing observed and predicted G-BLUPs for VIBE, MANUAL, NIR and VISUAL (Figure 6, Table S4). VISUAL estimates showed the highest prediction accuracy among all methods with an average r = 0.594. VIBE showed the second highest average correlation coefficient between observed and predicted values, with an average correlation coefficient of r = 0.588. MANUAL showed high prediction accuracies with an average Pearson’s correlation of r = 0.56 and NIR-derived G-BLUPs showed to be relatively inaccurate, with an average accuracy of r = 0.40.

4. Discussion

Consistent and accurate methods of quantifying FDK and predicting DON content are necessary for the development of resistant cultivars and the screening of grain lots for grain quality. In this study, the functional potential of four different platforms capable of enumerating FDK were compared following the five hypotheses established in the intro restated as evaluation criteria below:
  • Minimization of cost and the ability to uncover maximum FDK heritability.
  • Maximization of the genetic relationship of the FDK trait and DON resistance.
  • Accurate prediction of DON content resulting in effective use as a proxy phenotype.
  • Ability to detect associations within major FHB resistance QTL known to be within sampling populations that control variation for FDK and DON: Fhb1, F1BJ, F1AN.
  • Optimize the FDK trait to provide increased accuracy in genomic prediction models.
MANUAL has been regarded as a baseline of accuracy for FDK enumeration [21], obtained through meticulous hand separation resulting in the slowest throughput by over ten minutes at 14 min and 45 s as observed in this study. Maloney et al. (2014) compared a similar manual separation method to digital imaging, and is careful to describe that the less-than-perfect correlations between the two (r = 0.72–0.80) may reflect lower phenotypic resolution by MANUAL rather than digital imaging, attributing larger grain sample sizes examined by digital imaging as a possible factor. In comparison, this study employed an equal quantity of 1000 grain experimental subsamples for both VIBE and MANUAL, and ultimately found lower correlation between MANUAL and VIBE (r = 0.64) than did Maloney et al. (2014). Similarly, other MANUAL strategies have been shown to have high success in the past, having demonstrated high correlations with DON (r = 0.91, 0.88) [18,49], compared to the r = 0.65 observed in this study (Figure 4). This study employs the largest sample size of the studies mentioned above, encompassing the genetic diversity of several breeding programs, which is likely to cause decreased resolution in MANUAL due to subjectivity and error confounding across increased examination windows from human observers. Additionally, a slight inaccuracy of counting smaller, damaged FDK (within +/− 5 kernels) from the electric seed counter when counting 1000 kernel subsamples could contribute to MANUAL’s lower correlation with VIBE observed in this study (Table S1). Further building on the statement by Maloney et al. (2014) of an overestimation of MANUAL to other methods, MANUAL was largely outperformed by VIBE in all evaluation categories except for cost. (Table 3).
MANUAL demonstrated a high genetic correlation with DON resistance (r = 0.82) (Figure 5a), and strong prediction of DON content as GEBVs (R2 = 0.75, Figure 5b). Additionally, prediction accuracies of MANUAL reflected that of other studies that have employed rrBLUP prediction models such as Verges et al. (2020), which saw correlation coefficients ranging between r = 0.46 and r = 0.60 compared to the accuracies seen in this study ranging from r = 0.48 to r = 0.66 (Figure 7). While MANUAL proved effective in quantifying FDK and estimating DON in this study, the low through-put makes the application in large breeding programs limited. Additionally, the assumption of MANUAL as a benchmark FDK phenotype should be reevaluated as more improved methods of FDK determination are developed and deployed.
VISUAL provides the most discrete dataset compared to the MANUAL, VIBE, and NIR, which all provide highly continuous data. Consequently, VISUAL has been largely unused in genetic studies, as the estimation-based method is assumed to be unable to accurately capture the full spectrum of the FDK trait, in addition to being vulnerable to mistakes due to the innate qualities of true estimation by human observers. This trend proves true in GWAS as the low degrees of freedom results in lower power to reject the null hypothesis (Figure 6), resulting in no potential associations detected by VISUAL GWAS (Figure 6). However, VISUAL outperformed expectations in the remainder of the evaluations, demonstrating unrealized potential. Foremost, VISUAL provides the highest throughput at forty-five seconds per sample (Table 3). Additionally, VISUAL raw phenotypic data demonstrated stronger coefficients of correlation and determination with DON content (r = 0.75, R2 = 0.31) than did MANUAL raw phenotypic data (r = 0.65, R2 = 0.27) (Figure 4 and Figure 5). Most impressively, VISUAL obtained a higher broad-sense heritability (0.64) than did MANUAL (0.59), and the highest accuracy in genomic prediction (r = 0.594) (Figure 5).
This trend was not as highly reflected when incorporating genetic data, as VISUAL demonstrated lower genetic correlation with DON resistance (r = 0.69) than did MANUAL (r = 0.82) and VIBE (r = 0.87) (Figure 5a). However, VISUAL obtained only slightly less prediction accuracy of DON content as a GEBV (R2 = 0.71) than MANUAL (R2 = 0.75) and VIBE (R2 = 0.76) (Figure 5b). Overall, VISUAL provides the highest throughput with only predetermined standards as equipment, and ultimately maintaining considerable efficacy. VISUAL was largely competitive with most other platforms throughout evaluation (Table 3), ultimately demonstrating a previously underestimated potential to act as a proxy phenotype for DON in genomic selection with an R2 = 0.71 with DON GEBVs and a prediction accuracy of r = 0.594.
NIR has been shown across multiple studies to show moderate to high relationships with mycotoxin content [50,51]. NIR demonstrated the weakest relationship with DON content when compared to other FDK platforms used throughout this study (r = 0.61), and this trend continued into NIR’s ability to predict DON resistance as a GEBV (R2 = 0.48) (Figure 5b). This could largely be due to NIR’s higher threshold overall resulting in high average for FDK estimations (Figure 3). While this study aimed to apply platforms such as NIR in their most feasible form, other studies have applied different NIR-based strategies to better predict DON content. Beyer et al. (2010) found a higher coefficient of determination in predicting DON content of samples (R2 = 0.84 compared to R2 = 0.31 in this study), stating that NIR better predicts DON content of damaged grain, rather than traditional methods such as MANUAL and VISUAL, which assume each Fusarium-damaged kernel equally contributes to overall DON content of samples [52]. Beyer et al. (2010) calibrated the NIR platform based on DON content, while in this study, NIR was calibrated based on predetermined FDK standards. This was done in an effort to target the FDK phenotype, similar to MANUAL, VISUAL, and VIBE. However, correlations with other FDK platforms and NIR only ranged from r = 0.39 to r = 0.45, and the highest correlation was still maintained between NIR and DON (r = 0.61) regardless of curve calibration based on FDK rather than DON content. Calibration of NIR based on actual DON content would likely increase accuracy of NIR for predicting DON content across experimental subsamples. Other studies such as Femenias et al. (2020) classified samples above and below the EU maximum levels of DON content with 62.7% accuracy, stating NIR has yet to develop before universal application at points of grain intake can begin. Similar results were found in this study, and the same conclusions can be drawn for NIR’s application to breeding programs, at least applied as it was in the ways described in this text.
Digital imaging has been deployed in previous studies to minimize error between human observers when analyzing grain samples. Tanabata et al. (2012) developed and described a software program called SmartGrain, which analyzed high-resolution digital images of grain by measuring all major seed size parameters of seed including length, width, length–width ratio, center of gravity, perimeter, and circularity. Ultimately, SmartGrain was able to detect differences in seed shape that are not visible to the unaided human eye, with seeds imaged at 600 dots per inch (dpi) and 0.024 mm/pixel [53]. This study aims to build upon these concepts when deploying Vibe QM3 by ground truthing results against observed DON content of grain and evaluating digital imaging against other FDK platforms. Ultimately, VIBE proved effective throughout evaluation criteria (Table 3). Previously, Maloney et al. (2014) deployed ImageJ to evaluate biparental RIL and double-haploid populations sharing a common parent (half-sib) and observed an entry-means H2 of 0.80 and 0.76, respectively [21]. Most impressively, VIBE showed a similar entry-means H2 across the genetically diverse entries used in this study, with an H2 of 0.74, the highest among platforms by a considerable margin (next closest = VISUAL, 0.64, Figure 3a). Additionally, VIBE showed the strongest genetic correlations with DON resistance, as demonstrated by a genetic correlation (r = 0.87) (Figure 5a). Further, VIBE showed the highest prediction capabilities of DON content as a potential proxy phenotype when using raw phenotypic data (R2 = 0.63, next closest R2 = 0.31) as well as DON resistance of lines when applied as GEBVs (R2 = 0.76) (Figure 5c,b).
VIBE was the only platform to effectively detect a significant SNP association within the Fhb1 region [−log10(p) of 5.53, S3B_9439629 locus] (Figure 6). While significant SNP associations of other major FHB QTL (F1BJ, F1AN) shown to be present in this population were not detected by VIBE or other platforms, both F1BJ and F1AN were previously detected using DON as a phenotype, rather than FDK as was used to detect Fhb1 [4,16,23]. VIBE proved to be the most effective proxy phenotype to DON among platforms (Figure 4), but still failed to associate with QTL previously detected in GWAS using DON, such as F1BJ and F1AN (Figure 5). Finally, VIBE maintained a prediction accuracy competitive to VISUAL (r = 0.588 and 0.594, respectively, Figure 7), averaging within the higher threshold of prediction accuracy ranges found with traditional FDK sorting reported by Verges et al. (2020) (r = 0.46–0.60).

5. Conclusions

Traditional FDK phenotyping methods such as MANUAL and VISUAL show desirable qualities such as an ease of deployment that remains capable of obtaining high correlations with DON content (Figure 4). While MANUAL demonstrates efficacy throughout evaluations, throughput of 14 min and 45 s limits application in large sample sizes. VISUAL exceeded expectations throughout evaluations, providing accurate prediction of DON resistance of lines as a GEBV (R2 = 0.71) and the highest prediction accuracy in genomic prediction (r = 0.594) (Figure 5b and Figure 7), demonstrating a potential for minor application in breeding programs. However, employing an increasing number of observers is common to breeding programs working with larger populations than what was shown in this study (1266), and would likely negatively affect the quality of traditional FDK platforms such as MANUAL and VISUAL. Automated phenotyping such as NIR and digital imaging such as the Vibe QM3 platform deployed in this study not only provides improved consistency between users, but between years and locations as well. This consistency prevents visual biases from changing between evaluation periods, providing increased accuracy when used to evaluate multi-environment, multi-year studies such as the data presented in this study. NIR performed poorly relative to other platforms throughout evaluations, especially in strength of relationship to DON content (Figure 4 and Figure 5), but could be improved by calibrating NIR curves based on DON rather than FDK. VIBE provided a throughput averaging under two minutes per sample (Table 3), highest prediction accuracy of DON resistance of lines (Figure 5), and detected a SNP association in major FHB resistance QTL Fhb1. In addition to these qualities, VIBE showed the highest broad-sense heritability among platforms (H2 = 0.74) and high prediction accuracy (r = 0.588), supporting the potential of increased use of digital imaging to improve the consistency, accuracy, and effectiveness of FDK phenotyping in wheat breeding programs.

Supplementary Materials

The following supporting information can be downloaded at: https://www.mdpi.com/article/10.3390/agronomy12020532/s1.

Author Contributions

Conceptualization, A.J.A., R.H. and R.E.B.; methodology, A.J.A., R.H., K.E.J., C.C. and R.E.B.; software, A.J.A.; validation, A.J.A. and R.E.B.; formal analysis, A.J.A., R.H., E.G., D.S.H., K.E.J. and R.E.B.; investigation, A.J.A., R.H. and R.E.B.; resources, C.A.G., R.E.M., S.A.H., C.C., J.F., J.P.M. and R.E.B.; data curation, A.J.A. and R.E.B.; writing—original draft preparation, A.J.A. and R.H.; writing—review and editing, A.J.A., R.E.M., C.C., J.P.M. and R.E.B.; visualization, R.E.B.; supervision, R.E.B.; project administration, R.E.B.; funding acquisition, R.E.B. All authors have read and agreed to the published version of the manuscript.

Funding

This work was supported by the USDA-ARS U.S. Wheat and Barley Scab Initiative as part of project FY20-SW-003 (ARS Agreement 59-0206-0-150). Support to E.G. was provided by the SC Governor’s School of Science and Mathematics through the Summer Program for Research Interns.

Acknowledgments

We thank Sirjan Sapkota, Lucas Boatwright, and Carolina Ballen-Taborda for support during this project throughout creation of the analyses of phenotypic data; Nicholas Santanonio for procuring information on MtVA trials; Jeanette Lyerly for supplying information on FHB QTL in SRWW populations; Gina Brown-Guidera and Jared Smith for supplying marker data on Fhb1, F1BJ, and F1AN.

Conflicts of Interest

The authors declare no conflict of interest.

References

  1. Balut, A.L.; Clark, A.J.; Brown-Guedira, G.; Souza, E.; Sanford, D.A.V. Validation of Fhb1 and QFhs.Nau-2DL in Several Soft Red Winter Wheat Populations. Crop Sci. 2013, 53, 934–945. [Google Scholar] [CrossRef] [Green Version]
  2. Cowger, C.; Weisz, R.; Arellano, C.; Murphy, P. Profitability of Integrated Management of Fusarium Head Blight in North Carolina Winter Wheat. Phytopathology 2016, 106, 814–823. [Google Scholar] [CrossRef] [Green Version]
  3. Carter, J.P.; Rezanoor, H.N.; Holden, D.; Desjardins, A.E.; Plattner, R.D.; Nicholson, P. Variation in Pathogenicity Associated with the Genetic Diversity of Fusarium Graminearum. Eur. J. Plant Pathol. 2002, 108, 573–583. [Google Scholar] [CrossRef]
  4. Aviles, A.C.; Harrison, S.A.; Arceneaux, K.J.; Brown-Guidera, G.; Mason, R.E.; Baisakh, N. Identification of QTLs for Resistance to Fusarium Head Blight Using a Doubled Haploid Population Derived from Southeastern United States Soft Red Winter Wheat Varieties AGS 2060 and AGS 2035. Genes 2020, 11, 699. [Google Scholar] [CrossRef] [PubMed]
  5. Buerstmayr, M.; Steiner, B.; Buerstmayr, H. Breeding for Fusarium Head Blight Resistance in Wheat—Progress and Challenges. Plant Breed. 2020, 139, 429–454. [Google Scholar] [CrossRef]
  6. Buerstmayr, H.; Ban, T.; Anderson, J.A. QTL Mapping and Marker-Assisted Selection for Fusarium Head Blight Resistance in Wheat: A Review. Plant Breed. 2009, 128, 1–26. [Google Scholar] [CrossRef]
  7. Mesterhazy, A. Updating the Breeding Philosophy of Wheat to Fusarium Head Blight (FHB): Resistance Components, QTL Identification, and Phenotyping—A Review. Plants 2020, 9, 1702. [Google Scholar] [CrossRef] [PubMed]
  8. Mesterhazy, A. Types and Components of Resistance to Fusarium Head Blight of Wheat. Plant Breed. 1995, 114, 377–386. [Google Scholar] [CrossRef]
  9. Hales, B.; Steed, A.; Giovannelli, V.; Burt, C.; Lemmens, M.; Molnár-Láng, M.; Nicholson, P. Type II Fusarium Head Blight Susceptibility Conferred by Region on Wheat Chromosome 4D. J. Exp. Bot. 2020, 71, 4703–4714. [Google Scholar] [CrossRef]
  10. Schroeder, H.W.; Christensen, J.J. Factors Affecting Resistance of Wheat to Scab Caused by Gibberella Zeae. Phytopathology 1963, 53, 831–838. [Google Scholar]
  11. Khaeim, H.M.; Clark, A.; Pearson, T.; Sanford, D.D.V. Methods of Assessing Fusarium Damage to Wheat Kernels. Al-Qadisiyah J. Agric. Sci. QJAS 2019, 9, 297–308. [Google Scholar] [CrossRef]
  12. Góral, T.; Wiśniewska, H.; Ochodzki, P.; Nielsen, L.; Walentyn-Góral, D.; Stępień, Ł. Relationship between Fusarium Head Blight, Kernel Damage, Concentration of Fusarium Biomass, and Fusarium Toxins in Grain of Winter Wheat Inoculated with Fusarium Culmorum. Toxins 2018, 11, 2. [Google Scholar] [CrossRef] [Green Version]
  13. Yi, X.; Cheng, J.; Jiang, Z.; Hu, W.; Bie, T.; Gao, D.; Li, D.; Wu, R.; Li, Y.; Chen, S.; et al. Genetic Analysis of Fusarium Head Blight Resistance in CIMMYT Bread Wheat Line C615 Using Traditional and Conditional QTL Mapping. Front. Plant Sci. 2018, 9, 573. [Google Scholar] [CrossRef]
  14. Gunupuru, L.R.; Perochon, A.; Doohan, F.M. Deoxynivalenol Resistance as a Component of FHB Resistance. Trop. Plant Pathol. 2017, 42, 175–183. [Google Scholar] [CrossRef] [Green Version]
  15. Paul, P.A.; Lipps, P.E.; Madden, L.V. Relationship between Visual Estimates of Fusarium Head Blight Intensity and Deoxynivalenol Accumulation in Harvested Wheat Grain: A Meta-Analysis. Phytopathology 2005, 95, 1225–1236. [Google Scholar] [CrossRef] [PubMed] [Green Version]
  16. Gaire, R.; Brown-Guedira, G.; Dong, Y.; Ohm, H.; Mohammadi, M. Genome-Wide Association Studies for Fusarium Head Blight Resistance and Its Trade-Off with Grain Yield in Soft Red Winter Wheat. Plant Dis. 2021, 105, 2435–2444. [Google Scholar] [CrossRef]
  17. Cowger, C.; Arellano, C. Fusarium Graminearum Infection and Deoxynivalenol Concentrations During Development of Wheat Spikes. Phytopathology 2013, 103, 460–471. [Google Scholar] [CrossRef] [PubMed] [Green Version]
  18. Petersen, S.; Lyerly, J.H.; Maloney, P.V.; Brown-Guedira, G.; Cowger, C.; Costa, J.M.; Dong, Y.; Murphy, J.P. Mapping of Fusarium Head Blight Resistance Quantitative Trait Loci in Winter Wheat Cultivar NC-Neuse. Crop Sci. 2016, 56, 1473–1483. [Google Scholar] [CrossRef]
  19. Uffelmann, E.; Huang, Q.Q.; Munung, N.S.; de Vries, J.; Okada, Y.; Martin, A.R.; Martin, H.C.; Lappalainen, T.; Posthuma, D. Genome-Wide Association Studies. Nat. Rev. Methods Primers 2021, 1, 59. [Google Scholar] [CrossRef]
  20. Li, Y. Development of New Tools and Germplasms for Improvement of Wheat Resistance to Fusarium Head Blight. Ph.D. Thesis, Kansas State University, Manhattan, KS, USA, 2019. [Google Scholar]
  21. Maloney, P.V.; Petersen, S.; Navarro, R.A.; Marshall, D.; McKendry, A.L.; Costa, J.M.; Murphy, J.P. Digital Image Analysis Method for Estimation of Fusarium-Damaged Kernels in Wheat. Crop Sci. 2014, 54, 2077–2083. [Google Scholar] [CrossRef]
  22. MacRae, C.A.; Vasan, R.S. Next-Generation Genome-Wide Association Studies. Circ. Cardiovasc. Genet. 2011, 4, 334–336. [Google Scholar] [CrossRef] [PubMed]
  23. Arruda, M.P.; Brown, P.; Brown-Guedira, G.; Krill, A.M.; Thurber, C.; Merrill, K.R.; Foresman, B.J.; Kolb, F.L. Genome-Wide Association Mapping of Fusarium Head Blight Resistance in Wheat Using Genotyping-by-Sequencing. Plant Genome 2016, 9. [Google Scholar] [CrossRef] [PubMed]
  24. Carpenter, N.R.; Wright, E.; Malla, S.; Singh, L.; Sanford, D.V.; Clark, A.; Harrison, S.; Murphy, J.P.; Costa, J.; Chao, S.; et al. Identification and Validation of Fusarium Head Blight Resistance QTL in the U.S. Soft Red Winter Wheat Cultivar ‘Jamestown’. Crop Sci. 2020, 60, 2919–2930. [Google Scholar] [CrossRef]
  25. Agostinelli, A.M.; Clark, A.J.; Brown-Guedira, G.; Sanford, D.A.V. Optimizing Phenotypic and Genotypic Selection for Fusarium Head Blight Resistance in Wheat. Euphytica 2012, 186, 115–126. [Google Scholar] [CrossRef]
  26. Rutkoski, J.; Benson, J.; Jia, Y.; Brown-Guedira, G.; Jannink, J.; Sorrells, M. Evaluation of Genomic Prediction Methods for Fusarium Head Blight Resistance in Wheat. Plant Genome 2012, 5, 51. [Google Scholar] [CrossRef] [Green Version]
  27. Larkin, D.L.; Mason, R.E.; Moon, D.E.; Holder, A.L.; Ward, B.P.; Brown-Guedira, G. Predicting Fusarium Head Blight Resistance for Advanced Trials in a Soft Red Winter Wheat Breeding Program with Genomic Selection. Front. Plant Sci. 2021, 12, 715314. [Google Scholar] [CrossRef] [PubMed]
  28. Zhang, W.; Boyle, K.; Brûlé-Babel, A.L.; Fedak, G.; Gao, P.; Djama, Z.R.; Polley, B.; Cuthbert, R.D.; Randhawa, H.S.; Jiang, F.; et al. Genetic Characterization of Multiple Components Contributing to Fusarium Head Blight Resistance of FL62R1, a Canadian Bread Wheat Developed Using Systemic Breeding. Front. Plant Sci. 2020, 11, 580833. [Google Scholar] [CrossRef] [PubMed]
  29. Saha, I. Are Rice Markets in Bangladesh Efficiently Pricing Rice Based on Quality? An Empirical Assessment. Master’s Thesis, University of Arkansas, Fayetteville, AR, USA, 2021. [Google Scholar]
  30. Tacke, B.K.; Casper, H.H. Determination of Deoxynivalenol in Wheat, Barley, and Malt by Column Cleanup and Gas Chromatography with Electron Capture Detection. J. AOAC Int. 1996, 79, 472–475. [Google Scholar] [CrossRef] [PubMed] [Green Version]
  31. Bradbury, P.J.; Zhang, Z.; Kroon, D.E.; Casstevens, T.M.; Ramdoss, Y.; Buckler, E.S. TASSEL: Software for Association Mapping of Complex Traits in Diverse Samples. Bioinformatics 2007, 23, 2633–2635. [Google Scholar] [CrossRef] [PubMed]
  32. Covarrubias-Pazaran, G. Genome-Assisted Prediction of Quantitative Traits Using the R Package Sommer. PLoS ONE 2016, 11, e0156744. [Google Scholar] [CrossRef] [Green Version]
  33. VanRaden, P.M. Efficient Methods to Compute Genomic Predictions. J. Dairy Sci. 2008, 91, 4414–4423. [Google Scholar] [CrossRef] [Green Version]
  34. Waldron, B.L.; Moreno-Sevilla, B.; Anderson, J.A.; Stack, R.W.; Frohberg, R.C. RFLP Mapping of QTL for Fusarium Head Blight Resistance in Wheat. Crop Sci. 1999, 39, 805–811. [Google Scholar] [CrossRef]
  35. Su, Z.; Bernardo, A.; Tian, B.; Chen, H.; Wang, S.; Ma, H.; Cai, S.; Liu, D.; Zhang, D.; Li, T.; et al. A Deletion Mutation in TaHRC Confers Fhb1 Resistance to Fusarium Head Blight in Wheat. Nat. Genet. 2019, 51, 1099–1105. [Google Scholar] [CrossRef] [PubMed]
  36. R Core Team. R: A Language and Environment for Statistical Computing; R Foundation for Statistical Computing: Vienna, Austria, 2021. [Google Scholar]
  37. Bates, D.; Maechler, M.; Walker, S.; Bolker, B.; Christensen, R.H.B. Lme4. 2021. Available online: https://www.jstatsoft.org/article/view/v082i13 (accessed on 10 December 2021).
  38. Bates, D.; Mächler, M.; Bolker, B.; Walker, S. Fitting Linear Mixed-Effects Models Using Lme4. J. Stat. Softw. 2014, 67, 1–48. [Google Scholar]
  39. Lenth, R.V. Emmeans: Estimated Marginal Means, Aka Least-Squares Means. 2021. Available online: https://rdrr.io/cran/emmeans/ (accessed on 10 December 2021).
  40. Kruijer, W. Heritability: Marker-Based Estimation of Heritability Using Individual Plant or Plot Data. Genetics 2019, 199, 1–20. [Google Scholar]
  41. Montesinos-López, O.A.; Montesinos-López, A.; Luna-Vázquez, F.J.; Toledo, F.H.; Pérez-Rodríguez, P.; Lillemo, M.; Crossa, J. An R Package for Bayesian Analysis of Multi-Environment and Multi-Trait Multi-Environment Data for Genome-Gased Prediction. G3 Genes Genomes Genet. 2019, 9, 1355–1369. [Google Scholar] [CrossRef] [Green Version]
  42. Huang, M.; Liu, X.; Zhou, Y.; Summers, R.M.; Zhang, Z. BLINK: A Package for the next Level of Genome-Wide Association Studies with Both Individuals and Markers in the Millions. Gigascience 2018, 8, 154. [Google Scholar] [CrossRef] [PubMed]
  43. Wang, J.; Zhang, Z. GAPIT Version 3: Boosting Power and Accuracy for Genomic Association and Prediction. Genom. Proteom. Bioinform. 2021, in press. [Google Scholar] [CrossRef] [PubMed]
  44. Wang, J.; Zhou, Z.; Zhang, Z.; Li, H.; Liu, D.; Zhang, Q.; Bradbury, P.J.; Buckler, E.S.; Zhang, Z. Expanding the BLUP Alphabet for Genomic Prediction Adaptable to the Genetic Architectures of Complex Traits. Heredity 2018, 121, 648–662. [Google Scholar] [CrossRef] [PubMed]
  45. Endelman, J.B. Ridge Regression and Other Kernels for Genomic Selection with R Package RrBLUP. Plant Genome 2011, 4, 250. [Google Scholar] [CrossRef] [Green Version]
  46. Peterson, B.G.; Carl, P. PerformanceAnalytics. 2020. Available online: https://cran.r-project.org/web/packages/PerformanceAnalytics/index.html (accessed on 10 December 2021).
  47. Rheenen, W.; van Peyrot, W.J.; Schork, A.J.; Lee, S.H.; Wray, N.R. Genetic Correlations of Polygenic Disease Traits: From Theory to Practice. Nat. Rev. Genet. 2019, 20, 567–581. [Google Scholar] [CrossRef] [PubMed]
  48. Gaire, R.; Ohm, H.; Brown-Guedira, G.; Mohammadi, M. Identification of Regions under Selection and Loci Controlling Agronomic Traits in a Soft Red Winter Wheat Population. Plant Genome 2020, 13, e20031. [Google Scholar] [CrossRef] [PubMed]
  49. Petersen, S.; Lyerly, J.H.; McKendry, A.L.; Islam, M.S.; Brown-Guedira, G.; Cowger, C.; Dong, Y.; Murphy, J.P. Validation of Fusarium Head Blight Resistance QTL in US Winter Wheat. Crop Sci. 2017, 57, 1–12. [Google Scholar] [CrossRef]
  50. Alisaac, E.; Behmann, J.; Rathgeb, A.; Karlovsky, P.; Dehne, H.-W.; Mahlein, A.-K. Assessment of Fusarium Infection and Mycotoxin Contamination of Wheat Kernels and Flour Using Hyperspectral Imaging. Toxins 2019, 11, 556. [Google Scholar] [CrossRef] [PubMed] [Green Version]
  51. Femenias, A.; Gatius, F.; Ramos, A.J.; Sanchis, V.; Marín, S. Standardisation of near Infrared Hyperspectral Imaging for Quantification and Classification of DON Contaminated Wheat Samples. Food Control 2020, 111, 107074. [Google Scholar] [CrossRef]
  52. Beyer, M.; Pogoda, F.; Ronellenfitsch, F.K.; Hoffmann, L.; Udelhoven, T. Estimating Deoxynivalenol Contents of Wheat Samples Containing Different Levels of Fusarium-Damaged Kernels by Diffuse Reflectance Spectrometry and Partial Least Square Regression. Int. J. Food Microbiol. 2010, 142, 370–374. [Google Scholar] [CrossRef] [PubMed]
  53. Tanabata, T.; Shibaya, T.; Hori, K.; Ebana, K.; Yano, M. SmartGrain: High-Throughput Phenotyping Software for Measuring Seed Shape through Image Analysis. Plant Physiol. 2012, 160, 1871–1880. [Google Scholar] [CrossRef] [Green Version]
Figure 1. Fusarium-damaged kernel standards, where each Petri dish contained 1000 randomly subsampled kernels from the Hilliard check entry, represented in 5% FDK increments such that the dish labeled “0” represents 0% FDK and 100% healthy kernels. All predetermined standards were used to train inspectors to best estimate FDK percentiles of experimental subsamples.
Agronomy 12 00532 g001
Figure 2. Vibe QM3 image output of the 50% standard used for quality control testing. FDK are signified by the red box, labeled “FDK_3” in color key, corresponding to the title of the FDK calibration file used, while healthy kernels are signified by white box, labeled “nonFDK” in color key.
Agronomy 12 00532 g002
Figure 3. (a) Violin plots of all platforms represented by individual environment. All platforms represented in percentage FDK except DON, which is shown in ppm. Samples examined in VISUAL in FSC2020 were not also examined by other platforms in FSC2020, resulting in additional FDK values for VISUAL over other platforms, creating visual differences between maximum values of violin plots. (b) Broad-sense heritability on an entry means basis was calculated for each trait as denoted by “H2”. Corresponding averages and standard deviations for FSC19 (Florence, SC 2019), FSC20 (Florence, SC 2020), WLA20 (Winnsboro, LA 2020), and MtVA19 (Mt. Holly, VA 2019).
Agronomy 12 00532 g003
Figure 4. Correlation matrix of raw phenotypic data: on the diagonal, distribution of each platform; lower left corner, bivariate scatter plots between platforms; upper right corner, correlation coefficients between platforms. All correlations were significant at the p < 0.001 level.
Agronomy 12 00532 g004
Figure 5. The potential of FDK platforms to predict DON resistance and perform as a proxy phenotype. (a) Genetic correlation between DON resistance and platform-derived FDK. (b) Linear regression between platform-derived FDK GEBVs and DON resistance GEBVs. (c) Linear regression between platform-derived FDK and DON content per sample as raw phenotypic data.
Agronomy 12 00532 g005
Figure 6. Manhattan plots for GWAS results of VIBE, MANUAL, and VISUAL using BLUE values. VIBE detects significant SNP association at locus S3B_9439629, known to be within Fhb1 QTL on chromosome 3B (−log10(p) of 5.53).
Agronomy 12 00532 g006
Figure 7. Genomic prediction accuracies for each FDK platform as developed from rrBLUP model. Each box-and-whiskers plot represents 1000 Pearson’s correlations, each correlation representing a coefficient of correlation from a stratified five-fold cross-validation scheme.
Agronomy 12 00532 g007
Table 1. Summary of SunGrains trials used in the present study, including location, year, field replicates, and number of entries.
TrialYearLocationField
Replicates
Entries
USSN2019Florence, SC247
USSN2019Mt. Holly, VA250
USSN2020Florence, SC248
USSRWWN2019Florence, SC240
USSRWWN2020Florence, SC238
USSRWWN2020Winnsboro, LA238
GAWN2019Florence, SC254
GAWN2020Florence, SC150
GAWN2020Winnsboro, LA250
SunWheat2019Florence, SC291
SunWheat2020Florence, SC194
SunWheat2020Winnsboro, LA194
UBWT2020Florence, SC145
OVT2020Florence, SC171
Total samples: 1266
Table 2. Quality control was performed prior to experimental testing everyday for nine total days of testing. Predetermined standards of 0%, 35%, 50%, 85%, and 100% FDK were used for quality control tests.
Predetermined Standards:0%35%50%85%100%Pearson’s CorrelationStandard Error
QC Test 1—3 August 20215.6837.9551.4186.0796.50.99941.55
QC Test 2—4 August 20217.2338.685084.5896.590.99951.47
QC Test 3—5 August 20217.9240.1853.4586.3996.760.99951.46
QC Test 4—6 August 20216.4140.3852.7585.8897.090.99951.45
QC Test 5—7 August 20215.135.3950.6485.897.750.99941.63
QC Test 6—8 August 20215.0238.5251.2286.6297.940.99961.38
QC Test 7—9 August 20215.8937.8951.0585.15970.99980.99
QC Test 8—10 August 20215.8337.7150.4485.2597.070.99971.21
QC Test 9—11 August 20213.4739.2951.6284.8396.920.99941.64
Average5.8438.4451.4085.6297.070.99971.42
Average Error of Obs vs. Pred 5.843.441.400.62−2.93
Table 3. Summary of all evaluations for all platforms performed in this study.
PlatformEquipment (Ascending Order by Cost)TimeBroad-Sense Heritability (H2)Genetic Correlation with Don ResistanceAbility to Predict Don Content (Raw Phenotype)Ability to Predict Don Content (GEBV)GWASAverage Prediction Accuracy (R)
VISUALPredetermined Standards0:450.640.690.310.71N/A0.594
MANUALElectric Seed Counter14:450.590.820.270.75N/A0.552
VIBEVibe QM31:490.740.870.630.76Fhb10.588
NIRNear-Infrared Spectrometer1:450.520.570.310.48N/A0.404
Publisher’s Note: MDPI stays neutral with regard to jurisdictional claims in published maps and institutional affiliations.

