
Measuring Soil Quality Indicators under Different Climate-Smart Land Uses across East African Climate-Smart Villages

 , , , , and
Abstract
:1. Introduction
2. Materials and Methods
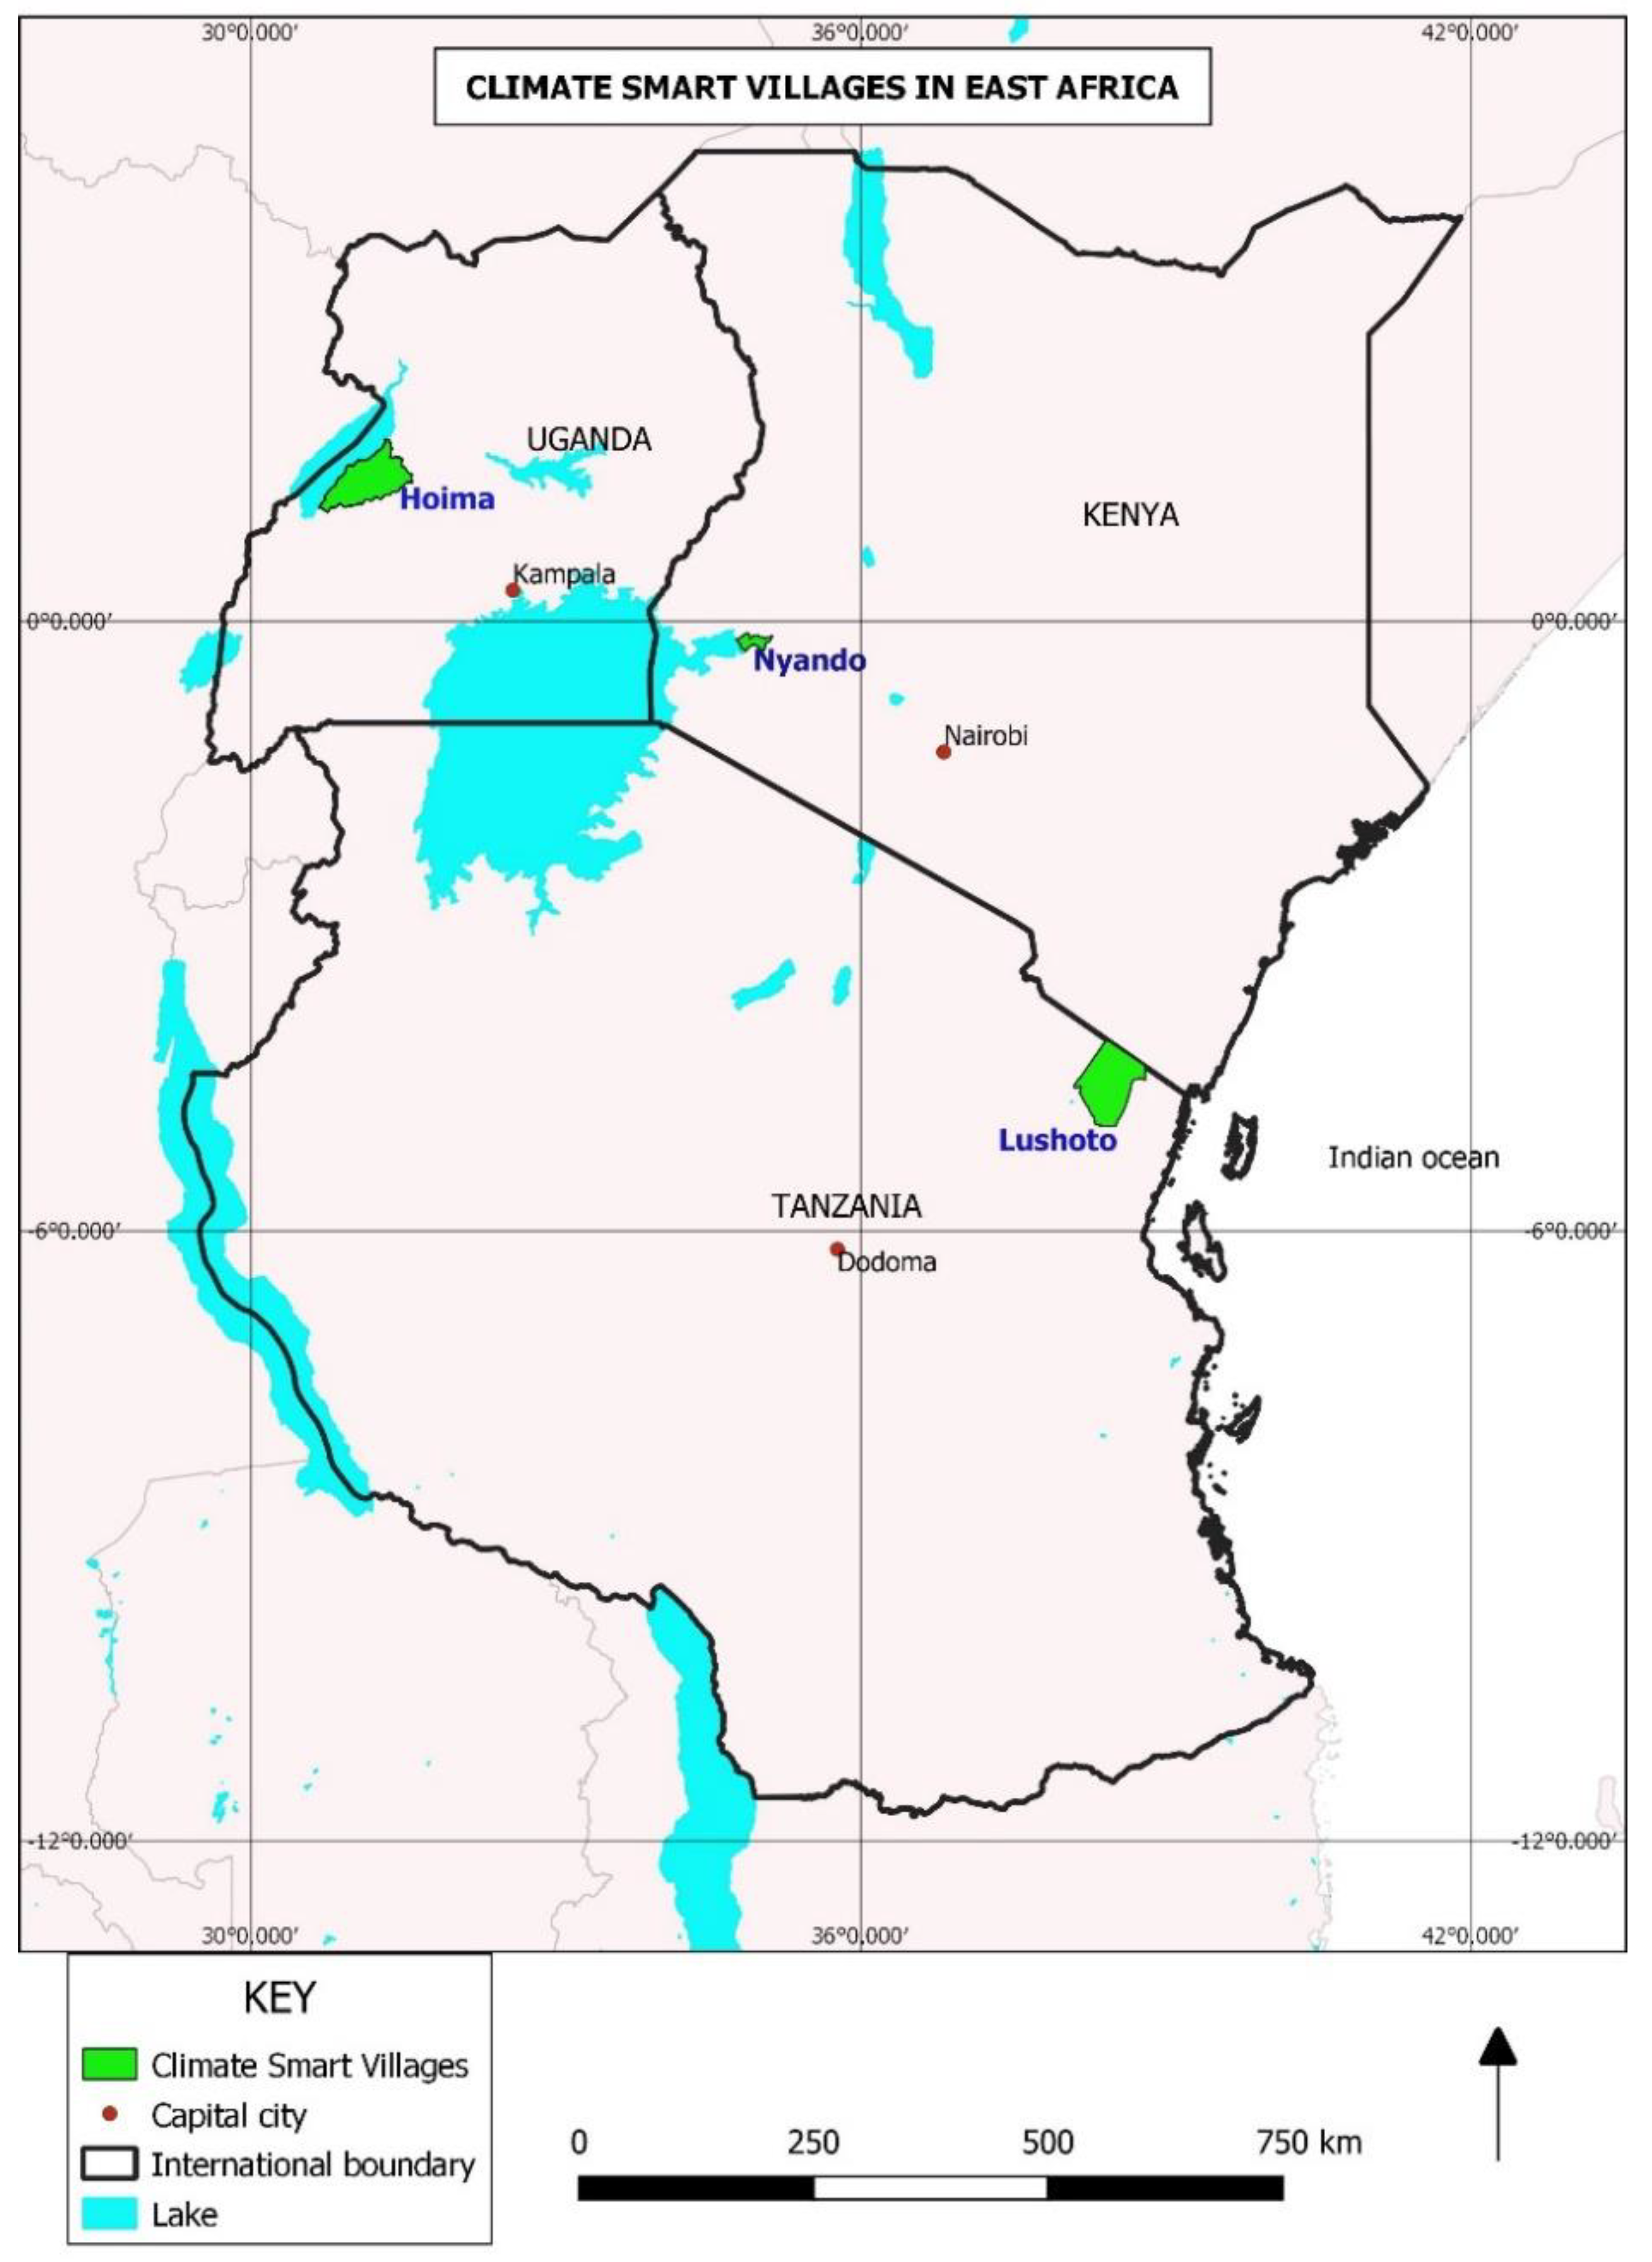
2.1. Study Site
2.2. Soil Sampling and Preparation
2.3. Statistical Analysis
3. Results and Discussions
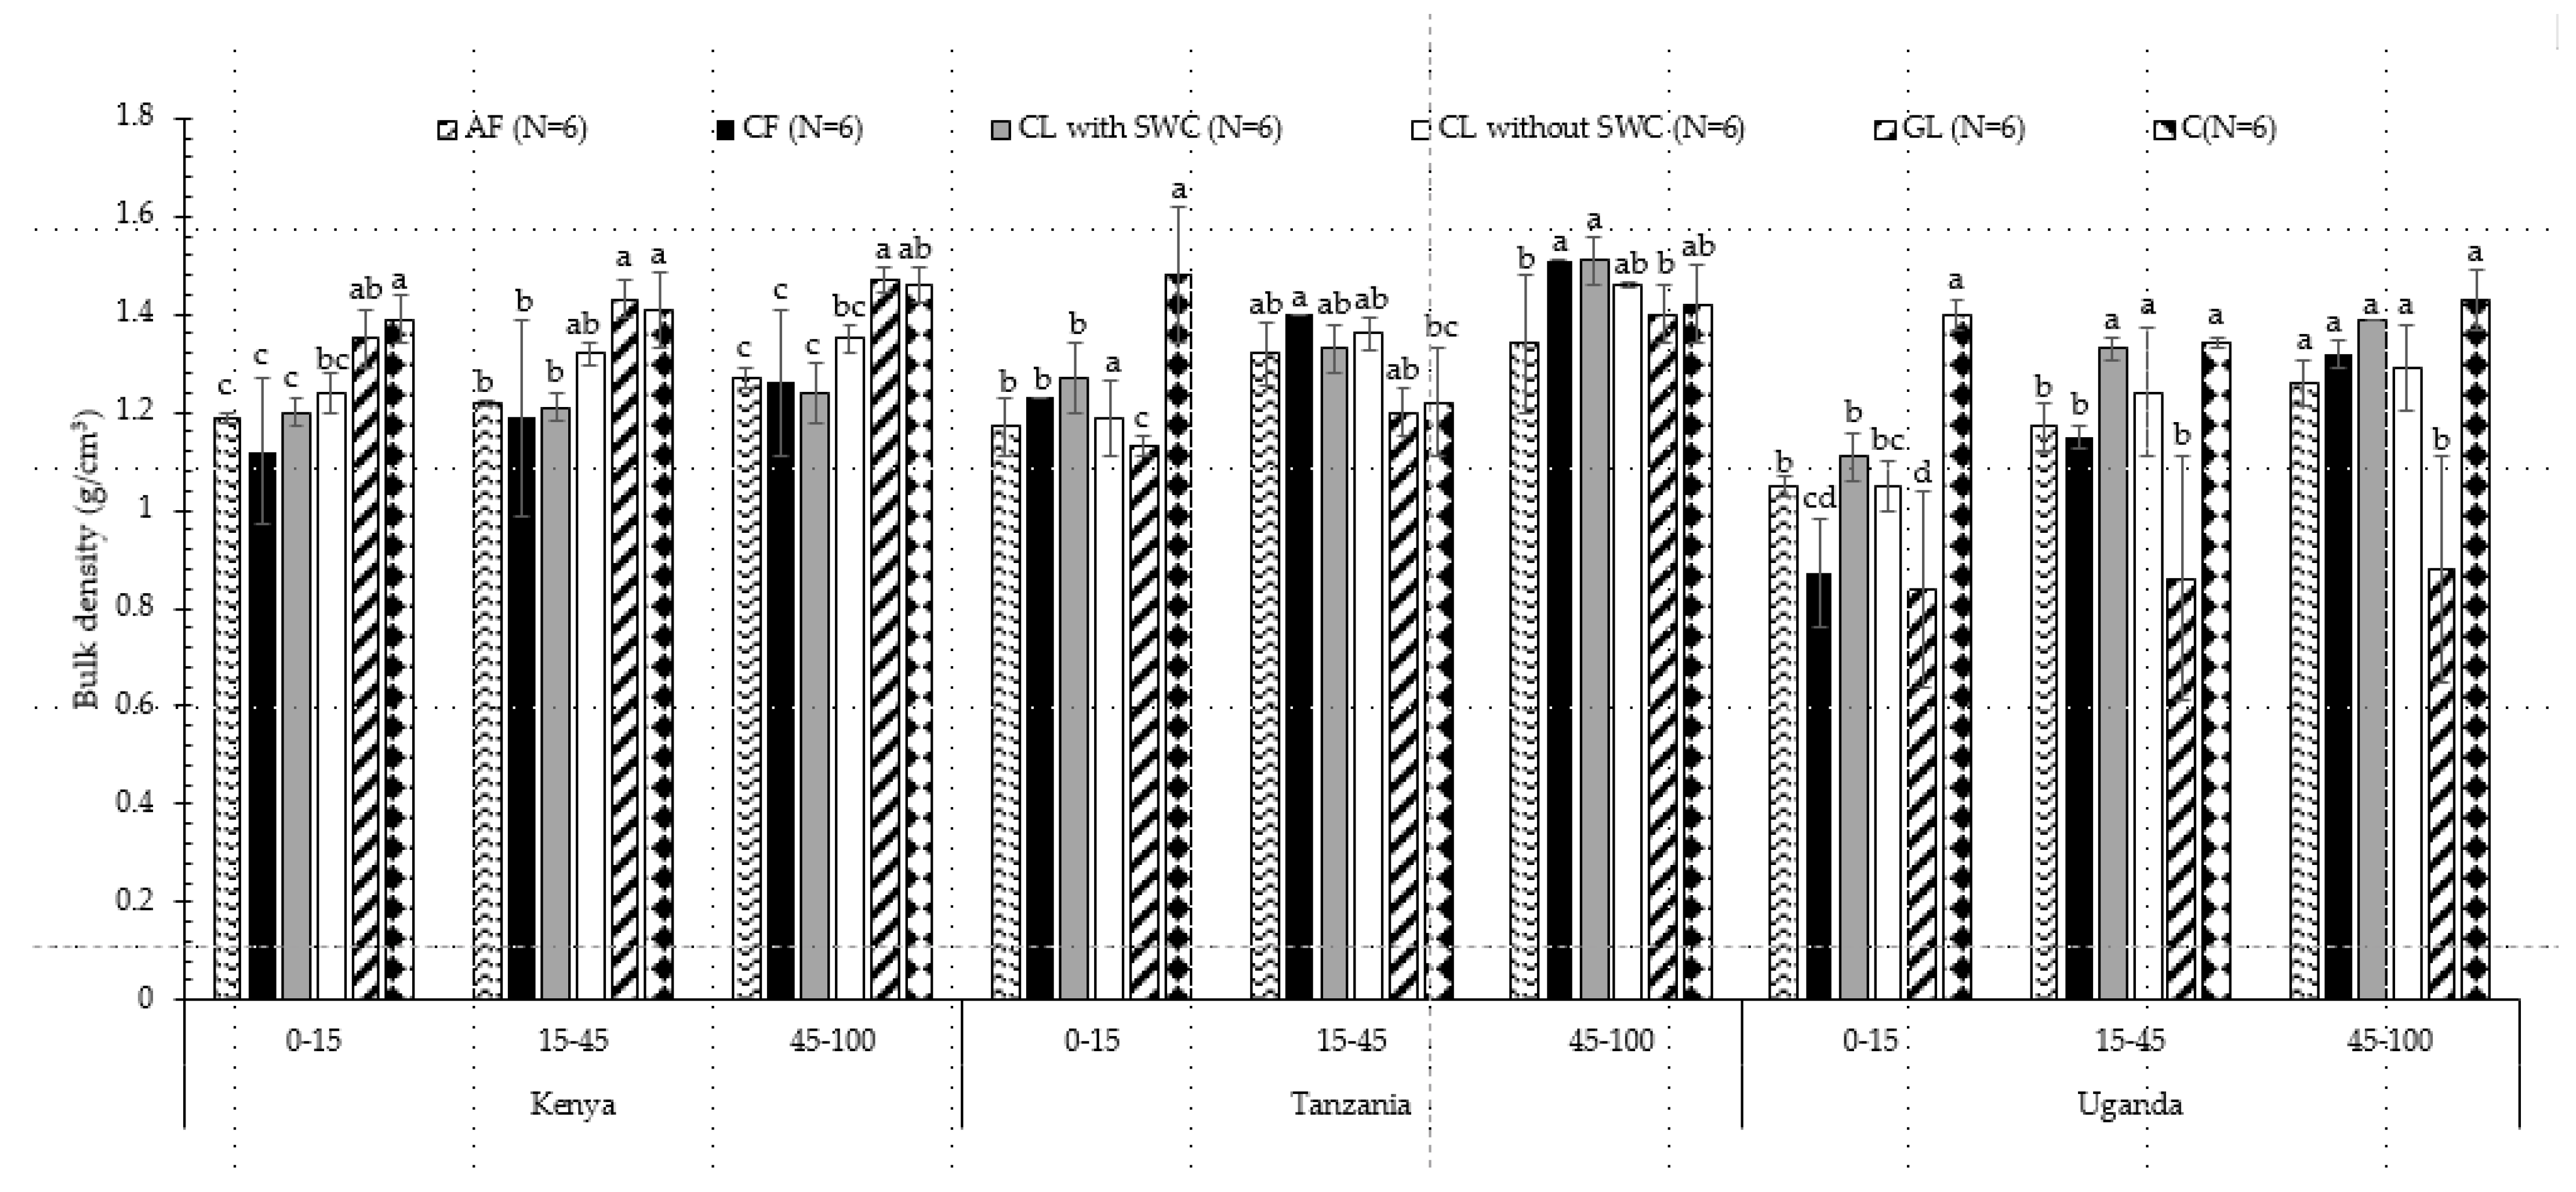
3.1. Bulk Density under Different Land Use Types
3.2. Soil pH, Electrical Conductivity (EC) and Cation Exchange Capacity (CEC) across Land Uses
3.3. Exchangeable Bases (Ca, Mg, K and Na), Extractable Fe, Mn, Zn, Total Carbon (TC), Total Nitrogen (TN) and C:N Ratio across Land Uses
3.4. Correlation between Soil Nutrients
4. Conclusions
Author Contributions
Funding
Institutional Review Board Statement
Informed Consent Statement
Data Availability Statement
Acknowledgments
Conflicts of Interest
References
- Tahat, M.M.; Alananbeh, K.M.; Othman, Y.A.; Leskovar, D.I. Soil health and sustainable agriculture. Sustainability 2020, 12, 4859. [Google Scholar] [CrossRef]
- Powlson, D.S.; Stirling, C.M.; Thierfelder, C.; White, R.P.; Jat, M.L. Does conservation agriculture deliver climate change mitigation through soil carbon sequestration in tropical agro-ecosystems? Agric. Ecosyst. Environ. 2016, 220, 164–174. [Google Scholar] [CrossRef]
- Takoutsing, B.; Weber, J.; Aynekulu, E.; Rodríguez Martín, J.A.; Shepherd, K.; Sila, A.; Tchoundjeu, Z.; Diby, L. Assessment of soil health indicators for sustainable production of maize in smallholder farming systems in the highlands of Cameroon. Geoderma 2016, 276, 64–73. [Google Scholar] [CrossRef]
- Recha, J.; Radeny, M.; Kinyangi, J.; Kimeli, P.; Atakos, V.; Lyamchai, C.; Ngatoluwa, R.; Sayula, G. Climate-Smart Villages and Progress in Achieving Household Food security in Lushoto, Tanzania. CCAFS Info Note; CGIAR Research Program on Climate Change, Agriculture and Food Security (CCAFS): Copenhagen, Denmark, 2015. [Google Scholar]
- Mugagga, F.; Kakembo, V.; Buyinza, M. Land use changes on the slopes of Mount Elgon and the implications for the occurrence of landslides. Catena 2012, 90, 39–46. [Google Scholar] [CrossRef]
- Willy, D.K.; Muyanga, M.; Mbuvi, J.; Jayne, T. The effect of land use change on soil fertility parameters in densely populated areas of Kenya. Geoderma 2019, 343, 254–262. [Google Scholar] [CrossRef] [PubMed]
- Kinyangi, J.; Recha, J.; Kimeli, P.; Atakos, V. Climate—Smart Villages and the Hope of Food Security in Kenya; CCAFS Info Note; CGIAR Research Program on Climate Change, Agriculture and Food Security (CCAFS): Copenhagen, Denmark, 2015. [Google Scholar]
- Bouma, J. Land quality indicators of sustainable land management across scales. Agric. Ecosyst. Environ. 2002, 88, 129–136. [Google Scholar] [CrossRef]
- Doran, J.W.; Stamatiadis, S.I.; Haberern, J. Soil health as an indicator of sustainable management. Agric. Ecosyst. Environ. 2002, 88, 107–110. [Google Scholar] [CrossRef] [Green Version]
- Barrios, E.; Shepherd, K.; Sinclair, F. Soil health and agricultural sustainability: The role of soil biota. In Agroecology for Food Security and Nutrition, Proceedings of the FAO International Symposium, Rome, Italy, 18–19 September 2014; FAO: Rome, Italy, 2015; pp. 104–122. [Google Scholar]
- Bell, M.C.; Raczkowski, C.W. Soil property indices for assessing short-term changes in soil quality. Renew. Agric. Food Syst. 2008, 23, 70–79. [Google Scholar] [CrossRef]
- Nambiar, K.K.M.; Gupta, A.P.; Fu, Q.; Li, S. Biophysical, chemical and socio-economic indicators for assessing agricultural sustainability in the Chinese coastal zone. Agric. Ecosyst. Environ. 2001, 87, 209–214. [Google Scholar] [CrossRef]
- Bünemann, E.K.; Bongiorno, G.; Bai, Z.; Creamer, R.E.; De Deyn, G.; de Goede, R.; Fleskens, L.; Geissen, V.; Kuyper, T.W.; Mäder, P.; et al. Soil quality—A critical review. Soil Biol. Biochem. 2018, 120, 105–125. [Google Scholar] [CrossRef]
- Prudat, B.; Bloemertz, L.; Kuhn, N.J. Local soil quality assessment of north-central Namibia: Integrating farmers’ and technical knowledge. Soil 2018, 4, 47–62. [Google Scholar] [CrossRef] [Green Version]
- Pham, T.G.; Nguyen, H.T.; Kappas, M. Assessment of soil quality indicators under different agricultural land uses and topographic aspects in Central Vietnam. Int. Soil Water Conserv. Res. 2018, 6, 280–288. [Google Scholar] [CrossRef]
- Fernández-Romero, M.L.; Parras-Alcántara, L.; Lozano-García, B.; Clark, J.M.; Collins, C.D. Soil quality assessment based on carbon stratification index in different olive grove management practices in Mediterranean areas. Catena 2016, 137, 449–458. [Google Scholar] [CrossRef]
- Yang, X.; Ren, W.; Sun, B.; Zhang, S. Effects of contrasting soil management regimes on total and labile soil organic carbon fractions in a loess soil in China. Geoderma 2012, 177–178, 49–56. [Google Scholar] [CrossRef]
- Esilaba, A.O.; Kibunja, C.; Kamoni, P.T.; Kathuku, A.N.; Mugambi, C.N.; Gathaara, V.N.; Kimigo, J.; Adolwa, I.S.; Githunguri, C.; Radiro, M.P.O.; et al. The African Soil Information Service Project on integrated soil fertility management, Kenya. In Proceedings of the Joint proceedings of the 27th Soil Science Society of East Africa and the 6th African Soil Science Society, Nakuru, Kenya, 20–25 October 2013; pp. 1–14. [Google Scholar]
- Winowiecki, L.; Vågen, T.G.; Massawe, B.; Jelinski, N.A.; Lyamchai, C.; Sayula, G.; Msoka, E. Landscape-scale variability of soil health indicators: Effects of cultivation on soil organic carbon in the Usambara Mountains of Tanzania. Nutr. Cycl. Agroecosystems 2016, 105, 263–274. [Google Scholar] [CrossRef] [Green Version]
- Recha, J.; Radeny, M.; Kinyangi, J.; Kimeli, P.; Atakos, V.; Lyamchai, C.; Ngatoluwa, R.; Sayula, G. Climate-Smart Villages and Progress in Achieving Household Food Security in Lushoto, Tanzania. Preliminary Results from Climate Change Adaptation and Mitigation Initiatives in Lushoto Climate-Smart Villages; CCAFS Info Note; CGIAR Research Program on Climate Change, Agriculture and Food Security (CCAFS): Copenhagen, Denmark, 2015. [Google Scholar]
- Lyamchai, C.; Yanda, P.; Sayula, G.; Kristjanson, P. Summary of Baseline Household Survey Results: Lushoto, Tanzania; CGIAR Research Program on Climate Change, Agriculture and Food Security (CCAFS): Copenhagen, Denmark, 2011. [Google Scholar]
- Recha, J.; Radeny, M.; Kimeli, P.; Hafashimana, D.; Masanyu, J.; Odongo, W. Progress in Achieving Household Food Security in Climate-Smart Villages in the Albertine Rift, Western Uganda; CCAFS Info Note; CGIAR Research Program on Climate Change, Agriculture and Food Security (CCAFS): Copenhagen, Denmark, 2016; Available online: www.ccafs.cgiar.org (accessed on 17 January 2022).
- Mutua, S.; Ghysels, G.; Anibas, C.; Obando, J.; Verbeiren, B.; Van Griensven, A.; Vaessens, A.; Huysmans, M. Understanding and conceptualization of the hydrogeology and groundwater flow dynamics of the Nyando River Basin in Western Kenya. J. Hydrol. Reg. Stud. 2020, 32, 100766. [Google Scholar] [CrossRef]
- Recha, J.; Kimeli, P.; Atakos, V.; Radeny, M.; Mungai, C. Stories of Success: Climate-Smart Villages in East Africa; CGIAR Research Program on Climate Change, Agriculture and Food Security (CCAFS): Wageningen, The Netherlands, 2017. [Google Scholar]
- Ambaw, G.; Recha, J.W.; Nigussie, A.; Solomon, D.; Radeny, M. Soil carbon sequestration potential of climate-smart villages in East African countries. Climate 2020, 8, 124. [Google Scholar] [CrossRef]
- Mehlich, A. Mehlich 3 soil test extractant: A modification of Mehlich 2 extractant. Commun. Soil Sci. Plant Anal. 1984, 15, 1409–1416. [Google Scholar] [CrossRef]
- Reynolds, W.D.; Drury, C.F.; Tan, C.S.; Fox, C.A.; Yang, X.M. Use of indicators and pore volume-function characteristics to quantify soil physical quality. Geoderma 2009, 152, 252–263. [Google Scholar] [CrossRef]
- Dagnachew, M.; Moges, A.; Kassa, A.K. Effects of Land Uses on Soil Quality Indicators: The Case of Geshy Subcatchment, Gojeb River Catchment, Ethiopia. Appl. Environ. Soil Sci. 2019, 2019, 1–11. [Google Scholar] [CrossRef] [Green Version]
- Selassie, Y.G.; Anemut, F.; Addisu, S. The effects of land use types, management practices and slope classes on selected soil physico-chemical properties in Zikre watershed, North-Western Ethiopia. Environ. Syst. Res. 2015, 4, 3. [Google Scholar] [CrossRef] [Green Version]
- Lewis, D.T. Bulk Density. Encycl. SOIL Sci. 2008, 51, 74–76. [Google Scholar]
- Kakaire, J.; Makokha, G.L.; Mwanjalolo, M.; Mensah, A.K.; Emmanuel, M. Effects of Mulching on Soil Hydro-Physical Properties in. Appl. Ecol. Environ. Sci. 2015, 3, 127–135. [Google Scholar] [CrossRef]
- Takoutsing, B.; Weber, J.C.; Tchoundjeu, Z.; Shepherd, K. Soil chemical properties dynamics as affected by land use change in the humid forest zone of Cameroon. Agrofor. Syst. 2016, 90, 1089–1102. [Google Scholar] [CrossRef]
- Deumlich, D.; Thiere, J.; Altermann, M. Characterization of cation exchange capacity (CEC) for agricultural land-use areas. Arch. Agron. Soil Sci. 2015, 61, 767–784. [Google Scholar] [CrossRef]
- Tellen, V.A.; Yerima, B.P.K. Effects of land use change on soil physicochemical properties in selected areas in the North West region of Cameroon. Environ. Syst. Res. 2018, 7, 3. [Google Scholar] [CrossRef] [Green Version]
- Negasa, D.J. Effects of Land Use Types on Selected Soil Properties in Central Highlands of Ethiopia. Appl. Environ. Soil Sci. 2020, 2020, 1–9. [Google Scholar] [CrossRef]
- Mengiste, W.; Mohammed, M.; Yitebarek, T. Evaluation of the Effect of Land Use Types on Selected Soil Physico-Chemical Properties in Itang-Kir Area of Gambella Region, Ethiopia. J. Biol. Agric. Healthc. 2018, 5, 92–103. [Google Scholar]
- Bonilla-Findji, O.; Recha, J.; Radeny, M.; Kimeli, P. East Africa Climate-Smart Villages AR4D Sites: 2016 Inventory; CGIAR Research Program on Climate Change, Agriculture and Food Security (CCAFS): Wageningen, The Netherlands, 2017. [Google Scholar]
- Chemeda, M.; Kibret, K.; Fite, T. Influence of Different Land Use Types and Soil Depths on Selected Soil Properties Related to Soil Fertility in Warandhab Area, Horo Guduru Wallaga Zone, Oromiya, Ethiopia. Int. J. Environ. Sci. Nat. Resour. 2017, 4, 555634. [Google Scholar] [CrossRef]
- Mengie, B.; Teshome, Y.; Dereje, T. Effects of soil and water conservation practices on soil physicochemical properties in Gumara watershed, Upper. Ecol. Process. 2019, 8, 1–14. [Google Scholar]
- Belachew, A.; Mekuria, W.; Nachimuthu, K. Factors influencing adoption of soil and water conservation practices in the northwest Ethiopian highlands. Int. Soil Water Conserv. Res. 2020, 8, 80–89. [Google Scholar] [CrossRef]
- Shepherd, G.; Buresh, R.J.; Gregory, P.J. Land use affects the distribution of soil inorganic nitrogen in smallholder production systems in Kenya. Biol. Fertil. Soils 2000, 31, 348–355. [Google Scholar] [CrossRef]
- Chacón, P.; Lorenz, K.; Lal, R.; Calhoun, F.G.; Fausey, N. Soil organic carbon in some land uses of Costa Rica. Acta Agric. Scand. Sect. B Soil Plant Sci. 2015, 65, 310–320. [Google Scholar] [CrossRef]
- Khadka, D.; Lamichhane, S.; Shrestha, S.R.; Pant, B.B. Evaluation of soil fertility status of Regional Agricultural Research Station, Tarahara, Sunsari, Nepal. Eurasian J. Soil Sci 2017, 6, 295–306. [Google Scholar] [CrossRef] [Green Version]
- Kimigo, J.; Mbuvi, J.; Kironchi, G.; Gicheru, P. Effects of land use change on soil qualities in the Sasumua catchment of Tana River drainage system in Nyandarua District, Kenya. East African Agric. For. J. 2008, 72, 85–94. [Google Scholar]
- Tadesse, M.; Simane, B.; Abera, W.; Tamene, L.; Ambaw, G.; Recha, J.W.; Mekonnen, K.; Demeke, G.; Nigussie, A.; Solomon, D. The effect of climate-smart agriculture on soil fertility, crop yield, and soil carbon in southern ethiopia. Sustainability 2021, 13, 4515. [Google Scholar] [CrossRef]
- Zhao, J.; Dong, Y.; Xie, X.; Li, X.; Zhang, X.; Shen, X. Effect of annual variation in soil pH on available soil nutrients in pear orchards. Acta Ecol. Sin. 2011, 31, 212–216. [Google Scholar] [CrossRef]
- Aciego Pietri, J.C.; Brookes, P.C. Relationships between soil pH and microbial properties in a UK arable soil. Soil Biol. Biochem. 2008, 40, 1856–1861. [Google Scholar] [CrossRef]
- Purnomo, E.; Black, A.S.; Conyers, M.K. The distribution of net nitrogen mineralization within surface soil. 2. Factors influencing the distribution of net N mineralisation. Aust. J. Soil Res. 2000, 38, 643–652. [Google Scholar] [CrossRef]
- Prabha, S.A.C.; Senthivelu, M.; Paramasivam, A. Soil quality indicators for different land uses: A review. Int. J. Plant Soil 2020, 17, 379–387. [Google Scholar]


| Land Use Type | Landscape Features |
|---|---|
| Agroforestry | Multipurpose leguminous trees and shrubs, such as Acacia anguistissima, Cajanus cajan, Gliricidia sepium, Leucaena collinsii, Sesbania sesban, Tephrosia candida and Tephrosia vogelii |
| Community forest | Protected from both livestock and human disturbance, native trees, vegetation and grass cover. |
| Crop land with SWC 1 | Characterized by cultivation of crops (cereal–legumes rotation), irrigation. Minimum tillage and farmyard manure application. |
| Crop land without SWC 1 | Mixed-farming crop cultivation |
| Grass land | Rotational grazing, cut-and-carry system. Denuded of bushes and open for grazing |
| Control | Less disturbed land used as a reference |
| Country | Property | Depth (cm) | Land Use | |||||
|---|---|---|---|---|---|---|---|---|
| Agroforestry (N = 6) | Community Forest (N = 6) | Crop Land with SWC (N = 6) | Crop Land without SWC (N = 6) | Grass Land (N = 6) | Control (N = 6) | |||
| Kenya | pH (Units) | 0–15 | 6.73 ± 0.89 a | 7.09 ± 0.73 a | 7.04 ± 0.73 a | 6.62 ± 0.89 a | 6.93 ± 1.08 a | 7.47 ± 0.89 a |
| 15–45 | 6.69 ± 0.99 a | 6.82 ± 1.54 a | 6.54 ± 0.59 a | 6.94 ± 0.85 a | 7.33 ± 1.13 a | 8.03 ± 0.62 a | ||
| 45–100 | 6.41 ± 0.76 ab | 6.94 ± 1.69 bc | 6.19 ± 0.65 c | 7.91 ± 0.48 ab | 8.08 ± 0.59 ab | 8.48 ± 0.30 a | ||
| ExCa (cmolc kg−1) | 0–15 | 18.34 ± 12.80 a | 28.78 ± 9.44 a | 18.69 ± 6.06 a | 17.32 ± 9.62 a | 22.92 ± 15.52 a | 25.43 ± 7.34 a | |
| 15–45 | 15.36 ± 5.43 a | 23.23 ± 15.32 a | 13.70 ± 3.65 a | 18.15 ± 12.27 a | 23.48 ± 18.80 a | 30.50 ± 6.07 a | ||
| 45–100 | 11.22 ± 6.80 b | 23.40 ± 15.26 ab | 10.24 ± 4.38 b | 28.71 ± 9.43 a | 30.58 ± 9.84 a | 38.14 ± 6.29 a | ||
| ExMg (cmolc kg−1) | 0–15 | 3.68 ± 1.62 a | 5.97 ± 0.87 a | 4.33 ± 0.72 a | 3.07 ± 1.92 a | 3.34 ± 2.17 a | 3.98 ± 2.06 a | |
| 15–45 | 4.09 ± 1.24 a | 4.79 ± 0.83 a | 5.02 ± 1.85 a | 3.20 ± 2.44 a | 3.33 ± 2.64 a | 30.50 ± 6.068 a | ||
| 45–100 | 3.67 ± 1.38 a | 4.48 ± 0.91 a | 5.54 ± 2.49 a | 4.82 ± 1.53 a | 4.92 ± 0.96 a | 4.48 ± 1.71 a | ||
| ExNa (cmolc kg−1) | 0–15 | 0.06 ± 0.05 b | 1.08 ± 1.36 b | 0.05 ± 0.03 b | 0.68 ± 0.26 b | 1.04 ± 0.38 b | 3.52 ± 2.22 a | |
| 15–45 | 0.19 ± 0.17 b | 1.73 ± 2.12 b | 0.08 ± 0.06 c | 1.49 ± 1.13 b | 1.89 ± 1.44 b | 4.64 ± 2.41 a | ||
| 45–100 | 0.29 ± 0.30 b | 2.28 ± 2.28 b | 0.14 ± 0.13 b | 2.78 ± 1.52 ab | 3.21 ± 1.52 ab | 5.36 ± 2.90 a | ||
| ExBases (cmolc kg−1) | 0–15 | 23.32 ± 14.69 a | 37.85 ± 9.72 a | 25.62 ± 6.72 a | 21.98 ± 12.11 a | 28.22 ± 18.34 a | 34.52 ± 10.45 a | |
| 15–45 | 21.07 ± 7.13 a | 31.07 ± 17.57 a | 20.66 ± 5.07 a | 23.72 ± 16.11 a | 29.46 ± 23.21 a | 41.48 ± 8.39 a | ||
| 45–100 | 16.94 ± 7.94 b | 31.31 ± 18.35 ab | 17.20 ± 6.51 b | 38.21 ± 11.82 a | 40.62 ± 11.14 a | 50.30 ± 7.05 a | ||
| P (mg kg−1) | 0–15 | 61.74 ± 61.97 ab | 5.51 ± 3.02 b | 68.95 ± 53.30 a | 5.58 ± 2.35 b | 2.96 ± 0.79 b | 6.27 ± 6.32 b | |
| 15–45 | 13.91 ± 11.28 a | 3.00 ± 3.10 a | 17.72 ± 30.79 a | 2.37 ± 1.59 a | 2.48 ± 1.58 a | 12.24 ± 8.91 a | ||
| 45–100 | 15.52 ± 15.63 a | 3.92 ± 4.61 a | 2.28 ± 2.79 a | 5.71 ± 4.44 a | 3.33 ± 1.97 a | 26.22 ± 29.61 a | ||
| Fe (mg kg−1) | 0–15 | 168.40 ± 80.65 a | 153.00 ± 52.00 a | 145.50 ± 12.31 a | 221.67 ± 78.57 a | 217.88 ± 130.59 a | 145.40 ± 62.75 a | |
| 15–45 | 189.17 ± 101.92 a | 170.30 ± 92.27 a | 124.35 ± 39.67 a | 166.50 ± 34.64 a | 153.00 ± 83.52 a | 92.47 ± 25.57 a | ||
| 45–100 | 163.83 ± 47.48 a | 153.90 ± 89.84 ab | 112.43 ± 20.22 bc | 83.00 ± 23.44 bc | 80.00 ± 29.26 bc | 61.20 ± 3.44 c | ||
| Mn (mg kg−1) | 0–15 | 338.67 ± 75.47 a | 269.50 ± 56.87 ab | 301.00 ± 81.19 ab | 169.97 ± 75.45 b | 194.00 ± 86.21 b | 252.83 ± 74.49 ab | |
| 15–45 | 255.17 ± 107.79 a | 301.17 ± 61.11 a | 191.60 ± 90.40 ab | 105.85 ± 61.54 a | 175.27 ± 98.26 a | 265.50 ± 77.56 a | ||
| 45–100 | 221.00 ± 41.69 a | 304.17 ± 114.36 a | 132.82 ± 40.16 a | 155.10 ± 146.93 a | 190.98 ± 168.07 a | 250.00 ± 18.68 a | ||
| Zn (mg kg−1) | 0–15 | 8.71 ± 11.57 ab | 4.73 ± 3.91 ab | 12.97 ± 7.08 a | 2.34 ± 0.58 b | 1.71 ± 0.44 b | 1.16 ± 0.28 b | |
| 15–45 | 2.99 ± 2.78 a | 2.35 ± 1.22 a | 4.33 ± 4.78 a | 2.94 ± 4.78 b | 0.94 ± 0.23 b | 2.43 ± 3.16 b | ||
| 45–100 | 1.30 ± 0.75 a | 1.63 ± 0.78 a | 0.66 ± 0.33 a | 0.78 ± 0.27 a | 0.85 ± 0.28 a | 3.50 ± 5.15 a | ||
| PSI (Units) | 0–15 | 61.66 ± 56.07 b | 136.00 ± 17.75 a | 89.55 ± 30.15 ab | 64.02 ± 32.80 b | 99.05 ± 20.06 ab | 99.88 ± 24.82 ab | |
| 15–45 | 95.08 ± 46.19 a | 149.45 ± 50.47 a | 128.52 ± 42.29 ab | 68.67 ± 46.99 b | 78.98 ± 27.82 ab | 83.65 ± 19.92 ab | ||
| 45–100 | 111.23 ± 84.50 ab | 132.88 ± 60.88 ab | 165.23 ± 69.74 a | 63.40 ± 17.80 b | 94.23 ± 34.45 ab | 79.27 ± 7.05 ab | ||
| EC (mS/cm) | 0–15 | 0.08 ± 0.05 b | 0.22 ± 0.14 ab | 0.12 ± 0.05 ab | 0.06 ± 0.02 b | 0.08 ± 0.03 b | 0.26 ± 0.17 a | |
| 15–45 | 0.08 ± 0.06 b | 0.12 ± 0.10 ab | 0.06 ± 0.03 b | 0.12 ± 0.10 ab | 0.12 ± 0.07 ab | 0.25 ± 0.10 a | ||
| 45–100 | 0.06 ± 0.05 b | 0.12 ± 0.11 ab | 0.07 ± 0.08 ab | 0.21 ± 0.13 ab | 0.16 ± 0.07 ab | 0.31 ± 0.17 a | ||
| TN (%) | 0–15 | 0.15 ± 0.06 ab | 0.24 ± 0.16 a | 0.23 ± 0.05 ab | 0.13 ± 0.06 ab | 0.15 ± 0.06 ab | 0.09 ± 0.02 c | |
| 15–45 | 0.10 ± 0.02 ab | 0.10 ± 0.04 ab | 0.15 ± 0.05 a | 0.10 ± 0.05 ab | 0.07 ± 0.01 b | 0.07 ± 0.03 b | ||
| 45–100 | 0.05 ± 0.01 a | 0.07 ± 0.04 a | 0.09 ± 0.03 a | 0.06 ± 0.015 a | 0.05 ± 0.01 a | 0.06 ± 0.06 a | ||
| TC (%) | 0–15 | 2.14 ± 0.89 ab | 3.88 ± 2.83 a | 3.22 ± 0.62 ab | 1.78 ± 0.78 ab | 2.12 ± 0.74 ab | 1.29 ± 0.40 b | |
| 15–45 | 1.49 ± 0.42 ab | 1.66 ± 0.60 ab | 2.04 ± 0.65 a | 1.55 ± 0.61 ab | 1.23 ± 0.18 ab | 1.07 ± 0.59 b | ||
| 45–100 | 0.75 ± 0.23 a | 1.27 ± 0.62 a | 1.37 ± 0.67 a | 1.02 ± 0.28 a | 0.88 ± 0.10 a | 0.79 ± 0.29 a | ||
| CEC (cmolc kg−1) | 0–15 | 26.18 ± 14.16 a | 41.01 ± 8.86 a | 27.62 ± 5.66 a | 24.62 ± 11.00 a | 30.75 ± 17.43 a | 36.28 ± 10.15 a | |
| 15–45 | 24.02 ± 5.56 a | 36.87 ± 13.36 a | 23.53 ± 3.74 a | 25.60 ± 16.26 a | 31.06 ± 23.28 a | 42.92 ± 8.54 a | ||
| 45–100 | 19.67 ± 6.97 b | 36.98 ± 14.09 ab | 21.15 ± 5.29 b | 39.62 ± 12.07 a | 42.02 ± 11.30 a | 51.85 ± 7.169 a | ||
| Tanzania | pH (Units) | 0–15 | 6.40 ± 0.25 a | 6.42 ± 0.22 a | 5.99 ± 0.46 a | 6.47 ± 0.48 a | 6.10 ± 0.42 a | 6.28 ± 0.53 a |
| 15–45 | 6.59 ± 0.34 a | 6.37 ± 0.13 a | 6.18 ± 0.52 a | 6.38 ± 0.40 a | 5.98 ± 0.48 a | 6.27 ± 0.71 a | ||
| 45–100 | 6.49 ± 0.59 a | 6.48 ± 0.17 a | 6.18 ± 0.47 a | 6.49 ± 0.36 a | 6.21 ± 0.40 a | 6.29 ± 0.86 a | ||
| ExCa (cmolc kg−1) | 0–15 | 10.56 ± 3.17 a | 11.92 ± 3.17 a | 7.89 ± 2.49 ab | 10.53 ± 3.48 a | 8.68 ± 3.20 ab | 4.78 ± 1.90 b | |
| 15–45 | 8.23 ± 3.88 a | 7.97 ± 0.80 a | 6.63 ± 2.36 a | 7.52 ± 2.92 a | 8.40 ± 2.56 a | 4.29 ± 2.11 a | ||
| 45–100 | 4.99 ± 2.17 a | 5.46 ± 0.99 a | 5.59 ± 2.62 a | 5.17 ± 0.99 a | 6.65 ± 1.87 a | 3.94 ± 2.66 a | ||
| ExMg (cmolc kg−1) | 0–15 | 3.27 ± 0.12 ab | 3.88 ± 0.65 a | 2.52 ± 0.92 ab | 3.30 ± 1.18 ab | 3.00 ± 0.50 ab | 2.05 ± 0.99 b | |
| 15–45 | 2.79 ± 0.66 ab | 3.96 ± 0.22 a | 2.40 ± 0.95 ab | 2.10 ± 0.59 b | 2.28 ± 0.86 b | 1.99 ± 1.16 b | ||
| 45–100 | 2.06 ± 0.74 ab | 3.67 ± 0.58 a | 2.29 ± 1.26 ab | 1.57 ± 0.51 b | 2.04 ± 0.81 ab | 1.85 ± 1.12 b | ||
| ExNa (cmolc kg−1) | 0–15 | 0.02 ± 0.01 a | 0.02 ± 0.00 a | 0.03 ± 0.03 a | 0.02 ± 0.015 a | 0.01 ± 0.01 a | 0.02 ± 0.01 a | |
| 15–45 | 0.03 ± 0.02 a | 0.03 ± 0.00 a | 0.04 ± 0.04 a | 0.02 ± 0.01 a | 0.02 ± 0.03 a | 0.04 ± 0.02 a | ||
| 45–100 | 0.04 ± 0.015 a | 0.08 ± 0.012 a | 0.05 ± 0.07 b | 0.04 ± 0.03 a | 0.04 ± 0.03 a | 0.04 ± 0.02 a | ||
| ExBases (cmolc kg−1) | 0–15 | 14.11 ± 3.15 a | 15.95 ± 3.87 a | 10.61 ± 3.43 ab | 14.15 ± 5.00 a | 11.82 ± 3.42 ab | 6.92 ± 2.72 b | |
| 15–45 | 11.11 ± 4.52 a | 12.04 ± 1.00 a | 9.11 ± 3.27 a | 9.72 ± 3.51 a | 10.77 ± 3.37 a | 6.33 ± 3.00 a | ||
| 45–100 | 7.11 ± 2.76 a | 9.29 ± 1.56 a | 7.95 ± 3.87 a | 6.80 ± 1.41 a | 8.77 ± 2.59 a | 5.84 ± 3.46 a | ||
| P (mg kg−1) | 0–15 | 2.39 ± 1.75 a | 2.53 ± 0.97 a | 5.80 ± 3.11 a | 15.74 ± 22.08 a | 4.49 ± 2.62 a | 0.44 ± 0.49 a | |
| 15–45 | 0.93 ± 1.08 ab | 0.001 ± 0.00 b | 1.42 ± 1.81 ab | 2.75 ± 3.11 ab | 3.63 ± 2.22 a | 0.21 ± 0.42 a | ||
| 45–100 | 0.05 ± 0.12 a | 0.001 ± 0.00 a | 0.66 ± 0.84 a | 0.97 ± 01.09 a | 0.78 ± 0.95 c | 0.17 ± 0.19 c | ||
| Fe (mg kg−1) | 0–15 | 62.35 ± 10.23 b | 157.33 ± 41.31 a | 78.00 ± 18.57 b | 81.40 ± 37.31 b | 73.32 ± 18.43 b | 60.28 ± 13.19 b | |
| 15–45 | 53.97 ± 11.77 b | 116.67 ± 9.50 a | 54.52 ± 17.50 b | 58.82 ± 11.2279 b | 77.03 ± 16.88 b | 57.98 ± 32.52 b | ||
| 45–100 | 42.85 ± 20.11 b | 91.30 ± 23.13 a | 43.15 ± 16.81 b | 39.38 ± 9.40 b | 56.42 ± 12.34 b | 46.13 ± 18.50 b | ||
| Mn (mg kg−1) | 0–15 | 306.33 ± 98.08 a | 348.67 ± 87.27 ab | 129.55 ± 97.34 b | 279.17 ± 124.67 ab | 159.37 ± 129.14 ab | 160.05 ± 113.86 ab | |
| 15–45 | 194.90 ± 127.46 ab | 392.00 ± 124.90 a | 48.97 ± 30.32 b | 185.50 ± 127.83 ab | 134.30 ± 114.82 b | 110.69 ± 120.97 b | ||
| 45–100 | 35.22 ± 43.35 b | 233.77 ± 141.97 a | 21.55 ± 36.55 b | 59.63 ± 78.58 b | 75.33 ± 54.92 b | 73.62 ± 96.54 b | ||
| Zn (mg kg−1) | 0–15 | 7.32 ± 2.79 a | 7.24 ± 1.65 a | 2.98 ± 2.41 ab | 5.85 ± 1.96 a | 3.83 ± 3.27 ab | 0.47 ± 0.45 b | |
| 15–45 | 3.35 ± 3.31 a | 3.21 ± 1.35 a | 0.56 ± 0.45 a | 1.93 ± 1.43 a | 2.7883 ± 3.54 a | 0.16 ± 0.28 a | ||
| 45–100 | 0.22 ± 0.27 a | 0.54 ± 0.63 a | 0.04 ± 0.085 a | 0.19 ± 0.16 a | 0.9818 ± 1.21 a | 0.24 ± 0.42 a | ||
| PSI (Units) | 0–15 | 121.67 ± 28.20 a | 94.47 ± 17.59 a | 97.05 ± 6.71 a | 96.78 ± 30.02 a | 101.33 ± 14.60 a | 135.02 ± 39.39 a | |
| 15–45 | 133.92 ± 27.43 a | 107.67 ± 5.69 a | 115.00 ± 12.55 a | 107.27 ± 35.80 a | 104.40 ± 25.07 a | 141.88 ± 53.08 a | ||
| 45–100 | 143.93 ± 41.59 a | 142.67 ± 29.67 a | 122.27 ± 20.81 a | 118.80 ± 25.23 a | 123.17 ± 19.46 a | 148.02 ± 56.09 a | ||
| EC (mS/cm) | 0–15 | 0.07 ± 0.01 a | 0.09 ± 0.02 a | 0.04 ± 0.01 bc | 0.08 ± 0.03 a | 0.06 ± 0.01 ab | 0.03 ± 0.01 c | |
| 15–45 | 0.05 ± 0.01 a | 0.05 ± 0.01 a | 0.04 ± 0.02 a | 0.04 ± 0.01 a | 0.05 ± 0.01 a | 0.03 ± 0.01 a | ||
| 45–100 | 0.03 ± 0.01 a | 0.04 ± 0.01 a | 0.04 ± 0.02 a | 0.03 ± 0.01 a | 0.04 ± 0.02 a | 0.03 ± 0.01 a | ||
| TN (%) | 0–15 | 0.21 ± 0.04 a | 0.24 ± 0.05 a | 0.18 ± 0.03 a | 0.22 ± 0.05 a | 0.21 ± 0.04 a | 0.08 ± 0.03 b | |
| 15–45 | 0.14 ± 0.05 ab | 0.13 ± 0.01 b | 0.12 ± 0.05 ab | 0.14 ± 0.05 ab | 0.20 ± 0.04 a | 0.07 ± 0.03 b | ||
| 45–100 | 0.05 ± 0.01 b | 0.07 ± 0.01 ab | 0.07 ± 0.04 ab | 0.06 ± 0.014 ab | 0.12 ± 0.05 b | 0.05 ± 0.03 b | ||
| TC (%) | 0–15 | 2.64 ± 0.48 b | 2.76 ± 0.50 b | 2.24 ± 0.33 b | 2.61 ± 0.60 bc | 2.59 ± 0.43 a | 0.93 ± 0.23 a | |
| 15–45 | 1.63 ± 0.64 ab | 1.40 ± 0.11 b | 1.42 ± 0.62 ab | 1.60 ± 0.55 a | 2.43 ± 0.60 a | 0.76 ± 0.27 b | ||
| 45–100 | 0.71 ± 0.24 ab | 0.69 ± 0.08 b | 0.91 ± 0.52 a | 0.81 ± 0.12 a | 1.45 ± 0.63 a | 0.71 ± 0.34 ab | ||
| CEC (cmolc kg−1) | 0–15 | 16.40 ± 3.16 a | 18.43 ± 4.10 a | 13.68 ± 2.95 ab | 16.05 ± 4.50 a | 14.67 ± 2.81 ab | 8.35 ± 2.59 b | |
| 15–45 | 12.41 ± 4.71 ab | 14.10 ± 1.10 a | 11.15 ± 3.04 ab | 11.31 ± 3.49 ab | 13.98 ± 2.73 ab | 7.67 ± 2.81 b | ||
| 45–100 | 8.21 ± 2.44 a | 10.69 ± 1.85 a | 9.69 ± 3.89 a | 7.75 ± 1.20 a | 10.60 ± 2.32 a | 6.901 ± 3.38 a | ||
| Uganda | pH (Units) | 0–15 | 6.89 ± 0.72 a | 6.03 ± 0.87 abc | 6.46 ± 0.29 ab | 6.32 ± 0.25 abc | 5.79 ± 0.52 bc | 5.31 ± 0.59 b |
| 15–45 | 6.59 ± 0.84 a | 5.71 ± 0.54 a | 6.46 ± 0.10 a | 6.17 ± 0.53 a | 5.13 ± 0.33 b | 5.05 ± 0.62 a | ||
| 45–100 | 6.28 ± 0.74 a | 5.84 ± 1.18 a | 6.11 ± 0.50 a | 5.88 ± 0.68 a | 5.06 ± 0.26 a | 5.12 ± 0.66 a | ||
| ExCa (cmolc kg−1) | 0–15 | 18.21 ± 7.51 a | 14.23 ± 7.22 ab | 12.15 ± 2.49 abc | 14.41 ± 1.89 ab | 7.96 ± 4.72 bc | 4.77 ± 3.12 b | |
| 15–45 | 10.17 ± 3.73 a | 7.13 ± 4.42 ab | 9.68 ± 3.28 a | 10.33 ± 2.78 a | 2.03 ± 2.16 b | 2.76 ± 1.68 b | ||
| 45–100 | 5.72 ± 3.38 a | 5.17 ± 2.71 a | 6.01 ± 2.13 a | 5.43 ± 2.86 a | 0.62 ± 0.30 b | 2.58 ± 1.83 ab | ||
| ExMg (cmolc kg−1) | 0–15 | 5.50 ± 0.79 a | 5.17 ± 2.13 a | 3.25 ± 0.71 ab | 4.14 ± 0.42 ab | 3.11 ± 2.13 ab | 2.13 ± 0.91 b | |
| 15–45 | 4.20 ± 1.16 a | 3.67 ± 1.70 a | 3.10 ± 0.82 ab | 3.07 ± 0.30 bc | 0.83 ± 1.15 c | 1.47 ± 0.68 bc | ||
| 45–100 | 1.83 ± 1.03 ab | 4.28 ± 3.12 a | 2.83 ± 0.56 ab | 2.10 ± 1.11 abc | 0.26 ± 0.23 c | 1.01 ± 0.60 bc | ||
| ExNa (cmolc kg−1) | 0–15 | 0.03 ± 0.01 a | 0.12 ± 0.18 a | 0.02 ± 0.023 a | 0.03 ± 0.02 a | 0.06 ± 0.02 a | 0.26 ± 0.45 a | |
| 15–45 | 0.05 ± 0.03 a | 0.78 ± 1.71 a | 0.02 ± 0.006 a | 0.05 ± 0.02 a | 0.07 ± 0.05 a | 0.05 ± 0.01 a | ||
| 45–100 | 0.03 ± 0.01 a | 2.120 ± 4.71 a | 0.02 ± 0.01 a | 0.04 ± 0.01 a | 0.04 ± 0.02 a | 0.06 ± 0.02 a | ||
| ExBases (cmolc kg−1) | 0–15 | 24.65 ± 8.66 a | 20.37 ± 9.25 ab | 16.59 ± 3.66 abc | 19.13 ± 2.07 ab | 11.53 ± 6.74 bc | 7.73 ± 3.72 b | |
| 15–45 | 15.23 ± 4.77 a | 12.05 ± 5.82 a | 13.25 ± 3.48 a | 13.71 ± 3.16 a | 3.06 ± 3.27 b | 4.42 ± 2.22 b | ||
| 45–100 | 9.69 ± 4.24 a | 11.88 ± 9.48 a | 9.09 ± 2.16 ab | 7.69 ± 3.93 ab | 1.01 ± 0.45 b | 3.84 ± 2.50 ab | ||
| P (mg kg−1) | 0–15 | 22.52 ± 45.35 a | 14.45 ± 8.43 a | 6.08 ± 4.26 a | 2.57 ± 0.46 a | 3.63 ± 0.89 a | 4.91 ± 8.09 a | |
| 15–45 | 1.28 ± 1.03 ab | 3.34 ± 2.34 a | 1.61 ± 2.50 ab | 0.53 ± 0.34 b | 1.29 ± 0.84 ab | 0.23 ± 0.28 b | ||
| 45–100 | 0.61 ± 0.53 ab | 1.16 ± 0.94 a | 0.11 ± 0.28 b | 0.001 ± 0.00 b | 0.63 ± 0.47 ab | 0.15 ± 0.23 b | ||
| Fe (mg kg−1) | 0–15 | 75.08 ± 9.67 b | 193.50 ± 104.62 a | 100.02 ± 22.71 b | 96.62 ± 20.25 b | 141.38 ± 55.80 ab | 91.08 ± 29.77 b | |
| 15–45 | 92.27 ± 9.40 ab | 196.43 ± 136.02 a | 120.40 ± 28.20 ab | 109.78 ± 13.02 ab | 103.38 ± 50.45 ab | 70.35 ± 22.24 b | ||
| 45–100 | 103.15 ± 23.37 ab | 130.12 ± 69.57 a | 118.45 ± 29.32 ab | 100.60 ± 21.47 ab | 76.25 ± 33.43 ab | 57.25 ± 8.67 b | ||
| Mn (mg kg−1) | 0–15 | 468.83 ± 74.49 a | 200.38 ± 154.90 a | 557.00 ± 62.53 a | 398.83 ± 51.47 ab | 104.23 ± 122.66 a | 252.22 ± 140.10 bc | |
| 15–45 | 390.83 ± 129.82 a | 128.95 ± 119.65 b | 519.17 ± 123.35 a | 358.00 ± 90.40 a | 33.06 ± 41.91 b | 152.43 ± 106.79 b | ||
| 45–100 | 331.83 ± 167.95 a | 99.99 ± 104.02 bc | 392.00 ± 143.57 a | 275.00 ± 78.22 ab | 18.06 ± 21.25 c | 85.67 ± 40.90 c | ||
| Zn (mg kg−1) | 0–15 | 3.25 ± 1.27 a | 3.27 ± 1.48 a | 3.24 ± 0.59 a | 1.88 ± 1.42 ab | 0.76 ± 0.35 b | 0.76 ± 1.17 b | |
| 15–45 | 0.89 ± 0.52 b | 0.68 ± 0.31816 b | 1.59 ± 0.83 b | 0.69 ± 0.26 b | 0.39 ± 0.13 a | 0.19 ± 0.15 ab | ||
| 45–100 | 0.39 ± 0.23 a | 0.34 ± 0.17 a | 0.49 ± 0.35 a | 0.28 ± 0.04 a | 0.18 ± 0.19 a | 0.24 ± 0.25 a | ||
| PSI (Units) | 0–15 | 89.83 ± 17.08 ab | 94.95 ± 53.41 ab | 64.78 ± 14.51 b | 108.05 ± 42.91 ab | 220.35 ± 164.81 a | 223.00 ± 104.40 a | |
| 15–45 | 134.55 ± 50.11 bc | 140.35 ± 80.11 bc | 101.97 ± 27.29 c | 158.50 ± 53.09 bc | 346.83 ± 172.25 a | 275.33 ± 72.81 ab | ||
| 45–100 | 170.63 ± 50.87 b | 172.52 ± 101.91 b | 176.67 ± 48.27 b | 253.17 ± 69.94 ab | 391.33 ± 136.02 a | 290.33 ± 66.70 ab | ||
| EC (mS/cm) | 0–15 | 0.10 ± 0.02 c | 0.11 ± 0.04 a | 0.09 ± 0.03 a | 0.06 ± 0.01 a | 0.04 ± 0.016 a | 0.22 ± 0.27 a | |
| 15–45 | 0.06 ± 0.03 ab | 0.05 ± 0.02 ab | 0.05 ± 0.02 ab | 0.04 ± 0.01 ab | 0.02 ± 0.01 b | 0.07 ± 0.04 a | ||
| 45–100 | 0.04 ± 0.02 a | 0.06 ± 0.06 a | 0.04 ± 0.01 a | 0.03 ± 0.01 a | 0.01 ± 0.004 a | 0.06 ± 0.05 a | ||
| TN (%) | 0–15 | 0.22 ± 0.03 ab | 0.36 ± 0.13 a | 0.20 ± 0.05 ab | 0.23 ± 0.03 ab | 0.32 ± 0.25 ab | 0.13 ± 0.05 ab | |
| 15–45 | 0.13 ± 0.04 a | 0.16 ± 0.05 a | 0.13 ± 0.03 a | 0.15 ± 0.03 a | 0.23 ± 0.24 a | 0.11 ± 0.09 a | ||
| 45–100 | 0.09 ± 0.05 a | 0.11 ± 0.02 a | 0.08 ± 0.01 a | 0.09 ± 0.01 a | 0.17 ± 0.16 a | 0.07 ± 0.02 a | ||
| TC (%) | 0–15 | 3.08 ± 0.32 ab | 4.50 ± 1.66 a | 2.68 ± 0.76 ab | 3.40 ± 0.32 ab | 4.82 ± 3.47 a | 1.35 ± 0.73 b | |
| 15–45 | 1.76 ± 0.54 a | 2.06 ± 0.73 a | 1.57 ± 0.64 a | 2.13 ± 0.20 a | 3.28 ± 2.95 a | 1.26 ± 1.24 a | ||
| 45–100 | 1.09 ± 0.87 ab | 1.18 ± 0.36 ab | 0.75 ± 0.26 ab | 0.96 ± 0.093 ab | 2.15 ± 1.68 a | 0.70 ± 0.22 b | ||
| CEC (cmolc kg−1) | 0–15 | 26.97 ± 8.07 a | 26.68 ± 9.96 a | 19.50 ± 3.39 ab | 22.67 ± 2.31 ab | 15.41 ± 6.64 b | 12.79 ± 4.56 b | |
| 15–45 | 17.55 ± 3.81 a | 16.94 ± 8.76 ab | 15.25 ± 3.86 ab | 16.95 ± 1.72 ab | 5.45 ± 4.62 c | 8.61 ± 3.52 bc | ||
| 45–100 | 11.95 ± 4.95 ab | 16.14 ± 9.42 a | 11.41 ± 1.18 ab | 9.99 ± 3.77 abc | 2.13 ± 1.13 c | 7.10 ± 3.52 bc | ||
| BD | pH | ExCa | ExK | ExMg | ExNa | ExBas | ExAc | CEC | P | S | B | Cu | Fe | Mn | Zn | Al | PSI | EC | TN | TC | C:N Ratio | |
|---|---|---|---|---|---|---|---|---|---|---|---|---|---|---|---|---|---|---|---|---|---|---|
| Kenya | ||||||||||||||||||||||
| pH | 0.687 ** | |||||||||||||||||||||
| ExCa | 0.587 ** | 0.885 ** | ||||||||||||||||||||
| ExK | −0.076 | 0.305 ** | 0.206 * | |||||||||||||||||||
| ExMg | 0.121 | 0.471 ** | 0.598 ** | 0.268 ** | ||||||||||||||||||
| ExNa | 0.686 ** | 0.746 ** | 0.662 ** | 0.073 | 0.212 * | |||||||||||||||||
| ExBas | 0.587 ** | 0.899 ** | 0.991 ** | 0.260 ** | 0.651 ** | 0.711 ** | ||||||||||||||||
| ExAc | −0.280 ** | −0.416 ** | −0.301 ** | −0.114 | −0.161 | −0.175 | −0.295 ** | |||||||||||||||
| CEC | 0.523 ** | 0.840 ** | 0.979 ** | 0.237 * | 0.669 ** | 0.695 ** | 0.989 ** | −0.211 * | ||||||||||||||
| P | −0.106 | 0.185 | 0.068 | 0.259 ** | 0.030 | −0.069 | 0.062 | −0.118 | 0.029 | |||||||||||||
| S | 0.043 | 0.018 | 0.029 | −0.013 | −0.098 | 0.106 | 0.026 | −0.043 | 0.020 | −0.018 | ||||||||||||
| B | 0.100 | 0.495 ** | 0.555 ** | 0.246 * | 0.579 ** | 0.102 | 0.549 ** | −0.234 * | 0.526 ** | 0.355 ** | −0.080 | |||||||||||
| Cu | 0.323 ** | 0.544 ** | 0.573 ** | 0.052 | 0.692 ** | 0.217 * | 0.584 ** | −0.229 * | 0.561 ** | 0.273 ** | −0.092 | 0.582 ** | ||||||||||
| Fe | −0.482 ** | −0.721 ** | −0.646 ** | −0.438 ** | −0.505 ** | −0.515 ** | −0.682 ** | 0.123 | −0.645 ** | −0.058 | −0.090 | −0.385 ** | −0.390 ** | |||||||||
| Mn | −0.226 * | 0.124 | 0.244 * | 0.169 | 0.197 * | 0.064 | 0.240 * | 0.067 | 0.285 ** | 0.175 | 0.028 | 0.270 ** | 0.048 | −0.164 | ||||||||
| Zn | −0.275 ** | 0.049 | 0.083 | 0.254 ** | 0.143 | −0.239 * | 0.064 | −0.076 | 0.064 | 0.573 ** | −0.084 | 0.530 ** | 0.236 * | 0.034 | 0.242 * | |||||||
| Al | −0.543 ** | −0.639 ** | −0.546 ** | 0.202 * | −0.089 | −0.440 ** | −0.508 ** | 0.535 ** | −0.433 ** | −0.274 ** | 0.064 | −0.300 ** | −0.316 ** | 0.179 | 0.025 | −0.100 | ||||||
| PSI | −0.387 ** | −0.407 ** | −0.227 * | 0.149 | 0.163 | −0.226 * | −0.191 * | 0.572 ** | −0.105 | −0.369 ** | 0.011 | −0.077 | −0.143 | −0.039 | 0.169 | −0.173 | 0.805 ** | |||||
| EC | 0.479 ** | 0.675 ** | 0.678 ** | 0.209 * | 0.354 ** | 0.743 ** | 0.711 ** | −0.225 * | 0.696 ** | 0.111 | 0.490 ** | 0.369 ** | 0.298 ** | −0.544 ** | 0.204 * | −0.002 | −0.361 ** | −0.159 | ||||
| TN | −0.546 ** | −0.323 ** | −0.193 * | 0.122 | 0.037 | −0.388 ** | −0.202 * | −0.040 | −0.174 | 0.281 ** | −0.040 | 0.365 ** | −0.024 | 0.304 ** | 0.118 | 0.553 ** | 0.133 | 0.099 | −0.083 | |||
| TC | −0.521 ** | −0.280 ** | −0.105 | 0.074 | 0.114 | −0.329 ** | −0.115 | −0.016 | −0.074 | 0.192 * | −0.116 | 0.363 ** | 0.002 | 0.286 ** | 0.114 | 0.530 ** | 0.095 | 0.138 | −0.082 | 0.941 ** | ||
| C:N Ratio | 0.319 ** | 0.364 ** | 0.468 ** | −0.209 * | 0.308 ** | 0.453 ** | 0.473 ** | 0.009 | 0.501 ** | −0.145 | −0.227 * | 0.071 | 0.253 ** | −0.197 * | 0.026 | −0.062 | −0.405 ** | −0.058 | 0.215 * | −0.244 * | 0.017 | |
| LU | 0.677 ** | 0.420 ** | 0.366 ** | 0.055 | −0.071 | 0.567 ** | 0.373 ** | −0.224 * | 0.339 ** | −0.185 | 0.035 | −0.002 | 0.061 | −0.241 * | −0.215 * | −0.194 * | −0.217 * | −0.213 * | 0.396 ** | −0.216 * | −0.235 * | 0.038 |
| Tanzania | ||||||||||||||||||||||
| pH | 0.099 | |||||||||||||||||||||
| ExCa | −0.417 ** | 0.443 ** | ||||||||||||||||||||
| ExK | −0.328 ** | 0.270 ** | 0.572 ** | |||||||||||||||||||
| ExMg | −0.253 * | 0.464 ** | 0.719 ** | 0.500 ** | ||||||||||||||||||
| ExNa | 0.222 * | 0.285 ** | 0.004 | −0.086 | 0.259 ** | |||||||||||||||||
| ExBas | −0.400 ** | 0.475 ** | 0.984 ** | 0.606 ** | 0.831 ** | 0.071 | ||||||||||||||||
| ExAc | 0.144 | −0.432 ** | −0.258 ** | −0.077 | −0.188 | −0.067 | −0.252 * | |||||||||||||||
| CEC | −0.477 ** | 0.274 ** | 0.963 ** | 0.579 ** | 0.791 ** | 0.007 | 0.973 ** | −0.217 * | ||||||||||||||
| P | −0.309 ** | 0.044 | 0.371 ** | 0.750 ** | 0.257 * | −0.166 | 0.379 ** | −0.050 | 0.395 ** | |||||||||||||
| S | 0.019 | −0.604 ** | −0.431 ** | −0.167 | −0.304 ** | −0.026 | −0.420 ** | 0.629 ** | −0.338 ** | −0.062 | ||||||||||||
| B | −0.176 | 0.579 ** | 0.663 ** | 0.576 ** | 0.561 ** | 0.053 | 0.680 ** | −0.119 | 0.582 ** | 0.347 ** | −0.295 ** | |||||||||||
| Cu | −0.356 ** | 0.339 ** | 0.763 ** | 0.523 ** | 0.413 ** | −0.168 | 0.719 ** | −0.105 | 0.689 ** | 0.358 ** | −0.249 * | 0.612 ** | ||||||||||
| Fe | −0.227 * | −0.020 | 0.446 ** | 0.334 ** | 0.490 ** | −0.136 | 0.482 ** | −0.119 | 0.543 ** | 0.402 ** | −0.175 | 0.171 | 0.258 * | |||||||||
| Mn | −0.249 * | 0.290 ** | 0.703 ** | 0.370 ** | 0.571 ** | −0.106 | 0.706 ** | −0.147 | 0.694 ** | 0.076 | −0.286 ** | 0.460 ** | 0.624 ** | 0.499 ** | ||||||||
| Zn | −0.493 ** | 0.188 | 0.818 ** | 0.576 ** | 0.542 ** | −0.164 | 0.796 ** | −0.103 | 0.818 ** | 0.349 ** | −0.218 * | 0.459 ** | 0.757 ** | 0.392 ** | 0.758 ** | |||||||
| Al | −0.107 | −0.735 ** | −0.308 ** | −0.150 | −0.312 ** | −0.177 | −0.326 ** | 0.341 ** | −0.178 | 0.086 | 0.439 ** | −0.377 ** | −0.225 * | −0.044 | −0.303 ** | −0.202 * | ||||||
| PSI | 0.233 * | −0.080 | −0.181 | −0.207 * | −0.004 | 0.025 | −0.150 | 0.397 ** | −0.177 | −0.259 ** | 0.427 ** | 0.144 | −0.053 | −0.178 | −0.043 | −0.243 * | 0.180 | |||||
| EC | −0.517 ** | 0.117 | 0.714 ** | 0.589 ** | 0.574 ** | −0.204 * | 0.721 ** | −0.121 | 0.759 ** | 0.482 ** | −0.200 * | 0.456 ** | 0.600 ** | 0.506 ** | 0.594 ** | 0.764 ** | −0.149 | −0.191 | ||||
| TN | −0.583 ** | −0.155 | 0.695 ** | 0.496 ** | 0.362 ** | −0.386 ** | 0.650 ** | −0.142 | 0.767 ** | 0.481 ** | −0.194 | 0.276 ** | 0.557 ** | 0.566 ** | 0.571 ** | 0.778 ** | 0.096 | −0.332 ** | 0.753 ** | |||
| TC | −0.595 ** | −0.199 * | 0.668 ** | 0.493 ** | 0.311 ** | −0.398 ** | 0.616 ** | −0.111 | 0.739 ** | 0.491 ** | −0.161 | 0.240 * | 0.556 ** | 0.503 ** | 0.508 ** | 0.779 ** | 0.142 | −0.348 ** | 0.743 ** | 0.988 ** | ||
| C:N Ratio | 0.097 | −0.265 ** | −0.327 ** | −0.134 | −0.441 ** | −0.084 | −0.371 ** | 0.303 ** | −0.362 ** | −0.028 | 0.299 ** | −0.268 ** | −0.115 | −0.427 ** | −0.444 ** | −0.129 | 0.169 | −0.015 | −0.200 * | −0.224 * | −0.092 | |
| LU | 0.074 | −0.169 | −0.271 ** | −0.142 | −0.316 ** | −0.088 | −0.297 ** | 0.183 | −0.283 ** | 0.029 | 0.189 | −0.202 * | −0.105 | −0.113 | −0.219 * | −0.303 ** | 0.239 * | 0.024 | −0.288 ** | −0.145 | −0.151 | 0.045 |
| Uganda | ||||||||||||||||||||||
| pH | 0.001 | |||||||||||||||||||||
| ExCa | −0.185 | 0.727 ** | ||||||||||||||||||||
| ExK | 0.007 | 0.538 ** | 0.321 ** | |||||||||||||||||||
| ExMg | −0.080 | 0.708 ** | 0.773 ** | 0.293 ** | ||||||||||||||||||
| ExNa | 0.057 | 0.230 * | −0.034 | −0.036 | 0.368 ** | |||||||||||||||||
| ExBas | −0.148 | 0.798 ** | 0.957 ** | 0.398 ** | 0.900 ** | 0.213 * | ||||||||||||||||
| ExAc | −0.083 | −0.575 ** | −0.466 ** | −0.189 | −0.439 ** | 0.036 | −0.465 ** | |||||||||||||||
| CEC | −0.156 | 0.642 ** | 0.915 ** | 0.323 ** | 0.907 ** | 0.192 * | 0.960 ** | −0.416 ** | ||||||||||||||
| P | −0.158 | 0.331 ** | 0.541 ** | 0.310 ** | 0.338 ** | 0.014 | 0.516 ** | −0.109 | 0.501 ** | |||||||||||||
| S | 0.151 | −0.256 ** | −0.210 * | 0.014 | −0.094 | 0.067 | −0.168 | 0.068 | −0.087 | 0.073 | ||||||||||||
| B | −0.212 * | 0.570 ** | 0.668 ** | 0.415 ** | 0.454 ** | −0.119 | 0.628 ** | −0.299 ** | 0.535 ** | 0.367 ** | −0.202 * | |||||||||||
| Cu | 0.047 | 0.621 ** | 0.587 ** | 0.185 | 0.660 ** | 0.435 ** | 0.681 ** | −0.293 ** | 0.620 ** | 0.183 | −0.099 | 0.404 ** | ||||||||||
| Fe | −0.106 | −0.008 | 0.101 | −0.090 | 0.349 ** | 0.269 ** | 0.191 * | 0.037 | 0.330 ** | 0.088 | 0.017 | −0.079 | 0.177 | |||||||||
| Mn | 0.233 * | 0.566 ** | 0.562 ** | 0.191 * | 0.376 ** | −0.183 | 0.500 ** | −0.528 ** | 0.413 ** | 0.101 | −0.105 | 0.381 ** | 0.498 ** | −0.083 | ||||||||
| Zn | −0.241 * | 0.492 ** | 0.772 ** | 0.363 ** | 0.505 ** | −0.076 | 0.720 ** | −0.299 ** | 0.683 ** | 0.535 ** | −0.172 | 0.662 ** | 0.510 ** | 0.084 | 0.498 ** | |||||||
| Al | −0.268 ** | −0.701 ** | −0.734 ** | −0.304 ** | −0.707 ** | −0.059 | −0.754 ** | 0.582 ** | −0.704 ** | −0.230 * | 0.142 | −0.505 ** | −0.636 ** | −0.141 | −0.684 ** | −0.569 ** | ||||||
| PSI | −0.157 | −0.579 ** | −0.688 ** | −0.224 * | −0.731 ** | −0.125 | −0.729 ** | 0.480 ** | −0.733 ** | −0.193 * | 0.029 | −0.392 ** | −0.743 ** | −0.328 ** | −0.621 ** | −0.573 ** | 0.908 ** | |||||
| EC | 0.140 | 0.114 | 0.168 | 0.300 ** | 0.225 * | 0.224 * | 0.242 * | −0.125 | 0.278 ** | 0.291 ** | 0.756 ** | 0.166 | 0.164 | −0.001 | 0.142 | 0.205 * | −0.167 | −0.205 * | ||||
| TN | −0.604 ** | 0.089 | 0.315 ** | 0.081 | 0.194 * | −0.014 | 0.287 ** | −0.143 | 0.317 ** | 0.200 * | −0.033 | 0.369 ** | −0.003 | 0.136 | −0.083 | 0.359 ** | 0.179 | 0.147 | 0.112 | |||
| TC | −0.632 ** | 0.103 | 0.360 ** | 0.076 | 0.201 * | −0.062 | 0.315 ** | −0.153 | 0.338 ** | 0.201 * | −0.105 | 0.361 ** | 0.029 | 0.139 | −0.074 | 0.380 ** | 0.153 | 0.104 | 0.025 | 0.975 ** | ||
| C:N Ratio | −0.414 ** | 0.105 | 0.345 ** | 0.006 | 0.122 | −0.194 * | 0.258 ** | −0.069 | 0.242 * | 0.102 | −0.254 ** | 0.147 | 0.251 ** | 0.137 | 0.021 | 0.284 ** | −0.042 | −0.164 | −0.266 ** | 0.263 ** | 0.444 ** | |
| LU | 0.077 | −0.551 ** | −0.466 ** | −0.290 ** | −0.588 ** | −0.099 | −0.531 ** | 0.223 * | −0.486 ** | −0.196 * | 0.164 | −0.283 ** | −0.511 ** | −0.245 * | −0.404 ** | −0.366 ** | 0.467 ** | 0.517 ** | 0.064 | −0.037 | −0.038 | −0.068 |
Publisher’s Note: MDPI stays neutral with regard to jurisdictional claims in published maps and institutional affiliations. |
© 2022 by the authors. Licensee MDPI, Basel, Switzerland. This article is an open access article distributed under the terms and conditions of the Creative Commons Attribution (CC BY) license (https://creativecommons.org/licenses/by/4.0/).
Share and Cite
Recha, J.W.; Olale, K.O.; Sila, A.M.; Ambaw, G.; Radeny, M.; Solomon, D. Measuring Soil Quality Indicators under Different Climate-Smart Land Uses across East African Climate-Smart Villages. Agronomy 2022, 12, 530. https://doi.org/10.3390/agronomy12020530
Recha JW, Olale KO, Sila AM, Ambaw G, Radeny M, Solomon D. Measuring Soil Quality Indicators under Different Climate-Smart Land Uses across East African Climate-Smart Villages. Agronomy. 2022; 12(2):530. https://doi.org/10.3390/agronomy12020530
Chicago/Turabian StyleRecha, John Walker, Kennedy O. Olale, Andrew M. Sila, Gebermedihin Ambaw, Maren Radeny, and Dawit Solomon. 2022. "Measuring Soil Quality Indicators under Different Climate-Smart Land Uses across East African Climate-Smart Villages" Agronomy 12, no. 2: 530. https://doi.org/10.3390/agronomy12020530
APA StyleRecha, J. W., Olale, K. O., Sila, A. M., Ambaw, G., Radeny, M., & Solomon, D. (2022). Measuring Soil Quality Indicators under Different Climate-Smart Land Uses across East African Climate-Smart Villages. Agronomy, 12(2), 530. https://doi.org/10.3390/agronomy12020530