
Optical Spectrometry to Determine Nutrient Concentrations and other Physicochemical Parameters in Liquid Organic Manures: A Review


Abstract
:1. Introduction
2. Spectrometric Methods
2.1. Physical Background
2.2. Spectrometer Types
- Dispersive grating scanning monochromator (SM) benchtop spectrometers, which are characterized by a high resolution but slow scan speed and sensitive moving parts, limiting the on-site use at the farm or in the field (e.g., NIR-Systems 6500, FOSS, Hilleroed, Denmark, used in [13,14,15,16,17,18,19,20]);
- Fourier transform (FT) spectrometers, which have the advantage of being faster and higher in resolution compared to dispersive spectrometers. Originally they were used only for the mid-infrared region, but today they are also well established in the near-infrared region (e.g., NIRFlex N-500, BÜCHI Labortechnik AG, Flawil, Switzerland, used in [21,25,26]);
- Bandpass spectrometers using bandpass filters for selected wavelengths, characterized by low-cost detectors with small wavelength ranges (e.g., MM55 instrument, NDC Infrared Engineering Ltd., Maldon, England, used in [12]).
- The photoacoustic (PA) technique, which records the sound of mid-infrared radiation emitted by irradiated samples due to pressure and volume changes (Nicolet 380 FT-IR, Thermo Fisher Scientific Inc., Waltham, MA, USA, combined with the photoacoustic cell PAC300, MTEC Photoacoustics Inc., Ames, IA, USA, used in [27]);
2.3. Measuring Modes and Sample Preparation Techniques
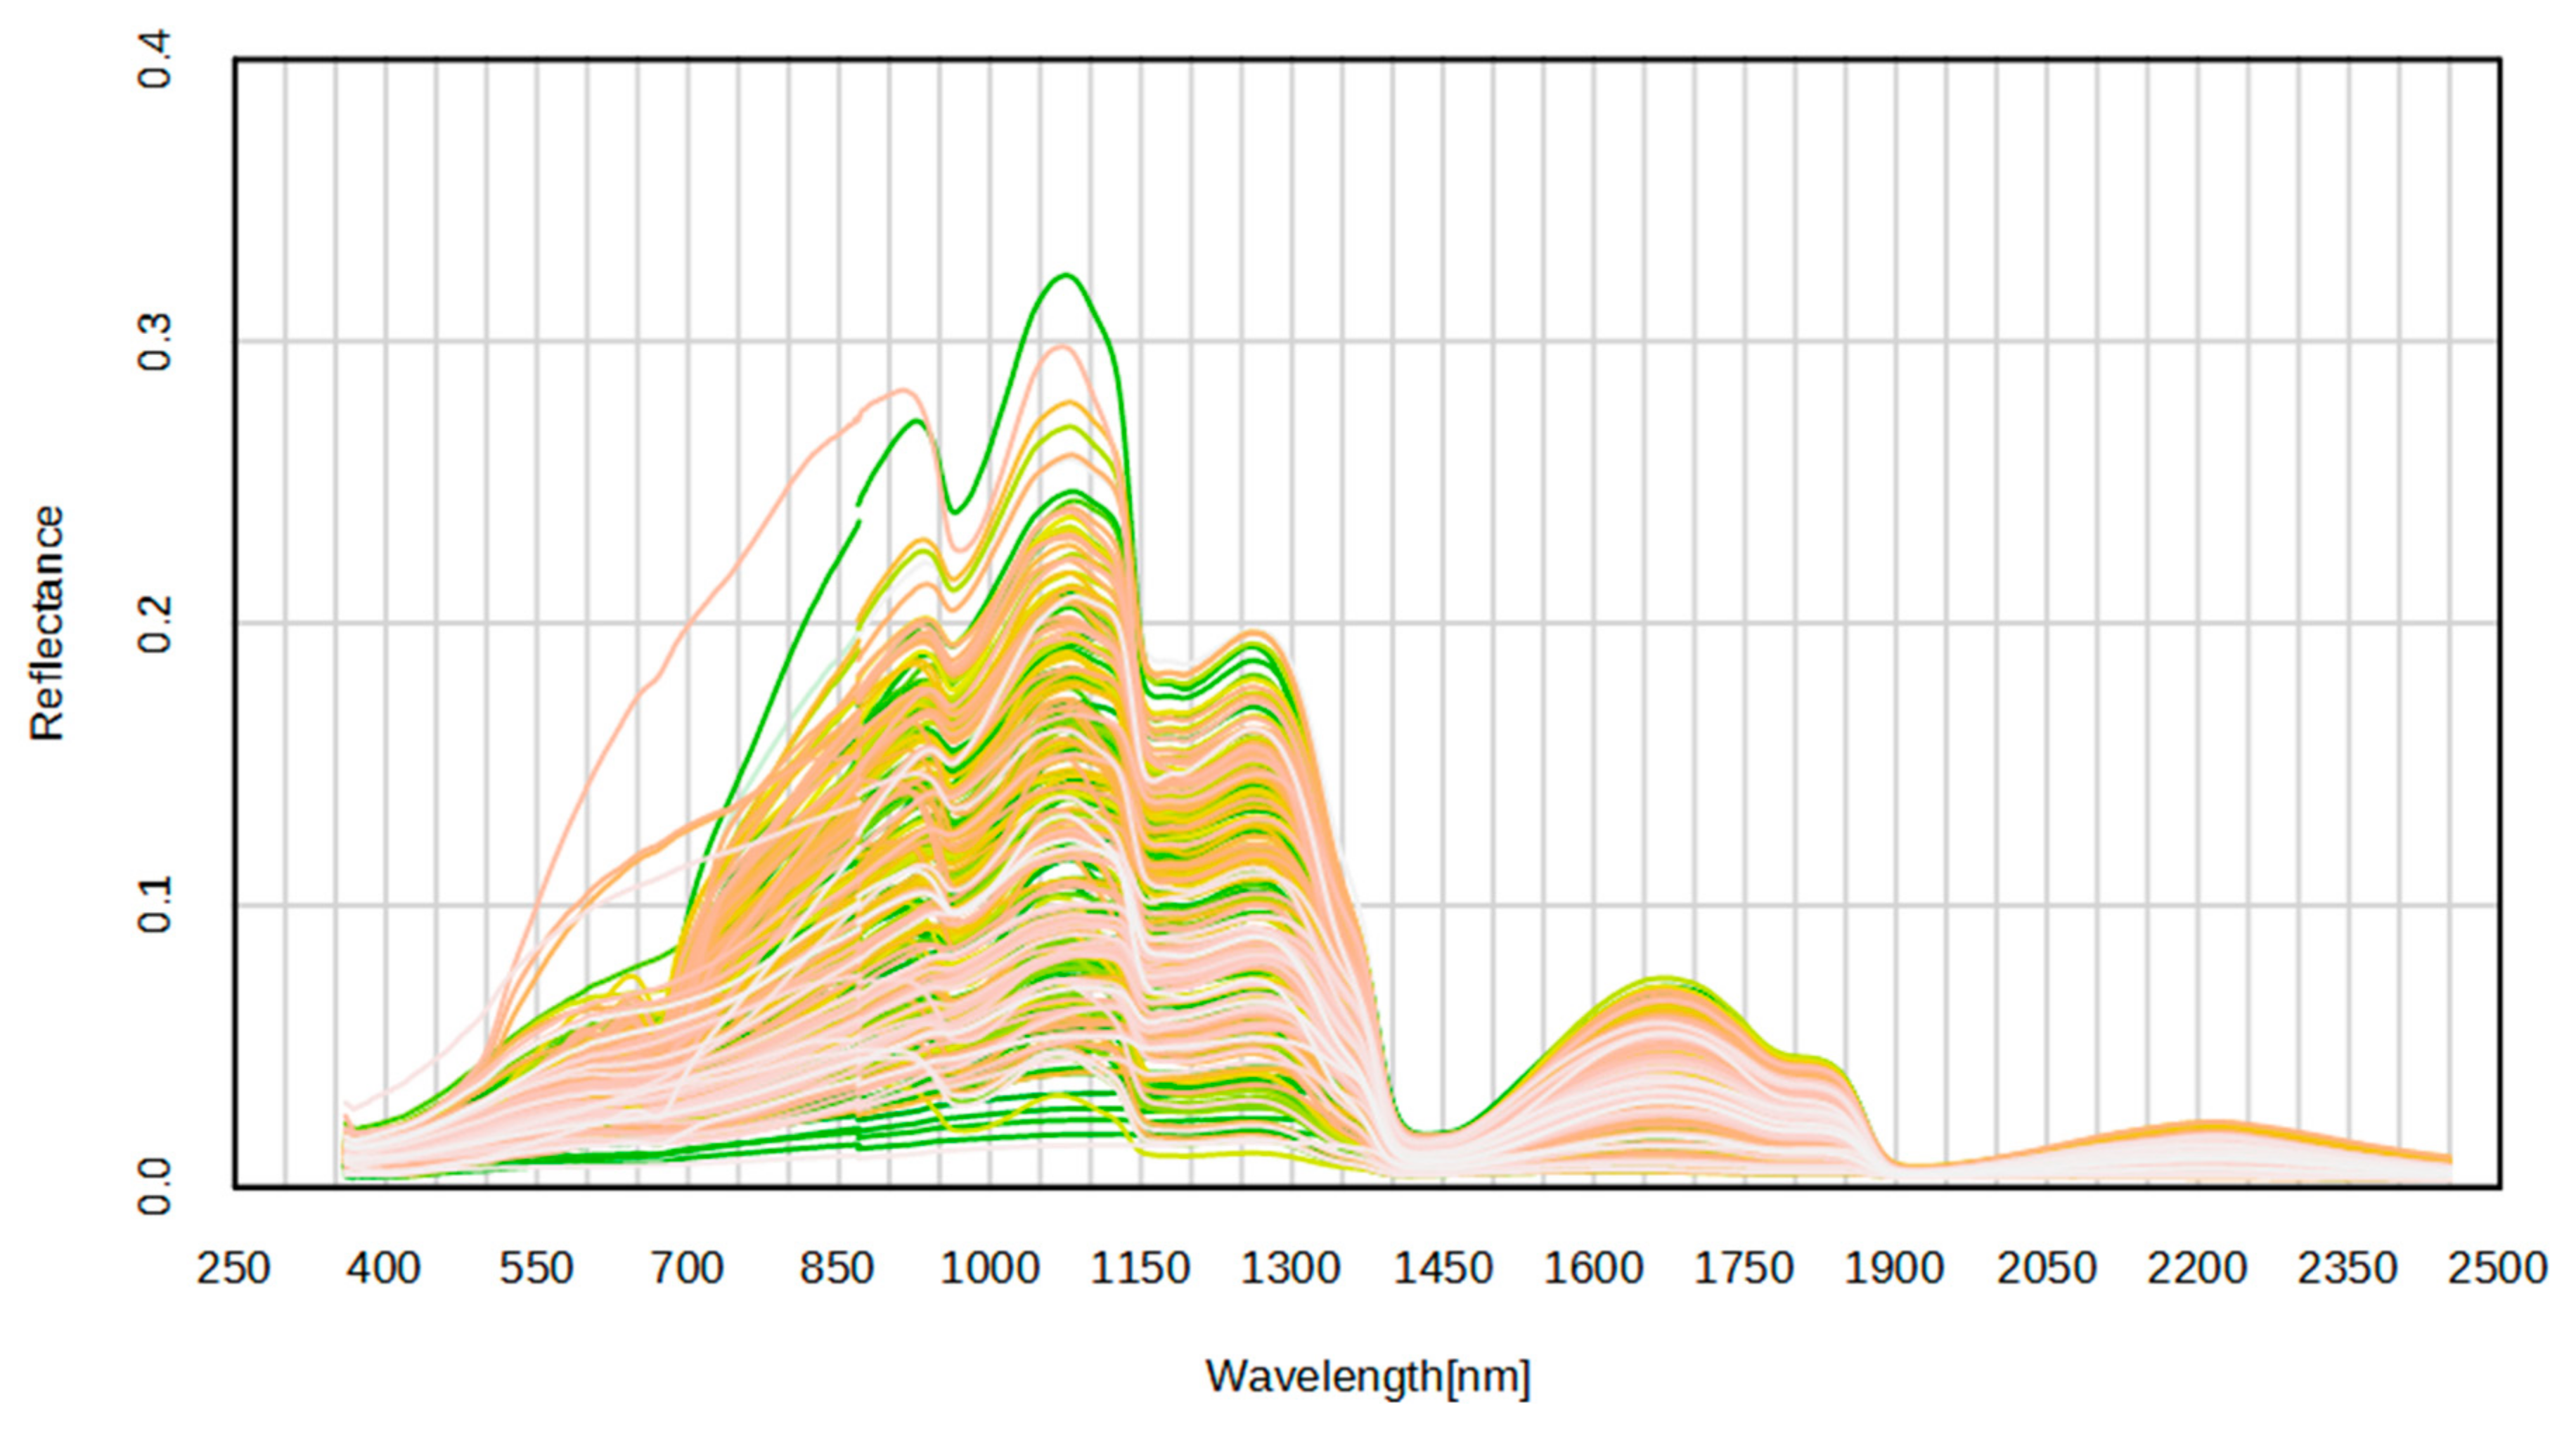
2.4. Spectra of Liquid Organic Manures
2.5. Statistical Analysis Using Chemometric Methods
2.5.1. Preprocessing Methods
- Mean centering (MC; Equation (4));
- Smoothing, e.g., rectangular smooth (Sr; unweighted sliding average smooth with n points; Equation (5)) or Savitzky–Golay smoothing (SG0; [39]);
- Standard normal variate transformation/scaling (SNV; Equation (6); [40]);
- Standard normal variate transformation combined with detrend (SNVD; used in [19]);
- First or second derivate, e.g., with Savitzky–Golay algorithm (SG1 or SG2; [39]);
- Multiplicative signal/scatter correction (MSC; [41]; Equation (7));
- Area normalization (used in [12]), where each sample is normalized to the area under the spectra (calculated as integral of the spectral curve).
2.5.2. Regression Models and Machine Learning Methods
2.5.3. Model Evaluation Parameters
- Coefficient of correlation (R);
- Coefficient of determination (R2; Equation (8));
- Standard error of prediction, calibration, or cross-validation (SEP, SEC, SECV; Equation (9));
- Ratio of the standard deviation of the reference values (SDref; Equation (11)) and the SEP (SDref/SEP; so-called ratio of performance (RPD) introduced by [58]);
- Ratio of the sample range and RMSEP (so-called range error ratio (RER), e.g., used in [24]);
- Ratio of relative mean squared difference (RMSD) and mean (so-called relative standard deviation (RSD), e.g., used in [16]);
- Ratio of sample range and SEP (e.g., [15]);
- The slope (so-called residual variance or random error) and the bias (so-called error of means or systematic error) of the regression line.
2.5.4. Outliers
3. Published Data
4. Applications in Laboratory and Field Practice
5. Conclusions
Author Contributions
Funding
Conflicts of Interest
References
- Zhang, H.; Dao, T.; Basta, N.; Dayton, E.; Daniel, T. Remediation techniques for manure nutrient loaded soils. In Animal Agriculture and the Environment—National Center for Manure & Animal Waste Management White Paper; American Society of Agricultural and Biological Engineers (ASABE): St. Joseph, MI, USA, 2006. [Google Scholar]
- Lin, Y.; Ye, G.; Kuzyakov, Y.; Liu, D.; Fan, J.; Ding, W. Long-term manure application increases soil organic matter and aggregation, and alters microbial community structure and keystone taxa. Soil Biol. Biochem. 2019, 134, 187–196. [Google Scholar] [CrossRef]
- Withers, P.J.A.; Haygarth, P.M. Agriculture, phosphorus and eutrophication: A European perspective. Soil Use Manag. 2007, 23, 1–4. [Google Scholar] [CrossRef]
- Zhu, J.; Ndegwa, P.M.; Zhang, Z. Manure sampling procedures and nutrient estimation by the hydrometer method for gestation pigs. Bioresour. Technol. 2004, 92, 243–250. [Google Scholar] [CrossRef] [PubMed]
- Saeys, W. Technical Tools for the Optimal Use of Animal Manure as a Fertiliser: On-Line Composition Measurement and Manure Injection Control. Ph.D. Thesis, Katholieke Universiteit Leuven, Leuven, Belgium, 2006. [Google Scholar]
- Rubenschuh, U.; Volz, F. Nährstoffgehalte in Gülle Online Mit Sensoren Bestimmen; DLG kompakt, No. 8; DLG e.V: Frankfurt am Main, Germany, 2019. [Google Scholar]
- Burns, D.A.; Ciurczak, E.W. Handbook of Near-Infrared Analysis, 3rd ed.; CRC Press: Boca Raton, FL, USA, 2007. [Google Scholar]
- Schmidt, W. Optical Spectroscopy in Chemistry and Life Sciences; Wiley-VCH: Weinheim, Germany, 2005; ISBN 3-527-29911-4. [Google Scholar]
- Suzuki, T.; Nakagawa, T.; Ohkubo, K.; Fukuzumi, S.; Matsuo, Y. Electronic infrared light absorption of a tri-palladium complex containing two π-expanded tetracene ligands. Chem. Sci. 2014, 5, 4888–4894. [Google Scholar] [CrossRef]
- Shenk, J.S.; Workman, J.J.; Westerhaus, M.O. Application of NIR spectroscopy to agricultural products. In Handbook of Near-Infrared Analysis, 3rd ed.; Burns, D.A., Ciurczak, E.W., Eds.; CRC Press: Boca Raton, FL, USA, 2007; pp. 347–383. ISBN 978-0-4291-2301-6. [Google Scholar]
- Saeys, W.; Mouazen, A.M.; Ramon, H. Potential for onsite and online analysis of pig manure using visible and near infrared reflectance spectroscopy. Biosyst. Eng. 2005, 91, 393–402. [Google Scholar] [CrossRef]
- Kemsley, E.K.; Tapp, H.S.; Scarlett, A.J.; Miles, S.J.; Hammond, R.; Wilson, R.H. Comparison of spectroscopic techniques for the determination of Kjeldahl and ammoniacal nitrogen content of farmyard manure. J. Agric. Food Chem. 2001, 49, 603–609. [Google Scholar] [CrossRef]
- Althaus, B.; Papke, G.; Sundrum, A. Technical note: Use of near infrared reflectance spectroscopy to assess nitrogen and carbon fractions in dairy cow feces. Anim. Feed Sci. Technol. 2013, 185, 53–59. [Google Scholar] [CrossRef]
- Malley, D.F.; Yesmin, L.; Eilers, R.G. Rapid analysis of hog manure and manure-amended soils using near-infrared spectroscopy. Soil Sci. Soc. Am. J. 2002, 66, 1677. [Google Scholar] [CrossRef]
- Millmier, A.; Lorimor, J.; Hurburgh, C., Jr.; Fulhage, C.; Hattey, J.; Zhang, H. Near-infrared sensing of manure nutrients. Trans. Am. Soc. Agric. Biol. Eng. (ASAE) 2000, 43, 903–908. [Google Scholar] [CrossRef]
- Reeves, J.B. Near- versus mid-infrared diffuse reflectance spectroscopy for determination of minerals in dried poultry manure. Poult. Sci. 2001, 80, 1437–1443. [Google Scholar] [CrossRef]
- Reeves, J.B. Near-infrared diffuse reflectance spectroscopy for the analysis of poultry manures. J. Agric. Food Chem. 2001, 49, 2193–2197. [Google Scholar] [CrossRef] [PubMed]
- Saeys, W.; Xing, J.; de Baerdemaeker, J.; Ramon, H. Comparison of transflectance and reflectance to analyse hog manures. J. Near Infrared Spectrosc. 2005, 13, 99–107. [Google Scholar] [CrossRef]
- Sørensen, L.K.; Sørensen, P.; Birkmose, T.S. Application of reflectance near infrared spectroscopy for animal slurry analyses. Soil Sci. Soc. Am. J. 2007, 71, 1398. [Google Scholar] [CrossRef]
- Ye, W.; Lorimor, J.C.; Hurburgh, C.; Zhang, H.; Hattey, J. Application of near-infrared reflectance spectroscopy for determination of nutrient contents in liquid and solid manures. Trans. Am. Soc. Agric. Biol. Eng. (ASAE) 2005, 48, 1911–1918. [Google Scholar] [CrossRef]
- Cabassi, G.; Cavalli, D.; Fuccella, R.; Marino Gallina, P. Evaluation of four NIR spectrometers in the analysis of cattle slurry. Biosyst. Eng. 2015, 133, 1–13. [Google Scholar] [CrossRef]
- Malley, D.F.; McClure, C.; Martin, P.D.; Buckley, K.; McCaughey, W.P. Compositional analysis of cattle manure during composting using a field-portable near-infrared spectrometer. Commun. Soil Sci. Plant Anal. 2005, 36, 455–475. [Google Scholar] [CrossRef]
- Mouazen, A.M.; Saeys, W.; Xing, J.; de Baerdemaeker, J.; Ramon, H. Near infrared spectroscopy for agricultural materials: An instrument comparison. J. Near Infrared Spectrosc. 2005, 13, 87–97. [Google Scholar] [CrossRef]
- Saeys, W.; Darius, P.; Ramon, H. Potential for on-site analysis of hog manure using a visual and near infrared diode array reflectance spectrometer. J. Near Infrared Spectrosc. 2004, 12, 299–309. [Google Scholar] [CrossRef]
- Finzi, A.; Oberti, R.; Negri, A.S.; Perazzolo, F.; Cocolo, G.; Tambone, F.; Cabassi, G.; Provolo, G. Effects of measurement technique and sample preparation on NIR spectroscopy analysis of livestock slurry and digestates. Biosyst. Eng. 2015, 134, 42–54. [Google Scholar] [CrossRef]
- Tamburini, E.; Castaldelli, G.; Ferrari, G.; Marchetti, M.G.; Pedrini, P.; Aschonitis, V.G. Onsite and online FT-NIR spectroscopy for the estimation of total nitrogen and moisture content in poultry manure. Environ. Technol. 2015, 36, 2285–2294. [Google Scholar] [CrossRef]
- Du, C.; Zhou, G.; Jianmin, Z.; Huoyan, W.; Xiaoqin, C.; Yuanhua, D.; Hui, W. Characterization of animal manures using mid-infrared photoacoustic spectroscopy. Bioresour. Technol. 2010, 101, 6273–6277. [Google Scholar] [CrossRef]
- Malley, D.; Martin, P.; Woods, S.E. Analysis of Nutrients in Hog Manure by Field-Portable Near-Infrared Spectroscopy: Development of a Mobile Laboratory and Results for Foss NIR Systems Inc. Model 6500 Spectrophotometer in the Laboratory: Final Report 1 of 3 to CETAC-West on Manure Demo Project; PDK Projects, Inc.: Nanaimo, BC, Canada, 2001. [Google Scholar]
- Malley, D.; Martin, P.; Moffatt, T. Analysis of Minor Elements and Metals in Hog Manure by Field-Portable NIR Spectroscopy: Results for the Textron-Case NH Pro Spectra-Spectrometer: Final Report 2 of 3 to Manitoba Livestock Manure Management Initiative on Project 00-02-03; PDK Projects, Inc.: Nanaimo, BC, Canada, 2001. [Google Scholar]
- Malley, D.; Martin, P.; Dettman, L. Analysis of Minor Elements and Metals in Hog Manure by Field-Portable Near-Infrared Spectroscopy: Results for the Zeiss Corona® Spectrometer: Final Report 3 of 3 to Manitoba Livestock Manure Management Initiative on Project 00-02-03; PDK Projects, Inc.: Nanaimo, BC, Canada, 2001. [Google Scholar]
- Bries, J.; Vanongeval, L.; Goppens, G. Variaties in Samenstelling van Dierlijke Mest: Beïnvloedende Factoren en te nemen Voorzoren voor Verantwoord Gebruik Als Meststof; KVIV Studiedag Mestproblematiek: Antwerp, Belgium, 1997. [Google Scholar]
- Yang, Z.; Han, L.; Fan, X. Rapidly Estimating Nutrient Contents of Fattening Pig Manure from Floor Scrapings by near Infrared Reflectance Spectroscopy. J. Near Infrared Spectrosc. 2006, 14, 261–268. [Google Scholar] [CrossRef]
- De Ferrari, G.; Gallina, P.M.; Cabassi, G.; Bechini, L.; Maggiore, T. Near infrared spectral analysis of cattle slurries from Lombardy (Northern Italy) breeding farms NIR. In NIR 2005- NIR in Action. Making a Difference. Near Infrared Spectroscopy Proceedings of the 12th International Conference, Auckland, New Zealand, 9–15 April 2005; NZNIRSS—The New Zealand Near Infrared Spectroscopy Society: Auckland, New Zealand, 2005. [Google Scholar]
- Dong, Y.; Chen, Y.; Zhu, D.; Li, Y.; Xu, C.; Bai, W.; Wang, Y.; Li, Q. The determination of total N, total P, Cu and Zn in chicken manure using near infrared reflectance spectroscopy. In Computer and Computing Technologies in Agriculture IV.; Li, D., Liu, Y., Chen, Y., Eds.; Springer: Berlin/Heidelberg, Germany, 2011; pp. 92–98. ISBN 978-3-642-18353-9. [Google Scholar]
- Tauber, M.; Wenzl, W.; Somitsch, W. NIRS-Nanobag Methode als Schnellanalytik von Gärgut für die Begleitende Prozesskontrolle von Landwirtschaftlichen Biogasanlagen. In Gute Herstellungspraxis für Pflanzliche Produkte; ALVA Tagungsbericht: Wien, Austria, 2007; pp. 30–32. [Google Scholar]
- Wenzl, W.; Steiner, B.; Haberl, L. Feldstudie zur NIRS-Gülleanalyse und Vergleich der Nährstoffbilanzen mit Tabellenwerten. In Gute Herstellungspraxis für Pflanzliche Produkte; ALVA Tagungsbericht: Wien, Austria, 2007; pp. 33–34. [Google Scholar]
- Saeys, W.; Watté, R.; Postelmans, A. Role of NIR Spectroscopy in Precision Fertilisation with Manure; International Fertilizer Society: Colchester, UK, 2019; pp. 1–21. [Google Scholar]
- Arnold, M.A.; Small, G.W. Determination of physiological levels of glucose in an aqueous matrix with digitally filtered Fourier transform near-infrared spectra. Anal. Chem. 1990, 62, 1457–1464. [Google Scholar] [CrossRef]
- Savitzky, A.; Golay, M.J.E. Smoothing and Differentiation of Data by Simplified Least Squares Procedures. Anal. Chem. 1964, 36, 1627–1639. [Google Scholar] [CrossRef]
- Barnes, R.J.; Dhanoa, M.S.; Lister, S.J. Standard normal variate transformation and de-trending of near-infrared diffuse reflectance spectra. Appl. Spectrosc. 1989, 43, 772–777. [Google Scholar] [CrossRef]
- Martens, H.; Jensen, S.A.; Geladi, P. Martens; Harald; Jensen, S.A.; Geladi, P. Multivariate linearity transformation for near-infrared reflectance spectrometry. In Proceedings of the Nordic Symposium on Applied Statistics, Stavanger, Norway, 12–14 June 1983. [Google Scholar]
- Martens, H.; Stark, E. Extended multiplicative signal correction and spectral interference subtraction: New preprocessing methods for near infrared spectroscopy. J. Pharm. Biomed. Anal. 1991, 9, 625–635. [Google Scholar] [CrossRef]
- Wold, S.; Antti, H.; Lindgren, F.; Öhman, J. Orthogonal signal correction of near-infrared spectra. Chemom. Intell. Lab. Syst. 1998, 44, 175–185. [Google Scholar] [CrossRef]
- Westerhuis, J.A.; de Jong, S.; Smilde, A.K. Direct orthogonal signal correction. Chemom. Intell. Lab. Syst. 2001, 56, 13–25. [Google Scholar] [CrossRef]
- Chen, L.J.; Xing, L.; Han, L.J. Influence of data preprocessing on the quantitative determination of nutrient content in poultry manure by near infrared spectroscopy. J. Environ. Qual. 2010, 39, 1841. [Google Scholar] [CrossRef]
- Wold, H. Soft Modelling by Latent Variables: The Non-Linear Iterative Partial Least Squares (NIPALS) Approach. J. Appl. Probab. 1975, 12, 117–142. [Google Scholar] [CrossRef]
- Mevik, B.-H.; Wehrens, R. The pls package: Principal component and partial least squares regression in R. J. Stat. Softw. 2007, 18, 1–23. [Google Scholar] [CrossRef] [Green Version]
- Sternberg, J.C.; Stillo, H.S.; Schwendeman, R.H. Spectrophotometric analysis of multicomponent systems using least squares method in matrix form. Ergosterol irradiation system. Anal. Chem. 1960, 32, 84–90. [Google Scholar] [CrossRef]
- Dagnew, M.; Crowe, T.; Schoenau, J. Measurement of nutrients in Saskatchewan hog manures using near-infrared spectroscopy. Can. Biosyst. Eng. 2004, 46, 33–37. [Google Scholar]
- Malley, D.F.; Currie, R.S. Feasibility Study on the Rapid Analysis of Available N and P in Hog Manure and Manure-Amended Soils by Near-Infrared Spectroscopy: Report; PDK Projects, Inc.: Nanaimo, BC, Canada, 1999. [Google Scholar]
- Chen, L.J.; Xing, L.; Han, L.J. Quantitative determination of nutrient content in poultry manure by near infrared spectroscopy based on artificial neural networks. Poult. Sci. 2009, 88, 2496–2503. [Google Scholar] [CrossRef] [PubMed]
- Tibshirani, R. Regression shrinkage and selection via the lasso. J. R. Stat. Society. Ser. B 1996, 58, 267–288. [Google Scholar] [CrossRef]
- Hoerl, A.E.; Kennard, R.W. Ridge regression: Applications to nonorthogonal problems. Technometrics 1970, 12, 69–82. [Google Scholar] [CrossRef]
- Efron, B.; Hastie, T.; Johnstone, I.; Tibshirani, R. Least angle regression. Ann. Stat. 2004, 32, 407–499. [Google Scholar] [CrossRef] [Green Version]
- Breiman, L. Random Forests. Mach. Learn. 2001, 45, 5–32. [Google Scholar] [CrossRef] [Green Version]
- Reeves, J.B.; van Kessel, J.S. Near-infrared spectroscopic determination of carbon, total nitrogen, and ammonium-N in dairy manures. J. Dairy Sci. 2000, 83, 1829–1836. [Google Scholar] [CrossRef]
- Sakirkin, S.L.P.; Morgan, C.L.S.; MacDonald, J.C.; Auvermann, B.W. Effect of diet composition on the determination of ash and moisture content in solid cattle manure using visible and near-infrared spectroscopy. Appl. Spectrosc. 2011, 65, 1056–1061. [Google Scholar] [CrossRef]
- Williams, P.C. Interpretation of statistical evaluation of NIR analysis. In Near-Infrared Technology in the Agriculture and Food Industries; American Association of Cereal Chemists, Inc.: St. Paul, MN, USA, 1987; pp. 146–148. [Google Scholar] [CrossRef]
- Minasny, B.; McBratney, A. Why you don’t need to use RPD. Pedometron 2013, 33, 14–15. [Google Scholar]
- Bellon-Maurel, V.; Fernandez-Ahumada, E.; Palagos, B.; Roger, J.-M.; McBratney, A. Critical review of chemometric indicators commonly used for assessing the quality of the prediction of soil attributes by NIR spectroscopy. Trends Anal. Chem. (TrAC) 2010, 29, 1073–1081. [Google Scholar] [CrossRef]
- Asai, T.; Shimizu, S.; Koga, T.; Sato, M. Quick determination of total nitrogen, total carbon and crude ash in cattle manure using near infrared reflectance spectroscopy. Jpn. J. Soil Sci. Plant Nutr. 1993, 64, 669–675. [Google Scholar] [CrossRef]
- Becaccia, A.; Ferrer, P.; Ibañez, M.A.; Estellés, F.; Rodríguez, C.; Moset, V.; de Blas, C.; Calvet, S.; García-Rebollar, P. Relationships among slurry characteristics and gaseous emissions at different types of commercial Spanish pig farms. Spanish J. Agric. Res. 2015, 13, e0602. [Google Scholar] [CrossRef]
- Benozzo, F.; Berzaghi, P. Use of a near infrared portable instrument in monitoring anaerobic digestion process parameters and nutrients in digestates. Proceeding of Biogas Science Conference 2018, Lingotto Conference Center, Torino, Italy, 17–19 September 2018; Biogas Science: Tulln an der Donau, Austrian, 2018. [Google Scholar]
- Dolud, M.; Andree, H.; Hügle, T. Rapid analysis of liquid hog manure using near-infrared spectroscopy in flowing condition. In Pecision Livestock Farming ‘05; Cox, S., Ed.; Wageningen Academic Publishers: Wageningen, The Netherlands, 2005; pp. 115–122. [Google Scholar]
- Reeves, J.B.; van Kessel, J.S. Determination of ammonium-N, moisture, total C and total N in dairy manures using a near infrared fibre-optic spectrometer. J. Near Infrared Spectrosc. 2000, 8, 151–160. [Google Scholar] [CrossRef]
- Sørensen, P.; Birkmose, T.; Hansen, M.; Sorensen, L. Rapid analysis of animal slurry by NIR spectroscopy. In NJF-Seminar-Manure-an Agronomic and Environmental Challenge; Nordiska Jordbruksforskares Förening (NJF): Uppsala, Sweden, 2005; pp. 95–96. [Google Scholar]
- Williams, P.; Eising, E.; Malley, D.F. Industrial-scale continuous on-line analysis of liquid hog manure by NIRS. NIR News 2020, 31, 25–29. [Google Scholar] [CrossRef]
- Xing, L.; Chen, L.J.; Han, L.J. Rapid analysis of layer manure using near-infrared reflectance spectroscopy. Poult. Sci. 2008, 87, 1281–1286. [Google Scholar] [CrossRef]
- Zimmermann, A.; Thiessen, E.; Andree, H.; Hartung, E. Einsatz von. Nahinfrarotspektroskopie für eine nährstoffgesteuerte Gülleausbringung In Proceeding of Unternehmens-IT: Führungsinstrument oder Verwaltungsbürde? Referate der 28. GIL Jahrestagung, Kiel, Germany, 10–11 March 2008; Müller, R.A.E., Sundermeier, H.-H., Theuvsen, L., Schütze, S., Morgenstern, M., Eds.; GIL: Esslingen, Germany, 2008; pp. 169–172. ISBN 978-3-88579-219-2. [Google Scholar]
- Beć, K.B.; Grabska, J.; Siesler, H.W.; Huck, C.W. Handheld near-infrared spectrometers: Where are we heading? NIR News 2020, 31, 28–35. [Google Scholar] [CrossRef] [Green Version]
- Zimmermann, A.; Hartung, E. Abschlußbericht zum BLE-Projekt: Nährstoffgesteuerte Gülleausbringung: -05UM003. 2009. Available online: https://docplayer.org/14127726-Abschlussbericht-zum-ble-projekt-naehrstoffgesteuerte-guelleausbringung-05um003.html (accessed on 22 January 2022).
- Drücker, H. Organische Düngung. Jahrb. Agrartech. 2019, 31, 31. [Google Scholar] [CrossRef]
- Hunger, R. Dank Online Sensoren Licht ins Dunkel bringen Nährstoffgehalte in der Gülle bestimmen: Ergänzung zum Schwerpunkt «Hofdünger»; Schweizer Landtechnik: Riniken, Switzerland, 2021. [Google Scholar]
- Hoffmann, S.; Saev, M.; Wehlert, N. TENIRS. In Fallstudien zur Gründung und Entwicklung innovationsorientierter Unternehmen; Walter, A., Rasmus, A., Riesenhuber, F., Schmidthals, J., Dickel, P., Eds.; Springer: Wiesbaden, Germany, 2014; pp. 173–188. ISBN 978-3-658-03597-6. [Google Scholar]
- Severin, K.; Hoffmann, A.; Lichti, F.; Olfs, H.-W.; Rest, T.; Tillmann, P. Die Nahinfrarotspektroskopie (NIRS) zur Untersuchung von Güllen und Gärresten; Standpunkte des VDLUFA.; Verband Deutscher Landwirtschaftlicher Untersuchungs und Forschungsanstalten e.V.: Speyer, Germany, 2019. [Google Scholar]
- Chen, L.; Xing, L.; Han, L. Review of the application of near-infrared spectroscopy technology to determine the chemical composition of animal manure. J. Environ. Qual. 2013, 42, 1015–1028. [Google Scholar] [CrossRef]


| Reference | Althaus et al. 2013 [13] | Asai et al. 1993 [61] | Becaccia et al. 2015 [62] | Benozzo et al. 2018 [63] | Cabassi et al. 2015 [21] | Chen et al. 2009 [51] | Chen et al. 2010 [45] | Dagnew et al. 2004 [49] | De Ferrari et al. 2007 [33] | Dolud et al. 2005 [64] | Dong et al. 2011 [34] |
|---|---|---|---|---|---|---|---|---|---|---|---|
| Liquid organic manure | dried dairy faeces | dried dairy cattle | pig | digestate | cattle | poultry | poultry | hog | cattle | hog | dried poultry |
| No. samples (% for validation) | 168 (14%) | 75 (33%) | 79 (-) | 80 (-) | 99 (33%) | 91 (25%) | 91 (25%) | 88 (28%) | 101 (-) | 128 (40%) | 74 (66%) |
| Scan mode (material) | R | R | R (PE-bags) | R (boro-silicate) | R | R | R | R | R | T (3 mm) | R |
| Range (nm) | 408–2493 | 1445–2348 | 1100–2400 | 950–1650 | (a) 1000–2500 (b) 1100–1690 | 1000–2500 | 1000–2500 | 250–2500 | 1100–2498 | 960–1690 | 800–2500 |
| R2 (RMSEP or SEP) of | |||||||||||
| DM (%) | - | - | 0.96 (0.18) | 0.66 (0.63) | (a) 0.92 (1.01) | - | - | 0.92 (0.80) | 0.95 (0.95) | 0.97 (0.28) | - |
| pH | - | - | 0.84 (0.11) | 0.64 (0.09) | - | - | - | - | 0.29 (0.25) | - | - |
| EC (mS/cm) | - | - | - | 0.86 (1.41) | - | - | - | - | 0.11 (2.55) | - | - |
| Na (g/kg) | - | - | - | - | - | - | - | - | - | - | - |
| OM/TC/TOC/ ash (g/kg) | TC 0.96 (2.90) | ash 0.99 (22.4) TC 0.97 (14.5) | ash 0.81 (0.10) | TOC 0.73 (2.1) | (a) ash 0.88 (3.3) | - | - | - | TC 0.92 (3.74) | - | - |
| TN (g/kg) | 0.97 (0.67) | 0.93 (1.7) | 0.93 (0.77) | - | (b) 0.86 (0.47) | 0.92 (0.91) | 0.82 (1.29) | 0.89 (0.98) | 0.90 (0.32) | 0.94 (0.32) | 0.48 (8.0) *1 |
| NH4-N (g/kg) | 0.91 (0.18) | - | 0.88 (0.80) | 0.85 (0.23) | (b) 0.78 (0.27) | 0.90 (0.75) | 0.88 (0.85) | - | 0.83 (0.18) | 0.88 (0.24) | - |
| P (g/kg) | - | - | - | 0.80 (0.12) | (b) 0.74 (0.15) | 0.86 (0.42) | 0.74 (0.64) | 0.79 (0.42) | 0.78 (0.13) | - | 0.74 (3.4) *1 |
| K (g/kg) | - | - | - | 0.73 (0.12) | - | 0.72 (0.73) | 0.57 (1.08) | 0.68 (0.50) | 0.19 (0.67) | - | - |
| Mg (g/kg) | - | - | - | - | - | - | - | - | - | - | - |
| Ca (g/kg) | - | - | - | 0.69 (4.3) | - | - | - | - | - | - | - |
| S (g/kg) | - | - | - | 0.78 (0.4) | - | - | - | - | - | - | - |
| Mn (g/kg) | - | - | - | - | - | - | - | - | - | - | - |
| Fe (g/kg) | - | - | - | 0.81 (0.6) | - | - | - | - | - | - | - |
| Cu (g/kg) | - | - | - | - | - | - | - | - | - | - | 0.90 (0.01) *1 |
| Zn (g/kg) | - | - | - | 0.85 (0.05) | - | - | - | - | - | - | 0.87 (0.03) *1 |
| Reference | Du et al. 2010 [27] | Finzi et al. 2015 [25] | Finzi et al. 2015 [25] | Finzi et al. 2015 [25] | Kemsley et al. 2001 [12] | Kemsley et al. 2001 [12] | Malley et al. 2001a [28] | Malley et al. 2001b [29] | Malley et al. 2001c [30] | Malley et al. 2002 [14] | Malley et al. 2005 [22] |
|---|---|---|---|---|---|---|---|---|---|---|---|
| Liquid organic manure | dried: pig, poultry, cattle | pig | dairy | digestate | pig, turkey, cattle | turkey, cattle | hog | hog | hog | hog | air-dried cattle |
| No. samples (% for validation) | 81 (27%) | 12 (-) | 12 (-) | 12 (-) | 45 (-) | 30 (-) | 80 (-) | 80 (-) | 80 (-) | 64 or 75 (50%) | 179 (-) |
| Scan mode | PA | T (0.3mm) | T (0.3mm) | T (0.3 mm) | ATR | R | T (2 mm) | T (2 mm) | T (2 mm) | T (2 mm) | R |
| Range (nm) | 2500–20,000 (MIR) | 1000–2500 | 1000–2500 | 1000–2500 | 5540–11,160 (MIR) | 1935, 2050, 2100, 2180, 2220 | 400–2498 | 620–1050 | 938–1700 | 400–2498 | 380–1690 |
| R2 (RMSEP or SEP) of | |||||||||||
| DM (%) | - | 0.96 (0.87) | 0.92 (0.25) | 0.92 (0.22) | - | - | 0.97 *2 (0.49) | 0.96 (0.57) | - | 0.94 (0.20) *3 | - |
| pH | - | - | - | - | - | - | 0.96 (0.07) | - | - | 0.84 (0.09) | 0.89 (0.29) |
| EC (mS/cm) | - | - | - | - | - | - | 0.94 (1.17) | - | - | 0.85 (0.77) | - |
| Na (g/kg) | - | - | - | - | - | - | 0.85 *2 (0.03) | 0.61 (0.05) | 0.80 (0.04) | 0.95 (0.03) | - |
| OM/TC/susp C (g/kg) | 0.93 (23.8) | - | - | - | - | - | susp C 0.98 (1.56) | - | - | susp C 0.99 (0.7) | TC 0.91 (23.4) |
| TN/TDN (g/kg) | - | 0.94 (0.50) | 0.81 (0.27) | 0.97 (0.16) | 0.74 (6.77) | 0.75 (8.94) | TDN 0.95 (0.20) | - | - | TDN 0.94 (0.12) | 0.74 (1.2) |
| NH4-N (g/kg) | - | 0.95 (0.21) | 0.91 (0.08) | 0.98 (0.12) | 0.81 (3.87) | 0.92 (3.50) | 0.95 (0.24) | - | - | 0.97 (0.07) | - |
| P/TDP (g/kg) | - | - | - | - | - | - | 0.98 *2 (0.21) | 0.85 (0.57) | 0.94 (0.35) | TDP 0.99 (0.06) | 0.61 (0.70) |
| K (g/kg) | - | - | - | - | - | - | 0.92*2 (0.16) | 0.62 (0.32) | 0.75 (0.24) | 0.87 (0.06) | 0.83 (2.9) |
| Mg (g/kg) | - | - | - | - | - | - | 0.98 *2 (0.10) | 0.86 (0.27) | 0.96 (0.14) | 0.98 (0.03) | - |
| Ca (g/kg) | - | - | - | - | - | - | 0.97 *2 (0.21) | 0.74 (0.63) | 0.90 (0.35) | 0.80 (0.03) | - |
| S (g/kg) | - | - | - | - | - | - | 0.95 *2 (0.01) | 0.84 (0.02) | 0.84 (0.02) | - | 0.73 (0.44) |
| Mn (g/kg) | - | - | - | - | - | - | 0.96 *2 (0.01) | 0.78 (0.01) | 0.88 (0.01) | - | - |
| Fe (g/kg) | - | - | - | - | - | - | 0.96 *2 (0.03) | 0.77 (0.06) | 0.97 (0.02) | - | - |
| Cu (g/kg) | - | - | - | - | - | - | 0.99 *2 (0.01) | 0.92 (0.01) | 0.95 (0.01) | - | - |
| Zn (g/kg) | - | - | - | - | - | - | 0.98 *2 (0.02) | 0.79 (0.06) | 0.93 (0.001) | - | - |
| Reference | Millmier et al. 2000 [15] | Millmier et al. 2000 [15] | Millmier et al. 2000 [15] | Mouazen et al. 2005 [23] | Reeves & Van Kessel, 2000a [56] | Reeves & Van Kessel, 2000b [65] | Reeves 2001a [16] | Reeves 2001a [16] | Reeves 2001b [17] | Saeys et al. 2004 [24] | Saeys et al. 2005a [11] |
|---|---|---|---|---|---|---|---|---|---|---|---|
| Liquid organic manure | pig | pig, lagoon effluent | cattle | hog | dairy | dairy | dried poultry | dried poultry | poultry | hog | pig |
| No. samples (% for validation) | 174 (-) | 100 (-) | 100 (-) | 195 (-) | 107 (-) | 107 (-) | 124 (-) | 124 (-) | 207 (-) | 169 (-) | 584 (28%) |
| Scan mode (material) | R (PE-bag) | R (PE-bag) | R (PE-bag) | R | R (PE-bag) | R (optic fibre glass) | R | R | R (PE-bag) | R (quartz glass) | R (quartz glass) |
| Range (nm) | 400–2498 | 400–2498 | 400–2498 | 300–1700 | 400–2498 | 400–2300 | 400–2498 | 2500–25,000 (MIR) | 400–2498 or 1100–2498 | 400–1700 | 306–1710 |
| R2 (RMSEP or SEP) of | |||||||||||
| DM (%) | 0.85 (1.58) | 0.90 (0.08) | 0.91 (3.61) | 0.91 (1.24) | 0.95 (1.02) | 0.96 (0.91) | - | - | 0.85 (11.3) *5 | 0.58 (2.52) | 0.91 (1.20) |
| pH | - | - | - | - | - | - | - | - | - | 0.40 (0.18) | - |
| Na (g/kg) | - | - | - | 0.52 (0.49) | - | - | - | - | - | 0.40 (0.29) | - |
| OM/TC (g/kg) | - | - | - | 0.89 (9.73) | TC 0.95 (4.00) | TC 0.94 (4.50) | - | - | - | 0.57 (18.25) | 0.90 (9.29) |
| TN (g/kg) | 0.81 (27.7) *4 | 0.69 (33.6) *4 | 0.67 (2.1) *4 | 0.89 (1.22) | 0.96 (0.30) | 0.94 (0.33) | - | - | 0.89 (3.43) *4 | 0.75 (1.53) | 0.86 (1.23) |
| NH4-N (g/kg) | 0.63 (27.6) *4 | 0.62 (38.1) *4 | 0.95 (0.2) *4 | 0.78 (1.21) | 0.97 (0.13) | 0.93 (0.17) | - | - | 0.78 (1.05) *4 | 0.69 (1.24) | 0.76 (1.13) |
| P (g/kg) | 0.47 (5.1) *4 | 0.61 (4.4) *4 | 0.58 (1.3) *4 | 0.85 (0.90) | - | - | 0.69 (5.31) *4 | 0.82 (3.98) *4 | 0.62 (4.77) *4 | 0.59 (0.54) | 0.75 (1.12) |
| K (g/kg) | 0.79 (20.3) *4 | 0.71 (22.3) *4 | 0.82 (1.7) *4 | 0.84 (0.98) | - | - | 0.66 (3.21) *4 | 0.59 (3.55) *4 | 0.63 (3.23) *4 | 0.73 (0.81) | 0.69 (1.15) |
| Mg (g/kg) | - | - | - | 0.87 (0.41) | - | - | 0.72 (1.31) *4 | 0.69 (1.40) *4 | 0.46 (1.36) *4 | 0.61 (0.35) | 0.80 (0.50) |
| Ca (g/kg) | - | - | - | 0.76 (1.37) | - | - | 0.96 (6.48) *4 | 0.97 (6.42) *4 | 0.80 (8.27) *4 | 0.52 (0.86) | 0.59 (1.49) |
| S (g/kg) | - | - | - | - | - | - | 0.36 (2.58) *4 | 0.54 (2.27) *4 | 0.59 (1.87) *4 | - | 0.36 (0.26) |
| Mn (g/kg) | - | - | - | - | - | - | 0.59 (0.07) *4 | 0.63 (0.06) *4 | 0.57 (0.06) *4 | - | - |
| Fe (g/kg) | - | - | - | - | - | - | - | - | - | - | - |
| Cu (g/kg) | - | - | - | - | - | 0.57 (0.21) *4 | 0.66 (0.13) *4 | 0.52 (0.12) *4 | - | - | |
| Zn (g/kg) | - | - | - | - | - | - | 0.56 (0.10) *4 | 0.12 (0.15) *4 | 0.50 (0.09) *4 | - | - |
| Reference | Saeys et al. 2005b [18] | Saeys et al. 2005b [18] | Saeys et al. 2019 [37] | Sakirkin et al. 2011 [57] | Sørensen et al. 2005 [66] | Sørensen et al. 2007 [19] | Tamburini et al. 2015 [26] | Tauber et al. 2007 [35] | Wenzl et al. 2007 [36] | Williams et al. 2020 [67] |
|---|---|---|---|---|---|---|---|---|---|---|
| Liquid organic manure | hog | hog | pig | solid cattle | pig, cattle | pig, cattle | poultry | digestate | pig, cattle | hog |
| No. samples (% for validation) | 194 (-) | 194 (-) | (a) 264 (17%) (b) 195 (36%) (c) 61 (0%) | 216 (-) | 130 (-) | 342 (25%) | 139 (22%) | 60 (-) | 70 (-) | 304 for validation |
| Scan mode (material) | R (quartz glass) | T (1 mm) (quartz glass) | R (on-line, sapphire-glass) | R (PE-bag) | R (PE-bag) | R (PE-bag) | R (petri dish) | R (nanobag) | R (nanobag) | R (on-line) |
| Range (nm) | 400–2498 | 400–2498 | 950–1650 | 350–2500 | 400–2498 | 400–2498 | 1000–2500 | 400–2498 | - | 900–1700 |
| R2 (RMSEP or SEP) of | ||||||||||
| DM (%) | 0.75 (2.12) | 0.86 (1.55) | (c) 0.76 (11.07) | 0.95 (1.5) | 0.97 (-) | 0.97 (0.61) | 0.95 (2.72) | 0.88 (-) | - | 0.96 (0.24) |
| pH | 0.03 (0.25) | 0.12 (0.26) | - | - | - | - | - | - | - | - |
| EC (mS/cm) | - | - | - | - | - | - | - | - | - | - |
| Na (g/kg) | 0.49 (0.50) | 0.57 (0.46) | - | - | - | 0.41 (0.18) | - | - | - | - |
| OM/TC/ash (g/kg) | 0.73 (15.22) | 0.85 (11.45) | - | ash 0.90 (25.0) | TC 0.93 (-) | TC 0.94 (3.1) | - | - | ash 0.92 (-) | - |
| TN (g/kg) | 0.89 (1.22) | 0.92 (1.05) | (a) 0.75 (0.71) | - | 0.95 (-) | 0.94 (0.43) | 0.82 (2.1) | 0.90 (0.31) | 0.99 (-) | 0.95 (0.09) |
| NH4-N (g/kg) | 0.77 (1.22) | 0.76 (1.24) | - | - | 0.92 (-) | 0.92 (0.37) | - | 0.94 (0.17) | 0.42 (-) | - |
| P (g/kg) | 0.67 (1.37) | 0.81 (1.02) | (a) 0.73 (0.59) | - | - | 0.88 (0.16) | - | 0.69 (-) | 0.68 (-) | 0.90 (0.03) |
| K (g/kg) | 0.84 (0.98) | 0.83 (1.02) | (b) 0.50 (0.49) | - | - | 0.55 (0.64) | - | 0.89 (-) | 0.50 (-) | 0.94 (0.03) |
| Mg (g/kg) | 0.74 (0.57) | 0.83 (0.46) | - | - | - | 0.82 (0.14) | - | 0.86 (-) | 0.35 (-) | - |
| Ca (g/kg) | 0.58 (1.83) | 0.70 (1.55) | - | - | - | 0.73 (0.26) | - | 0.76 (-) | 0.37 (-) | - |
| S (g/kg) | 0.542 (0.23) | - | - | - | - | 0.82 (0.10) | - | - | - | - |
| Mn (g/kg) | - | - | - | - | - | - | - | - | - | - |
| Fe (g/kg) | - | - | - | - | - | - | - | - | - | - |
| Cu (g/kg) | - | - | - | - | - | 0.81 (0.005) | - | - | - | - |
| Zn (g/kg) | - | - | - | - | - | 0.50 (0.02) | - | - | - | - |
| Reference | Xing et al. 2008 [68] | Yang et al. 2006 [32] | Ye et al. 2005 [20] | Ye et al. 2005 [20] | Ye et al. 2005 [20] | Ye et al. 2005 [20] | Ye et al. 2005 [20] | Ye et al. 2005 [20] | Zimmermann et al. 2008 [69] | Zimmermann and Hartung 2009 [70] |
|---|---|---|---|---|---|---|---|---|---|---|
| Liquid organic manure | layer poultry | fattening pig | layer poultry | poultry, broiler litter | beef cattle | swine solid hoop | swine liquid lagoon | swine slurry | not specified | DM: cattle, K: mix, other: pig |
| No. samples (% for validation) | 91 (-) | 108 (33%) | 111 (-) | 95 (-) | 72 (-) | 39 (-) | 88 (-) | 85 (-) | 28 (-) | for DM: 61 (-), for K: 149 (-), for others: 49 (-) |
| Scan mode (material) | R (quartz-cup) | R (PE-bag) | R (PE-bag) | R (PE-bag) | R (PE-bag) | R (PE-bag) | R (PE-bag) | R (PE-bag) | R (on-line, sapphire-glass) | R (on-line, (sapphire-glass) |
| Range (nm) | 1000–2500 | 833–2500 | 1100–2498 | 1100–2498 | 1100–2498 | 1100–2498 | 1100–2498 | 1100–2498 | 850–1650 | 850–1650 |
| R2 (RMSEP or SEP) of | ||||||||||
| DM (%) | 0.86 (1.95) | 0.79 *6 (1.75) | 0.97 (2.28) | 0.91 (1.45) | 0.90 (2.98) | 0.91 (2.39) | 0.92 (0.07) | 0.92 (0.68) | 0.98 (0.27) | 0.95 (0.54) |
| pH | 0.55 (0.15) | 0.50 *6 (0.25) | - | - | - | - | - | - | - | - |
| EC (mS/cm) | - | - | - | - | - | - | - | - | - | - |
| Na (g/kg) | 0.62 (0.19) | - | 0.71 (0.56) | 0.63 (0.5) | 0.90 (0.3) | 0.80 (0.3) | 0.80 (0.3) | 0.88 (0.03) | - | - |
| OM (g/kg) | 0.89 (6.17) | 0.81 *6 (14.2) | - | - | - | - | - | - | - | - |
| TN (g/kg) | 0.88 (1.13) | 0.56 *6 (1.44) | 0.92 (2.3) | 0.80 (1.3) | 0.88 (1.1) | 0.87 (0.7) | 0.83 (1.2) | 0.91 (0.21) | 0.96 (0.25) | 0.96 (0.29) |
| NH4-N (g/kg) | 0.88 (0.86) | 0.84 *6 (0.40) | 0.91 (0.26) | 0.89 (0.31) | 0.89 (0.2) | 0.92 (0.4) | 0.88 (1.0) | 0.91 (0.14) | 0.98 (0.11) | 0.94 (0.22) |
| P (g/kg) | 0.80 (0.56) | 0.47 *6 (0.59) | 0.76 (2.4) | 0.50 (1.3) | 0.91 (0.7) | 0.74 (1.3) | 0.91 (0.2) | 0.90 (0.32) | 0.98 (0.03) | 0.86 (0.32) |
| K (g/kg) | 0.58 (0.85) | 0.84 *6 (0.59) | 0.71 (2.4) | 0.68 (1.2) | 0.87 (1.4) | 0.90 (0.9) | 0.73 (2.5) | 0.87 (0.2) | 0.90 (0.04) | 0.86 (0.21) |
| Mg (g/kg) | 0.60 (0.67) | 0.35 *6 (0.38) | - | - | - | - | - | - | - | - |
| Ca (g/kg) | - | - | 0.75 (13.2) | 0.54 (2.1) | 0.72 (6.6) | 0.94 (2.1) | 0.90 (0.2) | 0.86 (0.73) | - | - |
| S (g/kg) | - | - | 0.70 (0.58) | 0.66 (0.4) | 0.78 (0.4) | 0.70 (0.56) | 0.83 (0.1) | 0.70 (0.04) | - | - |
| Mn (g/kg) | - | - | - | - | - | - | - | - | - | - |
| Fe (g/kg) | - | - | - | - | - | - | - | - | - | - |
| Cu (g/kg) | 0.48 (0.003) | 0.70 *6 (0.06) | 0.71 (0.01) | 0.62 (0.07) | 0.71 (0.01) | 0.82 (0.004) | - | 0.87 (0.05) | - | - |
| Zn (g/kg) | 0.86 (1.95) | 0.69 *6 (0.03) | 0.81 (0.06) | 0.78 (0.03) | 0.66 (0.04) | 0.81 (0.03) | 0.79 (0.001) | 0.83 (0.01) | - | - |
| Parameter | Number of Publications | Range of R2 | Range of RMSEP (SEP) | Reference of Best R2 (Best RMSEP or Best SEP) | |
|---|---|---|---|---|---|
| DM (%) | 40 | 0.58–0.99 | 0.20–11.39 (0.07–3.61) | Zimmermann et al. 2008 [69] (Ye et al. 2005 [20]) | |
| pH | 11 | 0.03–0.96 | 0.09–0.26 (0.07–0.29) | Malley et al. 2001a [28] (Malley et al. 2001a [28]) | |
| EC (mS/cm) | 4 | 0.11–0.94 | 1.41–2.55 (0.77–1.17) | Malley et al. 2001a [28] (Malley et al. 2002 [14]) | |
| Na (g/kg) | 16 | 0.40–0.95 | 0.04–0.50 (0.03–0.56) | Malley et al. 2002 [14] (Malley et al. 2002 [14]) | |
| C (g/kg) | OM | 8 | 0.57–0.93 | 6.17–23.8 (n.a.) | Du et al. 2010 [27] (Xing et al. 2008 [68]) |
| TC | 8 | 0.91–0.97 | 3.1–14.5 (2.90–23.4) | Asai et al. 1993 [61] (Althaus et al. 2013 [13]) | |
| Susp. C | 2 | 0.98–0.99 | n.a. (0.7–1.56) | Malley et al. 2002 [14] (Malley et al. 2002 [14]) | |
| ash | 5 | 0.81–0.99 | 3.3–22.4 (0.10–25.0) | Asai et al. 1993 [61] (Becaccia et al. 2015 [62]) | |
| N (g/kg) | TN | 45 | 0.48–0.98 | 0.16–8.94 (0.09–2.3) | Wenzl et al. 2007 [36] (Williams et al. 2020 [67]) |
| NH4-N | 39 | 0.42–0.99 | 0.08–3.87 (0.07–1.0) | Zimmermann et al. 2008 [69] (Malley et al. 2002 [14]) | |
| TDN | 2 | 0.94–0.95 | n.a. (0.14–0.20) | Malley et al. 2001a [28] (Malley et al. 2002 [14]) | |
| P (g/kg) | TP | 38 | 0.47–0.99 | 0.025–1.37 (0.03–2.4) | Zimmermann et al. 2008 [69] (Zimmermann et al. 2008 [69]) |
| TDP | 1 | 0.99 | n.a. (0.055) | Malley et al. 2002 [14] (Malley et al. 2002 [14]) | |
| K (g/kg) | 35 | 0.19–0.95 | 0.04–1.4 (0.03–2.9) | Williams et al. 2020 [67] (Williams et al. 2020 [67]) | |
| Mg (g/kg) | 17 | 0.35–0.98 | 0.14–0.67 (0.03–0.27) | Malley et al. 2002 [14] (Malley et al. 2002 [14]) | |
| Ca (g/kg) | 22 | 0.37–0.97 | 0.26–6.6 (0.025–13.2) | Malley et al. 2001a [28] (Malley et al. 2002 [14]) | |
| S (g/kg) | 17 | 0.36–0.95 | 0.02–0.56 (0.01–0.58) | Malley et al. 2001a [28] (Malley et al. 2001a [28]) | |
| Mn (g/kg) | 6 | 0.57–0.96 | 0.009–0.07 (0.005–0.01) | Malley et al. 2001a [28] (Malley et al. 2001c [30]) | |
| Fe (g/kg) | 4 | 0.77–0.97 | 0.02–0.06 (0.025–0.6) | Malley et al. 2001c [30] (Malley et al. 2001c [30]) | |
| Cu (g/kg) | 15 | 0.48–0.99 | 0.003–0.055 (0.005–0.07) | Malley et al. 2001a [28] (Xing et al. 2008 [68]) | |
| Zn (g/kg) | 16 | 0.12–0.98 | 0.001–0.05 (0.001–0.06) | Malley et al. 2001a [28] (Malley et al. 2001c [30]) | |
| Sensor and Company | No. of DLG Certificate | Liquid Organic Manure | Parameter/DLG—Results | ||||
|---|---|---|---|---|---|---|---|
| DM | TN | NH4-N | P2O5 | K2O | |||
| «HarvestLab 3000» John Deere GmbH, global | 6811 + 6814 | cattle | + | ++ | ++ | 0 | + |
| 6886 | pig | + | 0 | − | 0 | − | |
| 6809 + 6887 | digestate | 0 | + | 0 | − | 0 | |
| «EVO NIR online Analyser» Dinamica Generale S.P.A., Italy | 7139 | cattle | 0 | + | - | 0 | - |
| 7057 | pig | − | 0 | − | − | − | |
| «NIR speedspy on board» m-u-t GmbH, Germany | 6796 + 7122 | cattle | + | 0 | + | 0 | ++ |
| 6796 + 7122 | pig | ++ | 0 | 0 | 0 | 0 | |
| 6796 + 7122 | digestate | + | + | + | 0 | 0 | |
| 7122 | mix of pig and cattle | 0 | ++ | − | 0 | + | |
| The m-u-t sensor is also used in devices of Kaweco, Kotte, Topcon, Veenhuis, Zunhammer, and more: | |||||||
| «Kaweco NIR Sensor» Kamps de Wild B.V., the Netherlands | 6867 | same as m-u-t | same as m-u-t | ||||
| «NutrientContent Lab (NCL) 2.0» Kotte Landtechnik GmbH, Gemany | 7087 | same as m-u-t | same as m-u-t | ||||
| «LMS 20-NIR Sensor» Topcon Agriculture, Spain | 7141 | same as m-u-t | same as m-u-t | ||||
| «Nutriflow 3.0» Veenhuis Maschines BV, the Netherlands | 6981 | same as m-u-t | same as m-u-t | ||||
| «Van-Control 2.0» Zunhammer GmbH, Germany | 6801 | same as m-u-t | same as m-u-t | ||||
Publisher’s Note: MDPI stays neutral with regard to jurisdictional claims in published maps and institutional affiliations. |
© 2022 by the authors. Licensee MDPI, Basel, Switzerland. This article is an open access article distributed under the terms and conditions of the Creative Commons Attribution (CC BY) license (https://creativecommons.org/licenses/by/4.0/).
Share and Cite
Horf, M.; Vogel, S.; Drücker, H.; Gebbers, R.; Olfs, H.-W. Optical Spectrometry to Determine Nutrient Concentrations and other Physicochemical Parameters in Liquid Organic Manures: A Review. Agronomy 2022, 12, 514. https://doi.org/10.3390/agronomy12020514
Horf M, Vogel S, Drücker H, Gebbers R, Olfs H-W. Optical Spectrometry to Determine Nutrient Concentrations and other Physicochemical Parameters in Liquid Organic Manures: A Review. Agronomy. 2022; 12(2):514. https://doi.org/10.3390/agronomy12020514
Chicago/Turabian StyleHorf, Michael, Sebastian Vogel, Harm Drücker, Robin Gebbers, and Hans-Werner Olfs. 2022. "Optical Spectrometry to Determine Nutrient Concentrations and other Physicochemical Parameters in Liquid Organic Manures: A Review" Agronomy 12, no. 2: 514. https://doi.org/10.3390/agronomy12020514
APA StyleHorf, M., Vogel, S., Drücker, H., Gebbers, R., & Olfs, H.-W. (2022). Optical Spectrometry to Determine Nutrient Concentrations and other Physicochemical Parameters in Liquid Organic Manures: A Review. Agronomy, 12(2), 514. https://doi.org/10.3390/agronomy12020514