Article

Assessment of the Short-Term Impact of Anaerobic Digestate on Soil C Stock and CO2 Emissions in Shallow Water Table Conditions

1
Department of Agronomy, Food, Natural Resources, Animals and Environment, University of Padova, Viale dell’Università 16, 35020 Legnaro, Italy
2
Department of Agricultural and Food Sciences, University of Bologna, Viale G. Fanin 40, 40127 Bologna, Italy
3
Department of Agricultural Food Environmental and Animal Sciences, University of Udine, Via delle Scienze 206, 33100 Udine, Italy
4
Regione del Veneto, U.O. Agroambiente, Via Torino 110, 30172 Mestre, Italy
5
Unità Organizzativa Qualità del Suolo, Agenzia Regionale per la Protezione Ambientale del Veneto (ARPAV), 31100 Treviso, Italy
*
Author to whom correspondence should be addressed.
Agronomy 2022, 12(2), 504; https://doi.org/10.3390/agronomy12020504
Submission received: 14 January 2022 / Revised: 12 February 2022 / Accepted: 15 February 2022 / Published: 17 February 2022
(This article belongs to the Special Issue Management of Soil Organic Carbon for Soil Health in Agroecosystems)

Abstract

:
Anaerobic digestion has been recently proposed as a more sustainable energy supply chain able to strengthen the existing security of supply provisions. Anaerobic digestate (AD) is the by-product of the anaerobic digestion process and presents organic fertilizer characteristics, but its agronomic usage has been hindered by both agronomic and environmental concerns. In this study, the impact of agricultural liquid (LD) and solid (SD) AD and beef manure (Man) was evaluated on some agro-environmental characteristics. First, the AD fractions functional groups were characterized by FT-IR, and then LD and SD performances were evaluated on soil organic carbon (SOC) stock and carbon dioxide (CO2) emissions and compared to beef manure (Man). The fertilizer impact was also considered with the presence or absence of a shallow water table. Results showed that SD increased of ca. 3 t ha−1 the SOC stock in the 0–20 cm soil profile with respect to LD, while it was comparable to Man despite the lower C input (6.7 vs. 8.7 t C ha−1), due to the presence of more stable compounds (e.g., lignin). The CO2 fluxes were affected by both fertilizer type and water table level. In the absence of a water table, the CO2 emissions (5.5 g CO2 m2 d−1) were driven by carbon content and quality in the fertilizer, while the presence of a shallower water table hindered mineralization of stable SOC and, in turn, reduced emissions (4.4 g CO2 m2 d−1). AD can be considered a beneficial solution to both maintain soil fertility and, at the same time, give new insight into a circular economy model, although further investigation on GHG emissions is required.

1. Introduction

Biomethane production has been recently proclaimed by the European Commission as a renewable and low-carbon gas able to strengthen the resilience of the gas system [1]. According to the 2018/844/EC [2], biogas and biomethane will account for 32% of the renewable energy share of EU energy consumption after 2020. Biomethane is produced in anaerobic digestion plants (i.e., biogas plants) where the anaerobic digestion process takes place, producing biogas and anaerobic digestate as a byproduct. It has been estimated that approximately 180 million tons of anaerobic digestate are produced annually in the EU [3]. For these reasons, the treatment of digestate is receiving increasing attention to cope with environmental standards and, possibly, fulfill the goal of Agenda 2030 for sustainable development [4]. A critical question, however, is how to identify sustainable management strategies to properly utilize digestate. In this context, conventional anaerobic digestate management has been addressed to agriculture as an inexpensive way to close nutrient cycles by being applied to agricultural land as an organic fertilizer [5,6,7,8].
Long-term digestate application showed an effect on soil organic carbon (SOC) content comparable to that of manure or slurry fertilization [9]. In a study using RothC simulation [10], it was shown that digestate was more effective than untreated sewage. This outcome supported the work of Marcato et al. [11], who reported a stabilization of organic matter by anaerobic digestion through the degradation of more labile fractions. Indeed, digestate is particularly recalcitrant due to high lignin content that is not degraded during anaerobic digestion, while other compounds, such as cellulose, hemicellulose, and raw protein, are partially degraded [12]. In addition, the recalcitrance of digestate is also due to greatly reduced environment (−300 mV) that also promotes an increase in the C oxidation state of the remaining organic carbon [13,14]. Gómez et al. [14] found that the initial degradation of promptly oxidized components was followed by a subsequent transformation into complex compounds associated with aliphatics, aromatics, and phenols, which are also recognized as recalcitrant organic compounds [15]. Thus, anaerobic digestate has shown great potential to increase soil C sequestration [10,16], although additional sources of organic C provided by the incorporation of crop residues into the soil were needed [17]. Bèghin-Tanneau et al. [18] found that adding digested maize silage to the soil increased C sequestration by 67% compared to raw undigested silage. The authors explained that the addition of digestate led to a negative priming effect and, consequently, to inhibition of microorganism or enzyme activities on SOC mineralization.
Given the potential benefits of anaerobic digestate on SOC stock, it is of paramount importance to also evaluate its potential impact on greenhouse gas (GHG) emissions. Askri et al. [19] observed a rapid increase in the CO2 emission rate of soils receiving digestate versus the control during the first two weeks of their experiment. This was caused by an increase in microbial activity associated with the mineralization of easily degradable carbon in the applied digestate [20]. They found that the early mineralization of C correlated positively with the proportion of C present in the water-soluble fraction. In contrast, it was negatively correlated with the proportion of C contained in the lignin and cellulose-type fractions. Therefore, CO2 release was dependent on the chemical structure of the anaerobic digestate. Environmental soil conditions (e.g., temperature and soil water content) are additional drivers of microbial activities. In a study assessing the potential greenhouse gas flux rates from soils under different land uses and climates in Europe, Schaufler et al. [21] proved that soil moisture had a significant influence on CO2 emissions, even if to a lesser extent than temperature. Higher CO2 emissions were observed in water-filled pore spaces between 20% and 60% in croplands and 40–60% in wetlands [21]. Crézé and Madramootoo [22] confirmed the influence of water management on microbial activity, with CO2 fluxes higher in shallow groundwater than in free drainage conditions. At the same time, the authors could not find a significant relationship between seasonal water-filled pore spaces and CO2 flux, which, in contrast, was dominated by temperature and fertilization practices. The same inconsistency was found by Ruser et al. [23] in a laboratory experiment on soil cores taken from a potato plot.
The low plain of the Veneto Region (NE Italy) is a large area characterized by shallow groundwater. According to the Nitrate Directive, a large portion of the territory is classified as a vulnerable zone. Indeed, the fragile environment is threatened by intensive livestock activities and digestate plants, whose numbers have increased in the last years, boosted by government subsidies. Although the Nitrate Directive regulates the agricultural use of anaerobic digestate, further research is needed for developing strategies and ensuring sustainable management of the digestate. That requirement mainly stems from incomplete data on environmental benefits or hazards related to groundwater influence on soil carbon dynamics and CO2 emissions.
Some studies have been conducted in the area to test the effects of manure fertilization on nitrogen leaching [24] and N2O emissions [25]. However, to the best of our knowledge, a gap exists in the evaluation of the short-term effects of anaerobic digestate fertilization on SOC stock and soil CO2 emission in relation to groundwater depth. For these reasons, this study aimed to assess the impact of solid (SD) and liquid digestate (LD) fractions on SOC stock and CO2 emissions as a function of their functional groups as derived by FT-IR spectroscopy. A lysimeter study was conducted involving different water table levels and beef manure (Man) as a standard organic fertilizer. Our starting hypotheses were that (i) SD would show a similar impact on SOC and CO2 fluxes due to its similar functional group to Man, and (ii) LD would exhibit lower potentialities than SD on SOC sequestration but also have less impact on soil C emissions due to lower C input.

2. Materials and Methods

2.1. Experimental Design

The experiment was conducted at the Experimental Farm of the University of Padova in northeastern Italy (45°19′ N, 11°31′ E, 8 m a.s.l.) from April 2015 to September 2015. The local climate is sub-humid, with yearly average temperature and rainfall of 12 °C and 800–850 mm, respectively. Annual rainfall is mostly concentrated during the autumn and spring months. Reference evapotranspiration (ETo) is 800 mm with a peak in July (4.5 mm d−1). The study site was originally set up in 1984 and consists of twenty drainable lysimeters, each with dimensions of 1 m × 1 m × 1.5 m (length × width × depth). The bottom of the lysimeter creates a funnel that is connected via an underground drainpipe (slope of 1‰) to an external tube and a valve regulating both the water table level and the leaching discharge. Each lysimeter was filled in 1984 with soil excavated from the adjacent experimental farm, preserving the original soil horizons. To facilitate drainage of water and prevent soil washout, a 15 cm thick layer of gravel (30–50 mm diameter) covers the bottom of each lysimeter. The soil is a fluvi-calcaric cambisol (CMcf), representing ca. 50% of the low Venetian plain. Over 30 years of operation, the soil has been managed with ordinary fertilization techniques (i.e., farmyard manure or slurry integrated with mineral fertilizer) and cropped with maize (Zea mays L.), wheat (Triticum aestivum L.), and sunflower (Helianthus annuus L.). Treatments consisted of a combination of three groundwater conditions—a free drainage (FD) and two shallow water table levels set at −120 cm (WT120) and −60 cm (WT60)—combined with three organic fertilization types (beef manure, Man; liquid digestate, LD; and solid digestate, SD), for a total of nine treatments.
Water input was regulated throughout the experiment by a plastic roof that automatically closed to cover the lysimeter site during rain events. The cover not only prevented natural uncontrolled rainfall into the lysimeters, but also protected the crop from extreme weather, such as hailstorms. A total water input of 415 mm was provided to the system by a series of irrigation events during the spring–summer growing season.
Water table conditions were set according to the communicating vessels principle. Each lysimeter, at the bottom, was directly connected to an external column of the same height as the lysimeter (150 cm) and a diameter large enough to avoid the capillary effect. The column was equipped with a water level sensor, allowing the water level to deviate ±10 cm from the set reference level.
The experiment followed a randomized block design with two replicates. Therefore, 18 lysimeters out of the 20 available were used. CS635 TDR (Time Domain Reflectometry) probes (Campbell Scientific Inc., Lincoln, NE, USA) were installed in the lysimeters at depths of 15, 30, and 60 cm. The TDR probes, which were calibrated in our laboratory, had an accuracy of ±1.5%. The water-filled pore space (WFPS, %) was calculated as the ratio of water content to total porosity. A thermocouple system monitored soil temperature at depths of 0–15 cm and 15–30 cm. Soil volumetric water content and temperature were obtained at the same time as CO2 measurements.
Tillage, fertilization, and seeding operations were conducted on the same day. Tillage was manually performed on each lysimeter by means of spring spading at 20 cm deep (mid-April) simulating a harrowing and was followed by fertilization and maize (Zea mays L.) sowing at a density of 8 plants m−2. The digestate used in this experiment was collected from a biogas plant fed with beef manure and silage maize. The total Kjeldahl nitrogen (TKN) content ranged between 2.1 and 9.6 g kg−1 (Table 1). All the tested organic fertilizers were applied according to the Nitrate Directive at a 300 kg N ha−1 rate and were subsequently followed by 20 cm soil tillage. The resulting C input from fertilizers was 8.7, 1.7, and 6.7 t C ha−1 for Man, LD, and SD, respectively.

2.2. Emission of CO2 from Soil

To monitor the emission of carbon dioxide (CO2) from the soil, an automated closed-chamber dynamic system was installed [26], with one chamber per lysimeter (12 total). Each chamber was constructed with a steel cylindrical base (20 cm ID, 8 cm H), a motorized steel lid with a neoprene cover over its inner surface, and a rubber O-ring to guarantee a tight seal. A vent reduced wind-induced pressure differences between the chamber headspace air and the surrounding atmosphere during chamber closure [26,27,28,29]. A steel collar (20 cm ID, 10 cm H) was installed in the soil at a 7 cm depth in the center row of each lysimeter between two maize plants, carefully oriented to prevent shadowing that could affect soil temperature change. The chamber was inserted into the collar to prevent lateral gas diffusion. The chamber isolated the area of soil on which it is located, and gas exchange occurred vertically between the area of soil and the chamber interior. Chambers were only removed from the site during tillage operations. Analysis of CO2 gas emissions was performed using an infrared gas analyzer (IRGA). Each chamber underwent six measurements per day, one measurement every four hours (i.e., 0:00, 4:00, 8:00, 12:00, 16:00, and 20:00), during the entire experimental period. Each measurement deployed 70–90 s after the closure of the lid and consisted of measuring CO2 air concentration increase every 1 or 1.6 s. A CR-1000X Datalogger (Campbell Scientific, Inc., USA) controlled all monitoring operations (chamber closure, activation and heating of the IRGA analyzer, air circulation pumps, and aperture or closure of chamber valves). The CO2 fluxes across the soil atmosphere were calculated from the linear or non-linear time-dependent increase in headspace CO2 concentration [28,29,30,31]. Due to the limited number of closed chambers, emissions were monitored in two contrasting treatments, SD and Man, which were factorially combined with three WT levels and replicated twice (12 chambers in total).

2.3. Soil Samplings and Laboratory Analysis

Composite soil samples were collected from 0–5, 5–10, and 10–20 cm soil layers the day before (t0) and 180 days after (t1) fertilization. The soil was air-dried, 2 mm sieved, and analyzed for soil organic carbon (SOC) with a vario MACRO elemental analyzer (Elementar Analysensysteme GmbH, Langenselbold, Germany) after an acid pre-treatment for inorganic C removal. Soil bulk density was measured in the 0–5, 5–10, and 10–20 cm layers with the core method [32] and used to calculate the SOC stock.
To perform FT-IR characterization of SOC, bulk soil samples were taken from the soil profile at 0–20 cm. Replicates from each sampling were mixed to obtain a pooled sample. SOC extraction was performed on air-dried soil with 0.1 M NaOH, as previously described by Nardi et al. [33]. In this study, the SOC extracted from −60 cm WT lysimeters was not listed due to the similarity of the FT-IR spectra to those at −120 cm WT. SOC samples were named as follows: SOC free drainage (SOC FD) and SOC −120 cm WT (SOC WT120). The compositions of the applied Man, LD, and SD were also analyzed after being freeze-dried before extraction with 0.1 M NaOH. The extracted organic C was processed with the same method as described for soil. All extracts were lyophilized before analysis.
The FT-IR spectra were measured using an ALPHA FTIR spectrometer (Bruker Optics, Ettlingen, Germany) equipped with an attenuated total reflectance (ATR) sampling device containing a diamond crystal. The spectra were recorded from 4000 cm−1 to 400 cm−1 at a spectral resolution of 4 cm−1 with 64 scans co-added and averaged. A background spectrum of air was carried out before each series of measurements. Spectra were processed with Grams/386 spectroscopy software (version 6.00, Galactic Industries Corporation, Salem, NH, USA). The overlapping bands from 1800 to 1200 cm−1 were resolved using a peak fitting analysis. The best fitting parameters were resolved with a Gaussian function determined by minimization of the reduced chi-square (χ2). Good agreement was obtained between the experimental and calculated profiles, with the coefficients of determination, R-squared, ranging from 0.998 to 0.988 and the standard error from 0.002 to 0.005. All data are expressed as area percentages.

2.4. Statistical Analysis

The SOC data was analyzed with three-way ANOVA, considering water table level, fertilizer type, time, and their interactions. A two-way ANOVA, considering water table level and fertilizer type was then applied for CO2 flux analysis. Post hoc pairwise comparison of the least-squares means was performed with the Tukey method to adjust for multiple comparisons at the significance level of p ≤ 0.05. The CO2 fluxes did not follow a normal distribution and were log-transformed before the ANOVA. Statistical analysis was performed using SAS (SAS Institute Inc., Cary, NC, USA) version 5.1.

3. Results

3.1. Soil Water-Filled Pore Space (WFPS) and Temperature

The WFPS values varied over time according to crop evapotranspiration, amount of irrigation, and water table level (Figure 1). The WFPS of FD showed greater variations following the cropping season than WT60 and WT120 (Figure 1). Irrespective of water table level, WFPS values followed the irrigation events in the shallower soil layer (i.e., 0–15 cm), while following seasonal variation at deeper layers (i.e., >15 cm) (Figure 1). On average, the WFPS was observed at 31.1, 38.6, and 57.1% (0–15 cm layer) and 52.0, 71.0, and 77.2% (15–30 cm layer) for FD, WT120, and WT60, respectively. In the deeper (60–90 cm) layer, WFPS showed quasi-saturation levels in WT120 (89.6%) and WT60 (87.7%), while FD produced values of about 60%.
Soil temperatures in the first layer (0–15 cm) changed by month from 17.2 °C in April to 26.5 °C in July, on average (Figure 1). Shallow water table conditions (WT60) induced an average temperature decrease (1 °C, corresponding to ca. 4%) with respect to FD. A similar pattern was also observed in the 15–30 cm soil layer, where the average temperature ranged between 16.8 °C and 26.0 °C, and WT60 reduced soil temperature by 0.8 °C on average (−4%).

3.2. Soil Organic Carbon

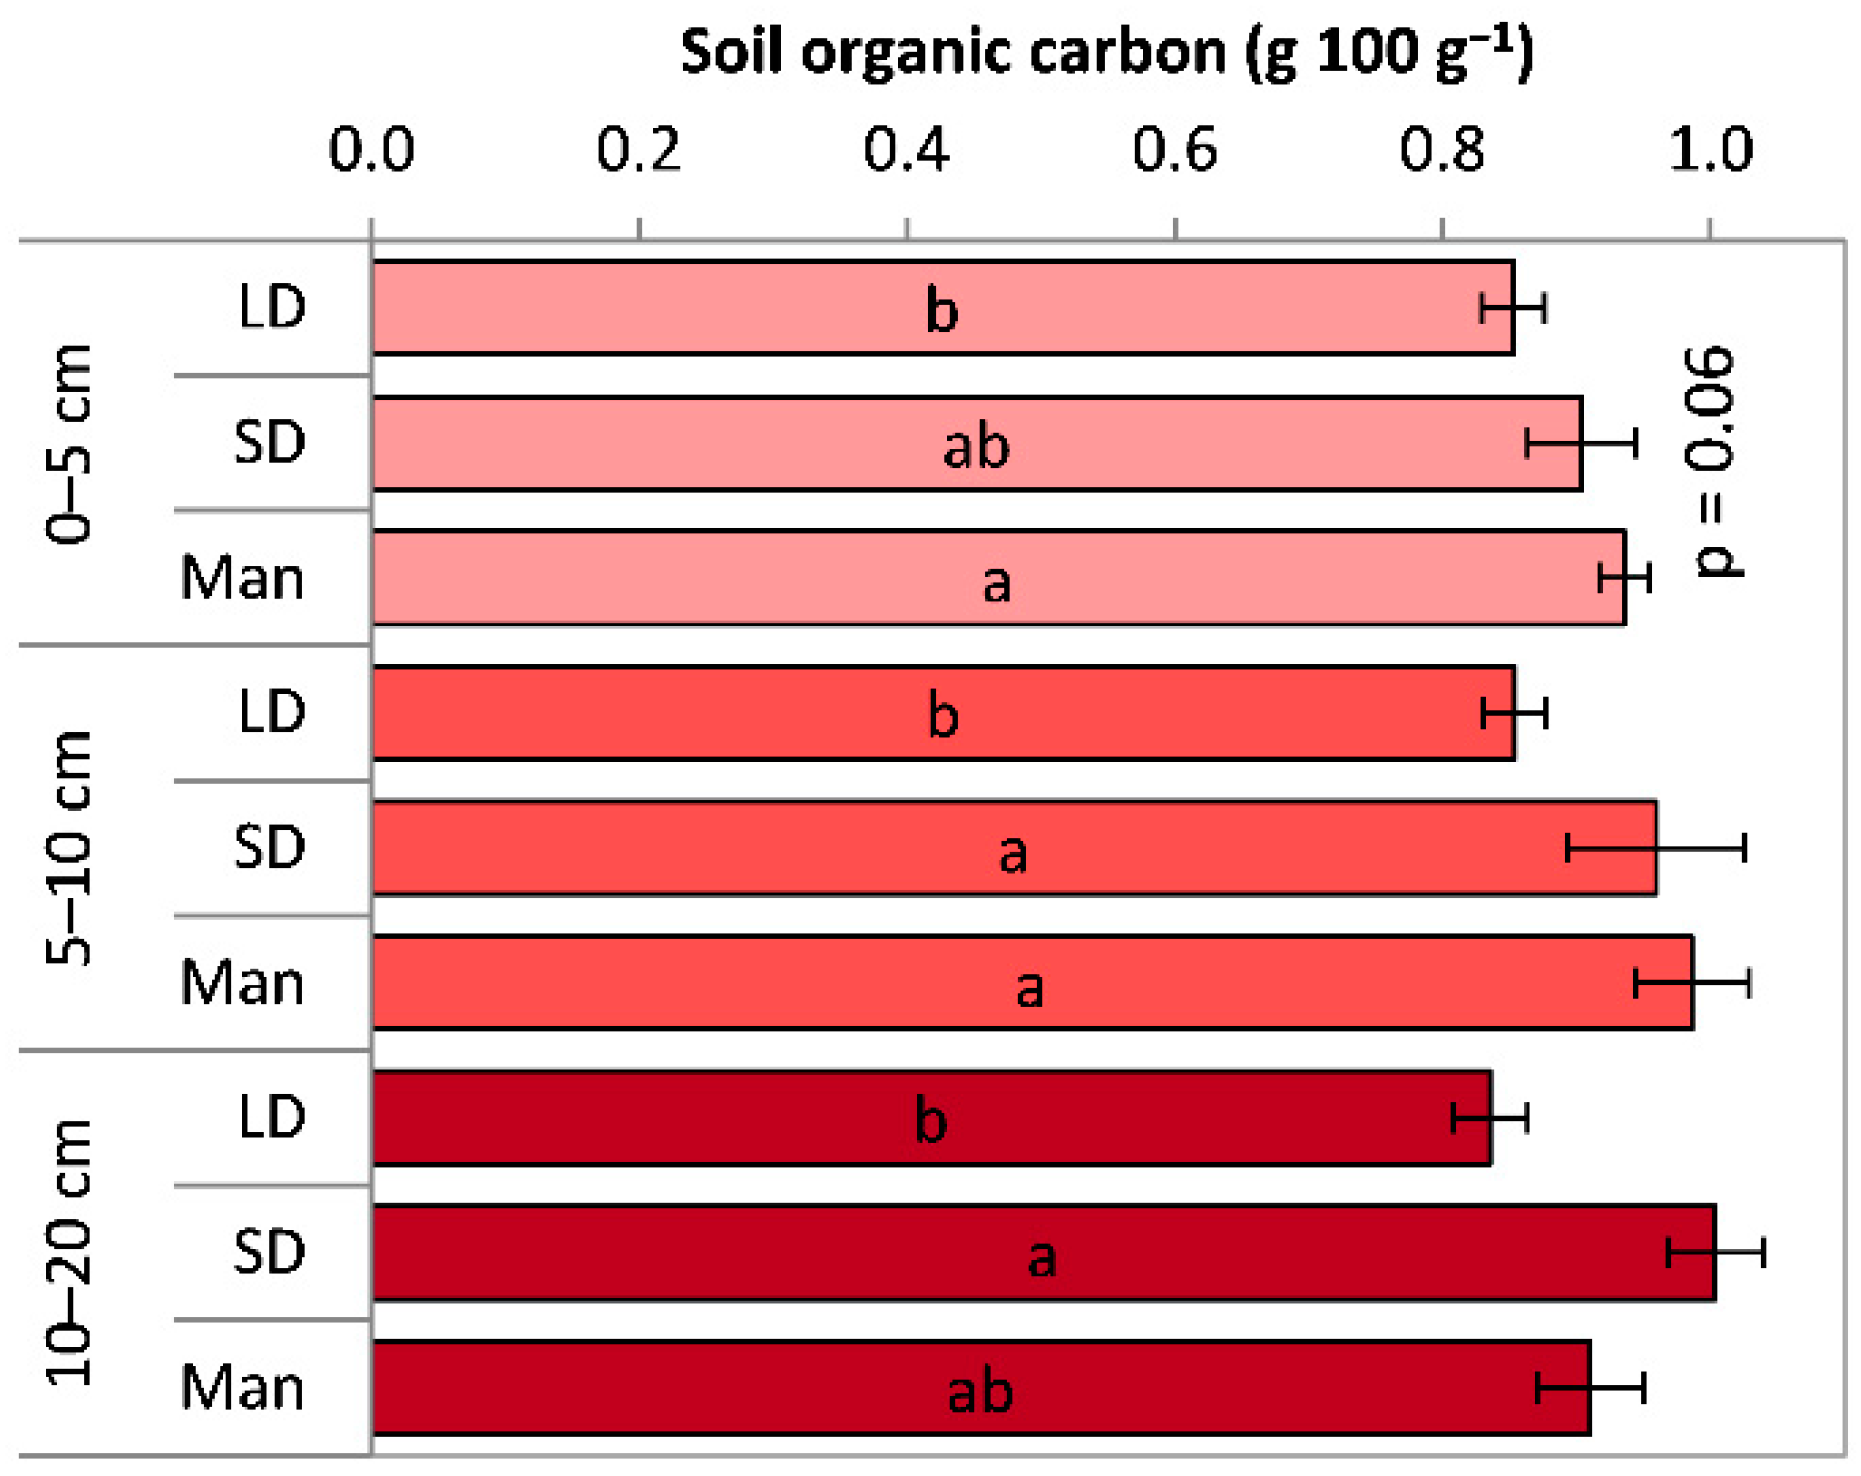
3.2.1. Soil Organic Carbon (SOC) Content

The SOC content ranged from 0.68 to 1.55 g 100 g−1, with average values of 0.89 g 100 g−1 at 0–5 cm, 0.90 g 100 g−1 at 5–10 cm, and 0.92 g 100 g−1 at 10–20 cm soil layers (Figure 2). In the top layer, the fertilizer affected the SOC content with a p = 0.06 (Table A1), which demonstrated greater SOC in Man (0.94 g 100 g−1) (Figure 2). The SOC content was affected by fertilizer type at the 5–10 and 10–20 cm layers with higher values in SD and Man (0.97 g 100 g−1, on average) than in LD (1.00 g 100 g−1) (Figure 2). The SOC content significantly decreased from t0 to t1 by 0.06, 0.11, and 0.17 g 100 g−1 in the 0–5, 5–10, and 10–20 cm layers, respectively. Overall, considering the 0–20 cm profile, SD and Man showed greater SOC contents than LD (0.95 vs. 0.84 g 100 g−1) with the same decreasing trend observed for the single soil layers from t0 (0.99 g 100 g−1) to t1 (0.84 g 100 g−1).

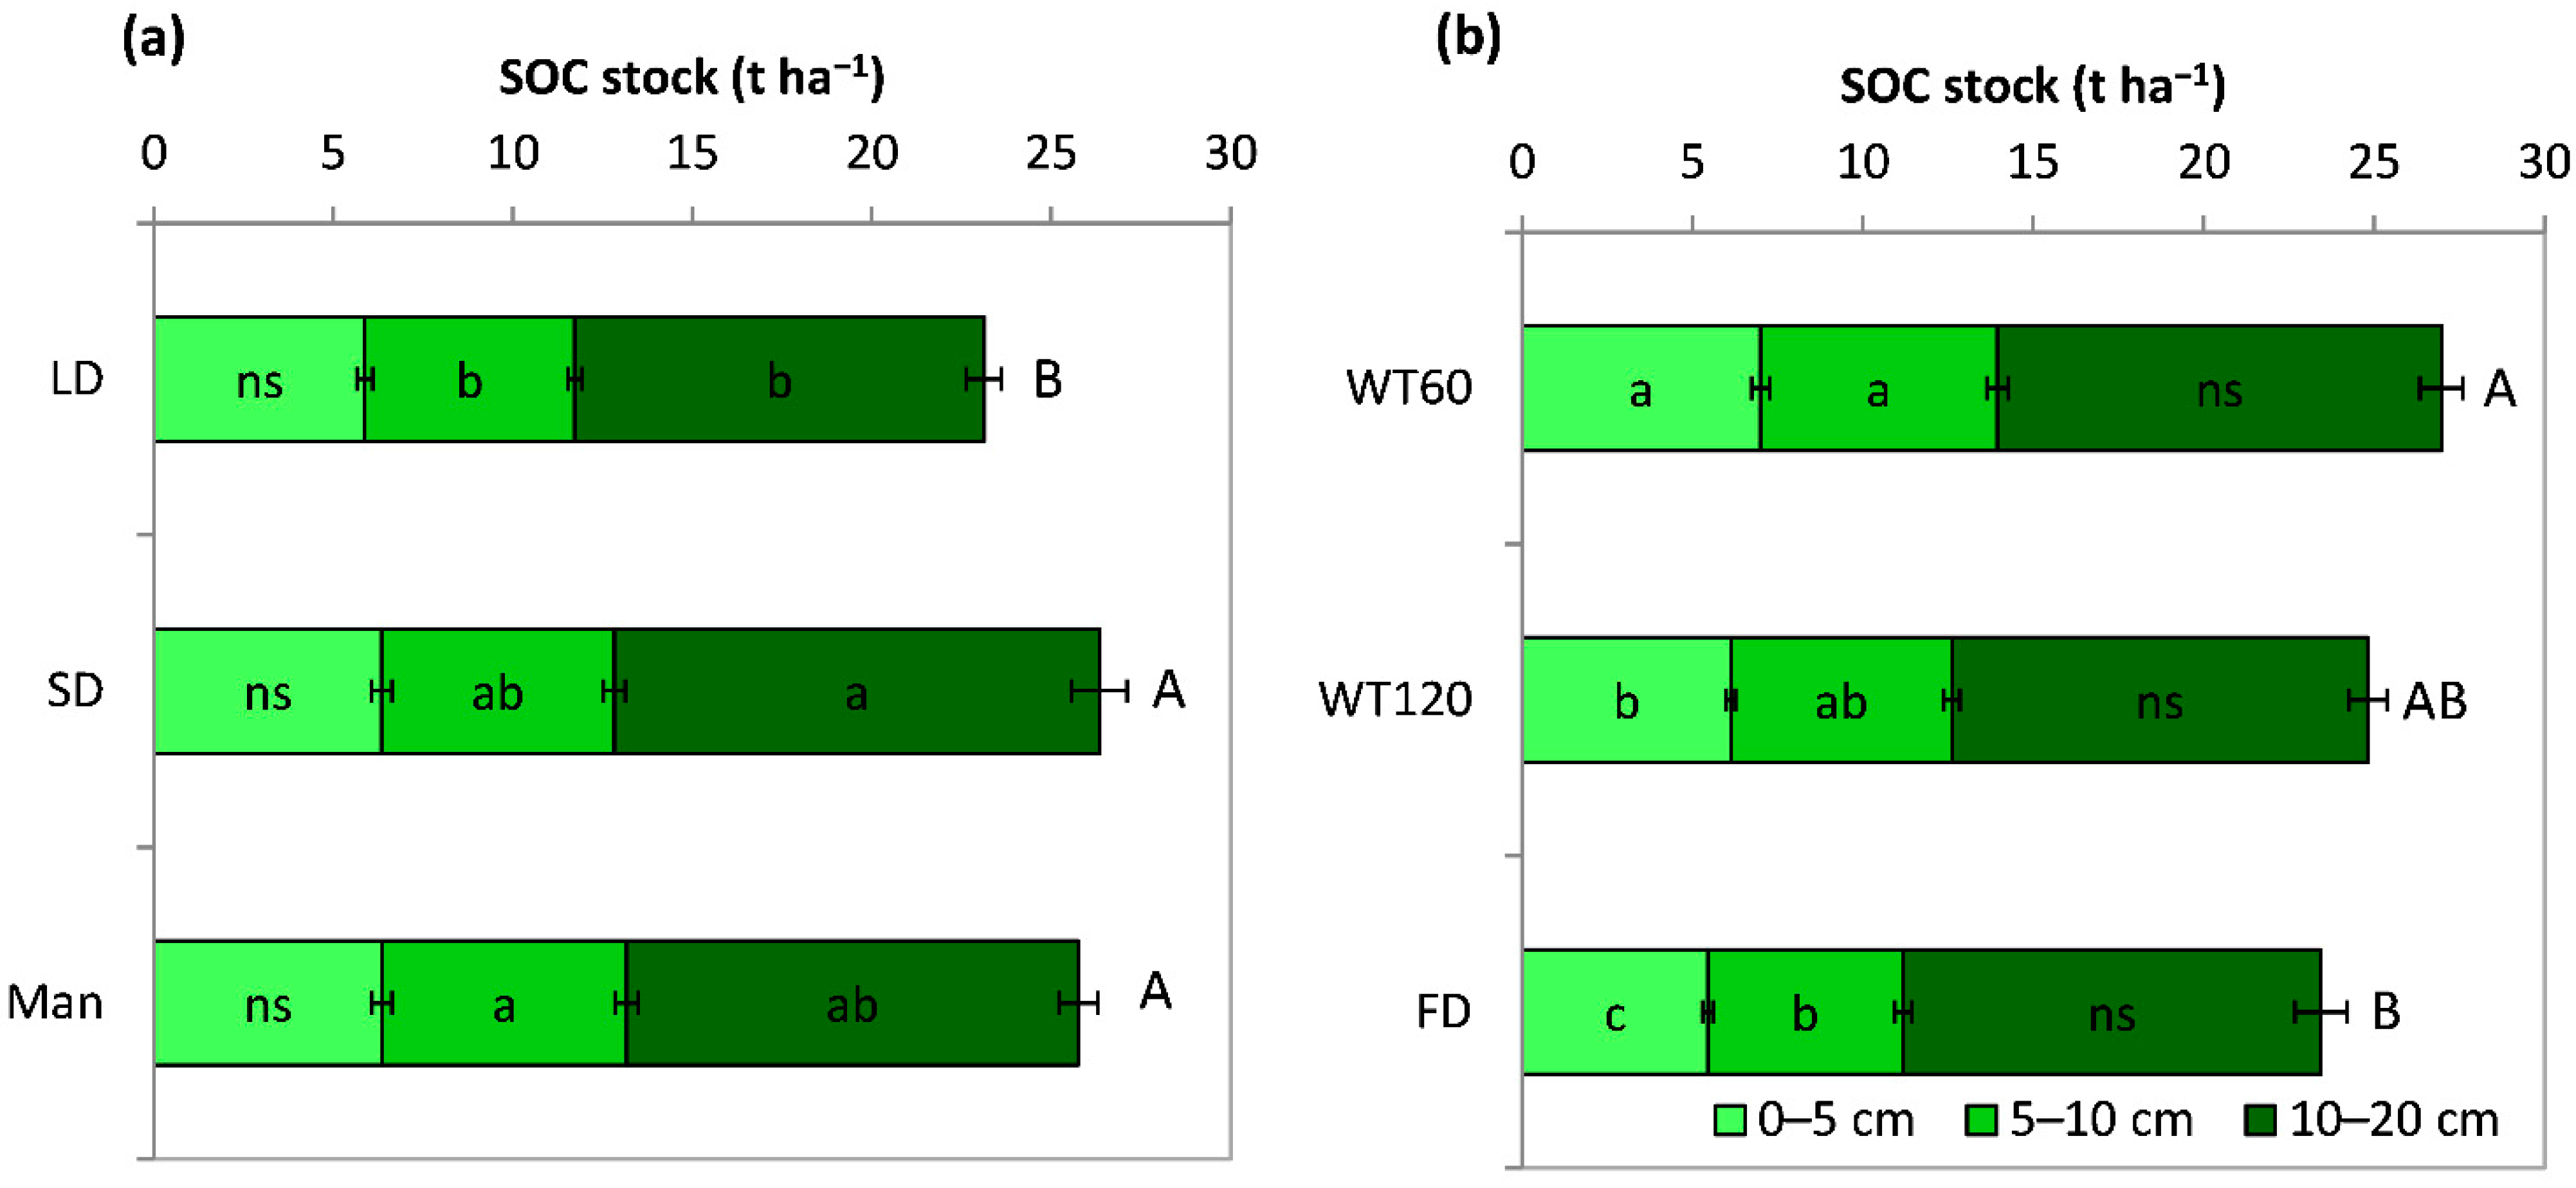
3.2.2. Soil Organic Carbon (SOC) Stock

The SOC stock was 17.5–32.5 t C ha−1 in the 0–20 cm soil profile with an average stock of 6.2, 6.4, and 12.5 t C ha−1 in the 0–5, 5–10, and 10–20 cm layers, respectively. The SOC stock showed similar results for SOC content with any fertilizer effect at 0–5 cm (6.2 t ha−1, on average) and a higher value in Man compared to LD (6.8 vs. 5.9 t ha−1) at 5–10 cm, as well as in SD compared to LD (13.5 vs. 11.4 t ha−1) at 10–20 cm (Table A2, Figure 3a). Considering the entire 0–20 cm soil profile, the SD and Man SOC stock was ca. 3 t ha−1 greater than LD.
The SOC stock decreased in all three studied layers from t0 to t1 with an overall depletion of 4.0 t ha−1 among the 0–20 cm soil profiles, with a greater magnitude in the 10–20 layer (−18%) than in the 5–10 (−14%) or 0–5 cm (−8%) layers (Figure 3a). The water table effect was ranked as follows: WT60 > WT120 > FD, with a clearer effect at 0–5 cm (Figure 3b).

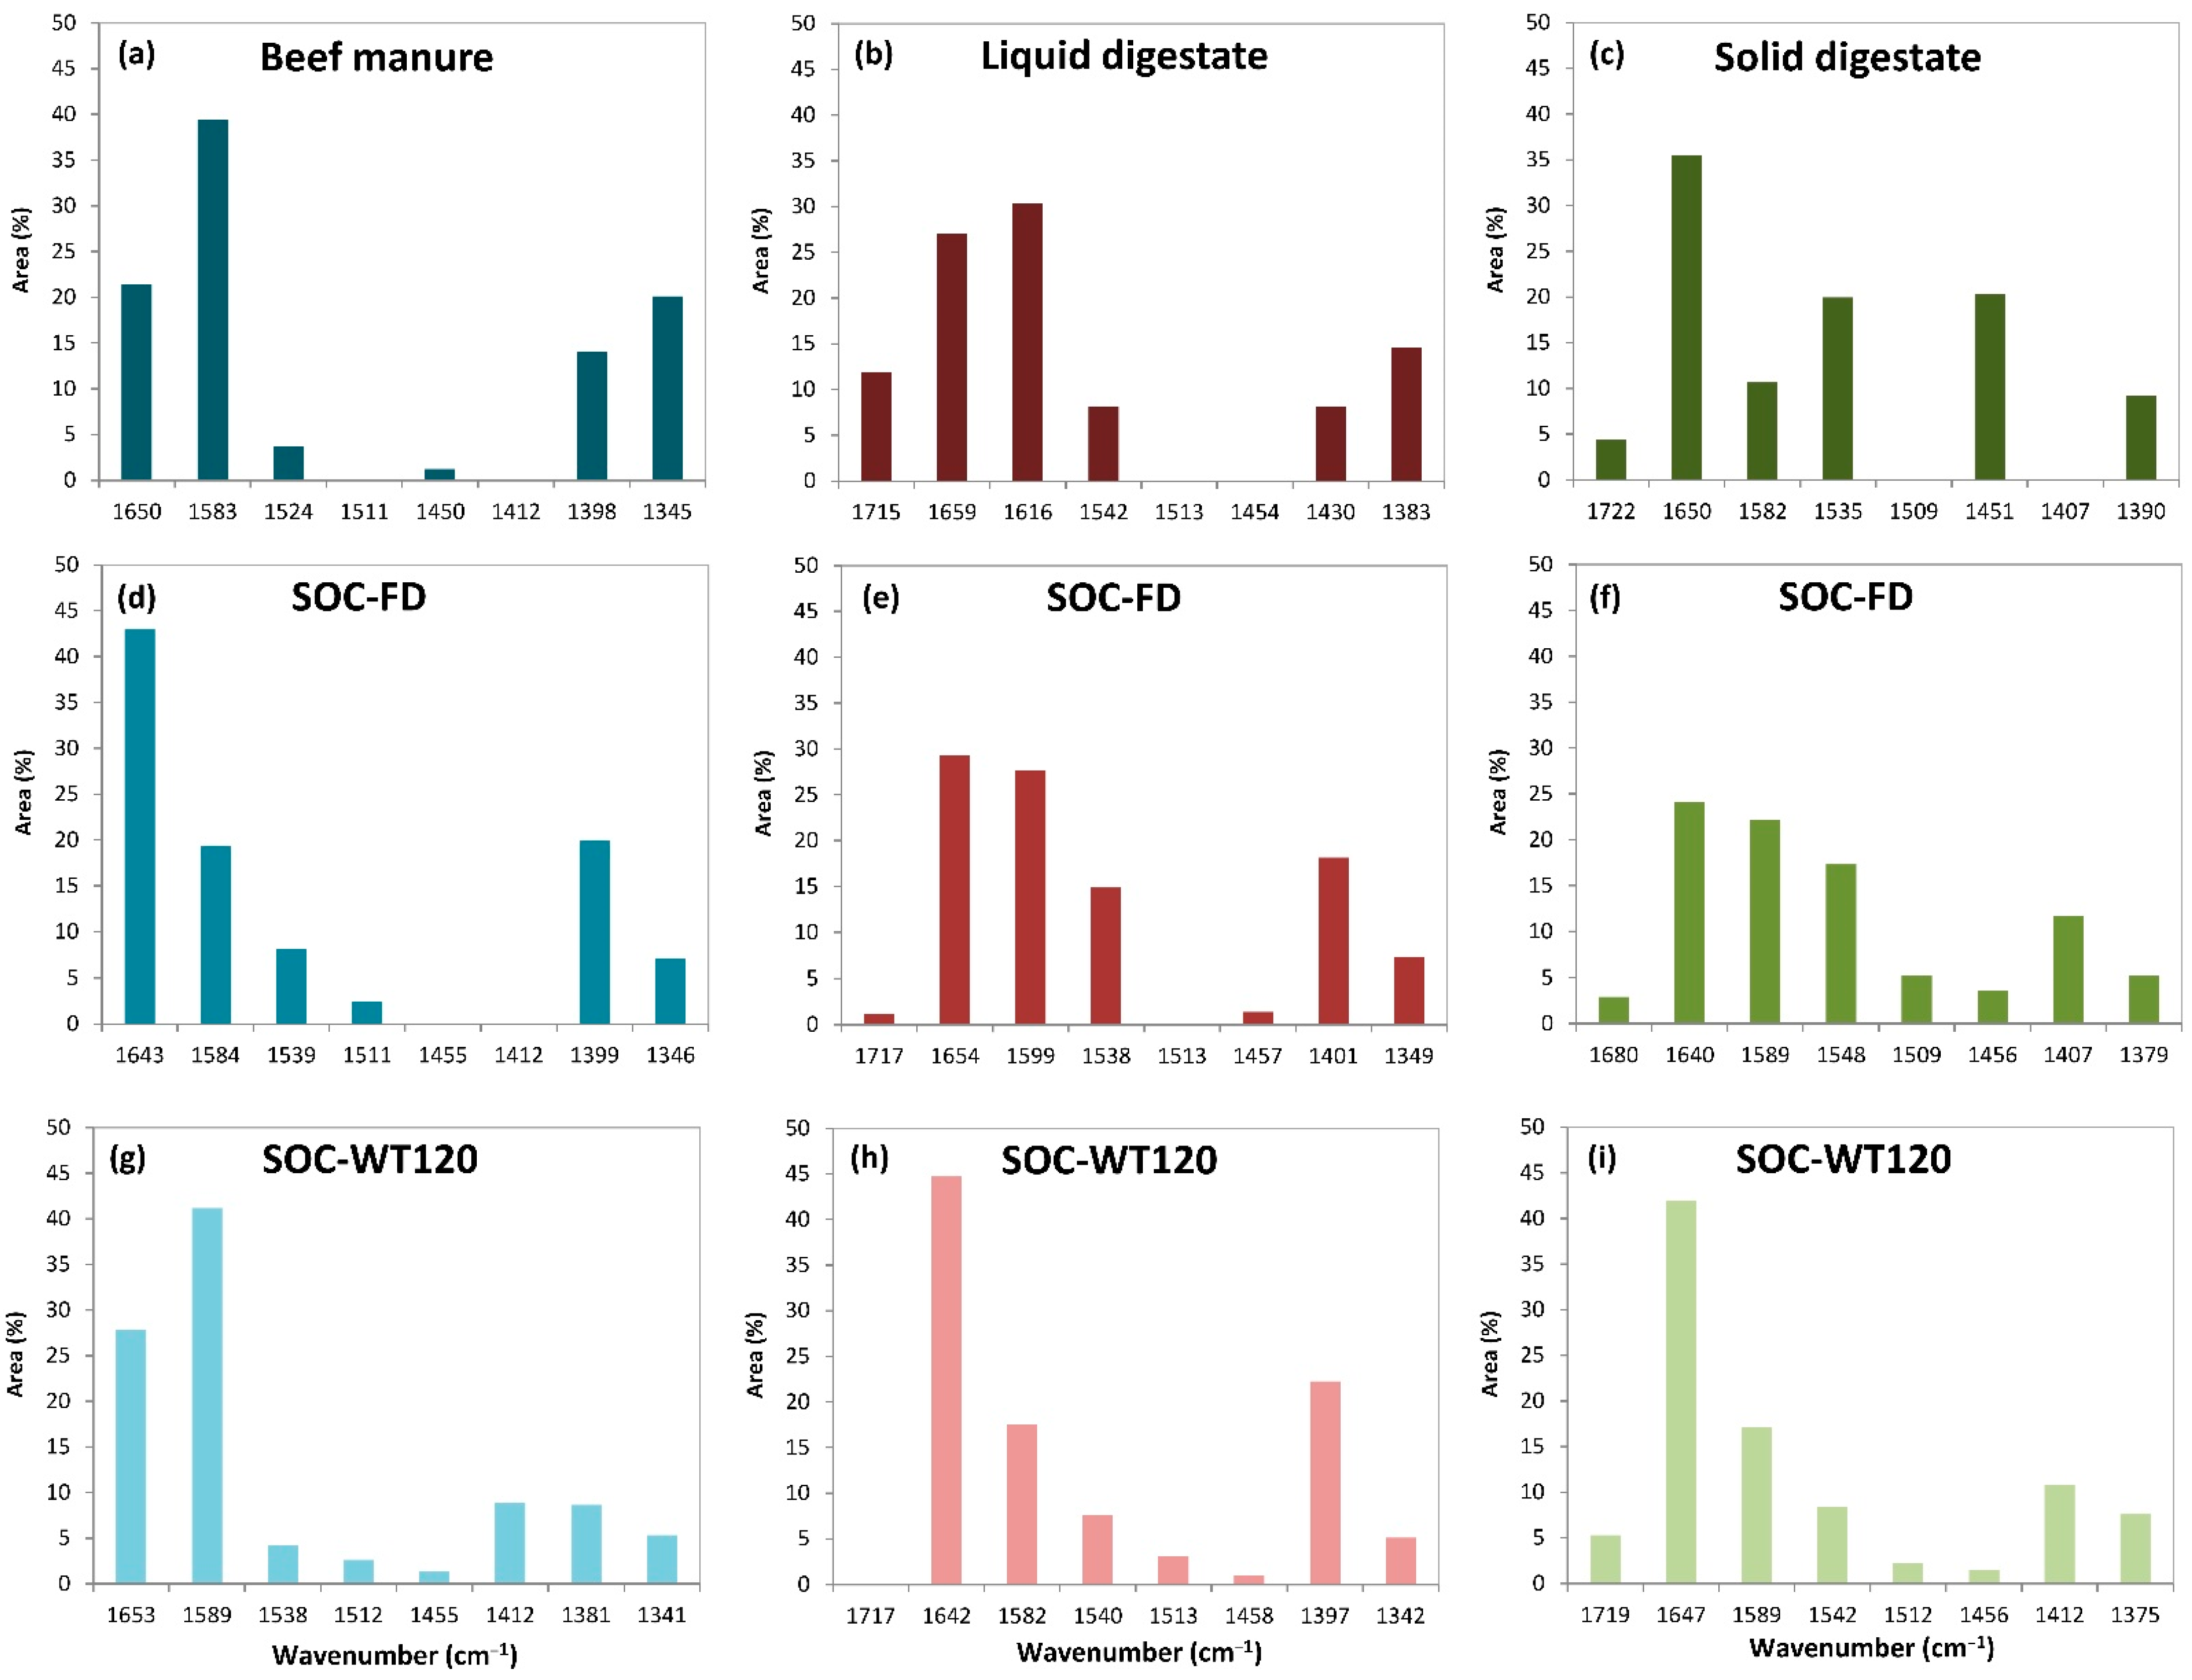
3.2.3. FT-IR Characterization of Soil Organic Carbon (SOC)

The most striking structural variations in the functional groups were observed in the region between 1800–1200 cm−1 (spectra not shown). Similar functional groups were found in all spectra and are described as follows: the band at 1722–1680 cm−1 was due to H-bonded acid/ketone carbonyl groups and carbonyl in aromatic carboxylic acids [34]; the band at 1660–1640 cm−1 was mainly attributed to amide I and C=O stretching in ketones; the band at 1616–1509 cm−1 was highly characteristic of the aromatic ring and carboxylate ions [34]; the band at 1550–1535 cm−1 was mainly assigned to amide II, the aromatic ring, and carboxylate ions in the lignin; at lower frequencies, the band at 1458–1430 cm−1 was due to C-H stretching, whereas the presence of the band at 1451–1341 cm−1 was assigned to symmetric CH3 stretching of branched chains [34].
By applying the Gaussian curve fitting function in the region between 1800–1200 cm−1, a quantitative estimation was obtained (Figure 4). The applied LD and SD differed in terms of area percentage for the examined functional groups. More specifically, the band at ~1720 cm−1 (H-bonded acid/ketone carbonyl groups) contributed 12% in LD and 4% in raw SD (Figure 4). In applied LD, amide I (1659 cm−1) and amide II (1542 cm−1) accounted for 27% and 8%, respectively. Conversely, they accounted for 35% (amide I at 1650 cm−1) and 20% (amide II at 1535 cm−1) in SD. Aromatic rings (1616 cm−1) and carboxylate ions accounted for 30% in LD and 11% (1582 cm−1) in SD. As regards the C–H group in the aliphatic compounds, it accounted for 20% (1451 cm−1) in SD and 8% (1430 cm−1) in LD (Figure 4).
The composition of the functional groups in SOC-FD fertilized with LD showed a similar pattern to that of applied LD, while the percentages of the corresponding areas varied. In particular, the band area at 1717 cm−1 decreased by 1%. In contrast, amide I and amide II contributed 29% and 15%, respectively, and the aromatic ring (1599 cm−1) contributed 28%. Such values were higher than LD. The aliphatic groups at 1457 cm−1, 1401 cm−1, and 1349 cm−1 accounted for 1.3%, 18%, and 7%, respectively. For SOC-WT120, the area percentage differed from applied fertilizer and SOC-FD in LD. The band at 1717 cm−1 disappeared, while amide I and amide II accounted for 45% and 7.5%, respectively. The aromatic ring at 1582 cm−1 was 17% and decreased with respect to SOC-FD (30%). The appearance of the band at 1513 cm−1 in the lignin accounted for 3%. The band at 1397 cm−1 exhibited a marked increase up to 22%.
In SOC-FD fertilized with SD, there was a slight decrease in the percentage of band area at 1680 cm−1 (3%), amide I (24%), and amide II (17%) compared to applied SD (Figure 4). The aromatic ring at 1589 cm−1 accounted for 22%, and a new band at 1509 cm−1 was 5%. The appearance of the band at 1407 cm−1 accounting for 12% was particularly significant. In SOC-WT120, the band at 1719 cm−1 accounted for 5%, while amide I (1647 cm−1) and amide II (1542 cm−1) were 42% and 8%, respectively. The other bands at 1589 cm−1 and 1512 cm−1 decreased compared to SOC-FD.
In the applied Man (Figure 4) the most important bands were those of amide I (1650 cm−1) and amide II (1524 cm−1), accounting for 21% and 4%, respectively. The most prominent band at 1583 cm−1 was 39%. In addition, the aliphatic groups at 1398 cm−1 and 1345 cm−1 accounted for 14% and 20%, respectively. In SOC-FD fertilized with Man, amide I and amide II increased, accounting for 43% and 8%, respectively. The band at 1584 cm−1 was 19% and decreased with respect to applied Man. Other relevant bands at 1511 cm−1 and 1399 cm−1 accounted for 2.5% and 20%, respectively. In SOC-WT120, amide I and amide II were 28% and 4%, respectively. They markedly decreased with respect to SOC-FD. The largest contribution was made by the band at 1589 cm−1, which accounted for 41%. The aromatic ring in lignin (1512 cm−1) was 2.6% and did not differ from that found in SOC-FD. A minor contribution was made by the aliphatic groups.

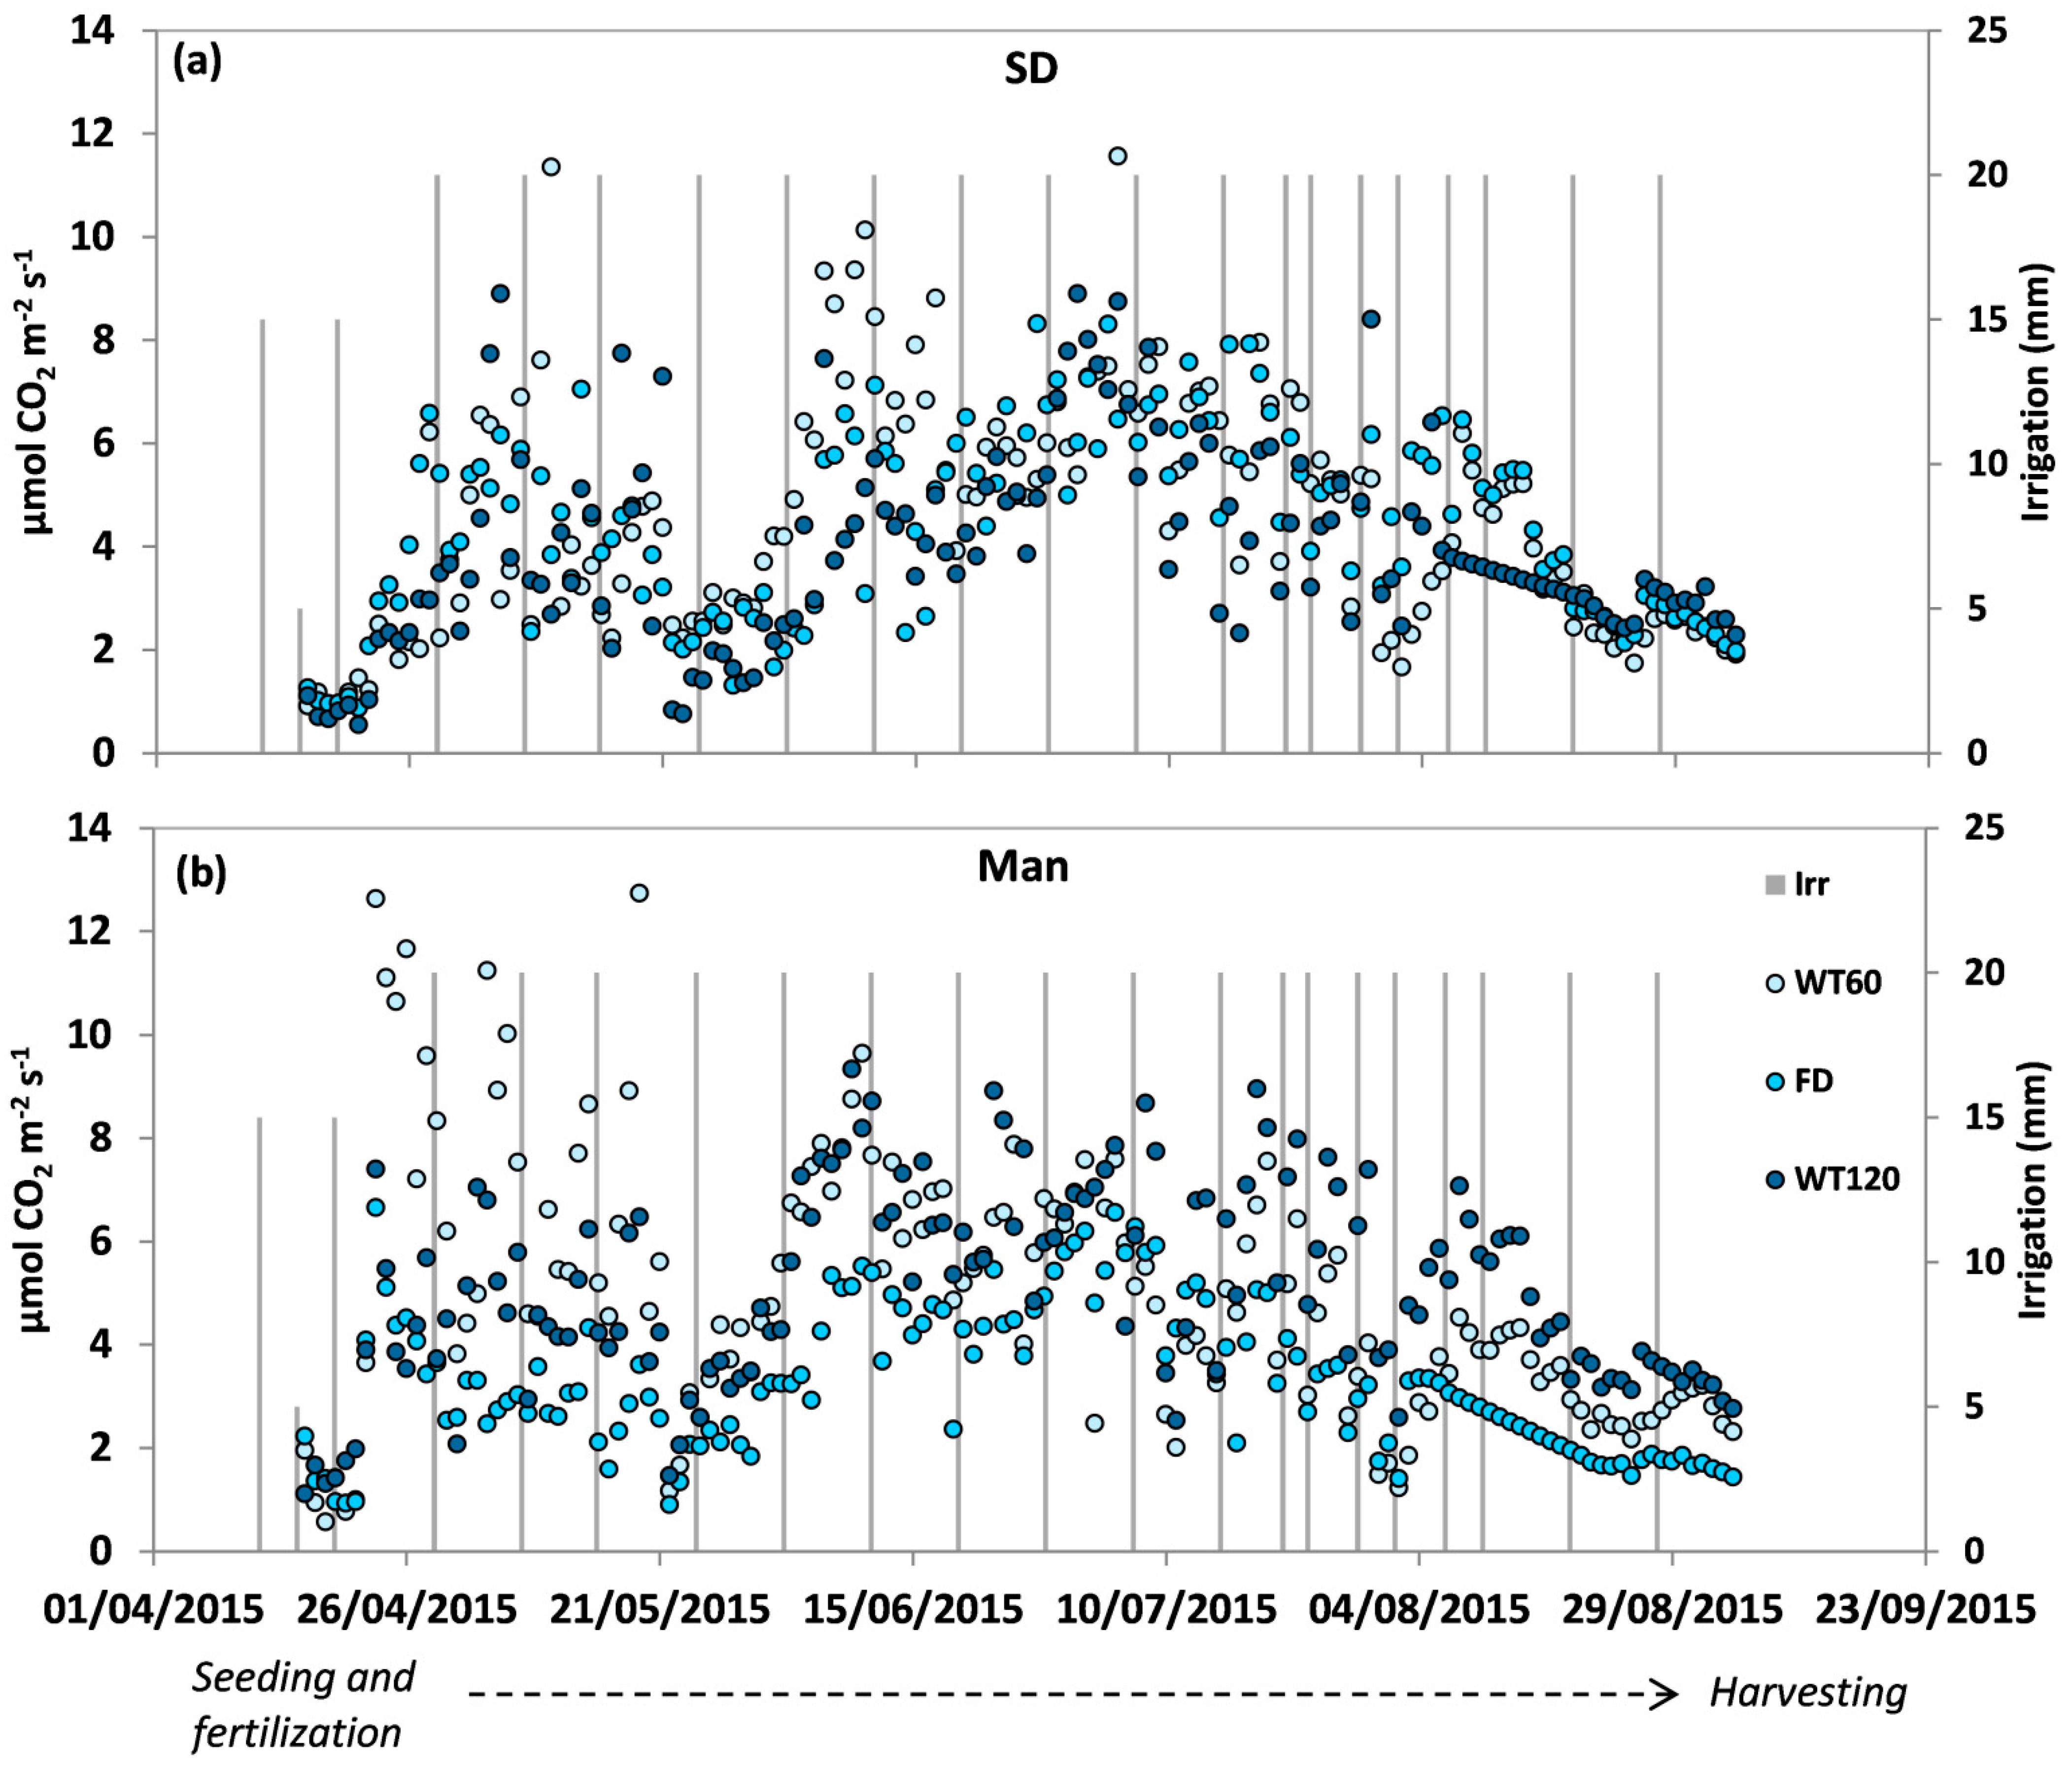
3.3. Soil Carbon Dioxide (CO2) Fluxes

The CO2 fluxes responded to fertilizer treatment and crop growth as shown by their evolution over time in Figure 5. In SD, it is seen as a double bell-shaped curve characterized by progressive increments in CO2 fluxes up to values > 6 µmol CO2 m−2 s−1 ca. 2 weeks after the fertilizer application (Figure 5a). Afterward, values decreased to a minimum < 3 m−2 s−1 on 22 May 2015 and increased again to values > 5 µmol CO2 m−2 s−1 following the crop development. A progressive CO2 flux decline (<3 µmol CO2 m−2 s−1) from the end of July to the postharvest period coincided with the maize physiological stage.
In Man, CO2 fluxes exhibited a sharp increase just one day after fertilizer distribution, reaching peaks of 13, 7, and 7 µmol CO2 m−2 s−1, respectively, in WT60, WT120, and FD. Afterward, CO2 fluxes slowly decreased to a minimum in mid-May, then increased again, mirroring the evolution observed in SD during the crop development and postharvest stages (Figure 5b).
The total CO2 fluxes were in the 0.2–60.9 g CO2 m2 d−1 range. The SD application produced lower fluxes at WT60 (4.4 g CO2 m2 d−1) than at WT120 and FD (average of 5.9 g CO2 m2 d−1) (Table 2). Conversely, Man application yielded higher results in WT conditions (average of 5.8 g CO2 m2 d−1) than in FD (4.0 g CO2 m2 d−1) (Table 2). Analyzing the 2-week span that followed fertilizer application, the total CO2 fluxes were not significantly affected by WT levels in SD, despite a tendency of higher value in FD (4.5 g CO2 m2 d−1) than in WT conditions (3.5 g CO2 m2 d−1, on average). On the contrary, Man WT60 exhibited a higher CO2 flux (8.2 g CO2 m2 d−1) than WT and FD (4.3 g CO2 m2 d−1) (Table 2). Topsoil (0–15 cm) and subsoil (15–30 cm) monthly temperatures were significantly correlated to CO2 fluxes for SD (r = 0.70 and r = 0.66, respectively), while no dependency was observed for Man. A positive correlation was also found between CO2 fluxes and 60–90 cm WFPS (r = 0.53) for Man.

4. Discussion

Anaerobic digestion is an interesting solution for agriculture as its residue, the digestate, can be used as an organic fertilizer due to its nutrient content [35]. Indeed, digestate is generally characterized by a high content of recalcitrant organic molecules (i.e., lignin is not degraded) and nutrients (N and P) that are crucial due to their availability to plants after field application [36]. Greater lignin content in anaerobic digestate is expected since lignin is not converted into biogas during the anaerobic digestion of silage. Therefore, fertilization with digestate is a way to increase SOC and ensure the input of organic substances and nutrients into the soil.
The presented outcomes highlighted an appreciable SOC increase in the short-term, resulting from treatment with SD and Man in the layers between 5–10 and 10–20 cm. In addition, the impact was visible in shallow groundwater conditions, with a higher carbon accumulation in WT60 than in WT120 and FD (8.9 vs. 8.2 and 7.8 t C ha−1, respectively). Conversely, no significant difference was observed for LD. The amount and quality of C input in the fertilizers, as well as water table conditions, played key roles in SOC stock dynamics. Comparable results were observed in SD and Man treatments despite the lower C input of the former (6.7 vs. 8.7 t ha−1). The SD impact on SOC stocks was most likely amplified by the recalcitrance nature of the C input. Indeed, in SD, the contribution of the aromatic ring (1513–1509 cm−1) as a lignin derivate was present in SOC-FD (27%) and SOC-WT120 (19%). The aerobic condition observed in FD could have increased the proportion of lignin derivate because of the enhanced degradation of more C labile forms (e.g., amino acids). Moreover, oxidative enzymatic activities and lignin breakdown could have been inhibited by high concentrations of N in the soil [37]. In addition to these effects, reactions between polyphenols and amino acids may also produce relatively toxic compounds and recalcitrant aromatic groups that may inhibit lignin breakdown [38]. The presence of proteins or amino acids in anaerobic digestate has been well-recognized [35]. In our experiment, the contribution of amide I was particularly relevant, as it was due almost entirely to C=O stretching motions of peptide bonds (about 80%); indeed, this spectral region represents the most sensitive secondary structural component of proteins to environmental effects. The amide II band, on the contrary, is much less sensitive. In particular, amide I in SOC-FD was 29% and 24%, respectively, for LD and SD, but under higher WFPS (i.e., WT), values increased to 45–42%. The presence of poorer mixing of the soil with the solid digestate could have hindered the degradation. Indeed, the presence of organic fertilizer “clouds” was previously related to reduced access to solid manure for soil decomposers [39]. In this study, this effect might have been exacerbated by the higher moisture content in soils with a shallow (e.g., −60 cm) water table.
The potential of SD for increasing SOC stock was previously highlighted by Slepetiene et al. [36], who tested the solid and liquid digestate fractions in eroded soils from Lithuania and found that solid digestate positively affected soil fertility, quality, sustainability, and durability. The underperformance of LD on SOC stocks was also described by Slepetiene et al. [36]. In our experiments, the poor results obtained from LD on SOC stock were mainly related to the low C input (1. 7 t C ha−1). Tambone et al. [40] deduced that, because of the presence of biochemically protected SOC, the fertilizing capacity of LD could not be overlooked. Indeed, according to Greenberg et al. [41], LD improved occluded particulate organic matter by up to 11% compared to mineral fertilizers.
The effect of the water table on digestate turnover was also confirmed by the CO2 fluxes measured during the two weeks after fertilizer distribution. The CO2 fluxes generally varied according to the seasons and the type of soil disturbance, e.g., soil tillage and type of soil covering [42,43]. Nevertheless, the first peak emissions results were dominated by SD distribution, with higher values in FD with WFPS levels averaging at 55%. These results confirmed the outcomes obtained by Schaufler et al. [21], who observed higher CO2 emissions in croplands with WFPS levels between 20% and 60%. The second peak occurred during the vegetative corn stage and mainly was related to the root development. Roots can contribute to CO2 emissions directly through respiration and indirectly by supplying C to the soil through exudation [22]. According to Rochette et al. [44], the contribution of roots and associated microorganisms in a maize field reached up to 45% of the total respiration, mainly concentrated in mid-summer. The total CO2 fluxes in the seeding–harvesting period were lower in SD WT60 than in the other treatments. It is reasonable to assume that the lower SD mineralization in the shallow water table may have reduced the N availability and root growth.
The Man fertilization in shallow water table conditions showed an opposite behavior in the 2 weeks after application. Indeed, CO2 emissions were negatively affected by water table depth, as demonstrated by Crézé and Madramootoo [22]. The authors observed that, after fertilization under free drainage and subsurface irrigation with a target water table depth of 0.75 m, CO2 fluxes from subsurface-irrigated plots were 21% greater than those of free drainage. However, the authors were not able to find any significant correlation to seasonal changes in soil WFPS. On the contrary, in our study, the CO2 fluxes were dependent on the WFPS of deeper layers.
The rapid response of CO2 fluxes to Man distribution was probably due to the greater content of labile C forms in manure, boosted by the anaerobic conditions ensured by the shallow water table. Indeed, Man fertilization led to a higher contribution of amide I (43%) in SOC-FD that decreased to 28% under shallow water conditions, suggesting enhanced degradation processes at high WFPS values. As previously observed in the same experiment by Cocco et al. [25] these conditions might have fostered denitrification processes and, in turn, CO2 emissions. As a consequence of labile compound degradation, the fraction of aromatic rings increased as a result of their high recalcitrance.
In the same experimental area, Maucieri et al. [45] observed high CO2 emissions during the first hours after application of LD, followed by a rapid flux reduction that reached values similar to unamended soil after 48 h. The CO2 peaks after fertilizer application might be the result of the rapid release of CO2 dissolved in the organic fertilizers and the microorganism degradation of easily degradable C substrates. This was particularly visible when manure was applied on lysimeters with a 60 cm water table, probably due to the interaction between the greater content of labile C forms in manure and the anaerobic conditions ensured by the shallow water table.

5. Conclusions

Agro-biomass recycling is a smart alternative to improve soil carbon sequestration, as it is a valuable source of nutrients for crops and has a beneficial effect on the physicochemical properties of the soil. Direct application of anaerobic digestate, including solid and liquid fractions, could be considered a beneficial solution both to maintain soil fertility and, at the same time, give new insight into a circular economy model. Starting from the raw product, by mechanical separation it is possible to obtain two different fractions that can be used for fulfilling contrasting agronomic requirements. Currently, the use of liquid digestate fraction is strongly encouraged by the high cost of synthetic fertilizers. On the contrary, solid fraction digestate can be beneficially exploited in the carbon credits market.
Nevertheless, knowledge of GHG emissions from the soil both during and after digestate application requires more extensive studies.

Author Contributions

Conceptualization, F.M.; methodology, F.M., G.D.V. and O.F.; formal analysis, O.F.; data curation, O.F., G.D.V., I.P. and C.C.; writing—original draft preparation, O.F. and I.P.; writing—review and editing, O.F., I.P., G.D.V., P.G., B.L., F.M. and C.C.; visualization, O.F. and I.P.; funding acquisition, B.L. and P.G. All authors have read and agreed to the published version of the manuscript.

Funding

This research was funded by Attività di studio, controllo e monitoraggio agroambientale degli effetti dell’applicazione di direttive e regolamenti comunitari per le zone vulnerabili ai nitrati di cui alla direttiva n. 91/676/CEE ricadenti nell’ambito del territorio del Bacino Scolante in Laguna di Venezia, Agenzia Regionale per la Prevenzione e Protezione Ambientale del Veneto.

Institutional Review Board Statement

Not applicable.

Informed Consent Statement

Not applicable.

Data Availability Statement

The data that support the findings of this study are available from the corresponding author upon reasonable request.

Conflicts of Interest

The authors declare no conflict of interest.

Appendix A

Table A1. Comparison of significance levels among the linear mixed-effect models analysis of the soil organic carbon content for each studied layer (0–5, 5–10, and 10–20 cm). Significant effects (p ≤ 0.05) are reported in bold.
Effect0–5 cm5–10 cm10–20 cm0–20 cm
Intercept<0.01<0.01<0.01<0.01
Time0.02<0.01<0.01<0.01
Fert0.060.010.05<0.01
WT0.150.780.160.15
Time*Fert0.810.530.950.68
Time*WT0.660.530.870.56
Fert*WT0.400.360.540.11
Time*Fert*WT0.350.380.680.09
Fert: fertilizer type; WT: water table level.
Table A2. Comparison of significance levels among the linear mixed-effect models analysis of the soil organic carbon stock for each studied layer (0–5, 5–10, and 10–20 cm). Significant effects (p ≤ 0.05) are reported in bold.
Effect0–5 cm5–10 cm10–20 cm0–20 cm
Intercept<0.01<0.01<0.01<0.01
Time0.02<0.01<0.01<0.01
Fert0.090.010.050.01
WT<0.01<0.010.530.01
Time*Fert0.760.460.930.31
Time*WT0.570.360.840.56
Fert*WT0.120.660.830.81
Time*Fert*WT0.340.330.670.73
Fert: fertilizer type; WT: water table level.

References

  1. EC New. EU Framework to Decarbonise Gas Markets. Available online: https://ec.europa.eu/commission/presscorner/detail/en/ip_21_6682 (accessed on 20 December 2021).
  2. EU Amending Directive 2010/31/EU on the Energy Performance of Buildings and Directive 2012/27/EU on Energy Efficiency. Available online: https://eur-lex.europa.eu/eli/dir/2018/844/oj (accessed on 13 February 2022).
  3. Corden, C.; Bougas, K.; Cunningham, E.; Tyrer, D.; Kreißig, J.; Zetti, E.; Al, E. Digestate and Compost as Fertilisers: Risk Assessment and Risk Management Options. 2019. Available online: https://ec.europa.eu/environment/chemicals/reach/pdf/40039%20Digestate%20and%20Compost%20RMOA%20-%20Final%20report%20i2_20190208.pdf (accessed on 13 February 2022).
  4. U.N. Transforming Our World: The 2030 Agenda for Sustainable Development; U.N.: New York, NY, USA, 2015. [Google Scholar]
  5. Arthurson, V. Closing the global energy and nutrient cycles through application of biogas residue to agricultural lLand—Potential benefits and drawback. Energies 2009, 2, 226–242. [Google Scholar] [CrossRef] [Green Version]
  6. Alburquerque, J.A.; de la Fuente, C.; Campoy, M.; Carrasco, L.; Nájera, I.; Baixauli, C.; Caravaca, F.; Roldán, A.; Cegarra, J.; Bernal, M.P. Agricultural use of digestate for horticultural crop production and improvement of soil properties. Eur. J. Agron. 2012, 43, 119–128. [Google Scholar] [CrossRef]
  7. Insam, H.; Gómez-Brandón, M.; Ascher, J. Manure-based biogas fermentation residues—Friend or foe of soil fertility? Soil Biol. Biochem. 2015, 84, 1–14. [Google Scholar] [CrossRef]
  8. Grillo, F.; Piccoli, I.; Furlanetto, I.; Ragazzi, F.; Obber, S.; Bonato, T.; Meneghetti, F.; Morari, F. Agro-environmental sustainability of anaerobic digestate fractions in intensive cropping systems: Insights regarding the Nitrogen use efficiency and crop performance. Agronomy 2021, 11, 745. [Google Scholar] [CrossRef]
  9. Möller, K. Influence of different manuring systems with and without biogas digestion on soil organic matter and nitrogen inputs, flows and budgets in organic cropping systems. Nutr. Cycl. Agroecosyst. 2009, 84, 179–202. [Google Scholar] [CrossRef]
  10. Smith, J.; Abegaz, A.; Matthews, R.B.; Subedi, M.; Orskov, E.R.; Tumwesige, V.; Smith, P. What is the potential for biogas digesters to improve soil carbon sequestration in Sub-Saharan Africa? Comparison with other uses of organic residues. Biomass Bioenergy 2014, 70, 73–86. [Google Scholar] [CrossRef] [Green Version]
  11. Marcato, C.E.; Mohtar, R.; Revel, J.C.; Pouech, P.; Hafidi, M.; Guiresse, M. Impact of anaerobic digestion on organic matter quality in pig slurry. Int. Biodeterior. Biodegrad. 2009, 63, 260–266. [Google Scholar] [CrossRef] [Green Version]
  12. Molinuevo-Salces, B.; Gómez, X.; Morán, A.; García-González, M.C. Anaerobic co-digestion of livestock and vegetable processing wastes: Fibre degradation and digestate stability. Waste Manag. 2013, 33, 1332–1338. [Google Scholar] [CrossRef]
  13. Möller, K. Effects of anaerobic digestion on soil carbon and nitrogen turnover, N emissions, and soil biological activity. A review. Agron. Sustain. Dev. 2015, 35, 1021–1041. [Google Scholar] [CrossRef]
  14. Gómez, X.; Blanco, D.; Lobato, A.; Calleja, A.; Martínez-Núñez, F.; Martin-Villacorta, J. Digestion of cattle manure under mesophilic and thermophilic conditions: Characterization of organic matter applying thermal analysis and 1H NMR. Biodegradation 2011, 22, 623–635. [Google Scholar] [CrossRef]
  15. Tambone, F.; Adani, F.; Gigliotti, G.; Volpe, D.; Fabbri, C.; Provenzano, M.R. Organic matter characterization during the anaerobic digestion of different biomasses by means of CPMAS 13C NMR spectroscopy. Biomass Bioenergy 2013, 48, 111–120. [Google Scholar] [CrossRef]
  16. Tambone, F.; Genevini, P.; D’Imporzano, G.; Adani, F.; Scaglia, B.; D’Imporzano, G.; Schievano, A.; Orzi, V.; Salati, S.; Adani, F. Assessing amendment and fertilizing properties of digestates from anaerobic digestion through a comparative study with digested sludge and compost. Chemosphere 2010, 81, 577–583. [Google Scholar] [CrossRef] [PubMed]
  17. Tiwari, V.N.; Tiwari, K.N.; Upadhyay, R.M. Effect of crop residues and biogas slurry incorporation in wheat on yield and soil Fertility. J. Indian Soc. Soil Sci. 2000, 48, 515–520. [Google Scholar]
  18. Béghin-Tanneau, R.; Guérin, F.; Guiresse, M.; Kleiber, D.; Scheiner, J.D. Carbon sequestration in soil amended with anaerobic digested matter. Soil Tillage Res. 2019, 192, 87–94. [Google Scholar] [CrossRef]
  19. Askri, A.; Laville, P.; Trémier, A.; Houot, S. Influence of origin and post-treatment on greenhouse gas emissions after anaerobic digestate application to soil. Waste Biomass Valorization 2016, 7, 293–306. [Google Scholar] [CrossRef]
  20. Cayuela, M.L.; Oenema, O.; Kuikman, P.J.; Bakker, R.R.; Groenigen, J.W. Van Bioenergy by-products as soil amendments? Implications for carbon sequestration and greenhouse gas emissions. GCB Bioenergy 2010, 2, 201–213. [Google Scholar] [CrossRef]
  21. Schaufler, G.; Kitzler, B.; Schindlbacher, A.; Skiba, U.; Sutton, M.A.; Zechmeister-Boltenstern, S. Greenhouse gas emissions from European soils under different land use: Effects of soil moisture and temperature. Eur. J. Soil Sci. 2010, 61, 683–696. [Google Scholar] [CrossRef]
  22. Crézé, C.M.; Madramootoo, C.A. Water table management and fertilizer application impacts on CO2, N2O and CH4 fluxes in a corn agro-ecosystem. Sci. Rep. 2019, 9, 1–13. [Google Scholar] [CrossRef]
  23. Ruser, R.; Flessa, H.; Russow, R.; Schmidt, G.; Buegger, F.; Munch, J.C. Emission of N2O, N2 and CO2 from soil fertilized with nitrate: Effect of compaction, soil moisture and rewetting. Soil Biol. Biochem. 2006, 38, 263–274. [Google Scholar] [CrossRef]
  24. Morari, F.; Lugato, E.; Polese, R.; Berti, A.; Giardini, L. Nitrate concentrations in groundwater under contrasting agricultural management practices in the low plains of Italy. Agric. Ecosyst. Environ. 2012, 147, 47–56. [Google Scholar] [CrossRef]
  25. Cocco, E.; Bertora, C.; Squartini, A.; Delle Vedove, G.; Berti, A.; Grignani, C.; Lazzaro, B.; Morari, F. How shallow water table conditions affect N2O emissions and associated microbial abundances under different nitrogen fertilisations. Agric. Ecosyst. Environ. 2018, 261, 1–11. [Google Scholar] [CrossRef]
  26. Vedove, G.D.; Alberti, G.; Zuliani, M.; Peressotti, A. Automated Monitoring of Soil Respiration: An Improved Automatic Chamber System. Ital. J. Agron. 2007, 2, 377–382. [Google Scholar] [CrossRef]
  27. Xu, L.; Furtaw, M.D.; Madsen, R.A.; Garcia, R.L.; Anderson, D.J.; McDermitt, D.K. On maintaining pressure equilibrium between a soil CO2 flux chamber and the ambient air. J. Geophys. Res. Atmos. 2006, 111, 8–10. [Google Scholar] [CrossRef] [Green Version]
  28. Hutchinson, G.L.; Livingston, G.P. Vents and seals in non-steady-state chambers used for measuring gas exchange between soil and the atmosphere. Eur. J. Soil Sci. 2001, 52, 675–682. [Google Scholar] [CrossRef]
  29. Delle Vedove, G.; Grignani, C.; Bertora, C. Greenhouse Gases Emissions from Soils. In Handbook of Standardised Ecosystem Protocols; ExpeER: Rio de Janeiro, Brazil, 2013; pp. 65–86. Available online: https://expeeronline.eu/images/ExpeER-Documents/Handbook_of_standardized_ecosystem_protocols.pdf (accessed on 13 February 2022).
  30. Hutchinson, G.L.; Mosier, A.R. Improved Soil Cover Method for Field Measurement of Nitrous Oxide Fluxes. Soil Sci. Soc. Am. J. 1981, 45, 311–316. [Google Scholar] [CrossRef]
  31. Livingston, G.P.; Hutchinson, G.L. Enclosure-based measurement of trace gas exchange: Applications and sources of error. In Biogenic Trace Gases: Measuring Emissions from Soil and Water; Blackwell Science: Cambridge, MA, USA, 1995; pp. 14–50. [Google Scholar]
  32. Grossman, R.B.; Reinsch, T.G. 2.1 Bulk density and linear extensibility. In Methods of Soil Analysis: Part 4 Physical Methods; Dane, J.H., Topp, C.G., Eds.; Soil Science Society of America: Madison, WI, USA, 2002; pp. 201–228. [Google Scholar]
  33. Nardi, S.; Morari, F.; Berti, A.; Tosoni, M.; Giardini, L. Soil organic matter properties after 40 years of different use of organic and mineral fertilisers. Eur. J. Agron. 2004, 21, 357–367. [Google Scholar] [CrossRef]
  34. Rao, C.N.R. Chemical Applications of Infrared Spectroscopy; Academic Press, Inc.: New York, NY, USA; London, UK, 1963. [Google Scholar]
  35. Möller, K.; Müller, T. Effects of anaerobic digestion on digestate nutrient availability and crop growth: A review. Eng. Life Sci. 2012, 12, 242–257. [Google Scholar] [CrossRef]
  36. Slepetiene, A.; Volungevicius, J.; Jurgutis, L.; Liaudanskiene, I.; Amaleviciute-Volunge, K.; Slepetys, J.; Ceseviciene, J. The potential of digestate as a biofertilizer in eroded soils of Lithuania. Waste Manag. 2020, 102, 441–451. [Google Scholar] [CrossRef]
  37. Carreiro, M.M.; Sinsabaugh, R.L.; Repert, D.A.; Parkhurst, A.D.F. Microbial enzyme shifts explain litter decay responses to simulated nitrogen deposition. Rep. Ecol. 2000, 81, 2359–2365. [Google Scholar] [CrossRef]
  38. Tu, L.H.; Hu, H.L.; Chen, G.; Peng, Y.; Xiao, Y.L.; Hu, T.X.; Zhang, J.; Li, X.W.; Liu, L.; Tang, Y. Nitrogen addition significantly affects forest litter decomposition under high levels of ambient nitrogen deposition. PLoS ONE 2014, 9, e88752. [Google Scholar] [CrossRef] [Green Version]
  39. Rochette, P.; Angers, D.A.; Chantigny, M.H.; Gagnon, B.; Bertrand, N. In situ mineralization of dairy cattle manures as determined using soil-surface carbon dioxide fluxes. Soil Sci. Soc. Am. J. 2006, 70, 744–752. [Google Scholar] [CrossRef]
  40. Tambone, F.; Orzi, V.; Zilio, M.; Adani, F. Measuring the organic amendment properties of the liquid fraction of digestate. Waste Manag. 2019, 88, 21–27. [Google Scholar] [CrossRef] [PubMed]
  41. Greenberg, I.; Kaiser, M.; Gunina, A.; Ledesma, P.; Polifka, S.; Wiedner, K.; Mueller, C.W.; Glaser, B.; Ludwig, B. Substitution of mineral fertilizers with biogas digestate plus biochar increases physically stabilized soil carbon but not crop biomass in a field trial. Sci. Total Environ. 2019, 680, 181–189. [Google Scholar] [CrossRef] [PubMed]
  42. Savage, K.E.; Davidson, E.A. Interannual variation of soil respiration in two New England forests. Global Biogeochem. Cycles 2001, 15, 337–350. [Google Scholar] [CrossRef] [Green Version]
  43. Franzluebbers, A.J.; Hons, F.M.; Zuberer, D.A. Tillage-induced seasonal changes in soil physical properties affecting soil CO2 evolution under intensive cropping. Soil Tillage Res. 1995, 34, 41–60. [Google Scholar] [CrossRef]
  44. Rochette, P.; Flanagan, L.B.; Gregorich, E.G. Separating soil respiration into plant and soil components using analyses of the natural abundance of carbon-13. Soil Sci. Soc. Am. J. 1999, 63, 1207–1213. [Google Scholar] [CrossRef]
  45. Maucieri, C.; Barbera, A.C.; Borin, M. Effect of injection depth of digestate liquid fraction on soil carbon dioxide emission and maize biomass production. Ital. J. Agron. 2016, 11, 6–11. [Google Scholar] [CrossRef]
Figure 1. Variation of temperature (top) and water-filled pore space (WFPS) with the amount of irrigation (Irr) (bottom) during the cropping season according to different soil layers (0–15 cm, 15–30 cm, and 30–60 cm) and water table levels (FD: free drainage, WT60: −60 cm water table level, and WT120: −120 cm water table level).
Agronomy 12 00504 g001
Figure 2. Soil organic carbon content as affected by fertilizer type. LD: liquid digestate; SD: solid digestate; Man: beef manure. Different letters indicate significant differences between treatments according to the Tukey test with p ≤ 0.05 at 5–10 cm and 10–20 cm, and p ≤ 0.06 at 0–5 cm.
Agronomy 12 00504 g002
Figure 3. Soil organic carbon (SOC) content as affected by fertilizer type (a) and water table level (b). Different letters indicate significant differences between treatments according to the Tukey test with p ≤ 0.05. Lower case letters refer to the specific soil layer (0–5, 5–10, and 10–20 cm) while uppercase letters refer to the entire 0–20 cm soil profile. LD: liquid digestate; SD: solid digestate; Man: beef manure; WT60: −60 cm water table; WT120: −120 cm water table; FD: free drainage.
Agronomy 12 00504 g003
Figure 4. Area percent (%) of the main FT−IR bands of applied fertilizers (beef manure, liquid digestate, and solid digestate) (ac) and soil organic carbon (SOC) extracted from free drainage (SOC-FD) (df) and the −120 cm water table (SOC-WT120) (gi).
Agronomy 12 00504 g004
Figure 5. Daily CO2 fluxes (points) for solid digestate (SD) (a) and beef manure (Man) (b) and the amount of irrigation (bars). 60: −60 cm water table; 120: −120 cm water table; FD: free drainage.
Agronomy 12 00504 g005
Table 1. Fertilizer dry matter, total Kjeldahl nitrogen (TKN), and carbon (C) content.
FertilizerDry Matter (%)TKN (g kg−1)C (% Dry Matter)
Beef manure (Man)8.02.175
Liquid digestate (LD)8.29.665
Solid digestate (SD)22.58.685
Table 2. Daily CO2 flux according to fertilizer type (SD: solid digestate; and Man: beef manure) and considered period. Different letters indicate significant differences between water table levels (WT60: −60 cm water table, WT120: −120 cm water table, and FD: free drainage) according to the Tukey test with p ≤ 0.05.
PeriodFertilizerWT60WT120FD
Seeding–harvestSD4.4 g CO2 m2 d−1b6.2 g CO2 m2 d−1a5.5 g CO2 m2 d−1a
Man5.6 g CO2 m2 d−1a5.9 g CO2 m2 d−1a4.0 g CO2 m2 d−1b
2 weeks after fertilizationSD3.4 g CO2 m2 d−1ns3.6 g CO2 m2 d−1ns4.5 g CO2 m2 d−1ns
Man8.2 g CO2 m2 d−1a4.9 g CO2 m2 d−1b3.8 g CO2 m2 d−1b
Publisher’s Note: MDPI stays neutral with regard to jurisdictional claims in published maps and institutional affiliations.

