Article

Effect of N on Growth, Antioxidant Capacity, and Chlorophyll Content of Sorghum

by
Irshad Ahmad
1,2,
Guanglong Zhu
1,2,3,*,
Guisheng Zhou
1,2,*,
Xudong Song
4,
Muhi Eldeen Hussein Ibrahim
1,5 and
Ebtehal Gabralla Ibrahim Salih
1
1
Joint International Laboratory of Agriculture and Agri-Product Safety, Yangzhou University, Yangzhou 225009, China
2
Key Lab of Crop Genetics & Physiology of Jiangsu Province, Yangzhou University, Yangzhou 225009, China
3
Institutes of Agricultural Science and Technology Development, Yangzhou University, Yangzhou 225009, China
4
Jiangsu Yanjiang Area Institute of Agricultural Sciences, Nantong 226541, China
5
Department of Agronomy, College of Agricultural Studies, Sudan University of Science and Technology, Khartoum 13311, Sudan
*
Authors to whom correspondence should be addressed.
Agronomy 2022, 12(2), 501; https://doi.org/10.3390/agronomy12020501
Submission received: 20 January 2022 / Revised: 8 February 2022 / Accepted: 14 February 2022 / Published: 17 February 2022

Abstract

:
Nutrient management is an important challenge to agricultural sustainability. In this study, the effects of three nitrogen (N) fertilizer levels (N1 = 0, N2 =150, and N3 = 300 kg ha−1) on growth, chlorophyll content, and antioxidant capacity of two grain sorghum cultivars were investigated in a two-year (2017 and 2018) field trial. The treatments were arranged in a randomized complete block design with three replicates. Nitrogen application (N2 and N3) improved plant growth and antioxidant enzymes activity; compared to the control N1, N increased germination by 18.7%, leaf length by 7.5%, leaf weight by 10.8%, specific leaf weight by 11.6%, and plant height by 2.5% in Siyong 3180 cultivar and increased leaf width by 12.8% and stem weight by 27.4% in CFSH30 cultivar. In 2017 and 2018, increasing nitrogen N2 and N3 enhanced superoxide dismutase (SOD), catalase (CAT), and peroxidase (POD) activities and leaf protein content in both cultivars. While in 2017, chlorophyll content decreased in the CFSH30 cultivar. Our study showed that increased nitrogen supply could improve morpho-physiological activities of sorghum, but N3 was relatively more effective for sorghum growth in Siyong 3180 cultivar compared to CFSH30 cultivar.

1. Introduction

Nitrogen (N) is a major nutrient necessary for crop growth and development to meet the demand for high quality and yield of agricultural products [1]. N is the primary element for plants because it is a core component of various plant forms and also of their physiological and extrinsic metabolic processes [2,3]. Nitrogen application can enhance physiological processes in plants, including nutrient uptake, enzyme activity, and photosynthetic rate [4,5] However, excessive use of nitrogen fertilizer is a major problem in agriculture. Excess N in plants may cause toxic problems to human health such as methemoglobinemia, nitrous oxide emissions, and nitrate contamination of groundwater [6,7]. Previous studies have shown that consumption of crops with higher nitrate concentrations has a significant negative impact on human health [8].
Deficient or excessive N supply leads to the production of reactive oxygen species (ROS) in crops, inducing oxidative stress [9]. Higher N rate increased the production and accumulation of ROS, leading to significant changes in the content of lipid, nucleic acid, soluble protein, and chlorophyll in plants [10].
Previous studies observed that increasing N rate enhanced growth, development, and yield of sorghum [11,12]. Crops grown under N deficiency may result in early maturity, reduced yield, and poor quality [13]. Nitrogen is regarded as one of the major elements affecting sorghum growth and yield [14]. Sorghum growth and yield improvement depends not only on more nitrogen application, but also on the selection of suitable cultivars [15,16].
Sorghum [Sorghum bicolor (L.) Moench] is the fifth largest cereal crop grown in the world. Sorghum is a multi-purpose crop and can be used as human food, animal feed, and industrial products [17]. Sorghum accounts for nearly 6% of the global coarse grain production and responds well to N input management [18]. Despite its high adaptability and wide distribution, global productivity of sorghum remains low (only 1.4 t ha−1) [19]. Therefore, to achieve sustainable sorghum productivity, optimal fertilization practices should be used [20].
In this study, we hypothesized that N fertilization could improve crop development by enhancing growth and physiological characteristics of sorghum. Therefore, the current study was done to explore the application of three N fertilization rates and their effects on growth and physiology, including chlorophyll content and antioxidant enzyme activity in two sorghum cultivars.

2. Materials and Methods

2.1. Management Practices, Experimental Arrangements, and Treatments

This study (2017–2018) was conducted on the experimental farm of Yangzhou University, Yangzhou City, Jiangsu Province, China (32.30° N, 119.825° E). The soil was a sandy loam of Typic fluvaquents Entisols [21]. The field was previously planted to castor (Ricinuscommunis L.) and cotton (Gossypiumhirsutum L.). The soil parameters were tested containing 1.22% organic matter, 1.0 g kg−1 total N, 14.1 mg kg−1 P, and 77.3 mg kg−1 K. The pH reading of the soil was 7.1.
At both sites, field trials were arranged in a 2-factorial (N and cultivar) complete randomized block design with three replications for each treatment. Nitrogen applications were 0, 150, and 300 kg N ha−1 (referred to as N1, N2, and N3) and the two sorghum varieties were CFSH30 (V1) and Siyong 3180 (V2). The N fertilizer was applied as urea in solid form in all the treatments. Phosphorus (P) was applied twice to all treatments at an equal rate of 120 kg/ha at seedling and plant growth stages [22]. The N and P fertilizer were applied simultaneously in each plot during sowing by hand seeding.
Each replicated plot was 10.5 m2 (3.5 m × 3. 0 m) in size. Soil tillage was carried out by traditional ploughing with wooden planks. Sorghum seeds of 4.5 kg ha−1 were sown by hand sowing on 26 May 2017 and 20 May 2018, respectively. The distance between the adjacent plots was 40 cm.
Other field management practices such as weeding and pest control were conducted according to local practices and recommendations.

2.2. Determination of Plant Growth and Physiological Parameters

At 4, 10, 16, and 22 days after sowing (DAS), the number of germinating seeds per plot was randomly counted until the plants reached 80% maturity [23].
The samples were taken at 97 days after sowing when the plant reached maturity stage. Data on growth parameters such as leaf length, width, weight, specific weight, stem weight and plant height were measured during the single year 2017.
On day 97 after sowing, 10 plants were randomly collected and the length (cm) and width (cm) of fresh leaves were examined [24].
To determine biomass yield, whole plants were harvested from the center row on day 97 after sowing and manually separated into leaf, stem, and specific leaf weights that were weighed by electronic scales [25].
For the determination of leaf weight (g), the penultimate leaves of the sorghum were selected.
Plant height (cm) was measured from the bottom of the soil to the top of the panicle using a measuring rod [14].
The number of panicles emergence on ten plants was randomly counted at two different growth stages (panicle initiation and reproduction).

2.2.1. Soluble Protein

Approximately 0.5 g of fresh sorghum leaves were homogenized in 5 mL of sodium phosphate buffer (pH 7.2) at 4 °C and centrifuged directly at 10,000 rpm for 15 min at 4 °C. For further examination, the supernatants were stored on ice to prevent it from external contamination and deterioration [26]. The content was measured using the Coomassie blue dye-binding method according to [27]. The absorbance readings were converted to protein content using bovine serum albumin (BSA) as a standard curve [28]. The supernatant and dye were transferred into a spectrophotometer cup and absorbance was recorded at 595 nm using a spectrophotometer (Model 721, Shanghai Mapada Instruments Company Limited, Shanghai, China).

2.2.2. Superoxide Dismutase (SOD), Catalase (CAT), and Peroxidase (POD)

To determine antioxidant activities, 0.5 g of fresh leaves were crushed in a mortar with 5 mL of 50 mm sodium phosphate buffer agent (pH = 7.0). The obtained homogenates were centrifuged at 10,000× g for 15 min at 4 °C. The supernatants were used to determine SOD, CAT, and POD [2,29]. SOD activity was measured in a reaction mixing agent including 50 mM sodium phosphate buffer at pH 7.0, 10 mM methionine, 1.17 mM riboflavin, and 56 mM nitro-blue tetrazolium (NBT). The absorbance of the solution was measured by calculating the inhibition of photochemically reduced NBT at 560 nm using a microplate spectrophotometer according to the method of [30]. The activities of POD and CAT were measured according to the following methods of [31,32]. Peroxidase was examined using guaiacol as a substrate. Due to the oxidation of guaiacol, POD was measured by calculating the increase in absorbance at 470 nm over 3 min with a spectrophotometer. The reaction mixture consisted of 50 mM Tris-HCl (pH = 7.0), 10 mM of guaiacol, 5 mM of H2O2, and 0.1 mL of enzyme extract. One unit of POD activity was measured as 0.1 unit change in absorbance per minute. In addition, CAT activity was measured by the decrease in the absorbance of H2O2 at 240 nm. The reaction mixture (3 mL) was 50 mM of Tris-HCl (pH 7.0), 0.1 mM of EDTA, 12.5 mM of H2O2, and 0.1 mL of enzyme extract. One unit of enzyme activity is defined as a 0.01-change in the absorbance at 240 nm per minute.

2.2.3. Chlorophyll Content (a, b, and Carotenoids)

To determine the chlorophyll content (including chl a, b, and carotenoids), 0.2 g of fresh leaves in the same position were selected. The samples were scissored into small pieces and placed in 10 mL test tubes containing 96% ethanol solution and kept in the dark. The tubes were incubated in water at 40 °C for 3 h. Using a spectrophotometer, samples were examined at 470, 646, and 663 nm when the leaf color changed from green to white, following the method of [33].

2.3. Statistical Analysis

The Analysis of two years (2017 and 2018) was performed in a block design including three levels of N and two cultivars based on a randomized complete block design. Analysis of variance (ANOVA) was conducted using Mstate-C [34]. The least significant difference test (LSD) was used to assess when the F values were significant at the (p ≤ 0.05) probability level.

3. Results

3.1. Germination Percentage

Germination was affected by N, cultivar, year, and interactions between N, cultivar, and year. Germination was affected by N, cultivar, and the interaction of these two factors on 4, 10, 16, and 22 days after sowing in the first year and on the 4th and 16th day after sowing in the second year, respectively (Table 1 and Table 2). However, there was no significant differences in germination of sorghum on 10 and 22 days after sowing the second year. Compared to cultivar V2, V1 had significantly lower germination rates on 4, 10, and 16 days after sowing in both years, 37.9 and 10.7%, 38.1 and 5.4%, and 16.3 and 2.5%, respectively. During 2017, compared to N1, N3 had significantly higher germination rates on 4, 10, and 22 days after sowing, respectively, with 14.0, 18.7, and 1.0%. However, N2 significantly reduced the germination rate compared to N1, 28.5 and 1.3% on the 4th day and 32.8 and 20.2% on the 16th day after sowing in both years. N3 germination rate decreased by 3.5, 5.8, and 11.3% on 4, 10, and 16 days after sowing in the second year.

3.2. Leaf Parameters

The length, width, weight, and specific weight of sorghum leaves were affected by N rate and cultivar (Table 3). Leaf length was reduced by 9.1% in V1 cultivar compared to V2. Nitrogen application increased leaf length by 6.2 and 7.5% for N2 and N3 compared to N1.
In addition, N2 increased the leaf width by 7.6% and N3 by 12.8% compared to N1. V1 performed better with a 15.5% increase in leaf width compared to V2.
Similarly to leaf width, application of N2 and N3 increased the leaf weight by 1.2 and 10.8%, compared to N1, respectively. Leaf weight decreased by 21.3% in V1 compared to V2.
In addition, the specific leaf weights of N2 and N3 increased by 11.6 and 23.5%, respectively, compared to N1. The leaf weight of V1 was reduced by 60.0% compared to V2.

3.3. Stem Weight, Plant Height, and Number of Panicles Plant−1

Different N applications and cultivars had significant effects on stem weight, plant height, and panicle number (Table 4). Compared to V2, stem weight increased by 10.8% in V1. Compared to N1, stem weight increased by 4.9% in N2 and 27.4% in N3.
In addition, application of N2 and N3 increased plant height by 1.7 and 2.5% compared to N1. Plant height was reduced by 14.3% in V1 compared to V2.
Furthermore, data for panicles of sorghum were influenced by different levels of N rates and cultivars. Compared to V2, V1 significantly increased the number of panicles plant−1 by 321.8 and 563.0%, respectively. The twice obtained data on panicles was significantly reduced when the rate of nitrogen fertilization increased. N2 reduced the number of panicle plants−1 by 19.8 and 51.2%, N3 by 32.2 and 46.9% compared to N1.

3.4. Activities of Superoxide Dismutase (SOD), Catalase (CAT), Peroxidase (POD), and Content of Soluble Protein

In those two years, N rate and cultivar had significant effects on SOD and CAT activity in both growing seasons and POD in first year, but there were no significant differences in POD activity in the second year (Table 5).
SOD activity was influenced by cultivar, N, year, and the interactions between cultivar and N, cultivar and year, and the interactions between N and Year. During 2017 and 2018, SOD increased by 8.7 and 21.9% in N2 and 38.5 and 83.3% in N3 rates compared to N1. V1 decreased SOD activity by 10.2 and 21.1% during both growing seasons compared to V2.
Correspondingly, POD was affected by N. The POD activity was increased by 17.0 and 35.2% over the two growing seasons compared to N1. Similarly, N3 increased by 28.7% during 2017 and 17.8% during 2018 compared to N1. Compared to V2, V1 decreased POD activity by 5.4% in the first year and increased by 15.2% in the second year.
Similarly, CAT activity was also affected by N, year, and the interaction between N and year. (Table 6). Compared to V2, V1 reduced CAT by 4.7% in 2017 and increased it by 18.4% in 2018. Compared to N1, N2 increased CAT activity by 15.9 and 82.0% and N3 increased by 53.3 and 89.4% in two years.
Similarly, protein content was significantly affected by cultivar, N, year, and the interactions between N and year. Protein content was significantly affected in both growing seasons (Table 5). In V1, protein content increased by 18.4 and 12.4% in 2017 and 2018 compared to the V2. In N2, the protein content increased by 13.2 and 189.0% and in N3 by 16.1 and 209.0% in both years, respectively, compared to N1.

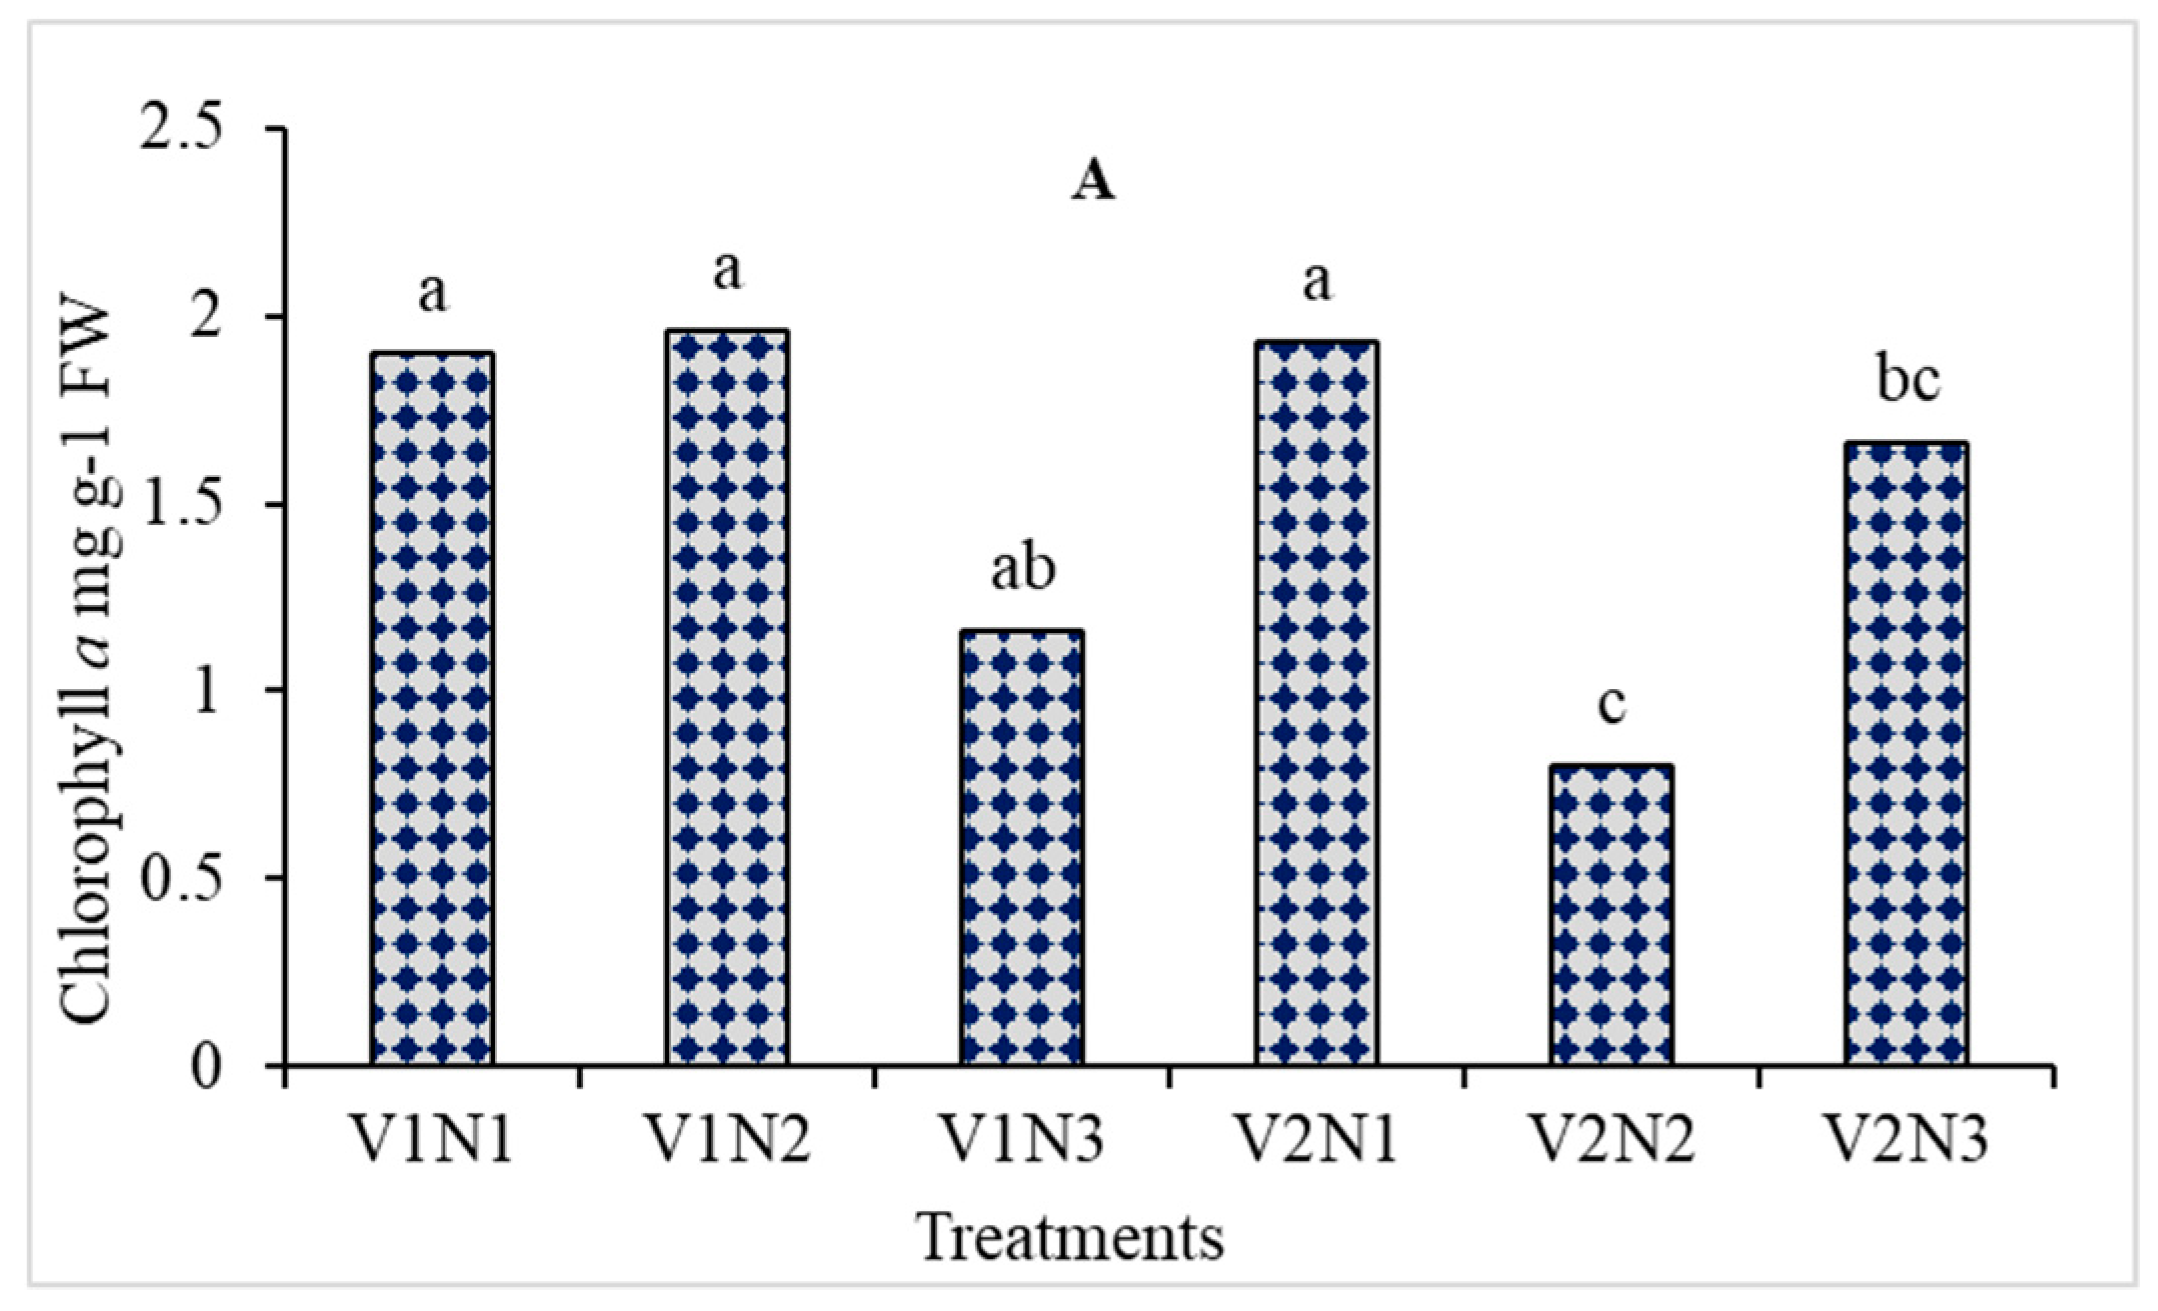
3.5. Chlorophyll a, b, and Carotenoids

Different N levels and cultivars affected chlorophyll content. Chlorophyll content a and carotenoids were significantly affected, but there was no significant response to chlorophyll b (Figure 1A–C). Chlorophyll content decreased when the rate of nitrogen fertilizer application increased compared to N1. Chlorophyll a and carotenoids content decreased by 26.2 and 23.1% when N1 was applied and by 27.7 and 36.26% when N3 was applied, respectively.

4. Discussion

In the current study, higher nitrogen rates significantly increased germination of sorghum, with responses varying among treatments (Table 2). Compared to V1, V2 showed the best response at high nitrogen rates of 10th day and 22th day in both growing seasons. The N increased germination rate of sorghum in the first experimental year and decreased in the second experimental year as compared to the control. The increase in germination rate may be caused by the application of more nitrogen. In the initial stage, plants especially need more nutrients for growth [14]. The decrease in seed germination in the second year could be due to changes in meteorological conditions, a longer growing period or residual effects of the first year of N application [2,35]. However, our findings are similar to those of [36], who reported that higher levels of nitrogen in the field produce toxic organic nitrogen compounds that inhibit seed germination and reduced plant growth.
In addition, our data showed that different rates of N enhanced leaf growth. Leaf length and leaf width increased more in N2 and N3 (Table 3), probably due to higher availability of N. Our results showed that N2 and N3 rates increased leaf length in V2 and leaf width in V1 compared to N1. Our results are consistent with the findings of [37], who reported that leaf length and width increased when exposed to higher N rates. In the current study, high rates of N and increased leaf weight may be a possible indicator for determining higher leaf length and leaf width. Corresponding results are supported by [38] sorghum crop.
Furthermore, in the current study, moderate and high N application of N2 and N3 resulted in increased stem weight (Table 4). In our results, V1 showed higher stem weight at N2 and N3 application rates compared to V2 cultivar. In fact, the stem accumulated more N compared to other growing parts of the plant, which may explain the higher stem weight in the current study. Our results are in accordance with the study of [38], who reported that stems accumulate a higher ratio of NPK, due to which sorghum produces higher stem weight.
In this research, V2 cultivars had fewer panicle strains in N2 and N3, respectively, compared to N1 (Table 3 and Table 4). This could be a result of the lower N requirement for V2 growth. Previous studies have mentioned that sorghum also requires less than 40% of N for growth and yield compared to other crops such as maize [39].
In addition, specific leaf weight and plant height increased in sorghum when more N was applied at N2 and N3 compared to N1. Our results are inconsistent with the study of [40], who reported slower plant growth (e.g., plant height) at higher N applications. Higher N application is a serious problem for crops like sorghum because the toxicity of ammonium may be responsible for reducing plant growth [41]. However, our results are consistent with the findings of [14], who reported higher plant height at 268 N kg ha−1.
Furthermore, different N rates affected SOD, CAT, and POD activity during two growing seasons (Table 6). High N rates significantly increased SOD, CAT, and POD activities in V1 and V2 compared to N1 at the N2 and N3 levels. The increase in antioxidant activity was due to higher N rates indicating stress due to ammonium toxicity (Table 6). Our findings are similar to [2,42], who reported increased ROS production and antioxidant activities due to nutritional stress in plants. The current study demonstrated a significant increase in the antioxidant activities of N2 and N3 high nitrogen in sorghum leaves, which seems to be one of the most necessary mechanisms to regulate crop growth characteristics under stress conditions [21,43].
Moreover, the protein contents were increased due to the difference in the amount of nitrogen applied (Table 6). In the current study, protein content increased significantly when the rate of N fertilizer application was increased in 2017 and 2018 (Table 5). Our results further showed that the protein content of cultivar V2 was reduced in each of the two growing seasons compared to V1. In plants, N-containing compounds like amino acids and proteins are the final products of nitrogen assimilation [44]. As part of this investigation, the protein content of sorghum was measured. As previously reported in rice and ramie [45], increasing the rate of N caused a significant increase in leaf N content. In this study, the average content of soluble proteins was increased with increasing N rate, suggesting that increased N assimilation in sorghum leaves may be a possible cause of the accumulation of these N-containing compounds. Our results are in agreement with the findings of [46], who reported that protein content increased significantly when the rate of nitrogen fertilizer application increased.
Chlorophyll is considered to be an important component of chloroplast and is the photosynthetic process of plants. In this study, increases N rate resulted in decrease contents of chlorophyll a and carotenoid content in sorghum compared to N1 (Figure 1A,C). Further studies showed that for V1 cultivar, the rate of nitrogen application increased chlorophyll a content at N2 and decreased at N3. Similarly, for V2, it increased chlo a at N3 but decreased at N2. In the present study, the decrease in Chlorophyll content could be the result of poor assimilation of nitrogen. However, the lower chlorophyll content in N2 and N3 may be the result of using the assimilation of nitrogen to synthesize proteins and transfer them to other parts of the plant. However, our results are inconsistent with those of [47] for maize [13] for ramie and [21] for cotton, who reported higher chlorophyll content. The higher N application was increased due to higher N assimilation for protein synthesis and was not transferred to other parts of the plant. However, the underlying mechanism of chlorophyll in sorghum at higher nitrogen application needs further study.

5. Conclusions

The current study revealed morpho-physiological and biochemical reactions of sorghum to N application, which can better our understanding of optimized N application to promote plant growth and increase biomass production. The higher rate of N2 and N3 in V1 and V2 resulted in the greatest improvement in seed germination %, leaf length, width, weight, and stem weight and increases in SOD, CAT, POD, and leaf protein in 2017 and 2018 as compared with N1, respectively. The medium rate of N2 reduced the number of panicles plant−1, chlorophyll a, and carotenoid content in both cultivars. The study suggested that higher rates of N3 in V2 are sufficient to regulate morpho-physiological activity and antioxidant capacity of sorghum to achieve high growth and yield. However, more investigations are needed to elucidate the effects of different sources of nitrogen on more sorghum varieties. Therefore, nitrogen fertilizer management is needed to ensure crop growth and yield and to reduce soil degradation.

Author Contributions

Conceptualization, I.A.; Data curation, X.S. and M.E.H.I.; Formal analysis, G.Z. (Guanglong Zhu); Methodology, G.Z. (Guisheng Zhou); Software, E.G.I.S.; Supervision, G.Z. (Guisheng Zhou); Writing—original draft, I.A.; Writing—review and editing, I.A. and G.Z. (Guisheng Zhou) equally contributed to editing the manuscript. All authors have read and agreed to the published version of the manuscript.

Funding

This study was partially supported by the National Key Research and Development Program of China (2018YFE0108100), the Forestry Science and Technology Innovation and Promotion Program of Jiangsu Province (LYKJ (2019)47), the Modern Agricultural Industry Development Program of Jiangsu Province (2019), and the Rural Revitalization Program of Xinghua City (2019), the Open Project Program of Joint International Research Laboratory of Agriculture and Agri-Product Safety, the Ministry of Education of China, Yangzhou University (JILAR-KF202004, JILAR-KF202106), Postgraduate Research & Practice Innovation Program of Jiangsu Province (SJCX21_1624), as well as the key disciplines of higher education in Jiangsu Province.

Institutional Review Board Statement

Not applicable.

Informed Consent Statement

Not applicable.

Data Availability Statement

Not applicable.

Conflicts of Interest

The authors declared no conflicts of interest.

Abbreviations

DAS: day after sowing; CAT: catalase; POD: peroxidase; SOD: superoxide dismutase.

References

  1. Vitousek, P.M.; Aber, J.D.; Howarth, R.W.; Likens, G.E.; Matson, P.A.; Schindler, D.W.; Schlesinger, W.H.; Tilman, D.G. Human alteration of the global nitrogen cycle: Sources and consequences. Ecol. Appl. 1997, 7, 737–750. [Google Scholar] [CrossRef] [Green Version]
  2. Ahmad, I.; Zhou, G.; Zhu, G.; Ahmad, Z.; Song, X.; Jamal, Y.; Ibrahim, M.E.H.; Nimir, N.E.A. Response of boll development to macronutrients application in different cotton genotypes. Agronomy 2019, 9, 322. [Google Scholar] [CrossRef] [Green Version]
  3. Singh, M.; Khan, M.M.A.; Naeem, M. Effect of nitrogen on growth, nutrient assimilation, essential oil content, yield and quality attributes in Zingiber officinale Rosc. J. Saudi Soc. Agric. Sci. 2016, 15, 171–178. [Google Scholar] [CrossRef] [Green Version]
  4. Ding, L.; Gao, C.; Li, Y.; Li, Y.; Zhu, Y.; Xu, G.; Shen, Q.; Kaldenhoff, R.; Kai, L.; Guo, S. The enhanced drought tolerance of rice plants under ammonium is related to aquaporin (AQP). Plant Sci. 2015, 234, 14–21. [Google Scholar] [CrossRef]
  5. Guo, S.; Zhou, Y.; Shen, Q.; Zhang, F. Effect of ammonium and nitrate nutrition on some physiological processes in higher plants-growth, photosynthesis, photorespiration, and water relations. Plant Biol. 2007, 9, 21–29. [Google Scholar] [CrossRef] [PubMed]
  6. Ibrahim, M.E.H.; Zhu, X.; Zhou, G.; Ali, A.A.; Ahmad, I.; Farah, G.A. Nitrogen fertilizer alleviated negative impacts of NaCl on some physiological parameters of wheat. Pak. J. Bot. 2018, 50, 2097–2104. [Google Scholar]
  7. Prinsi, B.; Espen, L. Mineral nitrogen sources differently affect root glutamine synthetase isoforms and amino acid balance among organs in maize. BMC Plant Biol. 2015, 15, 96. [Google Scholar] [CrossRef] [Green Version]
  8. Ikemoto, Y.; Teraguchi, M.; Kobayashi, Y. Plasma levels of nitrate in congenital heart disease: Comparison with healthy children. Pediatr. Cardiol. 2002, 23, 132–136. [Google Scholar] [CrossRef]
  9. Yañez-Mansilla, E.; Cartes, P.; Reyes-Díaz, M.; Ribera-Fonseca, A.; Rengel, Z.; Alberdi, M. Leaf nitrogen thresholds ensuring high antioxidant features of Vaccinium corymbosum cultivars. J. Soil Sci. Plant Nutr. 2015, 15, 574–586. [Google Scholar] [CrossRef]
  10. Kong, L.; Xie, Y.; Hu, L.; Si, J.; Wang, Z. Excessive nitrogen application dampens antioxidant capacity and grain filling in wheat as revealed by metabolic and physiological analyses. Sci. Rep. 2017, 7, 1–14. [Google Scholar] [CrossRef]
  11. Almodares, A.; Jafarinia, M.; Hadi, M. The effects of nitrogen fertilizer on chemical compositions in corn and sweet sorghum. Agri. Enviro. Sci. 2009, 6, 441–446. [Google Scholar]
  12. Almodares, A.; Taheri, R.; Chung, M.; Fathi, M. The effect of nitrogen and potassium fertilizers on growth parameters and carbohydrate contents of sweet sorghum cultivars. J. Environ. Biol. 2008, 29, 849–852. [Google Scholar] [PubMed]
  13. Rehman, M.; Yang, M.; Fahad, S.; Saleem, M.H.; Liu, L.; Liu, F.; Deng, G. Morpho-physiological traits, antioxidant capacity, and nitrogen metabolism in ramie under nitrogen fertilizer. J. Agron. 2020, 112, 2988–2997. [Google Scholar] [CrossRef]
  14. Heitman, A.; Castillo, M.; Smyth, T.; Crozier, C. Stem, Leaf, and Panicle Yield and Nutrient Content of Biomass and Sweet Sorghum. J. Agron. 2018, 110, 1659–1665. [Google Scholar] [CrossRef] [Green Version]
  15. Erickson, J.E.; Woodard, K.R.; Sollenberger, L.E. Optimizing sweet sorghum production for biofuel in the southeastern USA through nitrogen fertilization and top removal. Bioenergy Res. 2012, 5, 86–94. [Google Scholar] [CrossRef]
  16. Wortmann, C.S.; Liska, A.; Ferguson, R.B.; Lyon, D.J.; Klein, R.; Dweikat, I. Dryland performance of sweet sorghum and grain crops for biofuel in Nebraska. J. Agron. 2010, 102, 319–326. [Google Scholar] [CrossRef] [Green Version]
  17. Akinseye, F.M.; Ajeigbe, H.A.; Traore, P.C.; Agele, S.O.; Zemadim, B.; Whitbread, A. Improving sorghum productivity under changing climatic conditions: A modelling approach. Field Crops Res. 2020, 246, 107685. [Google Scholar] [CrossRef]
  18. Assefa, Y.; Staggenborg, S.A.; Prasad, V.P. Grain sorghum water requirement and responses to drought stress: A review. Crop Manag. 2010, 9, 1–11. [Google Scholar] [CrossRef] [Green Version]
  19. Sekoli, M.; Morojele, M. Sorghum productivity trends and growth rate for Lesotho. Glob. J. Agric. Res. 2016, 4, 52–57. [Google Scholar]
  20. Adams, C.B.; Erickson, J.E.; Singh, M.P. Investigation and synthesis of sweet sorghum crop responses to nitrogen and potassium fertilization. Field Crops Res. 2015, 178, 1–7. [Google Scholar] [CrossRef]
  21. Ahmad, I.; Zhou, G.; Zhu, G.; Ahmad, Z.; Song, X.; Hao, G.; Jamal, Y.; Ibrahim, M.E.H. Response of leaf characteristics of BT cotton plants to ratio of nitrogen, phosphorus, and potassium. Pak. J. Bot. 2021, 53, 873–881. [Google Scholar] [CrossRef]
  22. Diallo, B.; Li, M.; Tang, C.; Ameen, A.; Zhang, W.; Xie, G.H. Biomass yield, chemical composition and theoretical ethanol yield for different genotypes of energy sorghum cultivated on marginal land in China. Ind. Crops Prod. 2019, 137, 221–230. [Google Scholar] [CrossRef]
  23. Giménez Luque, E.; Delgado Fernández, I.C.; Gómez Mercado, F. Effect of salinity and temperature on seed germination in Limonium cossonianum. J. Bot. 2013, 91, 12–16. [Google Scholar] [CrossRef]
  24. Gopalakrishnan, S.; Srinivas, V.; Kumar, A.A.; Umakanth, A.V.; Addepally, U.; Rao, P.S. Composting of Sweet Sorghum Bagasse and its Impact on Plant Growth Promotion. Sugar Tech 2020, 22, 143–156. [Google Scholar] [CrossRef]
  25. Shukla, S.; Felderhoff, T.J.; Saballos, A.; Vermerris, W. The relationship between plant height and sugar accumulation in the stems of sweet sorghum (Sorghum bicolor (L.) Moench). Field Crops Res. 2017, 203, 181–191. [Google Scholar] [CrossRef]
  26. Ibrahim, M.E.H.; Ali, A.Y.A.; Elsiddig, A.M.I.; Zhou, G.; Nimir, N.E.A.; Ahmad, I.; Suliman, M.S.E.; Elradi, S.B.M.; Salih, E.G.I. Biochar improved sorghum germination and seedling growth under salinity stress. J. Agron. 2020, 112, 911–920. [Google Scholar] [CrossRef]
  27. Bradford, M.M. A rapid and sensitive method for the quantitation of microgram quantities of protein utilizing the principle of protein-dye binding. Anal. Biochem. 1976, 72, 248–254. [Google Scholar] [CrossRef]
  28. Liu, C.; Wang, Y.; Pan, K.; Zhu, T.; Li, W.; Zhang, L. Carbon and nitrogen metabolism in leaves and roots of dwarf bamboo (Fargesia denudata Yi) subjected to drought for two consecutive years during sprouting period. J. Plant. Growth Regul. 2014, 33, 243–255. [Google Scholar] [CrossRef]
  29. Tariq, A.; Pan, K.; Olatunji, O.A.; Graciano, C.; Li, Z.; Sun, F.; Zhang, L.; Wu, X.; Chen, W.; Song, D. Phosphorous fertilization alleviates drought effects on Alnus cremastogyne by regulating its antioxidant and osmotic potential. Sci. Rep. 2018, 8, 1–11. [Google Scholar] [CrossRef]
  30. Dhindsa, R.S.; Plumb-Dhindsa, P.; Thorpe, T.A. Leaf senescence: Correlated with increased levels of membrane permeability and lipid peroxidation, and decreased levels of superoxide dismutase and catalase. J. Exp. Bot. 1981, 32, 93–101. [Google Scholar] [CrossRef]
  31. Aebi, H. Catalase. In Methods in Enzymatic Analysis; Bergmeyer, H.U., Ed.; Academic Press Inc.: New York, NY, USA, 1974; Volume 3, pp. 673–686. [Google Scholar]
  32. Thomas, R.L.; Jen, J.J.; Morr, C.V. Changes in soluble and bound peroxidase—IAA oxidase during tomato fruit development. J. Food Sci. 1982, 47, 158–161. [Google Scholar] [CrossRef]
  33. Lichtenthaler, H.K.; Wellburn, A.R. Determinations of total carotenoids and chlorophylls a and b of leaf extracts in different solvents. Biochem. Soc. Trans. 1983, 11, 591–592. [Google Scholar] [CrossRef] [Green Version]
  34. Freed, R.; Eisensmith, S.; Goetz, S.; Reicosky, D.; Smail, V.; Welberg, P. User’s Guide to MSTAT-C.; Michigan State University: East Lansing, MI, USA, 1991. [Google Scholar]
  35. Amaducci, S.; Monti, A.; Venturi, G. Non-structural carbohydrates and fibre components in sweet and fibre sorghum as affected by low and normal input techniques. Ind. Crops Prod. 2004, 20, 111–118. [Google Scholar] [CrossRef]
  36. Zhou, R.; Zhou, R.; Zhang, X.; Zhuang, J.; Yang, S.; Bazaka, K.; Ostrikov, K.K. Effects of atmospheric-pressure N 2, He, air, and O 2 microplasmas on mung bean seed germination and seedling growth. Sci. Rep. 2016, 6, 32603. [Google Scholar] [CrossRef] [PubMed] [Green Version]
  37. Kwon, S.-J.; Kim, H.-R.; Roy, S.K.; Kim, H.-J.; Boo, H.-O.; Woo, S.-H.; Kim, H.-H. Effects of nitrogen, phosphorus and potassium fertilizers on growth characteristics of two species of bellflower (Platycodon grandiflorum). J. Crop Sci. Biotechnol. 2019, 22, 481–487. [Google Scholar] [CrossRef]
  38. Ameen, A.; Yang, X.; Chen, F.; Tang, C.; Du, F.; Fahad, S.; Xie, G.H. Biomass yield and nutrient uptake of energy sorghum in response to nitrogen fertilizer rate on marginal land in a semi-arid region. BioEnergy Res. 2017, 10, 363–376. [Google Scholar] [CrossRef]
  39. Smith, G.; Buxton, D. Temperate zone sweet sorghumethanol production potential. Bioresour. Technol. 1993, 43, 71–75. [Google Scholar] [CrossRef]
  40. Zhang, M.; Sun, D.; Niu, Z.; Yan, J.; Zhou, X.; Kang, X. Effects of combined organic/inorganic fertilizer application on growth, photosynthetic characteristics, yield and fruit quality of Actinidia chinesis cv ‘Hongyang’. Glob. Ecol. 2020, 22, e00997. [Google Scholar] [CrossRef]
  41. Cao, T.; Xie, P.; Ni, L.; Zhang, M.; Xu, J. Carbon and nitrogen metabolism of an eutrophication tolerative macrophyte, Potamogeton crispus, under NH4+ stress and low light availability. Environ. Exp. Bot. 2009, 66, 74–78. [Google Scholar] [CrossRef]
  42. Ahn, S.J.; Shin, R.; Schachtman, D.P. Expression of KT/KUP genes in Arabidopsis and the role of root hairs in K+ uptake. Plant Physiol. 2004, 134, 1135–1145. [Google Scholar] [CrossRef] [Green Version]
  43. Liu, R.-X.; Zhou, Z.-G.; Guo, W.-Q.; Chen, B.-L.; Oosterhuis, D.M. Effects of N fertilization on root development and activity of water-stressed cotton (Gossypium hirsutum L.) plants. Agric. Water Manag. 2008, 95, 1261–1270. [Google Scholar] [CrossRef]
  44. Sánchez, E.; Rivero, R.M.; Ruiz, J.M.; Romero, L. Changes in biomass, enzymatic activity and protein concentration in roots and leaves of green bean plants (Phaseolus vulgaris L. cv. Strike) under high NH4NO3 application rates. Sci. Hortic. 2004, 99, 237–248. [Google Scholar] [CrossRef]
  45. dos Santos, A.M.; Lis Martinez Stark, E.M.; Fernandes, M.S.; de Souza, S.R. Effects of seasonal nitrate flush on nitrogen metabolism and soluble fractions accumulation in two rice varieties. J. Plant Nutr. 2007, 30, 1371–1384. [Google Scholar] [CrossRef]
  46. Ahmed, S.O.; Abdalla, A.W.H.; Inoue, T.; Ping, A.; Babiker, E.E. Nutritional quality of grains of sorghum cultivar grown under different levels of micronutrients fertilization. Food Chem. 2014, 159, 374–380. [Google Scholar] [CrossRef] [PubMed]
  47. Correia, C.M.; Pereira, J.M.M.; Coutinho, J.F.; Björn, L.O.; Torres-Pereira, J.M. Ultraviolet-B radiation and nitrogen affect the photosynthesis of maize: A Mediterranean field study. Eur. J. Agron. 2005, 22, 337–347. [Google Scholar] [CrossRef]
Figure 1. Effects of N rates on (A) chlorophyll a content, (B) chlorophyll b content, and (C) carotenoids, of two sorghum varieties. Different lowercase letters on the bars in the figures represent statistical difference at the 0.05 probability level by an ANOVA-protected test.
Agronomy 12 00501 g001aAgronomy 12 00501 g001b
Table 1. Significance test for source of variation (mean square), and their effects on germination percentage 4, 10, 16, and 22 days after sowing during 2017 and 2018.
SourceDay after Sowing
4101622
C (cultivar)2187 **2187 **752 ns8 **
R (ratio of N)501 *500 *2668 **478 **
Y (year)3400 **1045 **7752 **3072 **
C × R2185 **1317 **5027 **1272 **
C × Y1160 **1452 **352 ns75 ns
R × Y551 *730 **277 ns267 ns
C × R × Y479 *727 **652 ns526 **
Error148.7013126399
Year
201733 a34.8 a49 b67 b
201822 b28.6 b66 a77 a
N levels
N128 ab32 ab65 a74 a
N223 b27 b48 b68 b
N330 a35 a60 a74 a
Cultivars
CFSH3023 b27 b55 a72 a
Siyong318032 a36 a60 a72 a
C: cultivar; R: rate of nitrogen; Y: year. * and ** significant at 5 probability level, respectively. Different letters in the same column of the table are statistically different at the 0.05 level of probability by ANOVA-protected test.
Table 2. Effects of N rates on sorghum germination% with two sorghum varieties, during 2017 and 2018.
YearsCultivarsRates of N (Kg ha−1) Day after Sowing
4101622
2017 CFSH30023.3 b23.3 b41.7 ab62.7 ab
15030.0 ab30.0 ab48.3 ab69.7 ab
30023.3 b26.7 ab45.0 ab65.7 ab
Siyong3180046.7 ab48.3 ab70.0 a78.3 a
15020.0 b22.3 b26.7 b50.0 b
30056.7 a58.3 a65.0 a76.3 ab
2018CFSH30018.3 b28.3 a73.3 a80.0 a
15026.0 a30.0 a70.0 ab80.0 a
30018.3 b25.0 a53.3 ab75.0 a
Siyong3180026.7 a30.0 a75.0 ab78.3 a
15018.3 b28.3 a48.3 b73.3 a
30018.3 b30.0 a78.3 a80.0 a
Sorghum plants were sampled on 4, 10, 16, and 22 days after sowing during 2017 and 2018. Different letters in the same column within the same year in the table were tested for statistical differences by ANOVA-protection at the 0.05 level of probability.
Table 3. Effects of N rates on leaf length, width, and specific leaf weight of two sorghum varieties during 2017.
CultivarN (Kg ha−1)Leaf Length
(cm)
Leaf Width
(cm)
Leaf Weight
(g)
Specific Leaf Weight
(g)
CFSH30015.1 b4.2 ab34.6 b1.4 c
15016.2 ab4.5 ab34.9 b1.5 c
30016.5 ab4.9 a42.4 ab1.6 bc
Siyong3180016.6 ab3.6 b46.9 a2.1 abc
15018.7 a3.8 b47.5 a2.6 ab
30017.6 ab4.0 ab47.9 a2.7 a
Sorghum plants were sampled on the 97th day after sowing. Different letters in the same column of the table are statistically different at the 0.05 level of probability by ANOVA-protected test.
Table 4. Effects of N rates on stem weight, plant height, and number of panicles plant−1 of two sorghum varieties during 2017.
CultivarsN (kg ha−1)Stem Weight
(g)
Plant Height (cm)Growth Stages
Panicle InitiationReproduction
Number of Panicle Plant−1Number of Panicle Plant−1
CFSH30073.3 b21.0 b12.1 a53.4 a
15077.1 b22.3 ab4.7 ab34.1 ab
300104.3 a24.1 ab12.4 a48.8 a
Siyong3180071.1 b26.1 a3.4 ab19.1 ab
15075.1 b25.6 a3.5 ab1.0 b
30080 b25.8 a0.0 b0.4 b
Sorghum plants were sampled on the 97th day after sowing. Different letters in the same column in the table are statistically different at the 0.05 probability level by an ANOVA-protected test.
Table 5. Effects of N rates on super oxide dismutase (SOD), catalase (CAT), peroxidase (POD), and total soluble protein of two sorghum varieties, during 2017 and 2018.
CultivarN (kg ha−1)2017 2018
SOD
(µg min−1)
POD
(µg min−1)
CAT
(µg min−1)
Soluble Protein (mg g−1)SOD
(µg min−1)
POD
(µg min−1)
CAT
(µg min−1)
Soluble Protein (mg g−1)
CFSH30016.2 b296.4 b307.4 b10.8 b10.8 b382.5 a9.3 b47.7 ab
15016.2 b401.0 ab367.9 ab33.3 a12.2 b455.8 a60.8 ab53.2 ab
30023.1 ab417.0 ab482.6 a36.0 a20.9 a448.3 a96.8 a53.9 a
Siyong3180018.2 ab366.7 ab334.6 ab10.0 b12.1 b290.8 a9.0 b40.5 b
15024.5 a373.3 ab375.9 ab26.8 a15.6 ab455 a40.5 ab46.6 ab
30024.4 a435.4 a502.3 a28.4 a20.9 a345 a82.0 ab48.5 ab
Sorghum plants were sampled on the 97th day after sowing. Different letters in the same column in the table are statistically different at the 0.05 probability level by an ANOVA-protected test.
Table 6. Significance test for source of variation (mean square), and their effects on antioxidant enzyme activity during two growing seasons.
SourceSODPODCATSoluble Protein
µg min−1µg min−1µg min−1mg g−1
C (cultivar)200.0 **13,783.7 ns284.0 ns867.0 **
R (ratio of N)597.9 **82,456.0 **145,880.0 **2244.9 **
Y (year)633.1 **5883.0 ns322,133.0 **15,768.8 **
C × R70.3 **2686.0 ns871.0 ns18.4 ns
C × Y38.2 *49,190.4 ns6138.0 ns15.0 ns
R × Y33.0 *22,103.0 ns22,737.0 **612.8 **
C × R × Y11.3 ns22,063.0 ns34.0 ns45.2 ns
Error8.715,094.43867.028.2
Year
201720.4 a381.5 a395.2 a24.2 b
201815.5 b396.3 a49.8 b48.4 a
N levels
N114.3 c333.9 b165.1 c27.3 b
N217.2 b421.3 a211.3 b40.0 a
N322.4 a411.4 a290.9 a41.8 a
Cultivars
CFSH3016.5 b400.17 a220.9 a39.2 a
Siyong318019.3 a377.6 a224.1 a33.5 b
C: cultivar; R: rate of nitrogen; Y: year. * and ** significant at 5 level, respectively. Different letters in the same column of the table are statistically different at the 0.05 level of probability by ANOVA-protected test.
Publisher’s Note: MDPI stays neutral with regard to jurisdictional claims in published maps and institutional affiliations.

