Article

Glyphosate Excessive Use Affects Citrus Growth and Yield: The Vicious (and Unsustainable) Circle in Brazilian Orchards

by
Rodrigo Martinelli
1,*,
Luiz Renato Rufino, Jr.
2,
Ricardo Alcántara-de la Cruz
3,
Patricia Marluci da Conceição
2,
Patricia Andrea Monquero
2 and
Fernando Alves de Azevedo
1
1
Agronomic Institute (IAC), Sylvio Moreira Citrus Center, Cordeirópolis 13490-970, SP, Brazil
2
Campus Araras, Federal University of São Carlos (UFSCar), Araras 13600-970, SP, Brazil
3
Campus Buri, Federal University of São Carlos (UFSCar), Buri 18290-000, SP, Brazil
*
Author to whom correspondence should be addressed.
Agronomy 2022, 12(2), 453; https://doi.org/10.3390/agronomy12020453
Submission received: 7 January 2022 / Revised: 3 February 2022 / Accepted: 7 February 2022 / Published: 11 February 2022

Abstract

:
The excessive use of glyphosate by Brazilian citrus growers leads to a vicious and unsustainable circle: Increasing the glyphosate use and the selection pressure of resistant/tolerant weeds, as well as the phytointoxication of the crop. In addition, there is speculation on the consequences of using glyphosate and the studies are not conclusive. Therefore, this study aimed to evaluate the glyphosate management in citrus orchards by assessing its effects in a 5-year field experiment using different doses and application frequencies. Here, we determine the weed control levels, the orchard growth and fruit yield, as well as the economic viability of the treatments. Higher weed control was observed more often with the increasing frequency of glyphosate application, and occasionally with increasing doses. However, some species predominated even at high glyphosate usage, such as BIDPI (Bidens pilosa (L.)), RAPRA (Raphanus raphanistrum (L.)), and ERICA (Conyza canadensis (L.) Cronquist). Phytotoxicity symptoms were demonstrated up to the fourth year of the orchard, and onwards the plants no longer expressed them. This was a highlight, since there was a decrease over time in growth (up to 5.3 m3) and fruit yield (up to 36.3 t ha−1), with losses that reached −56% of the total income. This is the first report to demonstrate that the increase in glyphosate usage can occasionally increase weed control, but it can also decrease orchard development and its financial viability.

1. Introduction

In perennial crops, such as citrus, weeds live at different phenological stages and at the same time and space with the crop throughout its cycle. Therefore, these crops have a smaller number of herbicides and control opportunities compared with the annual crops, where the control is often conducted in the cultivation intervals and/or using herbicide-resistant cultivars. Fruit crops have fewer herbicide options available, e.g., in Brazil, there are 22 active ingredients (ai) registered for citrus versus 50 ai for soybean, 49 ai for maize, and 52 ai for sugarcane [1].
Chemical weed control is often preferred for Brazilian citrus growers and the majority uses only glyphosate (N-(phosphonomethyl) glycine). Moreover, its applications are usually directed to the planting line, under the canopy of the plants, but can be carried out throughout the inter-row of the orchard. Glyphosate is a non-selective herbicide that is translocated mainly to metabolic drains, which can be distant from the site of application. In addition, its mobile properties in phloem and slow action allow the herbicide to move throughout the plant to kill all the meristems, making it effective even for the control of perennial weeds [2].
In 1974, this herbicide was launched and the applied worldwide volume of glyphosate-based herbicides (GBHs) increased very significantly (>100 times) [3], mainly due to: (i) Its low cost; (ii) increasing application rates in response to weed biotypes resistant to this herbicide; (iii) the broad adoption of resistant cultivars (Roundup Ready®); and (iv) to new usage patterns, such as preharvest, desiccation of cultivated or non-cultivated areas, etc.
In the case of citrus fruits, an increase in the use of glyphosate since its release was due to the control on efficiency and ease of use, which generates a good cost-to-benefit ratio. Due to precisely these characteristics, 
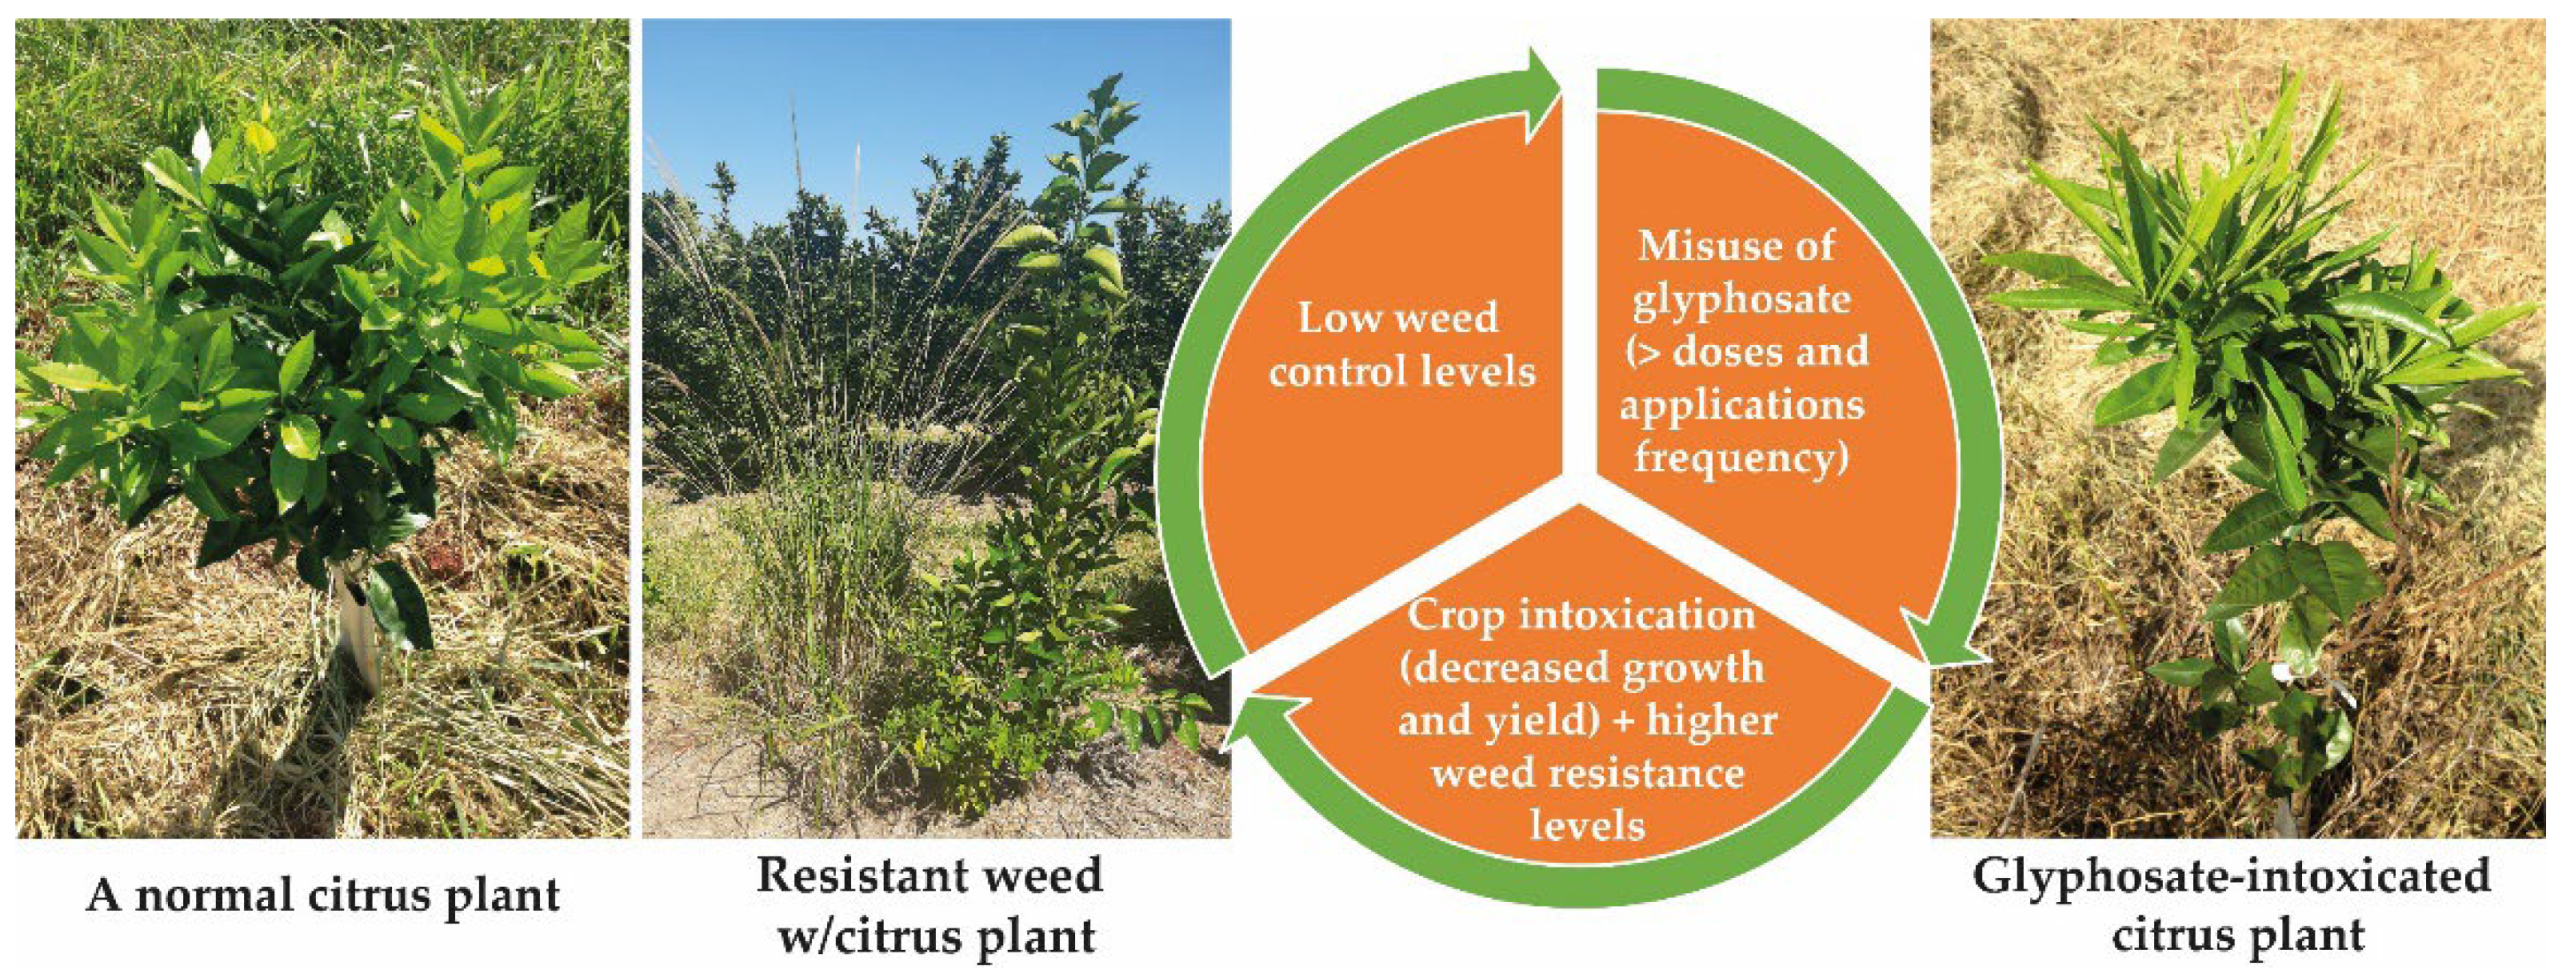
Brazilian citrus growers used glyphosate as the only weed control tool. Therefore, with its intensive use, there was an increase in reports of low control efficacy, related to the selection of resistant weed species biotypes and the higher selection pressure on tolerant species. As a result, most of the citrus growers used glyphosate inappropriately (rather than the use of other herbicides), with increases in dosage and application frequency [4], leading to a vicious circle (Figure 1).
However, many growers do not consider and/or do not have access to two important glyphosate issues: (i) The possible phytointoxication of citrus plants by its contact, absorption, and translocation; and (ii) the increasing and continuous selection of resistant biotypes and tolerant species due to the lack of herbicide rotation with different mechanisms of action, as well as the absence of other weed control strategies, such as integrated weed management (IWM) programs.
In a weed management survey by citrus growers from several Brazilian producing regions, 98% responded that they use glyphosate and 36% do not use other herbicides. Among those who use glyphosate, 73% use dosages above 1000 g acid equivalent (ae) ha−1: 56% between 1000 and 1500 g ae ha−1, 6% from 1500 to 2000 g ae ha−1, and 11% above 2000 g ae ha−1. With regards to the spray frequency (application per growing season): 11% spray once, 47% spray twice, 22% spray three times, 9% spray four times, and 11% spray five or more times—there has been a report of up to 10 applications per growing season [5]. However, the majority of interviewed farmers were medium to large citrus growers, and the lack of information for small growers can even worsen the problem.
With regards to the consequences of using glyphosate, there remains a significant amount of speculation. In addition, the published studies are not conclusive. The action mechanism of glyphosate is unique since it is the only herbicide that acts on the shikimic acid route. It has the capability to inhibit the enzyme EPSP synthase (5-enolpiruvil-chiquimate-3-phosphate-synthase) by competing with the binding site of the phosphoenolpyruvate substrate (PEP). This inhibits the formation of chorismate, which is a precursor to salicylic acid (plant defense hormone) and three aromatic amino acids (tryptophan (Trp), tyrosine (Tyr), and phenylalanine (Phe)). Chorismate serves as a precursor to a wide variety of aromatic compounds that have crucial roles in plant growth, development, reproduction, and defense [6,7]. Therefore, the accumulation of shikimic acid causes carbon drain, reducing the general functioning of other biochemical pathways. This route is responsible for up to 30% of the carbon fixed by photosynthesis, and up to 30% of the dry biomass of the plant [8,9].
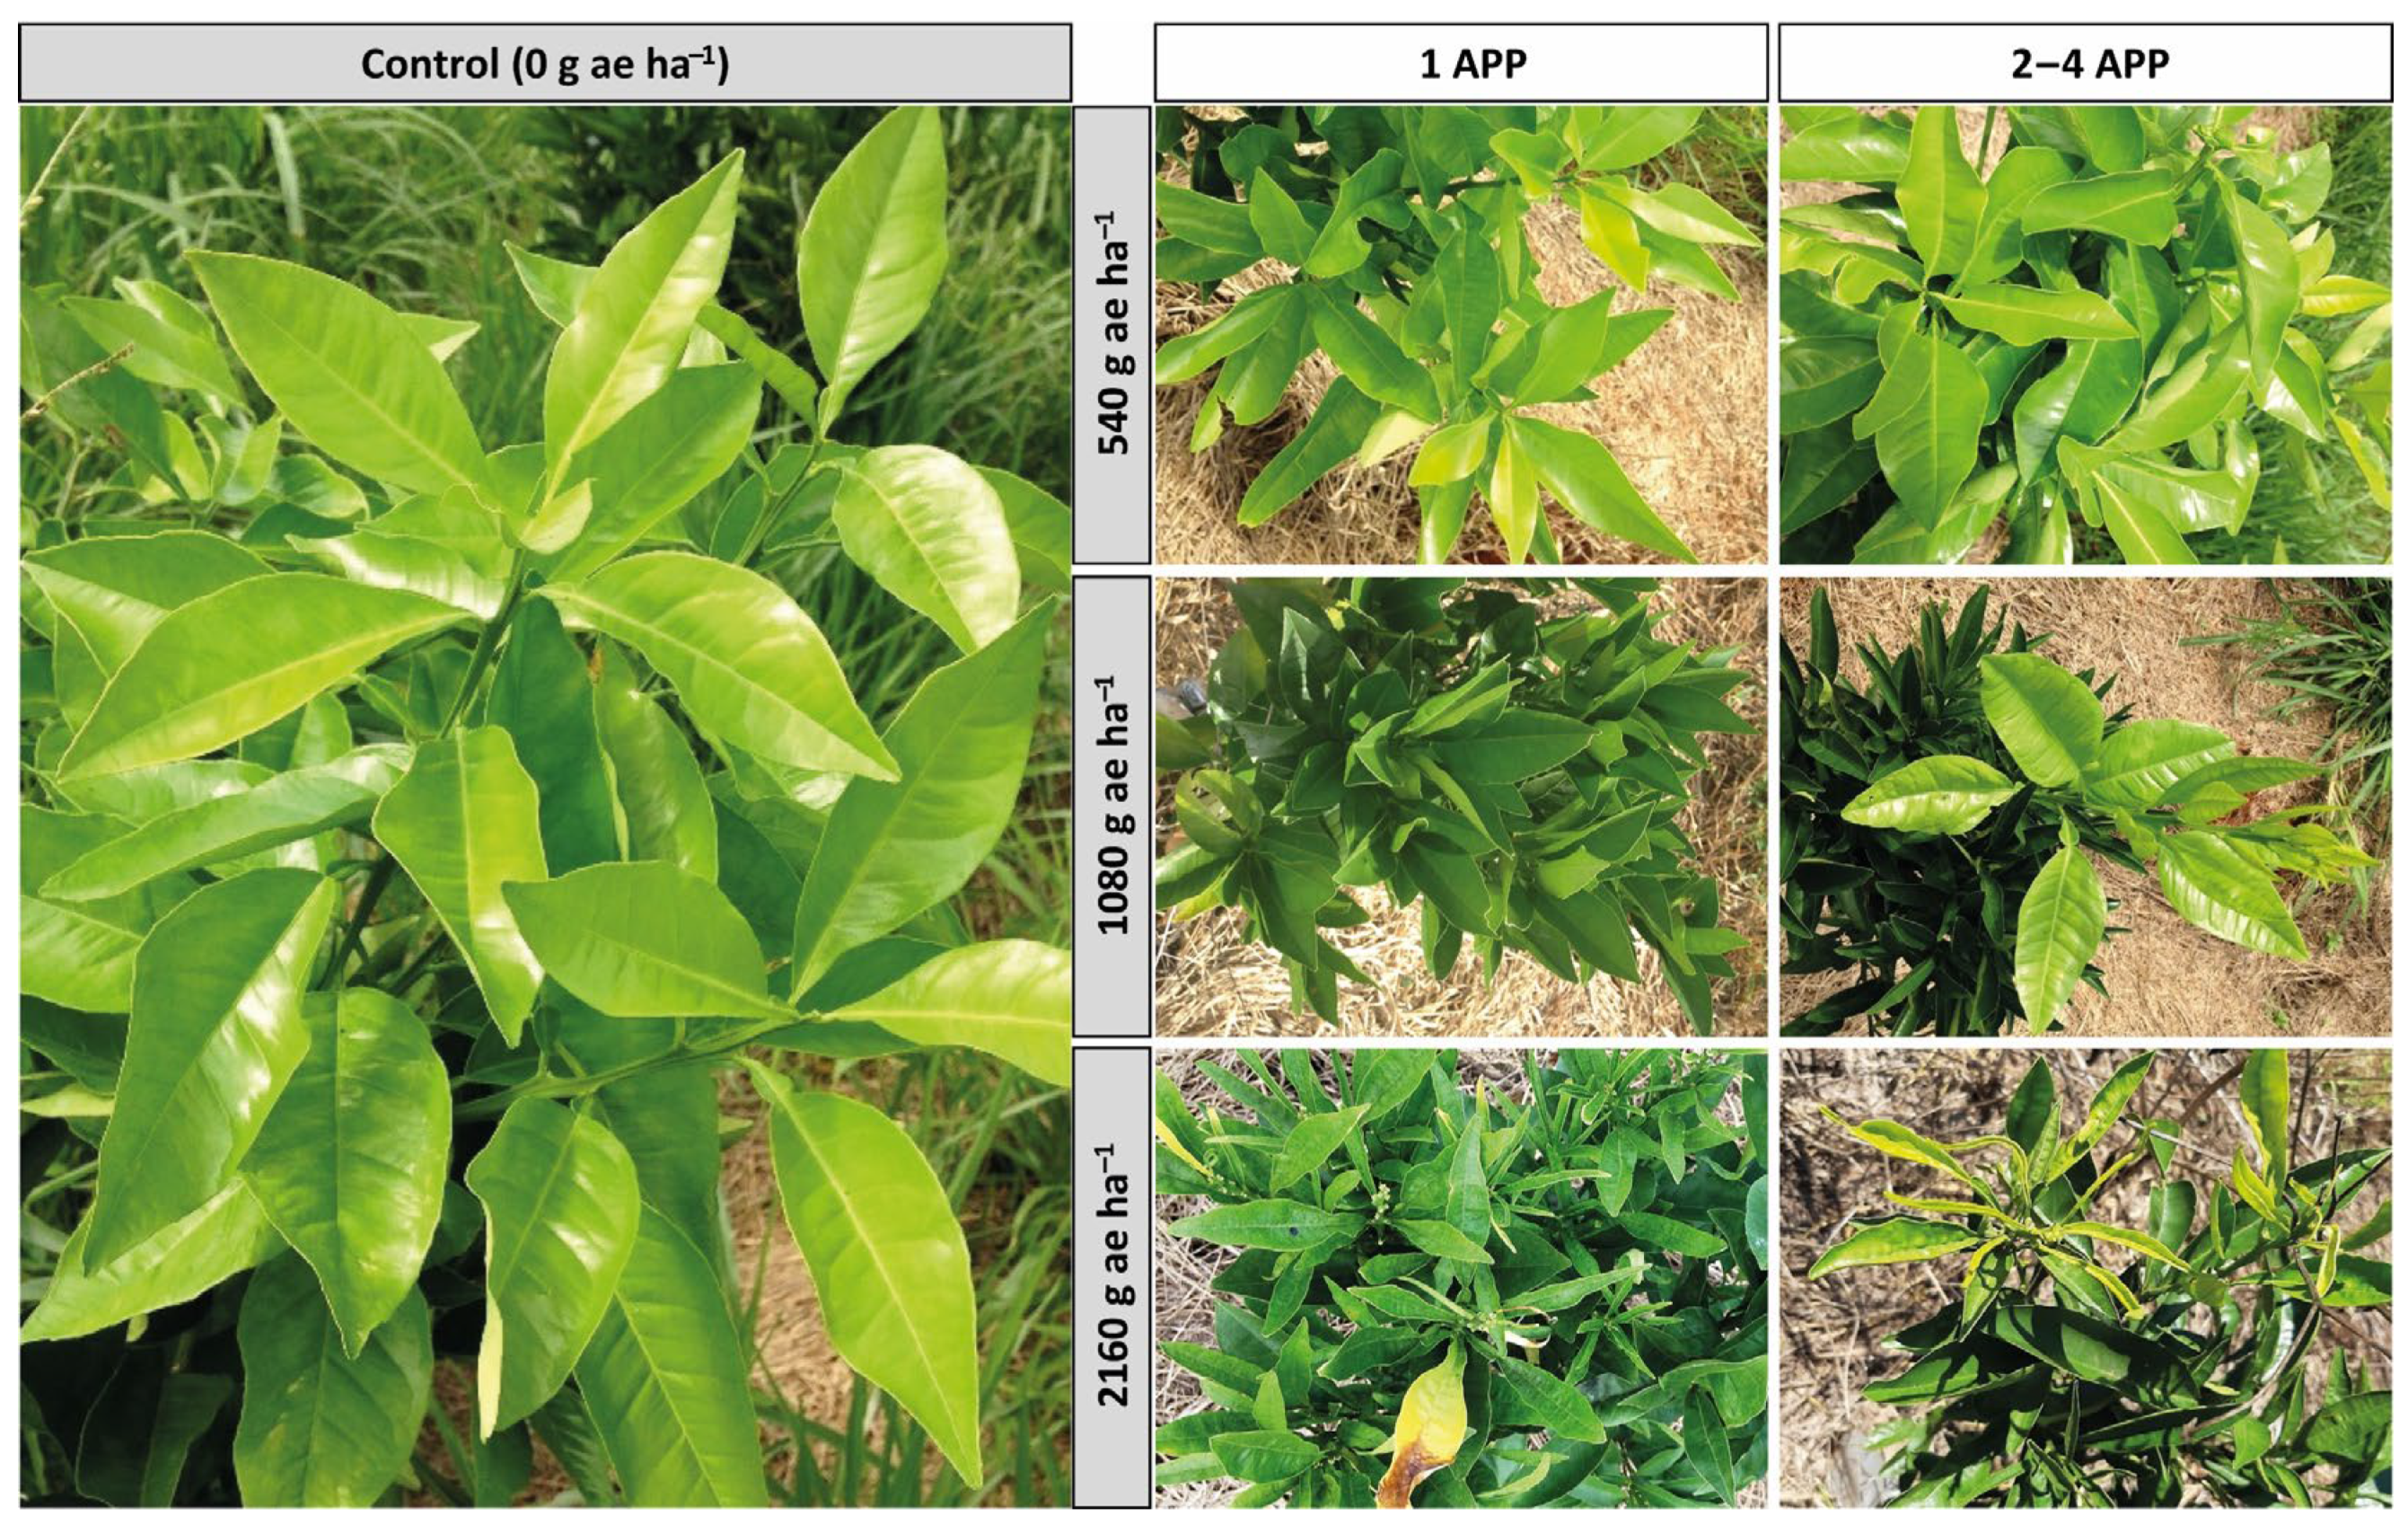
As a result, the continuous use of glyphosate may result in crop damage over time due to the phytotoxicity caused by this herbicide can remain for up to 2 years. Glyphosate phytotoxicity in citrus is characterized by chlorosis, falling of preformed leaves, and malformation of shoots [10], with significant losses for the citrus grower [11]. Moreover, fruit fall was reported for distinct citrus varieties [12]. However, previous studies have demonstrated little toxicity of glyphosate to citrus plants or even a transient effect of this phytointoxication [13,14,15]. In these studies, the evaluations were carried out in a brief time. Therefore, no studies evaluated the effect of long-term glyphosate management in citrus orchards, in addition to the remaining reports of phytointoxication of citrus orchards.
As a result, it is hypothesized that the increase in dose and frequency of glyphosate application does not increase weed control but decreases the growth and production of citrus plants by phytointoxication with this herbicide over time, decreasing the financial return. This 5-year study aims to determine the implications of glyphosate management in citrus orchards, with different doses and application frequencies over five growing seasons. Here, we determine the weed control levels, and in citrus plants, the phytotoxicity levels to glyphosate by visual symptoms, growth, yield, and economic viability.

2. Materials and Methods

2.1. Experiment Installation

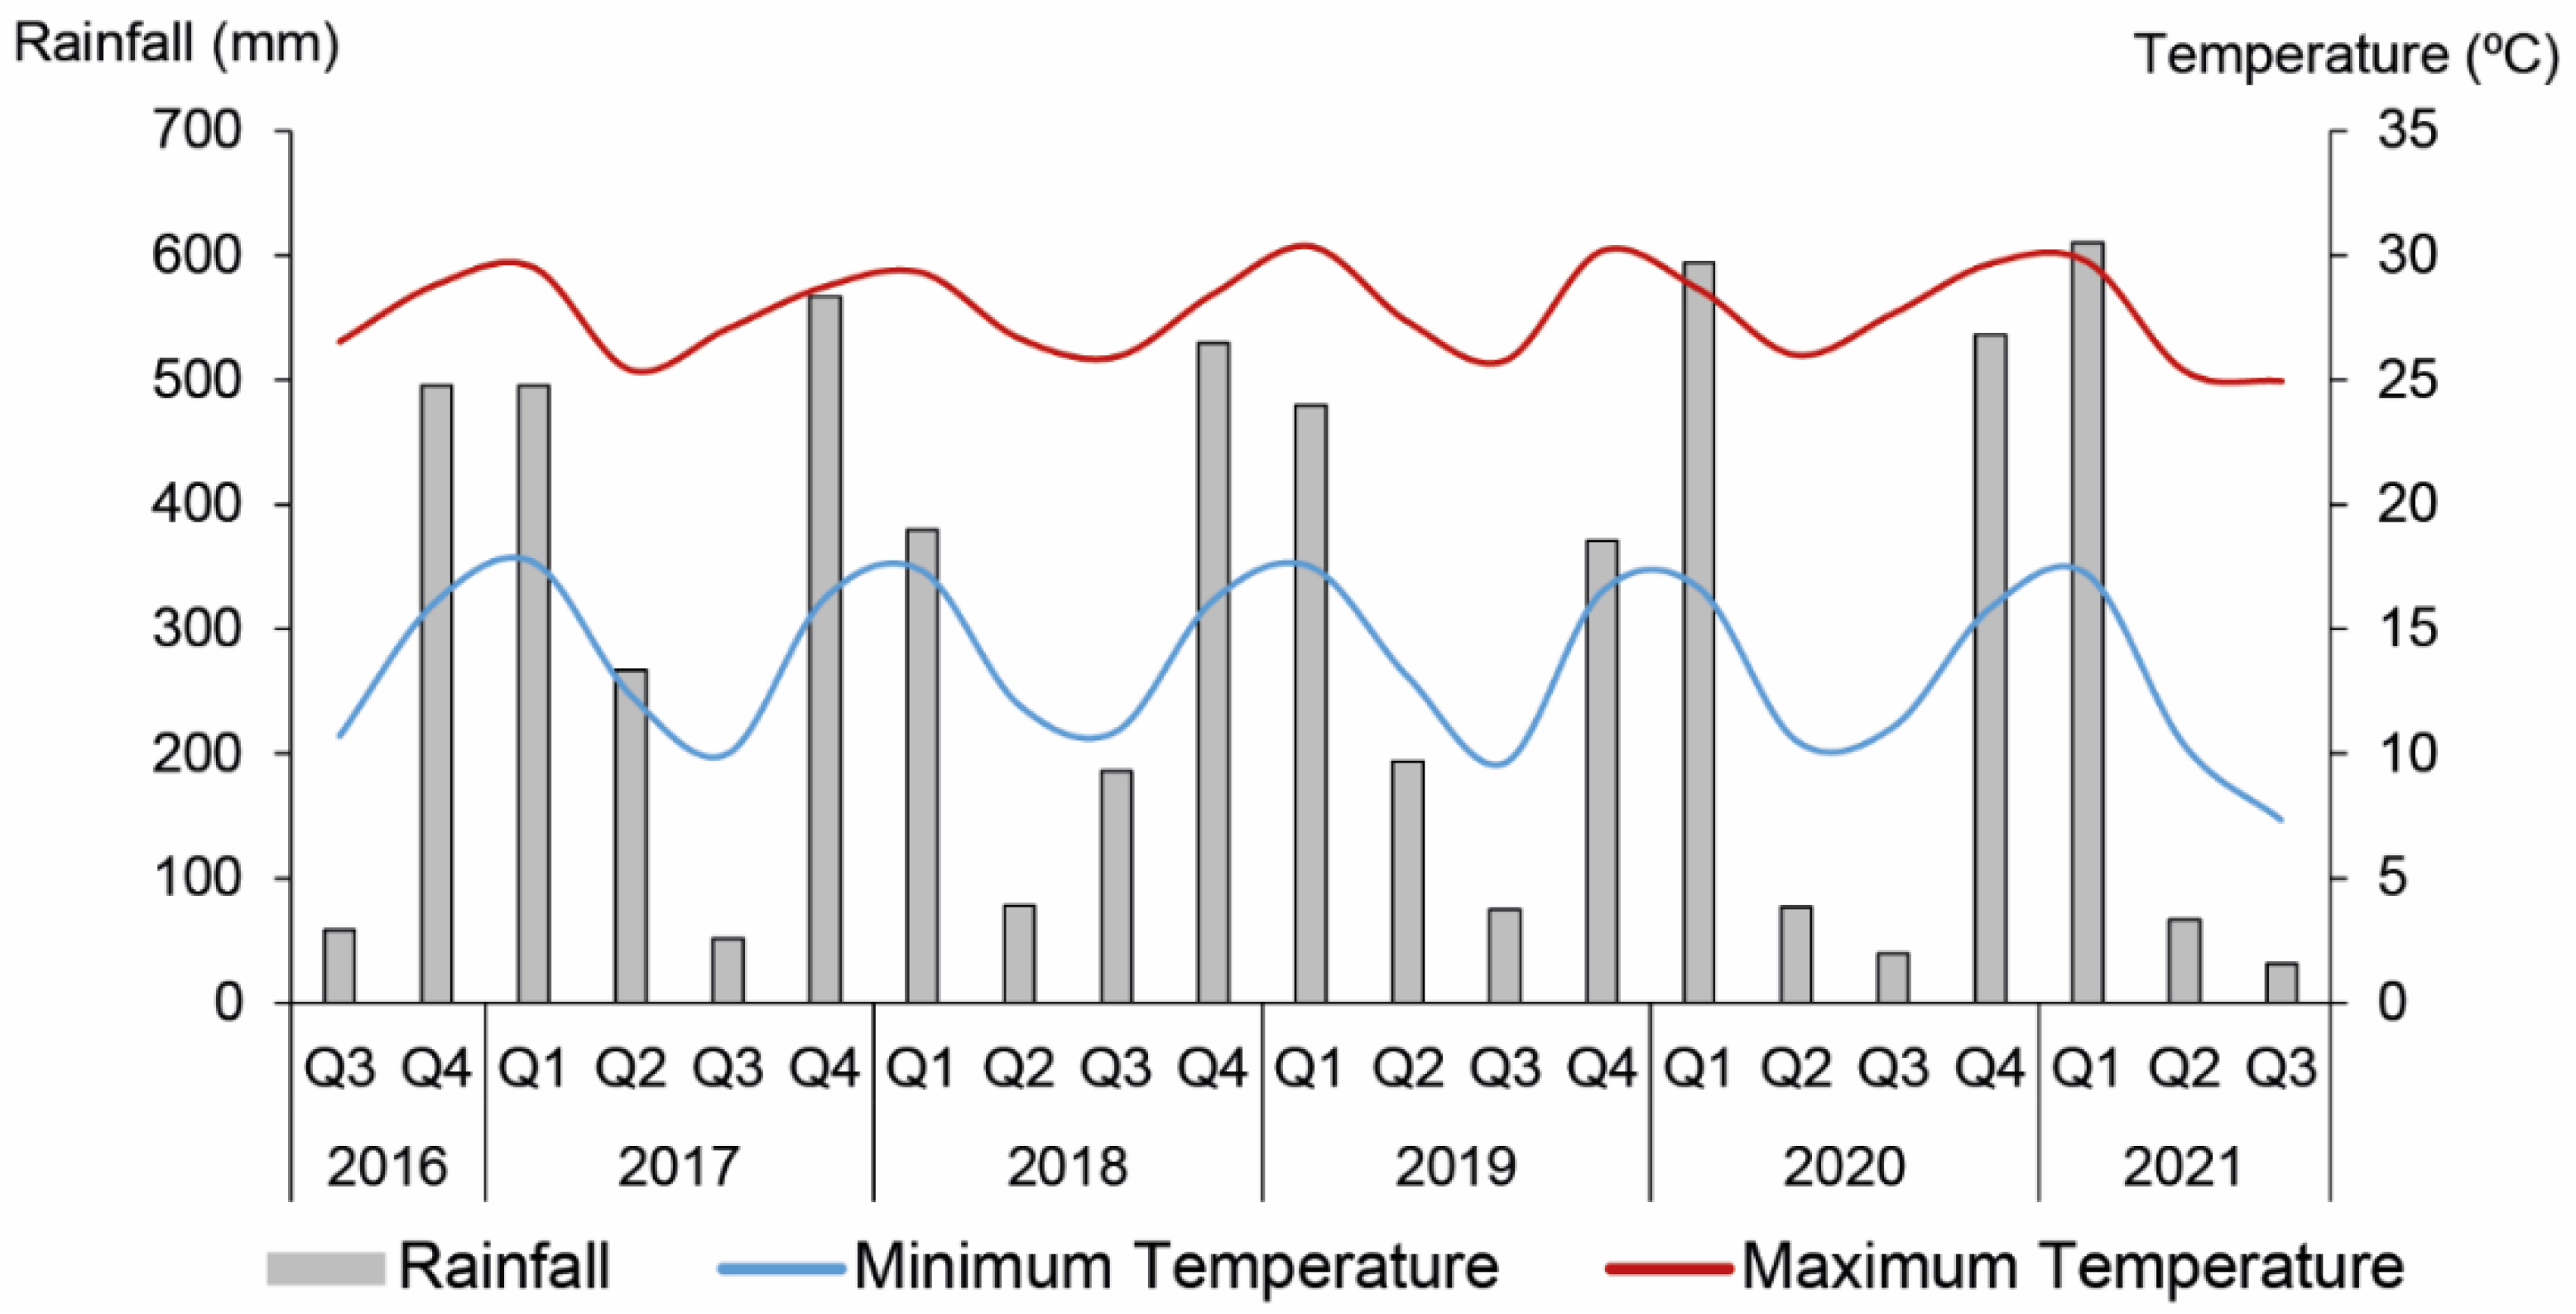
The experiment was conducted in an area previously installed in 2015, at Centro de Citricultura ‘Sylvio Moreira’ (Instituto Agronômico—IAC) in Cordeirópolis (22°27′35″ S, 47°24′27″ W, altitude of 712 m above sea level), State of São Paulo, Brazil, during five growing seasons (August to July: 2016/2017, 2017/2018, 2018/2019, 2019/2020, and 2020/2021). The on-site climate is classified as subtropical (Cwa) and humid, with dry winters (temperatures below 18 °C) and hot summers (temperatures above 22 °C) [16]. Rainfall and temperature data during the experimental period were obtained from monitoring via a meteorological station installed 50 m away from the experiment (Figure A1). The soil was classified as an Orthic Ferralsol (WRB/FAO) (oxisol—Rhodic Hapludox—U.S.D.A. Soil Taxonomy; Latossolo Vermelho distrófico—Brazilian classification) with 64.6% clay, 21.3% sand, and 14.1% silt.
The experimental design used was randomized blocks with 13 treatments and four replications. The treatments were composed of different doses (540 to 2160 g ae ha−1) and application frequencies of glyphosate (1–4 applications per growing season (APP)) (Roundup Original®; 356 g ae L−1): T1: Control, no application; T2: 540 g ae ha−1 (1 APP); T3: 1080 g ae ha−1 (1 APP); T4: 2160 g ae ha−1 (1 APP); T5: 540 g ae ha−1 (2 APP); T6: 1080 g ae ha−1 (2 APP); T7: 2160 g ae ha−1 (2 APP); T8: 540 g ae ha−1 (3 APP); T9: 1080 g ae ha−1 (3 APP); T10: 2160 g ae ha−1 (3 APP); T11: 540 g ae ha−1 (4 APP); T12: 1080 g ae ha−1 (4 APP); T13: 2160 g ae ha−1 (4 APP). Additionally, the treatments with 1 APP were applied in October of each growing season, those with 2 APP were applied in October and December, those with 3 APP in October, December, and February, and those with 4 APP in October, December, February, and April.
The experimental area totaled 0.63 ha. The orchard was composed of Pêra sweet orange (Citrus sinensis (L.) Osbeck) grafted on tangerine Sunki (Citrus sunki (Hayata) hort. Tanaka). In addition, it was distributed in six rows with 70 plants each, totaling 420 plants spaced at 6.0 m (between planting lines, also known as inter-row) × 2.5 m (between plants, also known as intra-row or tree-row), and each experimental unit consisted of four citrus plants. The planting of the orchard was carried out in February 2015, with seedlings of 12 months of age, in a minimum cultivation system, with preparation only of the planting lines with subsoiling, furrowing, and planting fertilization.
Glyphosate was applied using a backpack CO2 sprayer, with a constant pressure of 2.0 bar, at 0.5 m from the soil surface. The application volume was 200 L ha−1, and the application bar was equipped with an anti-drift attachment, as well as Teejet® Air Induction Extended Range (AIXR) 11002 fan-type spray tips, with air induction technology to reduce the drift effect. The applications were carried out in the planting line of the orchard, in the width of the canopy of citrus plants (such as canopy projection), which is the main region of competition between the crop and the weeds. The first application of glyphosate was performed in October 2016, and the orchard was 1 year and 8 months old, with the stems fully lignified.
On the same application dates, the control plots (0 g ae ha−1) had weed control performed by the mechanical control, with a motorized manual mower. This option was used to simulate the non-chemical control, which is used by agricultural production systems in citrus orchards, given that manual weeding currently has no economic viability.

2.2. Weed Control

Weed infestation levels were evaluated 30 days after glyphosate application. The initial sample of 0.25 m2 quadrats was released eight times per repetition (sampling area = 2.0 m²) and directed to the weed control area (intra-row), which was identified and quantified according to the percentage of coverage of the sample area. Therefore, the weed control data were calculated using the coverage values of each treatment related to the control treatment values.

2.3. Glyphosate Susceptibility Levels of Weed Biotypes in the Experimental Area

Greenhouse bioassays of glyphosate application were carried out (also on Cordeirópolis, São Paulo State, Brazil) to determine the susceptibility of the dominant weeds in the 2017/2018 growing season: BIDPI (Bidens pilosa (L.)), RAPRA (Raphanus raphanistrum (L.)), and ERICA (Conyza canadensis (L.) Cronquist), as seen in Section 3.1. First, a pool of seeds was collected 30 days after the last application of glyphosate (May/2018) from the surviving plants of two treatments: (i) 540 g ae ha−1 + 1 APP and (ii) 2160 g ae ha−1 + 4 APP. Therefore, 20 seeds pot−1 were sown on October/2018 and periodic irrigations (2.0 mm day−1) were performed to stimulate germination and emergence processes. After the emergence, four plants pot−1 were standardized. In addition, when the four-leaf vegetative stage was reached, glyphosate was applied with a manual sprayer, calibrated to 200 L ha−1. At 28 days after the application, counts of surviving plants were performed and the biomass of shoots and roots were collected. Biomass was dried at 60 ± 3 °C for 72 h. The effective dose values for the reduction of 50% of biomass accumulation (growth reduction, (GR50)) and survival rates (lethal dose (LD50)) of the populations were obtained by nonlinear regression, using a four-parameter logistic model [17,18].
The design used was completely randomized in a double factorial plot scheme, with four replications. The first factor consisted of three different biotypes of the same weed species: B1: Biotypes of plots with lower frequency and glyphosate dose (540 g ae ha−1 + 1 APP = 540 g ae ha−1 year−1); B2: Biotypes of plots with higher frequency and glyphosate dose (2160 g ae ha−1 + 4 APP = 8640 g ae ha−1 year−1); e, B3: Possibly susceptible biotypes to glyphosate from another location (20°43′23.15″ S, 49°0′8.49″ W, Olímpia, São Paulo State, Brazil). The second factor was composed of different glyphosate doses: 0, 0.25, 1, 4, and 8 D, where D is the value of the glyphosate commercial dose for each weed species: 960 g ae ha−1 for BIDPI and ERICA, and 360 g ae ha−1 for RAPRA. The experimental unit consisted of 1 L pots.

2.4. Visual Symptoms of Glyphosate Phytotoxicity on Citrus Plants

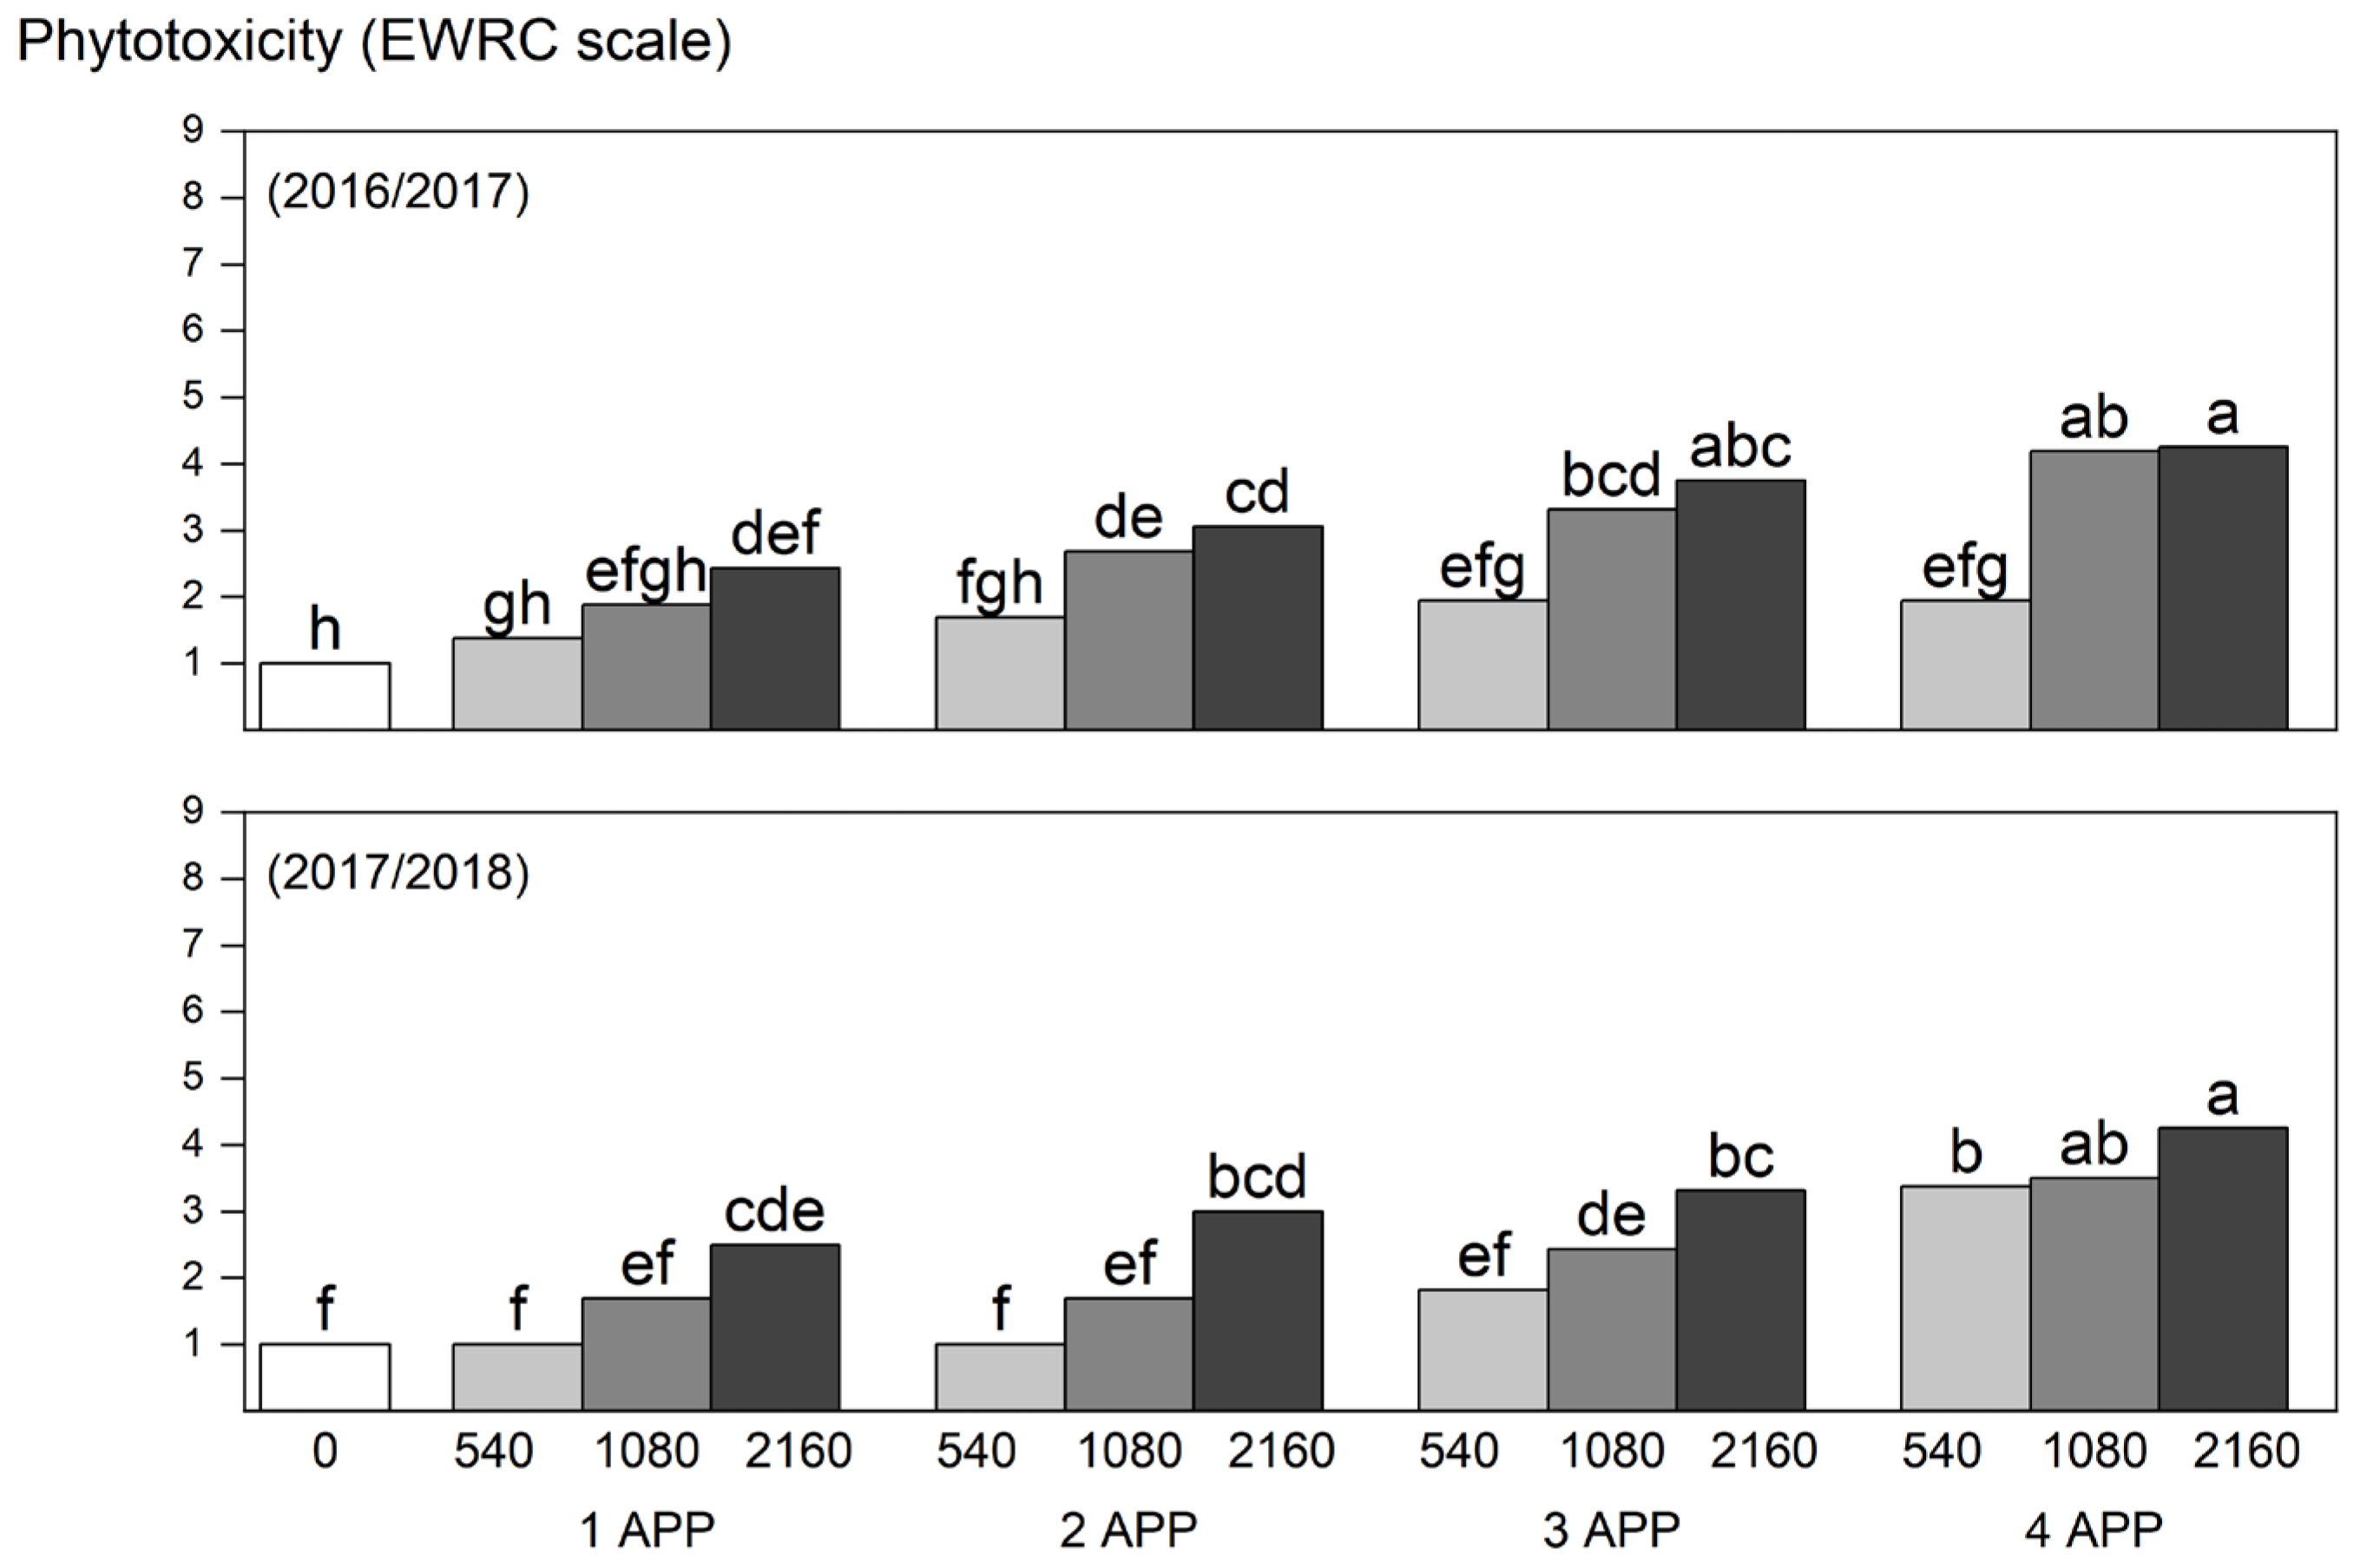
In citrus plants, visual estimates of glyphosate phytotoxicity were performed at 30 days after each application, using a 1–9 scale for crop tolerance to herbicides of the European Weed Research Council (EWRC—adapted from [19]): (1) No visible effect; (2) very mild effects of stunting/dwarfism and chlorosis; (3) mild effects of stunting/dwarfism and chlorosis—reversible effects; (4) substantial effects of chlorosis and/or stunting/dwarfism—most of the effects were possibly reversible; (5) severe chlorosis and/or stunting/dwarfism; (6) increased severity of damage; (7) increased severity of damage; (8) increased severity of damage; and (9) death of plants. This evaluation was performed only in the first two growing seasons (2016/2017 and 2017/2018). In the third evaluated year, it was not possible to observe the symptoms of phytointoxication, which is one of the highlights of this study and will be discussed in Section 3.2.

2.5. Citrus Plants Growth and Yield

The vegetative growth and yield of the Pêra orange plants were evaluated between July and August of each growing season, during the main ripening season for this citrus variety. In the growing season 2017/2018, an additional harvest on December/2018 was carried out due to the production of seasonal fruits, which is characteristic of this citrus variety [20]. The growth was evaluated by measuring the height and diameter of the canopy of the two central trees of each plot using a graduated scale. The subsequent calculation of the canopy volume was determined as follows [21]:
CV = 2/3 π R2 H
where CV is the canopy volume (m3), R is the average radius of the plant canopy (m), and H is the plant height (m). For the yield evaluation, the fruits were harvested and weighed, and the data were extrapolated to t ha−1.

2.6. Economic Analysis

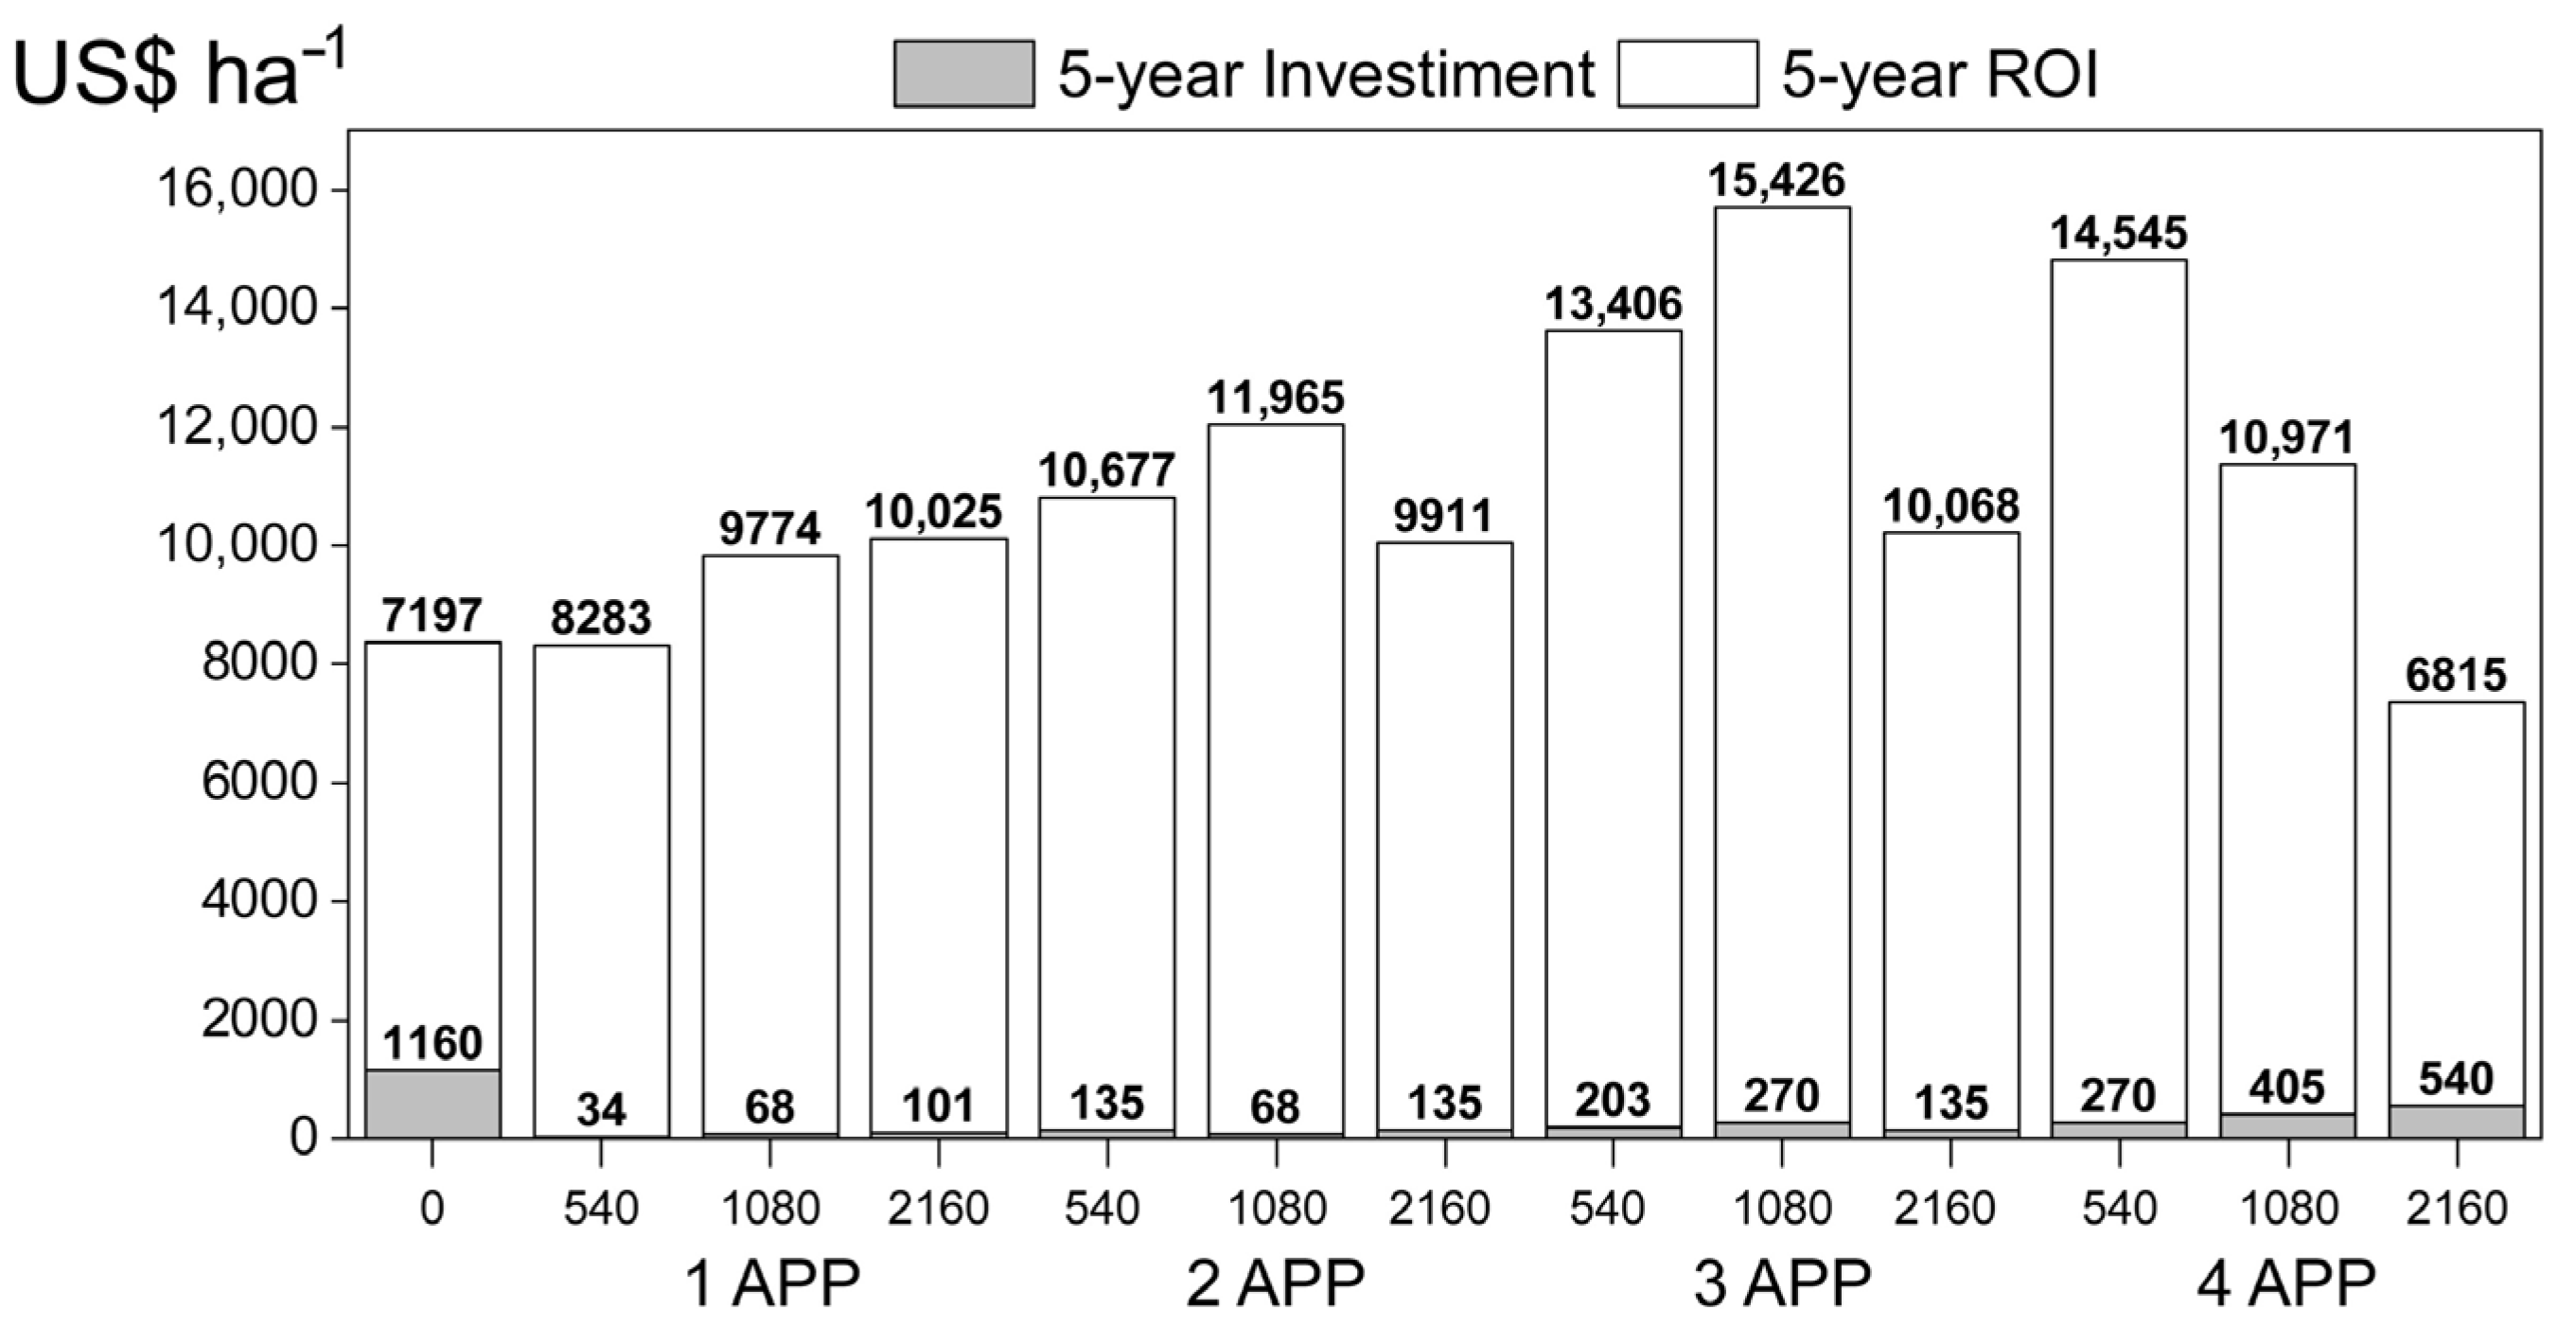
The economic viability of the treatments was evaluated by the return of investment (ROI) caused only by the variable values, i.e., by the different values of the glyphosate treatments and the manual mowing between the plants’ control treatment. The glyphosate price was calculated by the average quotation between the years 2016–2021 (USD 4.50 L−1 RoundUp Original®). For the control treatment, the value of 16 man-hours/hectare was fixed (USD 3.62 man-hour−1). The fixed costs, which did not differ between the treatments were not included, such as fertilizers, fungicides, and insecticides. For the yield values, the kg price of the Pêra sweet orange fruit was fixed by the average quotation from 2017 to 2021 for the region of the experiment (USD 0.12 kg−1, Limeira, State of São Paulo, Brazil) [22].

2.7. Data Analysis

To meet the assumptions of variance analysis, weed control percentage data were transformed into the square root of the x sine arch. The canopy volume and citrus yield data showed normality and were not transformed. Therefore, the transformed data were presented regarding their means, and the statistical separation was based on the transformed data. As a result, the data were submitted to the normality analysis, variance analysis (ANOVA), and when necessary, to the multiple mean comparisons test by Tukey’s honestly significant difference test (HSD; α = 0.05). The correlations between the variables were submitted by Pearson’s linear correlation test (α = 0.05).
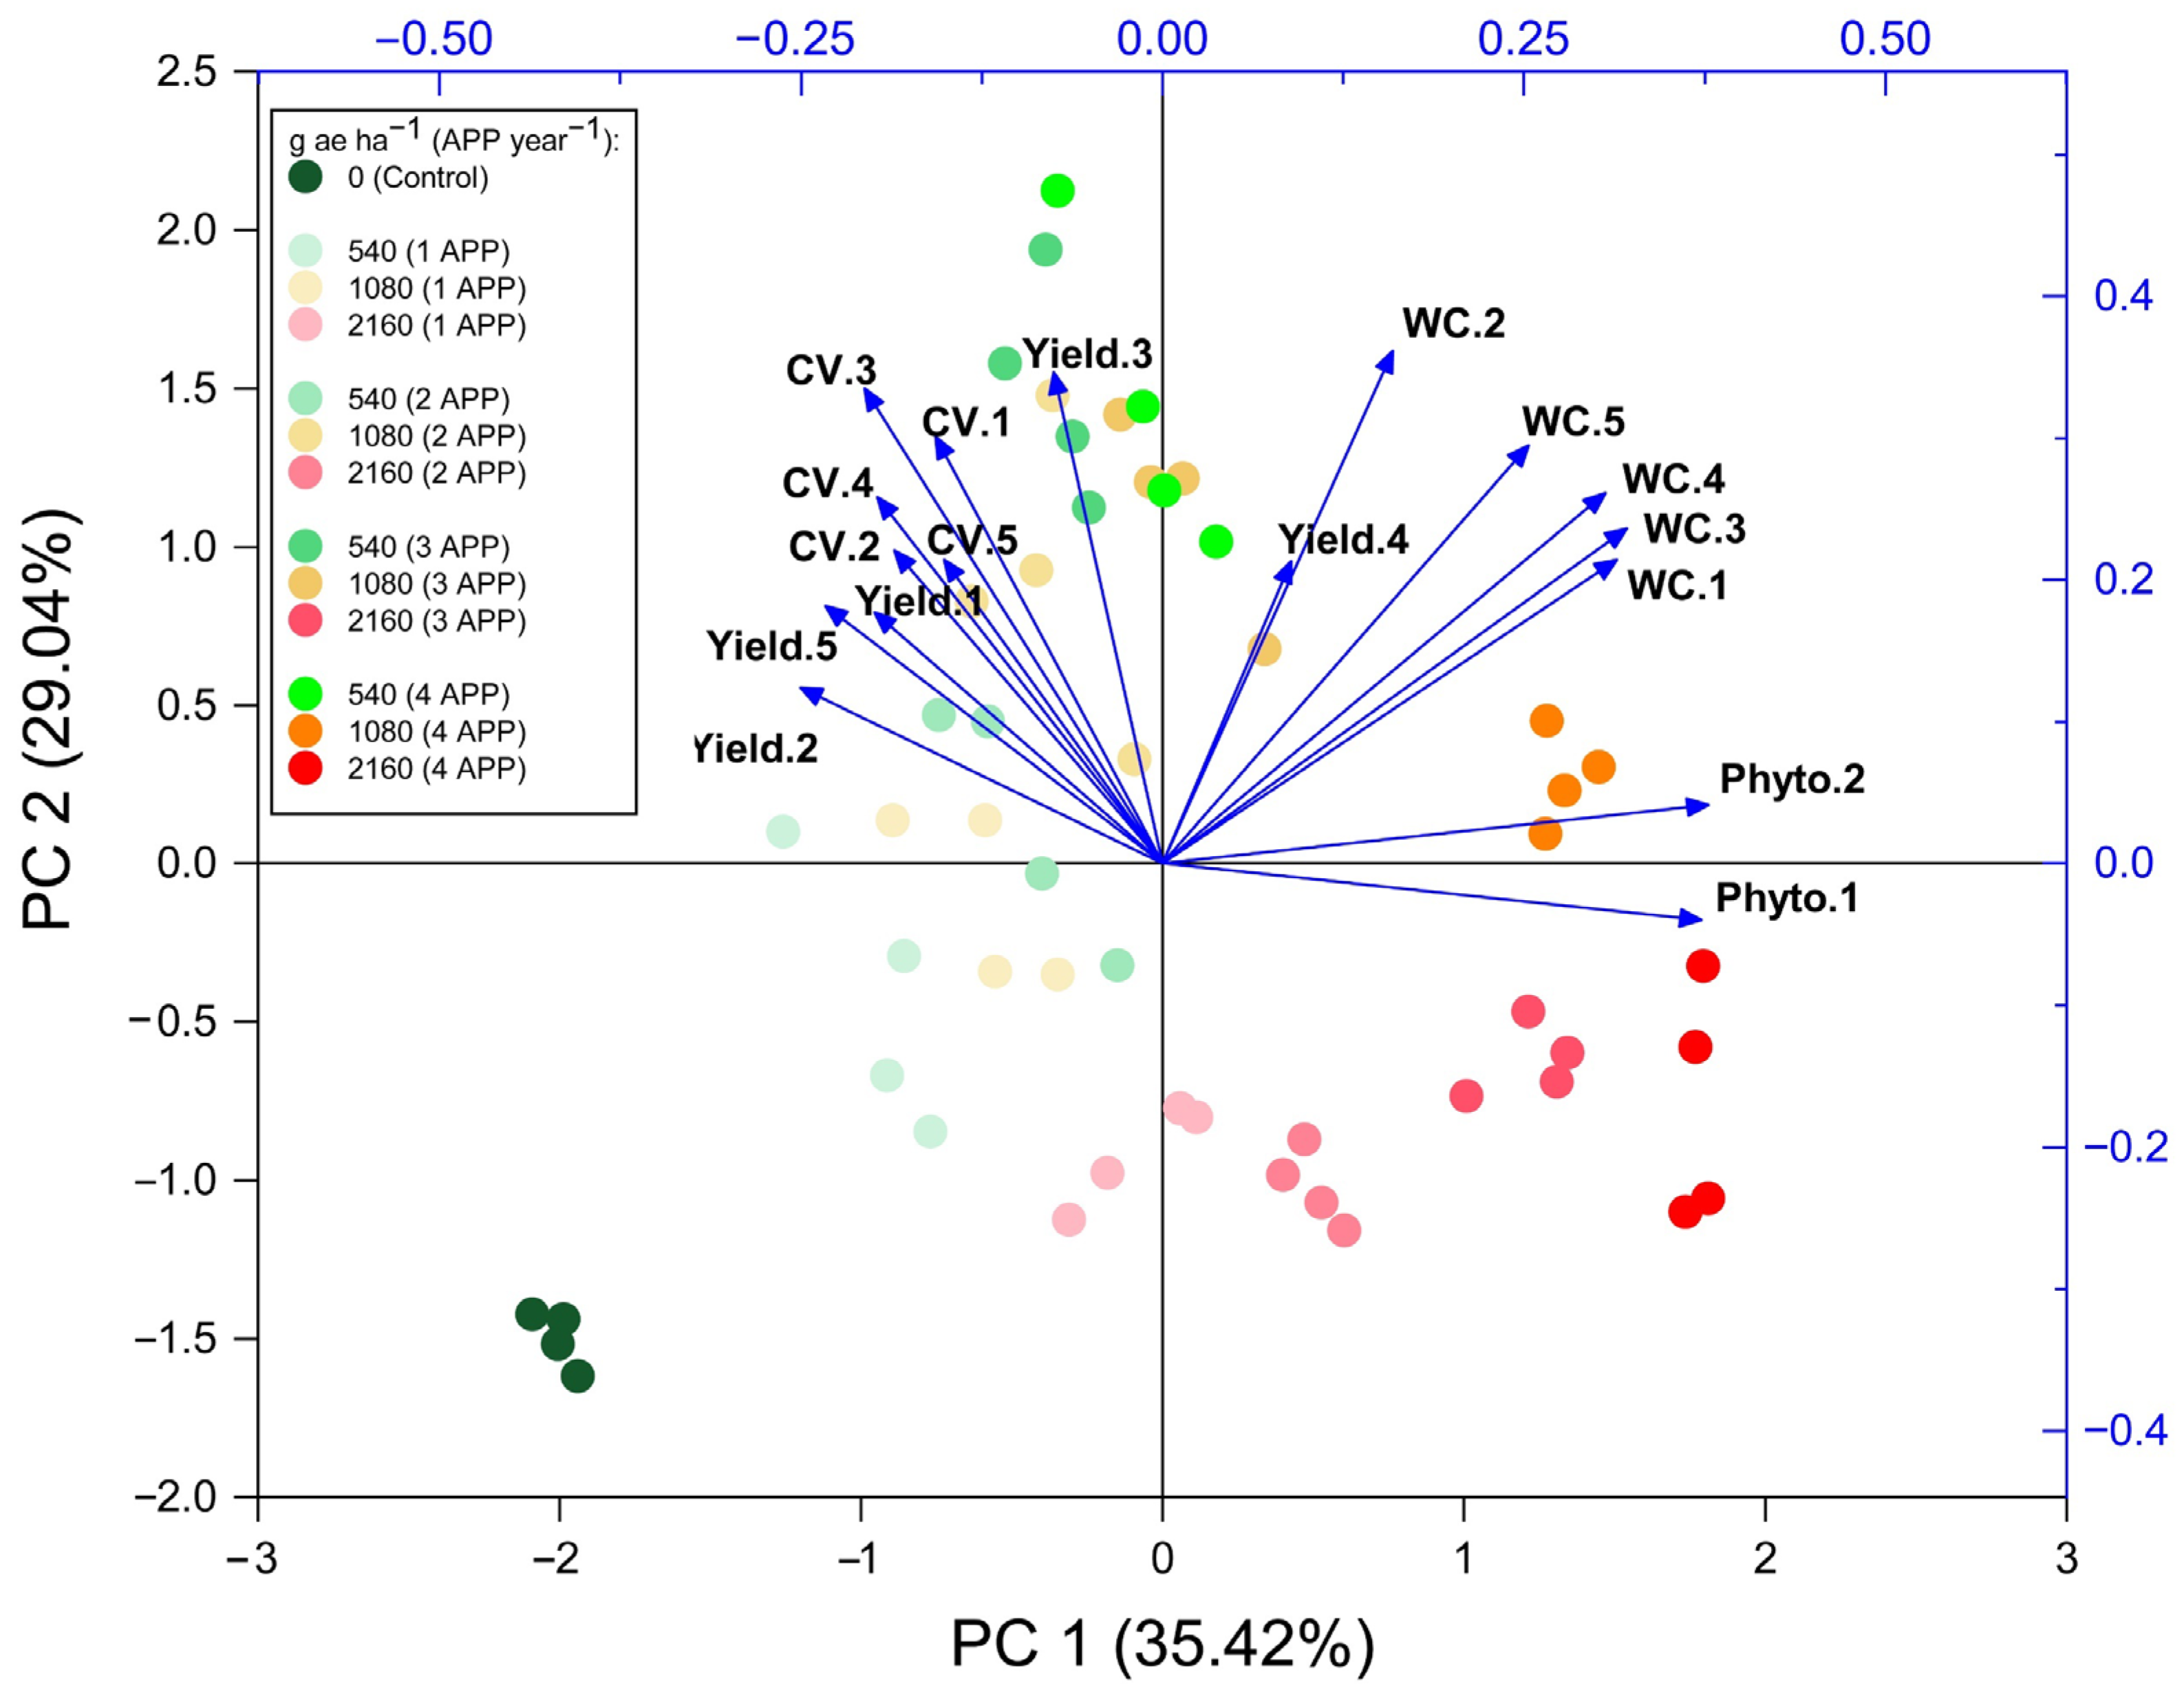
The multivariate analyses, through the principal component analysis (PCA), were used to identify the main observed effects and facilitate the visualization of correlations between the variables, because the cosine of the angle (representing the variables) is the correlation coefficient between the two vectors [23]. Data were normalized and demonstrated by the correlation biplot between the main components [24].
For nonlinear regressions, the four-parameter logistic model was used [17,18]:
y = c + {(dc)/[1 + (X/X50) b]}
where c and d are the values of the lower and upper asymptotes of the curve, respectively, X is the variable-response, which can be a biomass level or survival rate, X50 represents the effective dose for a 50% reduction in biomass (GR50) and survival rate (S50), respectively, and b is the relative slope of the curve. As the values are relativized, the d term was fixed at 100%.
Normality tests, Pearson’s correlation tests, and PCA were performed by the Origin software (v. 2019) [25]. The analysis of variance and means separation tests were performed using the agricolae package [26], while the regressions were performed using the drc package [27]. Both packages are provided by R software (v. 4.1.0) [28].

3. Results

In all the growing seasons, the variables were strongly influenced by the effect of the treatments, with high F-values (Table 1).

3.1. Weed Control and Glyphosate Susceptibility Levels from Weed Biotypes

During the five evaluated growing seasons, 43 distinct species from 14 botanical families were identified in the weed community (Supplementary Table S1). The main species of the community include BIDPI (Bidens pilosa L.), with a report of glyphosate resistance in a citrus orchard in Mexico [29], RAPRA (Raphanus raphanistrum L.), a species with reports of glyphosate resistance in diverse areas in Australia [30], and ERICA [Conyza canadensis (L.) Cronquist], a species with several reports of glyphosate resistance worldwide [31].
In the first evaluated growing season (2016/2017), there were no significant differences in weed control levels by the different doses of glyphosate. However, by the higher annual application frequency, significant differences were observed, as shown in Figure 2. An average weed control (62%) was observed up to 2 APP, while higher control efficiencies were observed for 3 APP (79%) and 4 APP (98%). For the second growing season (2017/2018), there were low levels of weed control (21%) obtained with 1 APP, regardless of the dose. However, the differences between the doses were detected when the application frequency was above 2 APP per growing season, with the highest dose (2160 g ae ha−1) decreasing the weed control, by 43, 35, and 28%, respectively for 2, 3, and 4 APP (when compared with the lowest dose; 540 g ae ha−1). Good control levels (84%) were observed for the lowest dose from 3 APP, while regular control levels were observed only for doses up to 1080 g ae ha−1 + 2 APP (69%).
In this growing season (2017/2018), a significant increase in BIDPI, ERICA, and RAPRA was observed precisely in the treatments that provided less weed control. Susceptibility differences between these three species to glyphosate were observed. For BIDPI, it was verified that all the biotypes demonstrated susceptibility to glyphosate, with differences in survival rates (LD50) and reduction of biomass accumulation (GR50) (Figure 3; Table A1). B1 and B3 biotypes demonstrated the same response in survival rates (LD50 = 878.03 g ae ha−1), while B2 demonstrated almost half of this value (LD50: 472.85 g ae ha−1). For biomass accumulation, the biotypes of the experimental area showed greater tolerance than the standard considered (GR50 B3: 50.7 g ae ha−1) by 10.1 (GR50 B1: 511.9 g ae ha−1) and 2.3 times (GR50 B2: 118.4 g ae ha−1). However, for ERICA, all the biotypes demonstrated high survival rates (>80%) even with high dose rates (7680 g ae ha−1, ~21 L ha−1 of Roundup Original®) with LD50 values estimated at >20,000 g ae ha−1. In addition, the reduction of biomass accumulation was observed with differences up to 5.7 times between biotypes B2 (GR50 B2: 8950 g ae ha−1) and B3 (GR50 B3: 1572 g ae ha−1). For RAPRA, all the biotypes demonstrated susceptibility to glyphosate, both in survival rate with average values of LD50 at 178.9 g ae ha−1, as well as in growth reduction (GR50 B1: 140.9 g ae ha−1; GR50 B2: 95.5 g ae ha−1; GR50 B3: 120.9 g ae ha−1).
However, in the third growing season (2018/2019), there was an increase in weed control with the increasing application frequency, with greater differences observed, especially from the dose of 1080 g ae ha−1 + 2 APP (above 70% control) and + 4 APP (92% control) (Figure 2). In the fourth growing season (2019/2020), there was an increase in weed control with the increase in the application frequency, regardless of the dose, where treatments up to 2 APP provided low levels of control (53%), and from 3 APP resulted in good control levels (88%). In the fifth and last growing season (2020/2021), a lower control level was verified as compared with the previous year. In addition, the differences were significant only in smaller doses and with the higher application frequency when comparing the treatment 540 g ae ha−1 + 3 APP, which obtained a satisfactory level of control (83%) with any dose with 1 APP or 2 APP (30–50%). Of note, in these last three growing seasons, there were no weed species that caused dominance, such as in 2017/2018.

3.2. Phytotoxicity Levels and Symptoms Characterization

There was an increase in visual symptoms by the glyphosate phytotoxicity on citrus plants related to the increase in its use, due to the high doses (Figure 4 and Figure A2). This trend was maintained for the first two evaluated years, reaching the maximum value of 4 on EWRC scale (substantial effects of stunting/dwarfism and chlorosis, with most effects evaluated as possibly reversible). In 2016/2017, these results were obtained for 2160 g ae ha−1 + 3 APP and 1080 g ae ha−1 + 4 APP. In 2017/2018, the results were obtained from 1080 g ae ha−1 + 4 APP. From the third growing season (2018/2019) onwards, it was not possible to observe the visual phytotoxicity symptoms, except on plant growth.
As a characterization of the observed phytotoxicity symptoms, for the 540 g ae ha−1 dose of glyphosate, only mild symptoms of chlorosis in citrus leaves were observed, regardless of the number of applications in the year (Figure A2). For 1080 g ae ha−1 + 1 APP, in addition to the mild symptoms of chlorosis, some mild deformations were observed in the branches, with apparent shortening of internodes and an increase in the number of branches and leaves, but without anatomical deformations. However, for 2160 g ae ha−1 + 1 APP, it was possible to verify more accentuated chlorosis with deformations in the leaves, which became more lanceolate, and the branches have increased number of shoots. From 1080 g ae ha−1 + 2 to 4 APP, these symptoms of anatomical deformation noted in branches and leaves were intensified, together with mild symptoms of stunting/dwarfism.

3.3. Citrus Plants Growth and Yield

There was a reduction in the growth potential of citrus plants in all the evaluated years (Figure 5 and Figure A3). In the first growing season (2016/2017), regardless of the glyphosate application frequency, the orange plants showed a reduction in their growth potential when the highest dose was used (2160 g ae ha−1), with a smaller canopy volume of 2.2 m³ when compared with the best treatment (1080 g ae ha−1 + 2 APP; 3.1 m3). The same trend was maintained for the following years, with greater reductions in the highest dose: From 3 APP (−4.1 m3) in 2017/2018, from 2 APP (−4.8 m3) in 2018/2019, from 3 APP (−5.3 m3) in 2019/2020, and 2 APP (−5.0 m3) in 2020/2021. Of note, in 2019/2020, citrus plants showed higher growth relative to the previous year, which was the highest observed to date. Herein, some treatments showed increases in canopy volume by 28% (1080 g ae ha−1 + 2 APP) to 83% (1080 g ae ha−1 + 1 APP), which was not observed in 2020/2021, indicating that the plants may have reached their maximum growth.
In all the evaluated years, there were reductions in fruit yield potential, with the highest reductions in general by the highest dose and application frequency (Figure 5). In the first growing season (2016/2017), there was a yield decrease of 3.7 t ha−1 for 1080 and 2160 g ae ha−1 + 4 APP and for 2160 g ae ha−1 + 2 APP, when compared with the best treatment (540 g ae ha−1 + 3 APP; 4.1 t ha−1). Of note, the benefit and/or toxic effects of glyphosate use were already evident for the first evaluated growing season, even if it did not represent the potential fruit yield of an adult orchard, since the orchard was 2.5 years old (August/2018) at the time of harvest.
In 2017/2018, yield reductions up to 24.1 t ha−1 were observed in both extreme treatments (540 g ae ha−1 + 1 APP and 2160 g ae ha−1 + 4 APP) when compared with the best ones (Figure 5). In 2018/2019, the largest yield reductions to date were observed, with decreases up to 36.3 t ha−1 at 2160 g ae ha−1 + 4 APP. However, in 2019/2020, the lowest yield drop to date was observed at 9.3 t ha−1 up to 2 APP with 540 g ae ha−1 and for 2160 g ae ha−1 + 4 APP treatment. In the last evaluated year (2020/2021), a 16.7 t ha−1 reduction in yield was observed for 2160 g ae ha−1 + 4 APP. Of note, the lowest yield drop in 2019/2020 is evidenced by the decrease in the best treatments to date (540 g ae ha−1 from 3 APP and 1080 g ae ha−1 + 3 APP) since it obtained the highest yields in the previous 2 years, which is evidenced by the biannual treatments that are characteristic of citrus production.

3.4. Multivariate Analysis of the Effects and the Correlation between Variables

By the principal component analysis (PCA), it was possible to identify four main components that comprised most of the variance in this study (78.0%). Therefore, their relationships result in most of the effects (Figure 6). The main component (PC1: 35.4% of the total variance) showed a strong positive correlation with phytotoxicity evaluations and a negative correlation with the fruit yield of 2016/2017, 2018/2019, and 2020/2021, and with the canopy volume, mainly from 2017/2018. This represents the effects of glyphosate on fruit production and growth, which are mainly attributed to the phytotoxicity effects. PC2 (29.0%) showed a positive correlation with yield for 2018/2019, where the greatest differences between the treatments were observed to date. PC3 was attributed to the 2019/2020 yield (6.9%) with no correlation to phytotoxicity, while PC4 was attributed to the 2020/2021 yield (6.6%), which correlated negatively with the phytotoxicity evaluated from the two first growing seasons.
From the biplot, it is possible to observe the relationship between the variables and the treatments only with PC1 and PC2. However, it is possible to observe the correlation between all the variables, as shown in Figure 6. In the first 2 years, inversely proportional relationships were observed, as evidenced by the negative linear correlations between phytotoxicity and canopy volume, with a reduction in citrus plant growth at a rate of −0.55 m3 for each unit increase in the EWRC scale score for 2016/2017 (r = 0.539; p < 0.001), and −0.82 m3 for 2017/2018 (r = 0.605; p < 0.001). Negative correlations between phytotoxicity and yield were also observed, with a reduction of 0.81 t ha−1 for each unit increase in the EWRC scale score for 2016/2017 (r = 0.691; p < 0.001), and 2.61 t ha−1 for 2017/2018 (r = 0.627; p < 0.001). Of note, the phytotoxicity effects observed in the first 2 years showed a lasting effect in citrus plants in subsequent years.
Citrus plant growth by its canopy volume also positively influenced the yield (Figure 6) as expected: For each m³ of citrus plants, the yield increased 0.182 t ha−1 for 2016/2017 (r = 0.399; p < 0.01); 0.732 t ha−1 for 2017/2018 (r = 0.3308; p < 0.05); 4.251 t ha−1 for 2018/2019 (r = 0.588; p < 0.001); and 0.96 t ha−1 for 2020/2021 (r = 0.339; p < 0.05). Only in 2019/2020 growing season the plant growth did not correlate with yield.
Finally, there were no correlations between weed control and citrus plant yield (Figure 6), which was not expected. However, it is important to highlight that there were gains in growth and fruit yield as demonstrated in this study, usually, when using up to 1080 g ae ha−1 and up to 3 APP (Figure 5).

3.5. Economic Analysis

First, it is possible to observe that the highest cost was invested in the mechanical control of weeds, as well as the cost increase by increasing the use of glyphosate (Figure 7). However, the contrast between losses vs. benefits as discussed throughout this study was highlighted regarding the management of this herbicide for the five evaluated years. Its lower utilization (540 g ae ha−1 + 1 APP) showed a higher return of investment (ROI) than the management used in the control, as well as for the highest utilization (2160 g ae ha−1 with 4 APP). However, the damage of using this herbicide in excess was evidenced, which can reach −56% of the 5-year accumulated fruit yield, totaling losses of USD 8611.00 ha−1, when comparing the best ROI treatment (1080 g ae ha−1 + 3 APP) with the worst treatment (2160 g ae ha−1 + 4 APP).

4. Discussion

4.1. Weed Control

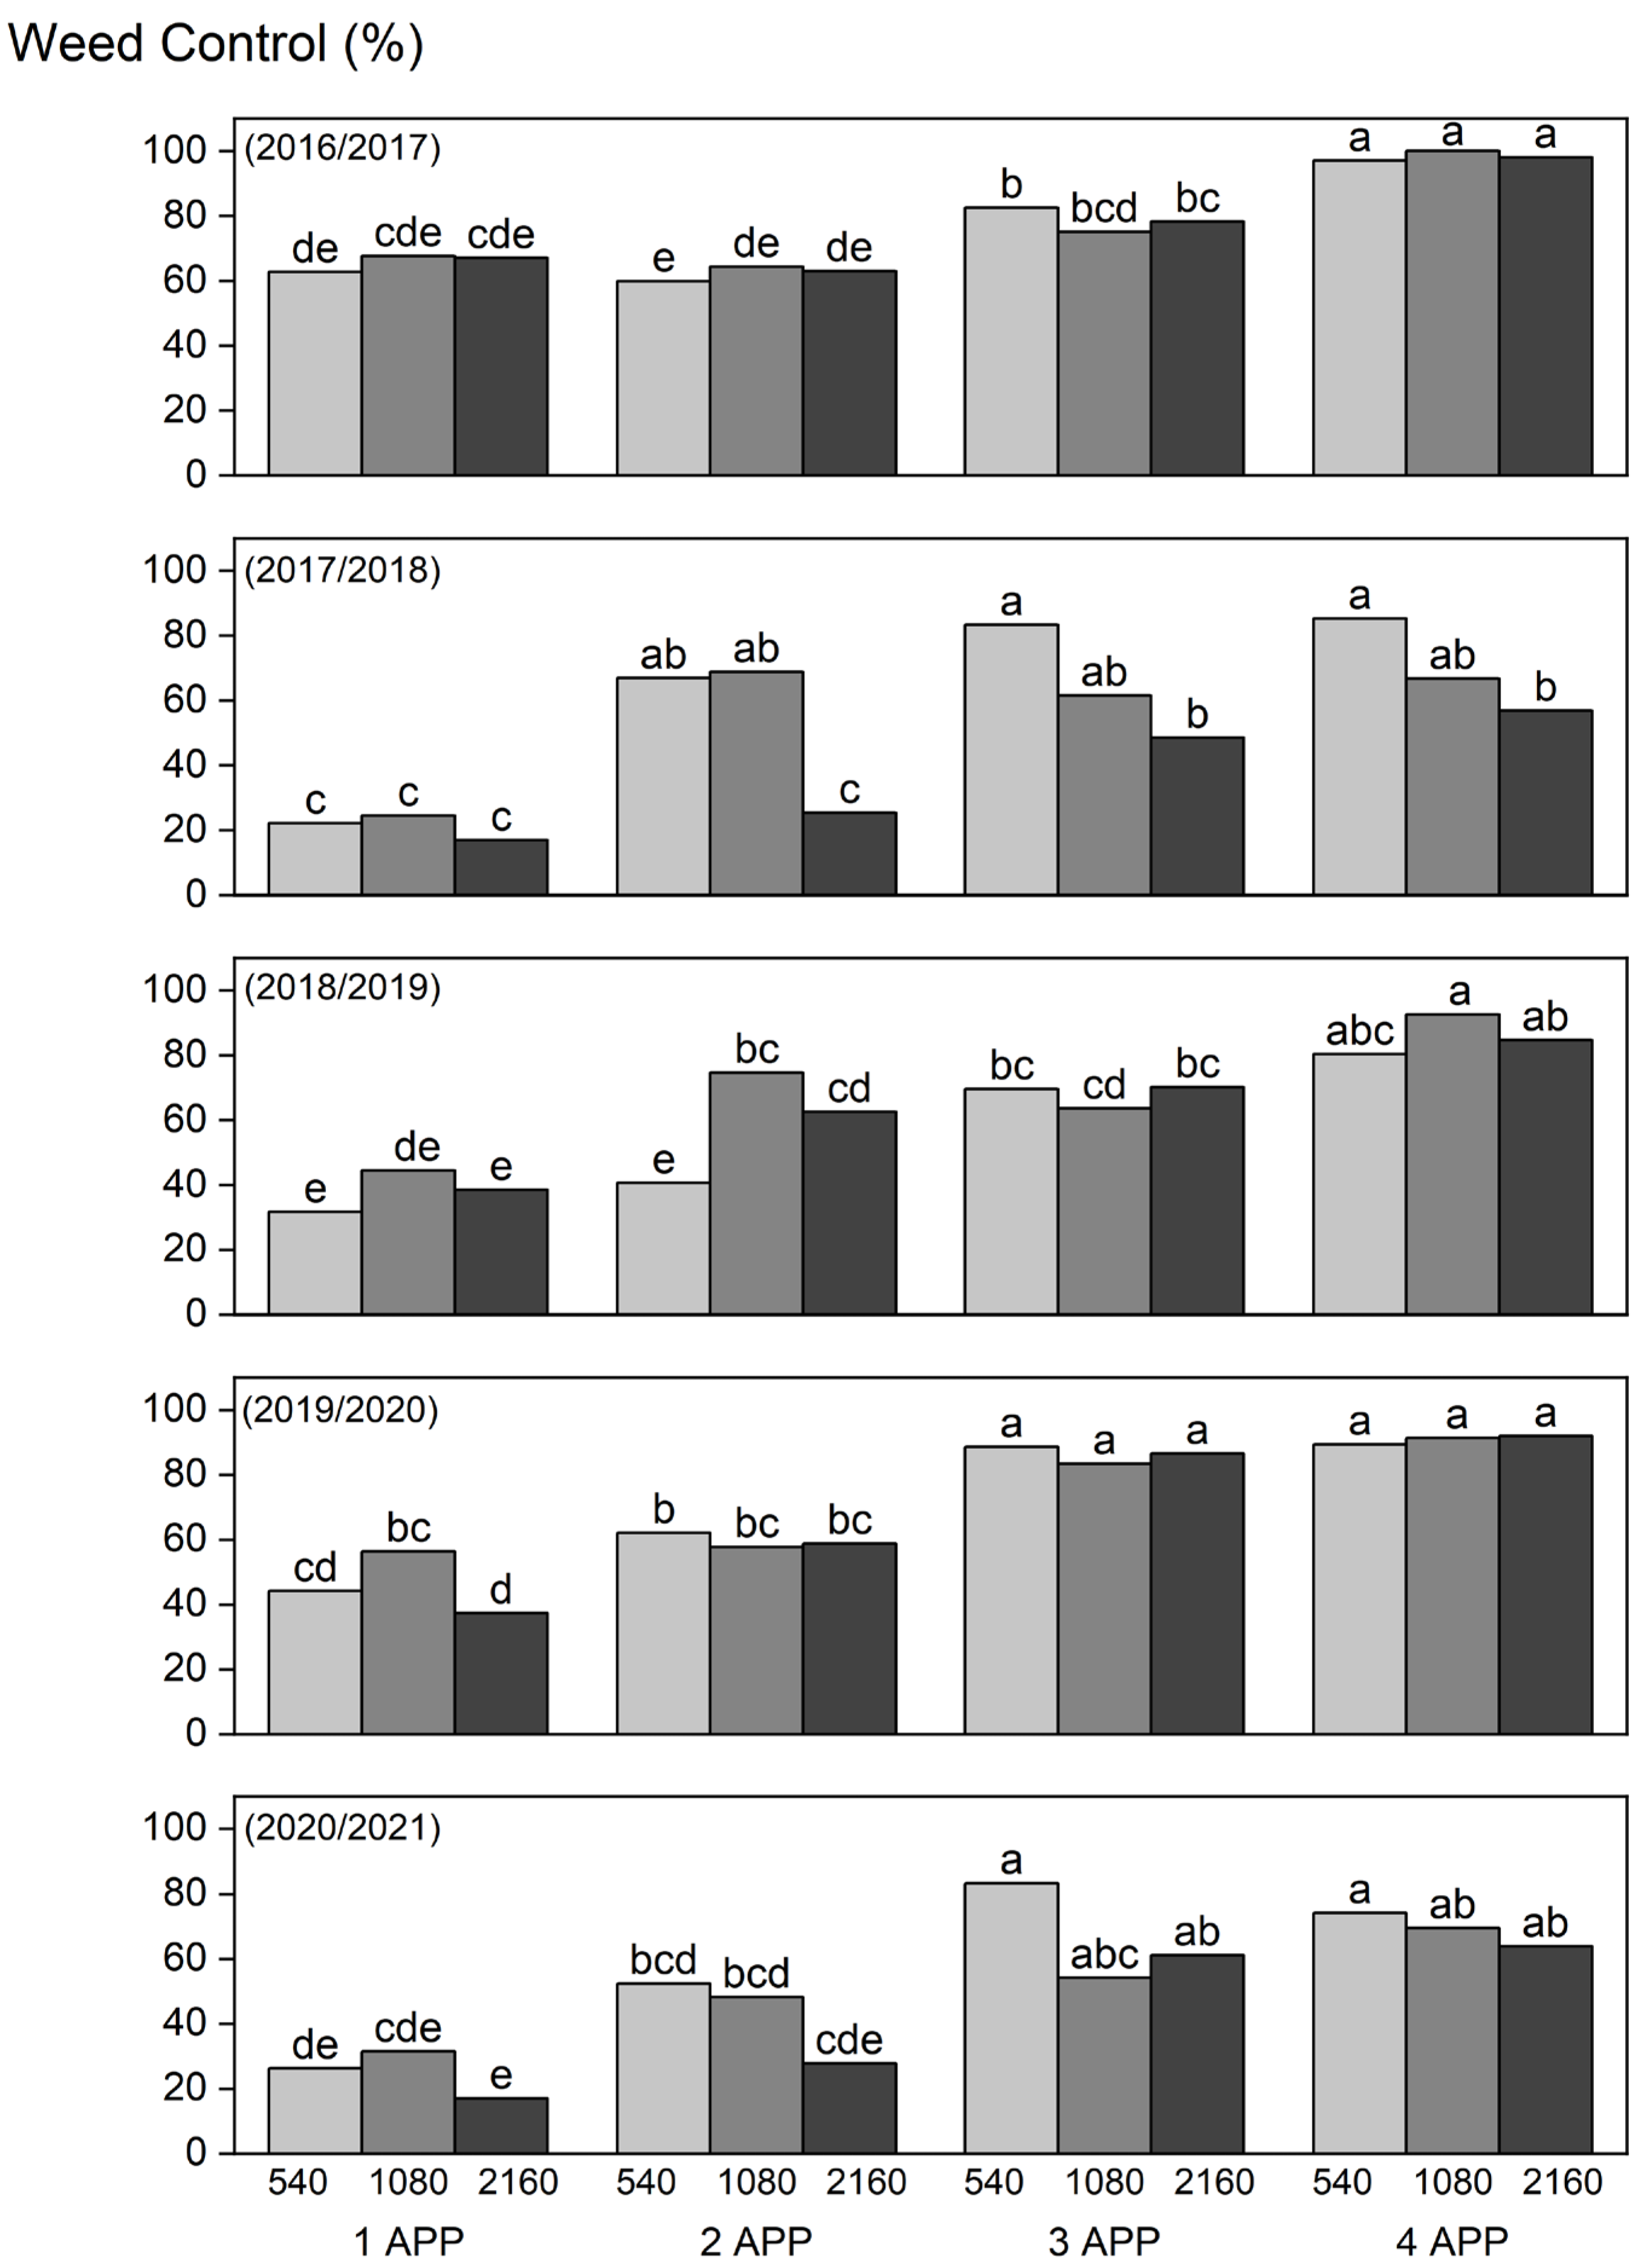
In general, a higher weed control was expected with the increasing application frequency, given that glyphosate is an herbicide with low residual effect on the soil [2]. In addition, an increase in its application frequency causes an increase in the average control by a longer control period. In summary, weed control increments are verified with up to three applications per growing season, and only in the first growing season, the fourth glyphosate application showed greater control.
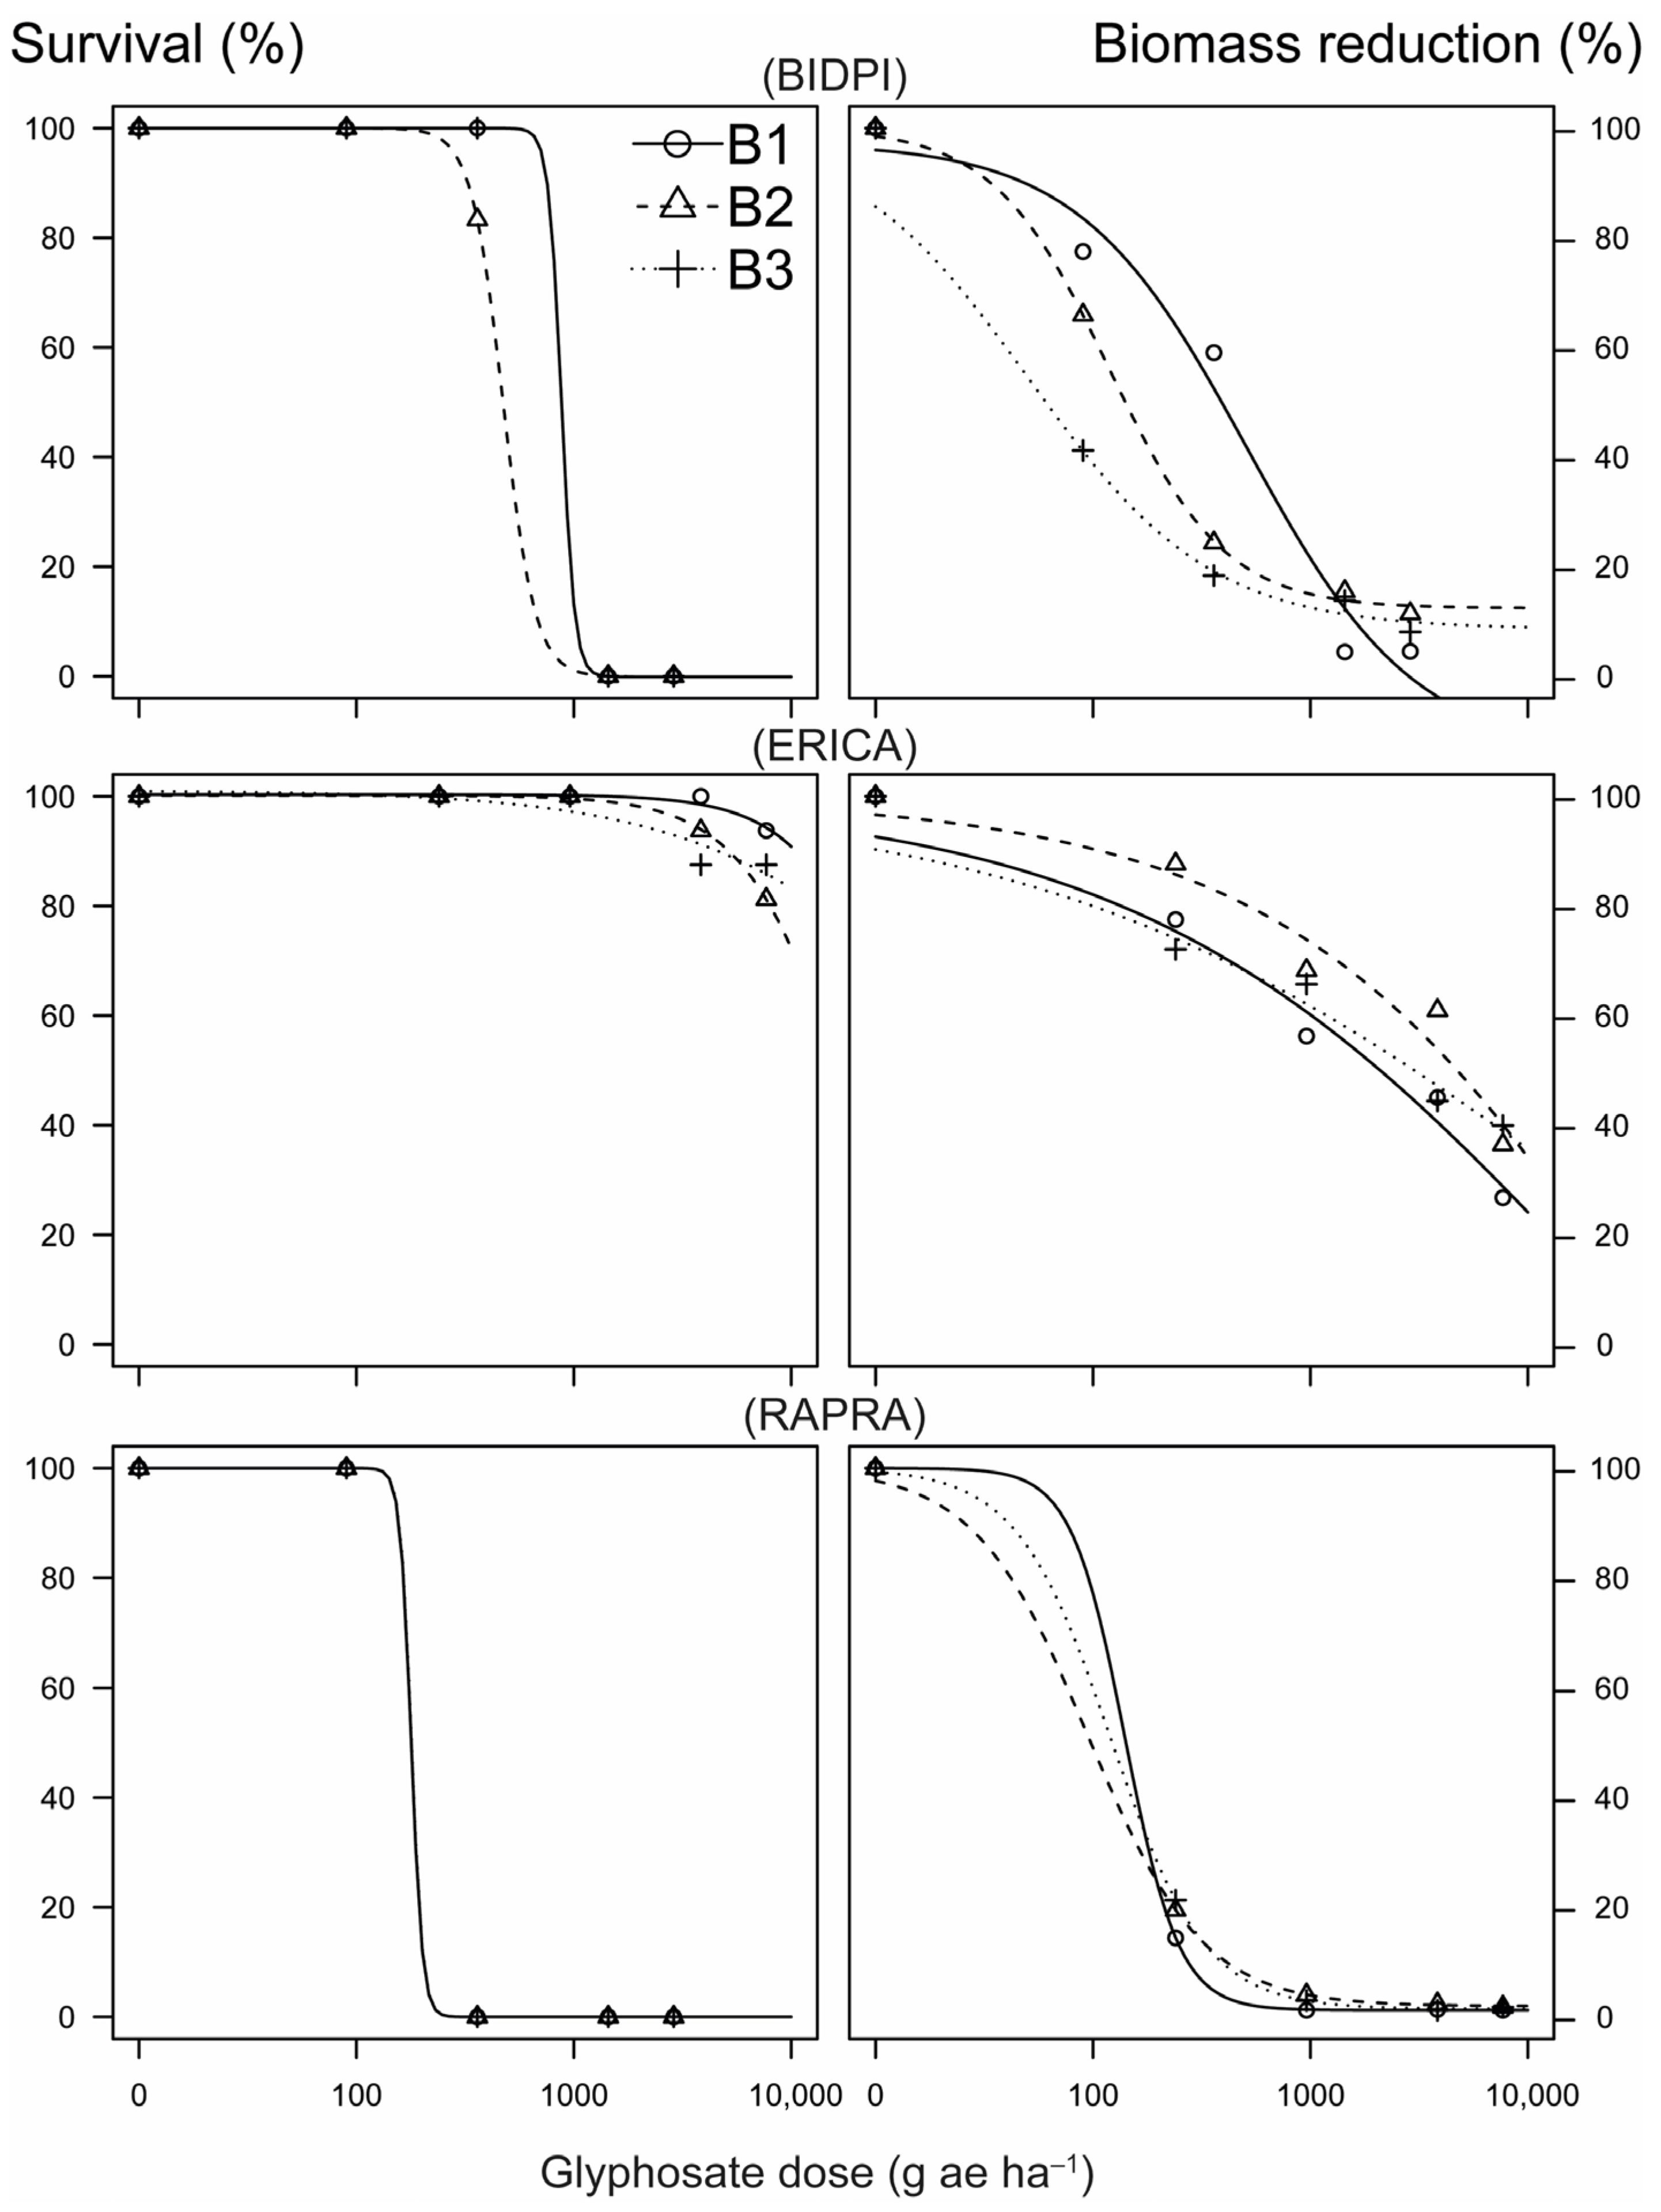
Therefore, the weed control, which decreased at the highest doses of glyphosate in the 2017/2018 growing season, may be due to two effects. First, the increased selection pressure to the possible resistant biotypes and/or tolerant species to this herbicide, as demonstrated for BIDPI and ERICA. The observed values are similar to the resistance reports of both weeds. As previously mentioned for BIDPI, the resistance confirmation of this weed was demonstrated by LD50 values > 2000 g ae ha−1, which is 8.7 times larger than a susceptible population (LD50: 225.4 g ae ha−1), and with a GR50: 1055.8 g ae ha−1, which is 20.4 times higher than the susceptible population (LD50: 51.7 g ae ha−1) [29]. For ERICA, in citrus orchards in Brazil, resistant populations were found with LD50 values up to 10 times larger (1570.5 g ae ha−1) than a susceptible population, while for GR50, the demonstrated values were on average six times higher (435.9 and 471.5 g ae ha−1) than the susceptible population (70.9 g ae ha−1) [32]. For BIDPI, the values presented in our study were lower than those for Mexico, while for ERICA, the values presented exceeded by up to five times the LD50 of the previous citrus orchard study, which demonstrates the evolution process of resistance to herbicides from certain species of weeds.
Second, there may be a selection of short-cycle and/or late germination species that develop in the application intervals, predominating in the weed seed bank [33], since this herbicide has a low residual effect (it is more tightly bound to soils than most of the other herbicides) [2]. This may be valid for RAPRA, which even demonstrates high susceptibility to glyphosate, is a prolific and short-cycle species, and its seeds persist for a prolonged period in the soil [34]. This is also true for BIDPI, which can produce up to 6000 seeds per individual, also with longevity in the soil, with a report of ~80% germination by 5-year-old seeds [35]. Moreover, ERICA can produce up to 200,000 seeds per individual, with high persistence in soil in no-tillage systems [36].

4.2. Phytointoxication of Citrus Plants by Glyphosate and Its Impacts

In this experiment, it is important to highlight that the high severity of phytotoxicity results was not expected, since the performed applications were manual, with low application speeds (~1.0 km h−1) and with the use of anti-drift accessories. Therefore, this decreased the herbicide drift and consequently the contact of glyphosate with citrus. In a study of glyphosate drift with a motorized application in a citrus orchard, it was demonstrated that the main factor that increases herbicide drift is the application speed. In addition, a reduction from 6.0 to 3.0 km h−1 reduced the drift ~56% on average when associated with an anti-drift equipment, and as the environmental variables were normalized, such as wind speed [37]. However, in the present study, the phytotoxic effects caused by glyphosate were observed, demonstrating that the herbicide drift may not be the only problem of glyphosate use in citrus, since the drift was at least, significantly reduced.
Therefore, there may be other contact routes between the herbicide and citrus plants, such as interactions between the target plant (weed) and the non-target plant (crop): (i) By the presence of glyphosate in root exudates and/or its metabolites of treated plants in contact with the crop rhizosphere [38]; (ii) by treated plant residues in decomposition; and/or (iii) by directly root absorption of the glyphosate in some soil types [39].
In a recent study, it was demonstrated that the absorbed glyphosate by canola leaves (Brassica napus L.) can return to the soil solution through the treated plants’ residues degradation [40]. In this study, glyphosate was applied (540 g ae ha−1) directly on soil (as a control treatment) and on canola leaves from two lineages (resistant and susceptible). Additionally, it was demonstrated that in plant residues, especially for the resistant lineage, glyphosate mineralization on the soil was four times slower and its concentrations were three times higher than the control treatment. This was explained by the greater capacity of the resistant lineage to compartmentalize glyphosate in its tissues, which provided temporary protection against its degradation, which released glyphosate into the soil solution over time, even 80 days after its application.
Moreover, this effect can be enhanced by the high dosage of glyphosate used in Brazilian citrus orchards (and discussed here), since weed biotypes with low susceptibility/high tolerance to this herbicide were demonstrated (Figure 3). As an example, ERICA biotypes have demonstrated tolerance even at extreme glyphosate dosages (>20 L ha−1). Therefore, this species can use the strategy to compartmentalize the herbicide in its tissues to survive. However, with the subsequent degradation of the weed species residues (including the susceptible ones), and as glyphosate and its metabolites have high solubility [2], they can be leached and absorbed by superficial citrus roots.
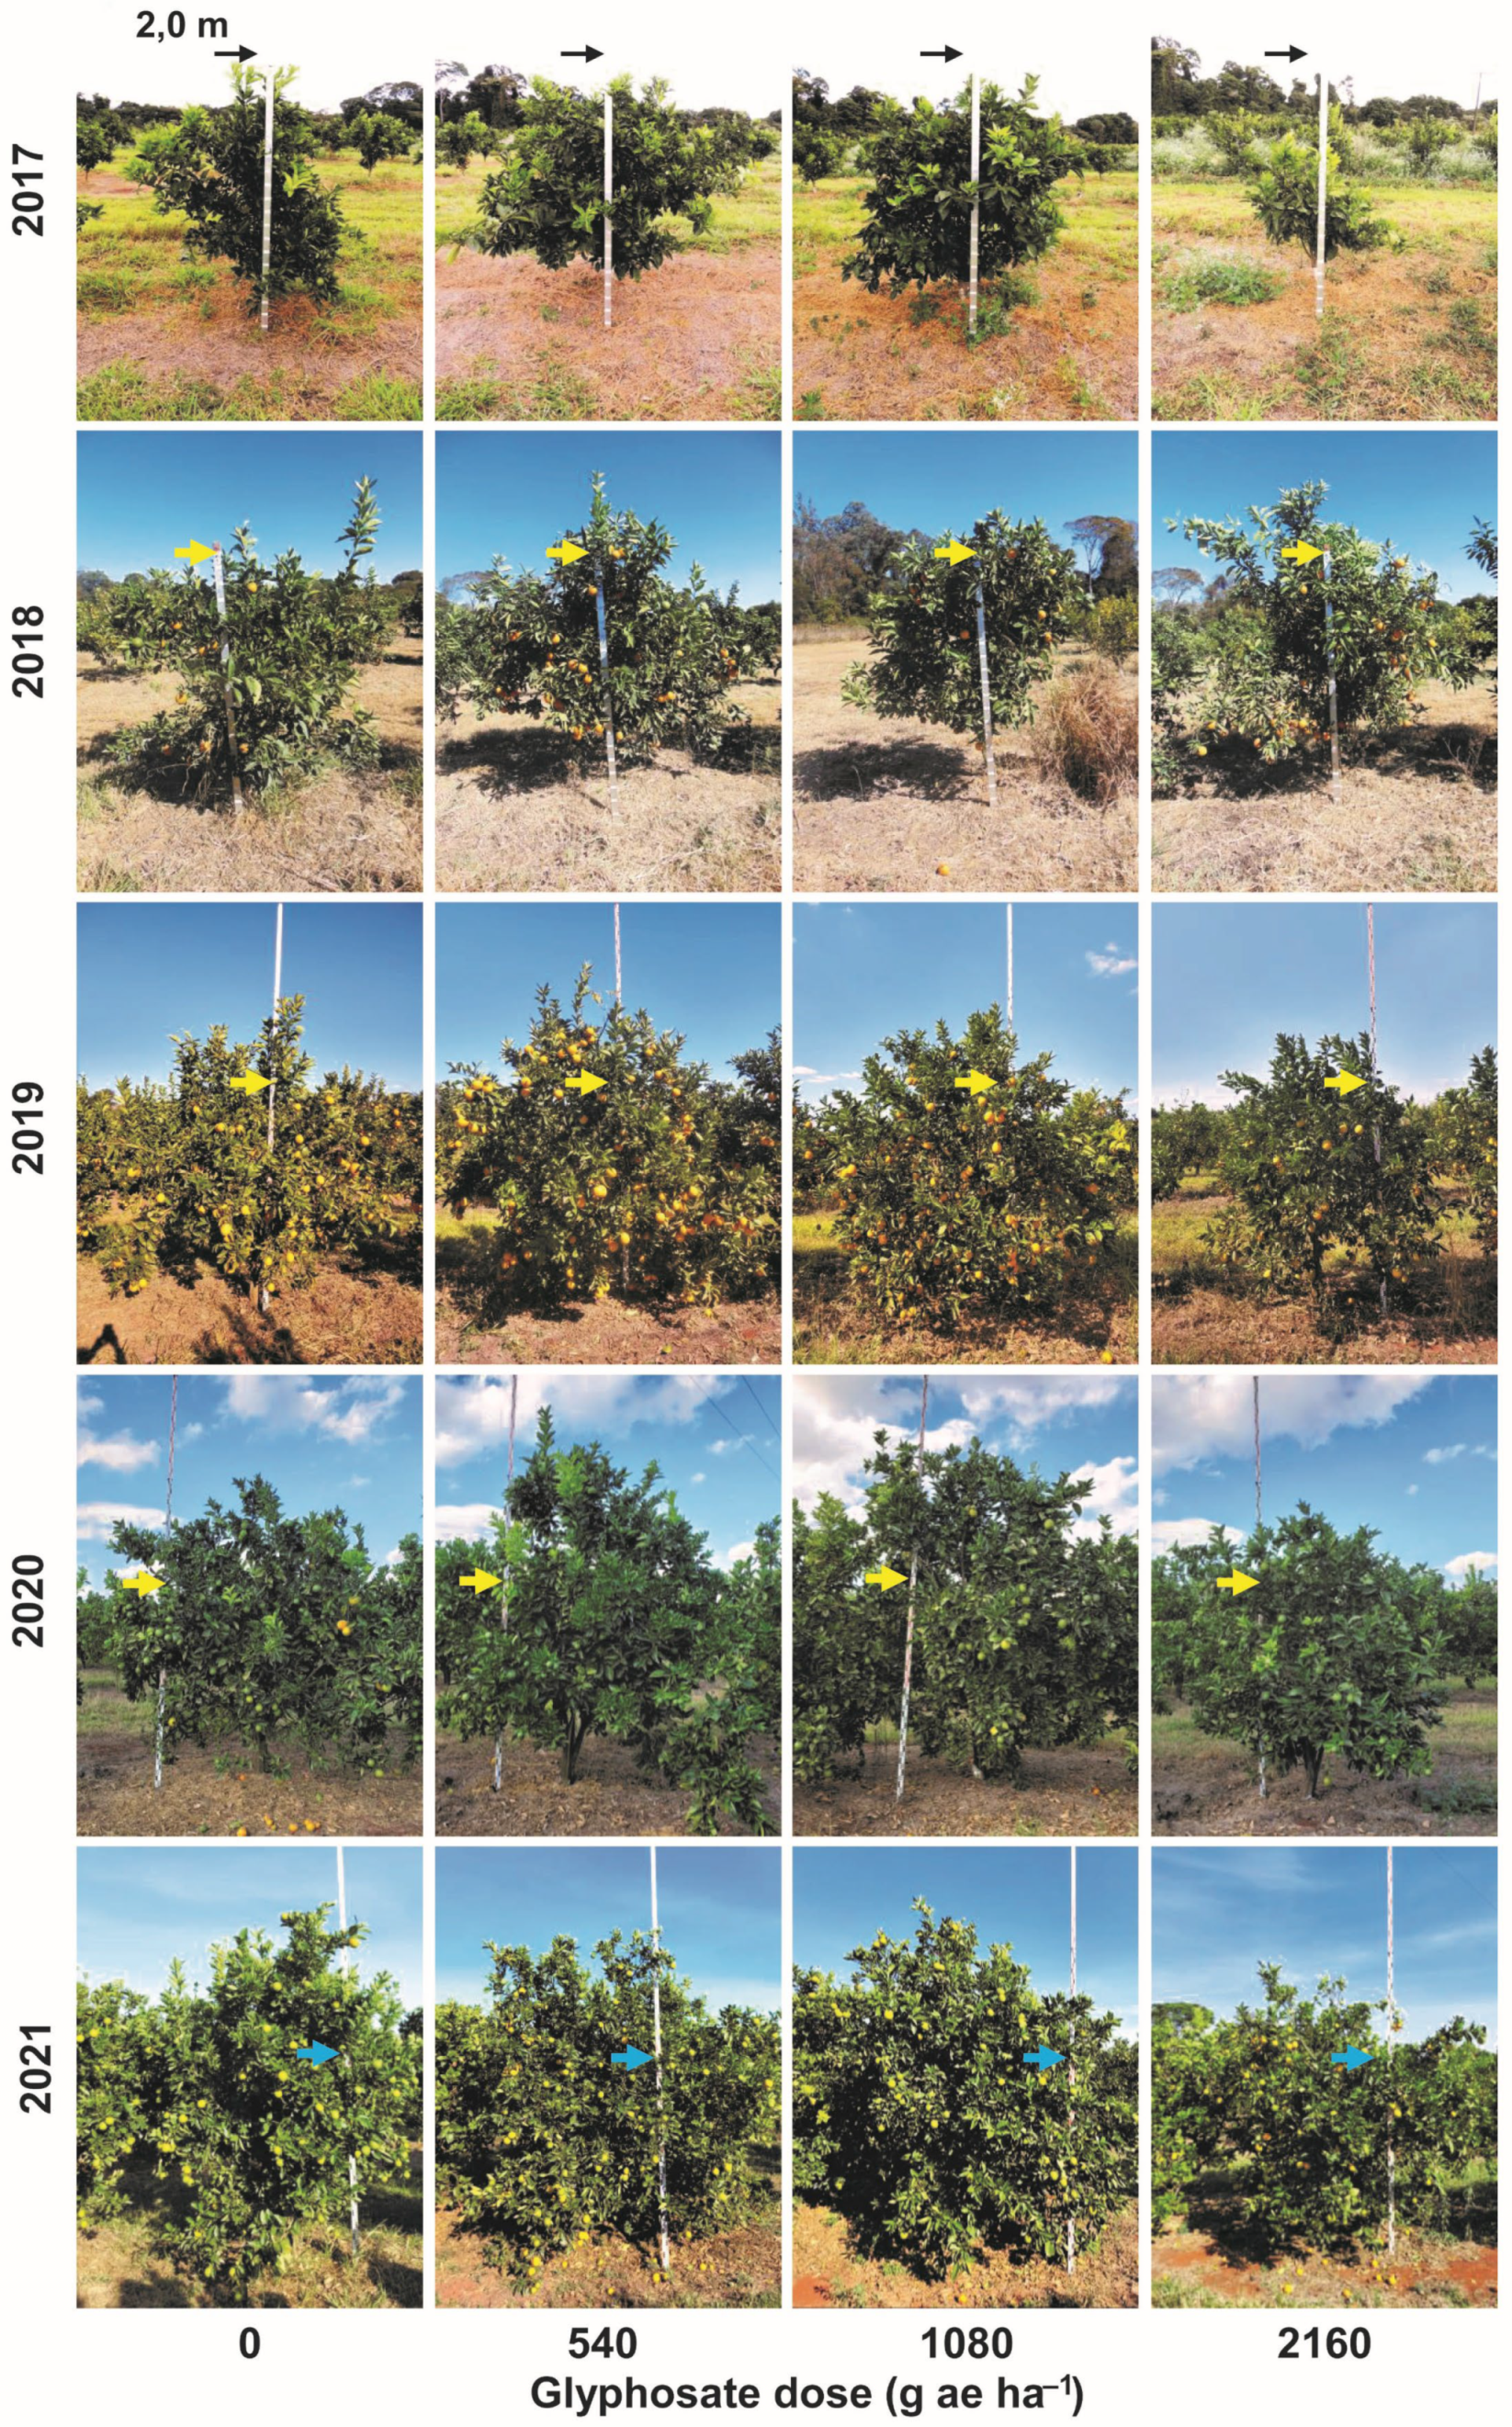
Therefore, the impossibility of evaluating the phytotoxic symptoms in the third year of evaluations onwards (4.5 years of orchard age) may imply a tolerance of citrus plants over time, and/or by not externalizing the toxicity effects to glyphosate from a certain plant age—which needs further investigation. In addition to the observed reduction in plant size as previously mentioned, which may also be due to the glyphosate injury caused over time, none of the treatments continued to show the characteristic symptoms (Figure A2). However, at doses >1080 g ae ha
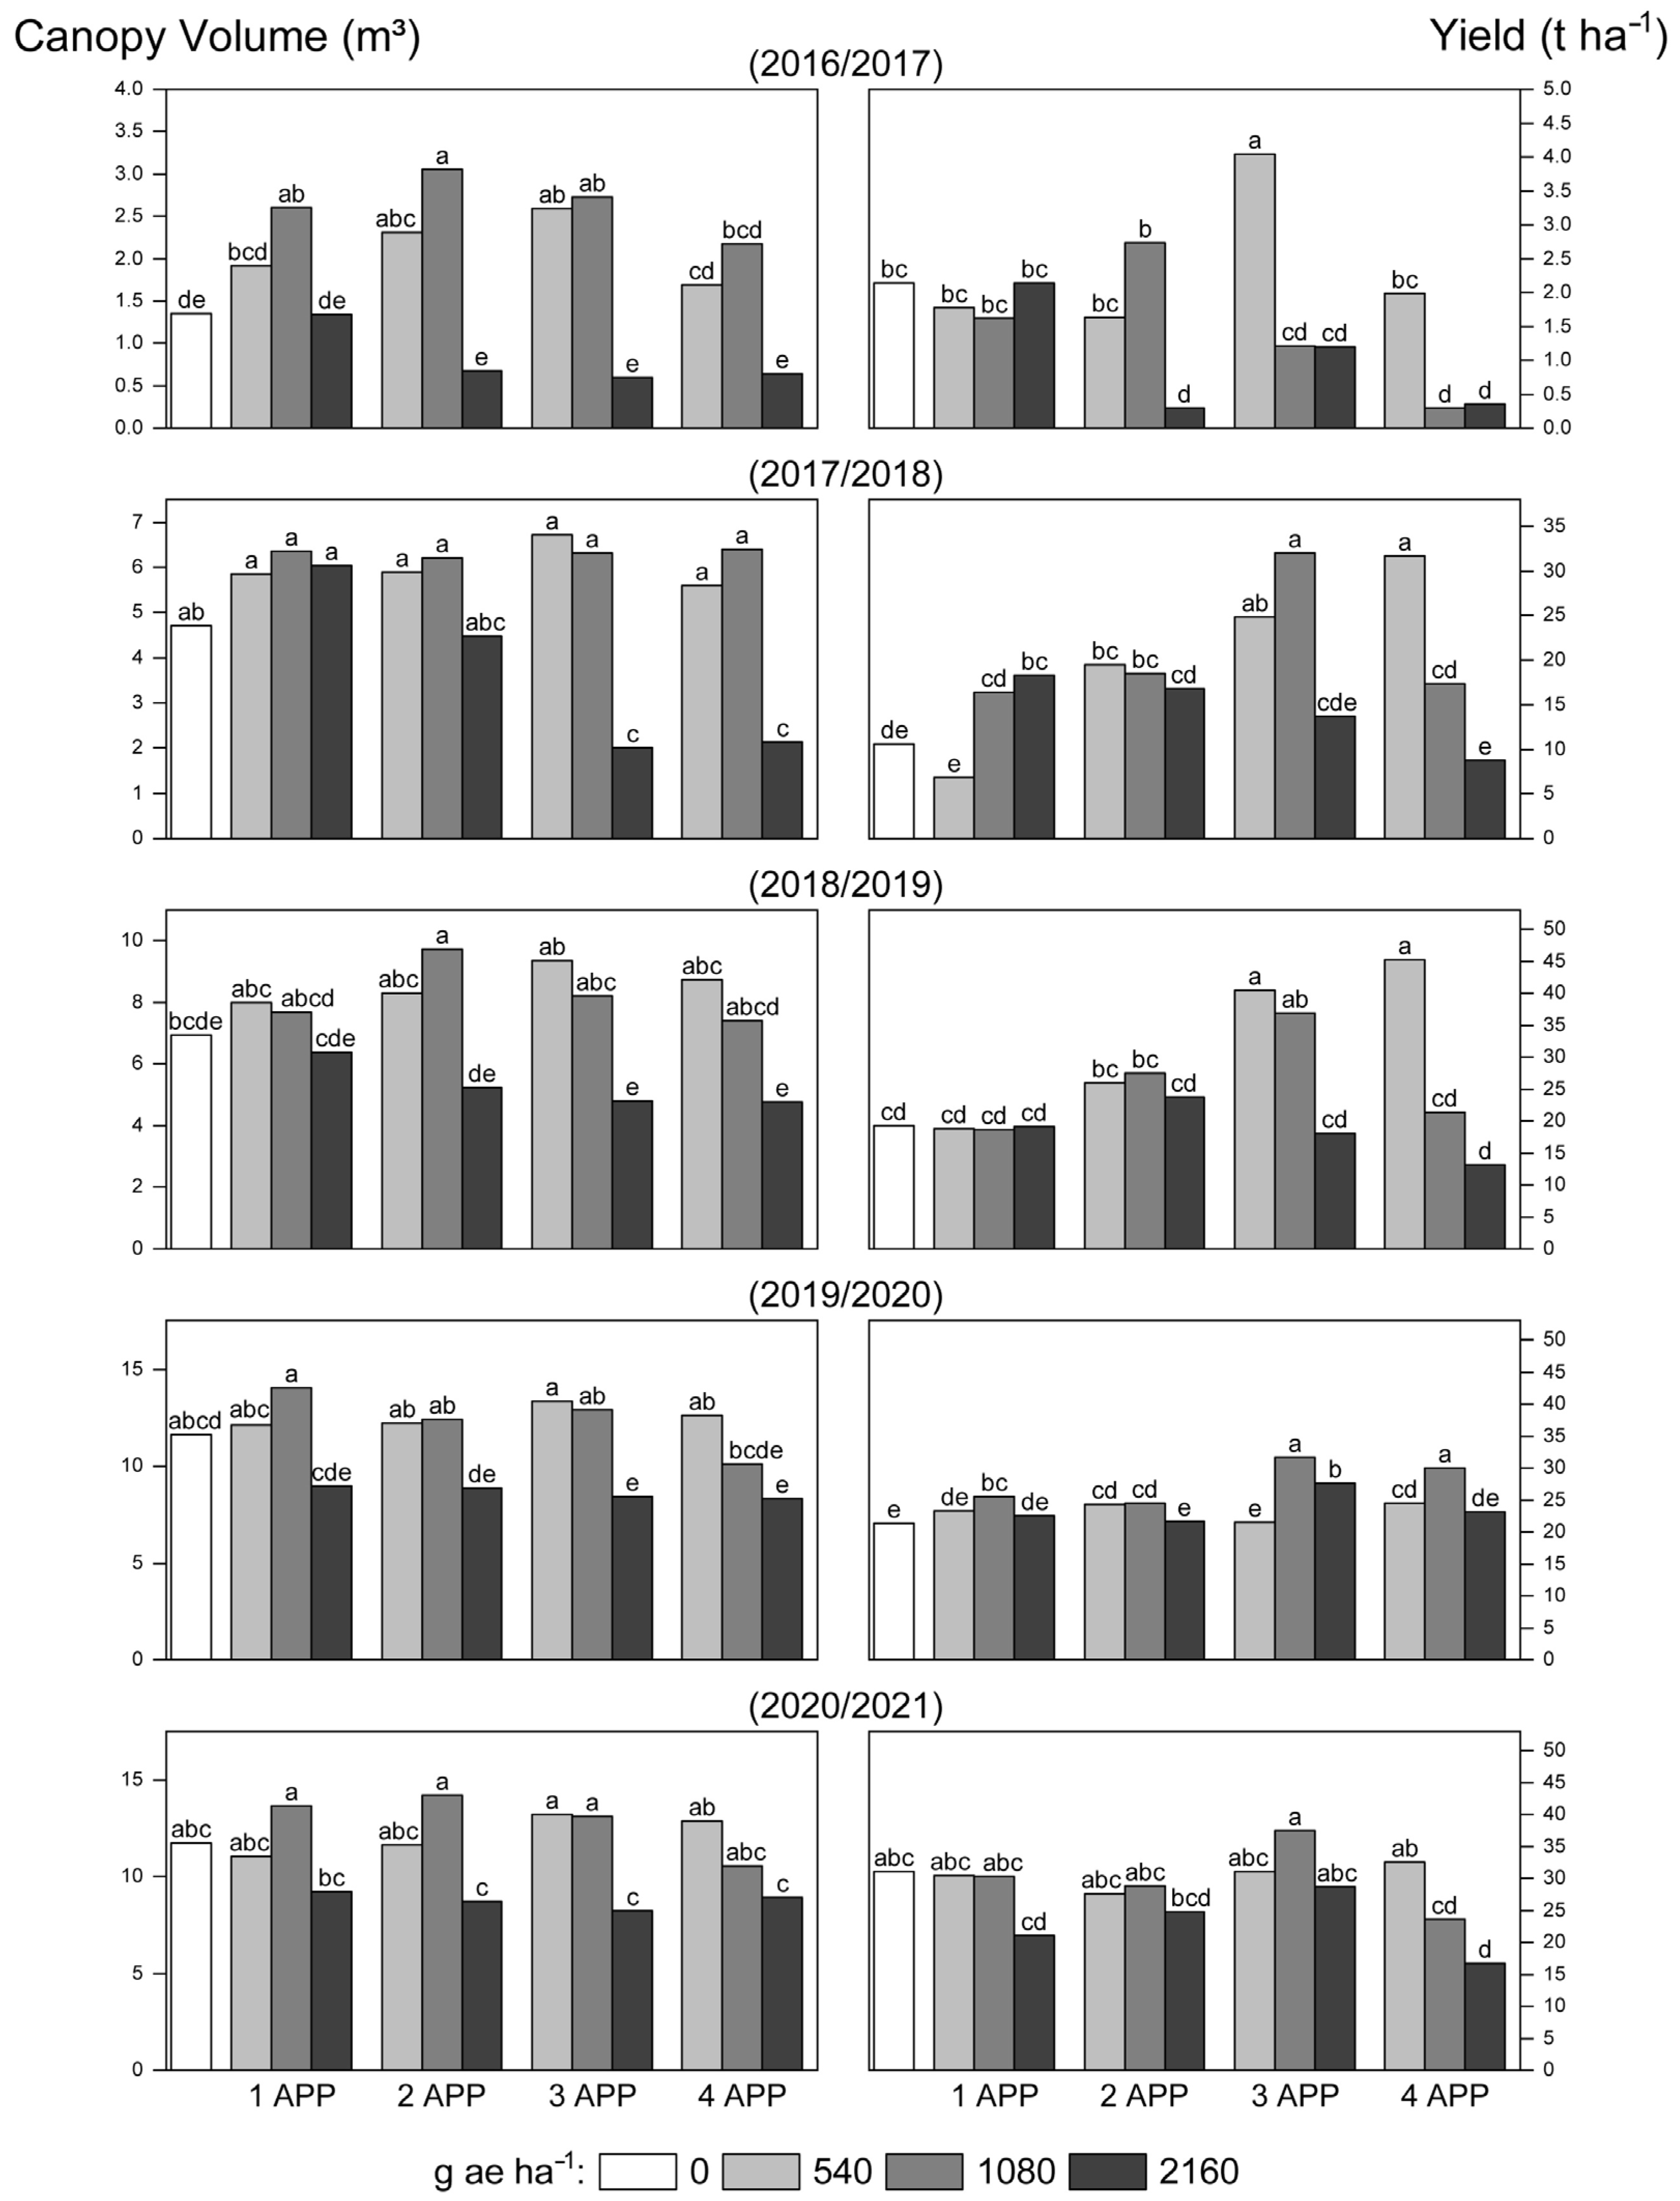
−1 (which demonstrated phytotoxicity from the start of the experiment), the citrus plants were explicitly affected by the glyphosate usage demonstrated by severe decreases in growth and fruit yield (Figure 5 and Figure A3).
Therefore, gains in plant growth and fruit yield were also demonstrated in this study when using glyphosate at certain dosages. In addition, as it is a perennial crop, it is extremely important to consider the climatic factors of the growing seasons in fruit production. The high yield values of 2017/2018 on the best treatments, even for an orchard of 3.5 years, were due to additional production, with out-of-season fruits harvested in December 2018, which is characteristic of the Pêra orange variety [20]. In 2018/2019, the high production can be explained as this growing season has demonstrated the fifth-largest orange crop of the last 30 years, with ideal climatic conditions that allowed an excellent flowering, fruit fixation, and production of orange fruits in the Brazilian citrus belt [41], with the highest rainfall values among the growing seasons of this study (1413 mm; Figure A1).
In 2019/2020, the lowest production can be explained by the highest yield drop of the last 33 years in the Brazilian citrus belt (São Paulo State and Triângulo Mineiro region in Minas Gerais State), confirmed by the 30.6% reduction, which was explained by the association of two effects: The biennial crop cycle (high production 2018/2019) and the adverse climate throughout the harvest [42], which was the lowest rainfall season of this study (1096 mm; Figure A1). In addition, in this growing season, the highest growth of citrus plants was seen until then, which may have decreased the differences between the treatments with the low and high use of glyphosate, causing a type of dilution effect of the phytotoxic effect.
However, in the last growing season (2020/2021), significant reductions in the citrus plants’ growth and yield were once again observed in the worst treatments. In addition, an adverse climate throughout the harvest was evidenced by the climate phenomenon of 2020 La Niña: With drought and high temperatures in the period of fixation of the newly formed fruits [43]. Furthermore, it is important to highlight that in this last growing season, no dilution of the phytotoxic effect of glyphosate was observed as in 2019/2020, since the plants reached their growth limit.

4.3. Main Effects and Their Relationships

To evaluate the technical feasibility versus the financial viability of glyphosate, first as an herbicide in citrus, since the greatest glyphosate dosage (dose and application frequency) has occasionally shown greater weed control, and as there were no correlations between the weed control levels and citrus plant yield in 5-years of evaluations, this corroborates once again that the phytotoxic effect on the crop was predominant when glyphosate was used in excess, given the benefits of decreased competition with weeds.
Moreover, the visual symptoms of phytotoxicity caused by glyphosate were not detected from the third evaluated growing season onwards. However, there was a plant development inhibition, with lower growth and fruit yield caused by the excessive use of glyphosate in citrus plants, which demonstrates a possible hidden phytotoxicity: Even when citrus plants stop externalizing symptoms, they have lower levels of growth and yields, which are not caused by weed competition as demonstrated by their lack of correlations.
In summary, the phytotoxic effects were the main concern for the citrus growers in glyphosate management. This was supported by the PCA results. The phytotoxicity evaluations carried out in the first 2 years had an effect even in later years, which was not expected. Therefore, this is the first report that demonstrates the decrease of citrus plants yield over time, which is due to the phytotoxic effect of glyphosate when used in excess, inhibiting its growth, and consequently decreasing its productive potential in a more significant way than its beneficial effects as an herbicide, including in the financial sphere.
However, it is important to highlight that there were gains in growth, fruit yield, and consequently higher return of investment as demonstrated in this study, which indicates that glyphosate can be used as a crucial tool for the management of weeds in citrus, on the condition that it is used with correct annual doses and application frequencies, even if weed control has not been satisfactory.

4.4. Concluding Remarks

In perennial cultivation systems, in which coexistence is present with weeds throughout the growing season, such as citrus, chemical control should be carried out with great caution. Decision-making should be first based on the possible phytointoxication of the crop, and then on the control of the main weeds. This should be carried out through an appropriate weed control program, with more effective herbicides for the predominant weeds and more selective to the crop, among which glyphosate can be inserted if used correctly.
Moreover, another problem to be highlighted is the incoherence of the herbicide labels produced in Brazil, whether due to a lack of initiative by producing companies and/or by regulatory agencies. As an example, the Roundup Original® [1] recommended doses of up to 1780 g ae ha−1 for many weed species found in citrus orchards in the region of this study, which in theory, can control it, but can also intoxicate the orchard. Even in 2021, this pattern is followed by other glyphosate-based herbicides, as a new formulation of the glyphosate (Roundup Original Mais®) recommends in its label a specific dose range for citrus orchards, but with doses that can reach up to 2160 g ae ha−1 and with a maximum of three applications per year, in the same crop group as coffee, eucalyptus, and sugarcane [44]. In addition, other glyphosate-based herbicides also indicate only the dosage for the control of certain species, without at least mentioning for which crop it can be used.
Therefore, an herbicides program should be used with different mechanisms of action, in which glyphosate can be inserted at dosages that do not intoxicate the crop, and in association with other control methods, which rely on integrated weed management (IWM) principles. For example, ecological mowing proved to be an IWM option for citrus, also within FAO preconized CA premises, as this management strategy produces an in-situ mulch by the deposition of the mowed cover crop biomass on the tree-row, enhancing weed control and the citrus growth and fruit yield [4,5].
Considering that the phytointoxication symptoms caused by glyphosate may not be significantly externalized, as seen during this study, many citrus growers may have phytointoxication problems in their orchards, without the ability for diagnosis—if they always use high doses and/or high application frequencies in their weed management, plants may present the same growth and fruit production patterns. This leads to large financial losses over time, without the knowledge of the citrus growers.

5. Conclusions

For the first time in the literature, the present study demonstrates the results of the excessive use of glyphosate and its implications in citrus orchards. Herein, it is possible to validate the hypothesis and conclude that glyphosate doses above 1080 g ae ha−1 with application frequencies from three times a year do not always increase weed control but decrease orchard growth and yield over time by its phytointoxication over time, as the damages caused by glyphosate when misused surpasses its benefits as an herbicide, decreasing the financial return. Nevertheless, further studies should be conducted to identify how glyphosate can affect citrus metabolism and/or how citrus varieties behave due to this herbicide phytointoxication.

Supplementary Materials

The following supporting information can be downloaded at: https://www.mdpi.com/article/10.3390/agronomy12020453/s1. Table S1: Weed species identified in the experimental area and its herbicide resistance cases already reported [29,31,45].

Author Contributions

Conceptualization, R.M., P.A.M., F.A.d.A.; supervision, R.M., L.R.R.J., P.A.M., F.A.d.A.; methodology, R.M., L.R.R.J., P.A.M., F.A.d.A.; formal analysis, R.M., F.A.d.A.; software, R.M.; data curation, R.M., L.R.R.J., F.A.d.A.; investigation, R.M., R.A.-d.l.C., P.M.d.C.; writing—original draft, R.M., L.R.R.J., R.A.-d.l.C., P.M.d.C., P.A.M., F.A.d.A.; writing—review and editing, R.M., R.A.-d.l.C., P.M.d.C., P.A.M., F.A.d.A.; resources, F.A.d.A. All authors have read and agreed to the published version of the manuscript.

Funding

We thank the State of São Paulo Foundation for Research Support (FAPESP; process: 2020/12004-4) in financially supporting this project, the Coordination for the Improvement of Higher Education Personnel (CAPES; 88887.144808/2017 and 1757830/2018), and the National Council for Scientific and Technological Development (CNPq; 309777/2020-8) for granting scholarships to R Martinelli and FA Azevedo, respectively.

Data Availability Statement

The datasets generated during and/or analyzed during the current study are available from the corresponding author on reasonable request.

Conflicts of Interest

The authors declare no competing interests.

Appendix A

Figure A1. Average quarterly values of minimum and maximum temperature, and accumulated rainfall during the experimental period (2016–2021).
Agronomy 12 00453 g0a1
Figure A2. Phytotoxicity symptoms of glyphosate in Pêra orange plants in the different treatments: Doses from 0 to 2160 g ae ha−1 and application frequency per growing season, from 1 to 4 applications (APP).
Agronomy 12 00453 g0a2
Figure A3. Pêra sweet orange plants under the different doses of glyphosate from the first (2016/2017) to the fifth growing season (2020/2021). Arrows indicate the height of 2.0 m on the graduate scale.
Agronomy 12 00453 g0a3

Appendix B

Table A1. Equation parameters obtained by the logistic model for the biomass accumulation data of BIDPI (Bidens pilosa), ERICA (Conyza canadensis), and RAPRA (Raphanus raphanistrum), for the three collected biotypes. The values of x50 represent the effective dose for a 50% reduction in survival rate (LD50) and biomass accumulation (GR50), respectively, and R represents the x50 values ratio between biotypes B1 and B2 with B3.
SpecieBiotypeEquation ParametersR
cbX50
SurvivalBIDPIB1−0.114.5878.031.00
(LD50) B2−0.15.91472.850.54
B3−0.114.5878.03-
ERICAB1−140.21.7661,0121.15
B2−27.91.7720,6000.39
B321.60.7553,064-
RAPRAB1−0.00116.96178.71.00
B2−0.00116.95178.741.00
B3−0.00117.08179.32-
Biomass reductionBIDPIB1−14.131.13511.910.10
(GR50) B212.41.63118.412.34
B38.61.0450.68-
ERICAB1−80.740.052201.51.40
B2−153.020.4889505.69
B3−39.630.361571.6-
RAPRAB11.233.51140.861.17
B21.951.6595.490.79
B31.452.01120.88-

References

  1. Ministério da Agricultura, Pecuária e Abastecimento—MAPA. Agrofit 2003: Sistema de Agrotóxicos Fitossanitários. 2021. Available online: http://agrofit.agricultura.gov.br/agrofit_cons/principal_agrofit_cons (accessed on 31 July 2021).
  2. Duke, S.O. Glyphosate: Environmental fate and impact. Weed Sci. 2020, 68, 201–207. [Google Scholar] [CrossRef]
  3. Myers, J.P.; Antoniou, M.N.; Blumberg, B.; Carroll, L.; Colborn, T.; Everett, L.G.; Hansen, M.; Landrigan, P.J.; Lanphear, B.P.; Mesnage, R.; et al. Concerns over use of glyphosate-based herbicides and risks associated with exposures: A consensus statement. Environ. Health 2016, 15, 19. [Google Scholar] [CrossRef] [PubMed] [Green Version]
  4. Martinelli, R.; Monquero, P.A.; Fontanetti, A.; Conceição, P.M.; Azevedo, F.A. Ecological Mowing: An Option for Sustainable Weed Management in Young Citrus Orchards. Weed Technol. 2017, 31, 260–268. [Google Scholar] [CrossRef]
  5. Martinelli, R. Sustainable Weed Management in Citrus: Implications of Glyphosate on Crop Metabolism and Control Strategies. Ph.D. Thesis, Instituto Agronômico de Campinas-IAC, Campinas, Brazil, 2021; p. 105. [Google Scholar] [CrossRef]
  6. Haslam, E. Shikimic Acid: Metabolism and Metabolites; Wiley: Chichester, UK, 1993. [Google Scholar]
  7. Herrmann, K.M. The Shikimate Pathway: Early Steps in the Biosynthesis of Aromatic Compounds. Plant Cell 1995, 7, 907–919. [Google Scholar] [CrossRef] [PubMed]
  8. Monaco, T.J.; Weller, S.C.; Ashton, F.M. Weed Science: Principles and Practices, 4th ed.; John Wiley & Sons: New York, NY, USA, 2002. [Google Scholar]
  9. Maeda, H.; Dudareva, N. The Shikimate Pathway and Aromatic Amino Acid Biosynthesis in Plants. Annu. Rev. Plant Biol. 2012, 63, 73–105. [Google Scholar] [CrossRef]
  10. Tucker, D.P.H. Glyphosate injury symptom expression in citrus. HortScience 1977, 12, 498–500. [Google Scholar]
  11. Toth, J.; Morrison, G. Glyphosate drift damages fruit trees. Agric. Gaz. New South Wales 1977, 88, 44–45. [Google Scholar]
  12. Erickson, C.G. Management of glyphosate-related citrus fruit drop. Proc. Fla. State Hortic. Soc. 1996, 109, 40–42. [Google Scholar]
  13. Gravena, R.; Filho, R.V.; Alves, P.L.C.; Mazzafera, P.; Gravena, A.R. Low glyphosate rates do not affect Citrus limonia (L.) Osbeck seedlings. Pest Manag. Sci. 2009, 65, 420–425. [Google Scholar] [CrossRef]
  14. Matallo, M.; Almeida, S.; Cerdeira, A.; Franco, D.; Luchini, L.; Moura, M.; Duke, S. Monitoramento do ácido chiquímico no manejo de plantas daninhas com glifosato em pomar comercial de citros. Arq. Do Inst. Biológico 2010, 77, 355–358. [Google Scholar] [CrossRef]
  15. Gravena, R.; Filho, R.V.; Alves, P.L.C.A.; Mazzafera, P.; Gravena, A.R. Glyphosate has low toxicity to citrus plants growing in the field. Can. J. Plant Sci. 2012, 92, 119–127. [Google Scholar] [CrossRef]
  16. Alvares, C.A.; Stape, J.L.; Sentelhas, P.C.; de Moraes Gonçalves, J.L.; Sparovek, G. Köppen’s climate classification map for Brazil. Meteorol. Z. 2013, 22, 711–728. [Google Scholar] [CrossRef]
  17. Streibig, J.C.; Rudemo, M.; Jensen, J.E. Dose-response curves and statistical models. In Herbicide Bioassays; Streibig, J.C., Kudsk, P., Eds.; CRC: Boca Raton, FL, USA, 1993; pp. 29–55. [Google Scholar]
  18. Seefeldt, S.S.; Jensen, J.E.; Fuerst, E.P. Log-Logistic Analysis of Herbicide Dose-Response Relationships. Weed Technol. 1995, 9, 218–227. [Google Scholar] [CrossRef]
  19. Dear, B.S.; Sandral, G.A.; Spencer, D.; Khan, M.R.I.; Higgins, T.J.V. The tolerance of three transgenic subterranean clover (Trifolium subterraneum L.) lines with the bxn gene to herbicides containing bromoxynil. Aust. J. Agric. Res. 2003, 54, 203–210. [Google Scholar] [CrossRef] [Green Version]
  20. Pio, R.M.; Figueiredo, J.O.; Stuchi, E.S.; Cardoso, S.A.B. Citros. In Variedades Copa; Mattos, D., Jr., de Negri, J.D., Pio, R.M., Pompeu, J., Jr., Eds.; Centro APTA Citros Sylvio Moreira: Cordeirópolis, Brazil, 2008; pp. 37–60. [Google Scholar]
  21. Mendel, K. Rootstock-scion relationships in Shamouti trees on light soil. KTAVIM 1956, 6, 35–60. [Google Scholar]
  22. HFBRASIL—Preços Médios dos Hortifrutícolas. Available online: https://www.hfbrasil.org.br/br/banco-de-dados-precos-medios-dos-hortifruticolas.aspx?produto=9&regiao%5B%5D=112&periodicidade=anual&ano_inicial=2017&ano_final=2021# (accessed on 22 September 2021).
  23. Jolliffe, I.T. Principal Component Analysis, 2nd ed.; Springer: New York, NY, USA, 2002. [Google Scholar]
  24. Zuur, A.F.; Ieno, E.N.; Smith, G.M. Principal component analysis and redundancy analysis. In Analysing Ecological Data; Zuur, A., Ieno, E.N., Smith, G.M., Eds.; Springer: New York, NY, USA, 2007; pp. 193–224. [Google Scholar]
  25. Origin (Pro). Version 2019; OriginLab Corporation: Northampton, MA, USA, 2020. [Google Scholar]
  26. De Mendiburu, F. Agricolae: Statistical Procedures for Agricultural Research. R Package Version 1.3.5. 2021. Available online: https://cran.r-project.org/web/packages/agricolae/agricolae.pdf (accessed on 31 July 2021).
  27. Ritz, C.; Streibig, J.C. Drc: Analysis of Dose-Response Curve Data Version 3.0-1. 2016. Available online: http://cran.r-project.org/web/packages (accessed on 1 June 2021).
  28. R Development Core Team. A Language and Environment for Statistical Computing; R Foundation for Statistical Computing: Vienna, Austria, 2001; Available online: http://www.r-project.org/ (accessed on 1 June 2021).
  29. Alcántara-de la Cruz, R.; Fernández-Moreno, P.T.; Ozuna, C.V. Target and non-target site mechanisms developed by glyphosate-resistant hairy beggarticks (Bidens pilosa L.). Front. Plant Sci. 2016, 7, 1492. [Google Scholar] [CrossRef] [Green Version]
  30. Ashworth, M.B.; Walsh, M.J.; Flower, K.C.; Powles, S.B. Identification of the first glyphosate-resistant wild radish (Raphanus raphanistrum L.) populations. Pest Manag. Sci. 2014, 70, 1432–1436. [Google Scholar] [CrossRef]
  31. Heap, I. The International Survey of Herbicide Resistant Weeds. 2020. Available online: www.weedscience.org (accessed on 13 July 2020).
  32. Moreira, M.; Nicolai, M.; Carvalho, S.; Christoffoleti, P. Resistência de Conyza canadensis e C. bonariensis ao herbicida glyphosate. Planta Daninha 2007, 25, 157–164. [Google Scholar] [CrossRef] [Green Version]
  33. Monquero, P.A.; Christoffoleti, P.J. Banco de sementes de plantas daninhas e herbicidas como fator de seleção. Bragantia 2005, 64, 203–209. [Google Scholar] [CrossRef] [Green Version]
  34. Owen, M.J.; Martinez, N.J.; Powles, S. Multiple herbicide-resistant wild radish (Raphanus raphanistrum) populations dominate Western Australian cropping fields. Crop Pasture Sci. 2015, 66, 1079–1085. [Google Scholar] [CrossRef]
  35. Reddy, K.N.; Singh, M. Germination and Emergence of Hairy Beggarticks (Bidens pilosa). Weed Sci. 1992, 40, 195–199. [Google Scholar] [CrossRef]
  36. Bhowmik, P.C.; Bekech, M.M. Horseweed (Conyza canadensis) seed production, emergence, and distribution in no-tillage and conventional-tillage corn (Zea mays). Agron. Trends Agric. Sci. 1993, 1, 67–71. [Google Scholar]
  37. Vanella, G.; Salyani, M.; Balsari, P.; Futch, S.H.; Sweeb, R.D. A Method for Assessing Drift Potential of a Citrus Herbicide Applicator. HortTechnology 2011, 21, 745–751. [Google Scholar] [CrossRef] [Green Version]
  38. Neumann, G.; Kholls, S.; Landsberg, E.; Stock-Oliveira Souza, K.; Yamada, T. Relevance of glyphosate transfer to non-target plants via the rhizosphere. J. Plant Dis. Prot. 2006, 20, 963–969. [Google Scholar]
  39. Tesfamariam, T.; Bott, S.; Cakmak, I.; Römheld, V.; Neumann, G. Glyphosate in the rhizosphere—Role of waiting times and different glyphosate binding forms in soils for phytotoxicity to non-target plants. Eur. J. Agron. 2009, 31, 126–132. [Google Scholar] [CrossRef]
  40. Mamy, L.; Barriuso, E.; Gabrielle, B. Glyphosate fate in soils when arriving in plant residues. Chemosphere 2016, 154, 425–433. [Google Scholar] [CrossRef] [PubMed]
  41. Fundo de Defesa da Citricultura—FUNDECITRUS. Levantamento de Safra. 2020. Available online: https://www.fundecitrus.com.br/pdf/pes_relatorios/0420_Reestimativa_da_Safra_de_Laranja.pdf (accessed on 12 July 2020).
  42. Fundo de Defesa da Citricultura—FUNDECITRUS. Levantamento de Safra. 2021. Available online: https://www.fundecitrus.com.br/pdf/pes_relatorios/0421_Fechamento_da_Safra_de_Laranja.pdf (accessed on 21 July 2021).
  43. Fundo de Defesa da Citricultura—FUNDECITRUS. 2021. Available online: https://www.fundecitrus.com.br/pdf/pes_relatorios/2021_06_18_Invent%C3%A1rio_e_Estimativa_do_Cinturao_Citricola_2021-2022.pdf (accessed on 21 July 2021).
  44. Ministério da Agricultura, Pecuária e Abastecimento—MAPA. Agrofit 2003: Sistema de Agrotóxicos Fitossanitários. 2021. Available online: http://agrofit.agricultura.gov.br/agrofit_cons/principal_agrofit_cons (accessed on 31 July 2021).
  45. Alcántara-de la Cruz, R.; da Silva Amaral, G.; de Oliveira, G.M.; Rufino, L.; Azevedo, F.; Carvalho, L.; Silva, M. Glyphosate Resistance in Amaranthus viridis in Brazilian Citrus Orchards. Agriculture 2020, 10, 304. [Google Scholar] [CrossRef]
Figure 1. The vicious and unsustainable circle of glyphosate management in Brazilian citrus orchards: Low weed control levels have resulted in the increase in glyphosate usage and the selection pressure of resistant/tolerant weeds, as well as the possible intoxication of the crop. The photos are from reports of citrus growers after glyphosate usage.
Agronomy 12 00453 g001
Figure 2. Weed control in the citrus intra-row under the different doses (g ae ha−1) and application frequencies of glyphosate (1 to 4 APP year−1) from the first (2016/2017) to the fifth growing season (2020/2021). The means followed by the same letter within each growing season do not differ by Tukey’s honestly significant difference test (α = 0.05). The data represent the average of four evaluations performed during each agricultural year, always performed at 30 days after each glyphosate application.
Agronomy 12 00453 g002
Figure 3. Dose-response curves to glyphosate by the four-parameter logistic model for the survival rate and biomass accumulation data of BIDPI (Bidens pilosa), ERICA (Conyza canadensis), and RAPRA (Raphanus raphanistrum) for the three collected biotypes. B1: Low glyphosate; B2: High glyphosate; e, B3: Olímpia-SP biotype. The values of the logistic equations’ parameters are found in Table A1. The values of X50 represent the effective dose for a 50% reduction in the survival rate by the lethal dose (LD50) and biomass accumulation by growth reduction (GR50), respectively.
Agronomy 12 00453 g003
Figure 4. Phytotoxicity symptoms by the crop tolerance to the herbicides scale of the European Weed Research Council (EWRC) of citrus plants under the different doses (g ae ha−1) and application frequencies (1 to 4 APP per growing season) of glyphosate in 2016/2017 and 2017/2018. The means followed by the same letter within each growing season do not differ by Tukey’s honestly significant difference test (α = 0.05). The data represent the average of four evaluations performed during each agricultural year, performed 30 days after each glyphosate application.
Agronomy 12 00453 g004
Figure 5. Canopy volume and yield of Pêra orange plants under the different doses and application frequency (1 to 4 APP year−1) of glyphosate from the first (2016/2017) to the fifth growing season (2020/2021). The means followed by the same letter within each growing season do not differ by Tukey’s honestly significant difference test (α = 0.05). For 2018/2019, two fruit productions totaled the yield values.
Agronomy 12 00453 g005
Figure 6. Biplot of principal component analysis (PCA) by the correlation matrix, for the variables evaluated in the five growing seasons; Phyto: Phytotoxicity; WC: Weed control; CV: Canopy volume; .1 to .5: The variables evaluated in each growing season, from the first (2016/2017) to the fifth (2020/2021).
Agronomy 12 00453 g006
Figure 7. Investment and return of investment (ROI) based on the 5-year accumulated yield of Pêra orange plants under the control treatment (mechanical control), and different doses (540–2160 g ae ha−1) and frequency of annual application (1–4 APP) of glyphosate. The sum between the investment and ROI results in the gross return (total of each column).
Agronomy 12 00453 g007
Table 1. ANOVA summary, with values of the F-test and degrees-of-freedom (df), with the indication of significance (p > F) for weed control, phytotoxicity, canopy volume, and yield, during five growing seasons. p-values > F, ***: p < 0.001; **: p < 0.01. The degrees-of-freedom on the weed control was one-degree inferior, as this data is relative to the control treatment.
Growing SeasonsVariables
Weed ControlPhytotoxicityCanopy VolumeYield
dfF-TestdfF-TestdfF-TestdfF-Test
2016/20171165.9 ***1234.5 ***126.0 ***1218.9 ***
2017/20181127.9 ***1243.9 ***128.6 ***1226.4 ***
2018/20191124.5 ***--1211.5 ***1217.7 ***
2019/20201145.5 ***--123.8 **1256.3 ***
2020/20211117.2 ***--127.9 ***127.1 ***
Publisher’s Note: MDPI stays neutral with regard to jurisdictional claims in published maps and institutional affiliations.

