Article

Relationship between Grain Yield and Quality Traits under Optimum and Low-Nitrogen Stress Environments in Tropical Maize

1
International Maize and Wheat Improvement Center (CIMMYT), ICRAF House, UN Avenue, Gigiri, Nairobi P.O. Box 1041-00621, Kenya
2
School of Agriculture and Natural Resources, Moi University, Eldoret P.O. Box 3900-30100, Kenya
3
International Maize and Wheat Improvement Center (CIMMYT), Harare P.O. Box MP163, Zimbabwe
4
Department of Plant Sciences, University of the Free State, P.O. Box 339, Bloemfontein 9300, South Africa
*
Author to whom correspondence should be addressed.
Agronomy 2022, 12(2), 438; https://doi.org/10.3390/agronomy12020438
Submission received: 29 December 2021 / Revised: 6 February 2022 / Accepted: 7 February 2022 / Published: 10 February 2022

Abstract

:
Breeding for nitrogen use efficiency (NUE) is important to deal with food insecurity and its effect on grain quality, particularly protein. A total of 1679 hybrids were evaluated in 16 different trials for grain yield (GY), grain quality traits (protein, starch and oil content) and kernel weight (KW) under optimum and managed low soil nitrogen fields in Kiboko, Kenya, from 2011 to 2014. The objectives of our study were to understand (i) the effect of low soil N stress on GY and quality traits, (ii) the relationship between GY and quality traits under each soil management condition and (iii) the relationship of traits with low-N versus optimum conditions. From the results, we observed the negative effects of low N on GY, KW and the percentage of protein content, and a positive effect on the percentage of starch content. The correlation between GY and all quality traits was very weak under both soil N conditions. GY had a strong relationship with KW under both optimum and low soil N conditions. Protein and starch content was significantly negative under both optimum and low-N conditions. There was no clear relationship among quality traits under optimum and low N, except for oil content. Therefore, it seems feasible to simultaneously improve GY along with quality traits under both optimum and low-N conditions, except for oil content. However, the negative trend observed between GY (starch) and protein content suggests the need for the regular monitoring of protein and starch content to identify varieties that combine both high GY and acceptable quality. Finally, we recommend further research with a few tropical maize genotypes contrasting for NUE to understand the relationship between the change in grain quality and NUE under low-N conditions.

1. Introduction

Maize is a staple food in sub-Saharan Africa (SSA) where it is the primary source of daily calorie and protein intake for more than 80 percent of the population [1]. In SSA, a total of more than 43 million hectares (ha) of arable land was devoted to maize production, from which only 90 million metric tons (t) of grain was harvested in 2020 [2]. The average productivity of the crop (2 t/ha) in the region, is far below the world average (6 t/ha), partly due to the limited use of production inputs (e.g., N fertilizers) by small-scale farmers who cannot afford them [3,4]. Average fertilizer application in the world is 137 kg per ha, whereas in SSA, it is estimated to be less than 8 kg per ha, the lowest of any region in the world [4,5]. Among all nutrients, N is considered to be the most limiting in crop production [6]. Although Africa accounts for almost 20% of global land area under maize cultivation, it accounts only for less than 4% of N fertilizer application [2].
Due to the high cost of fertilizers, the trend in the current use of chemical fertilizers by resource-poor farmers in SSA is less likely to show significant change in the short term. Improved agronomic practices and the development of nitrogen use efficiency (NUE) varieties, which are efficient in capturing and utilizing the limited quantities of the applied fertilizers, may play a vital role in improving the productivity of maize-based cropping systems in the region. The existing genetic variation in various crops for different types of stresses, including low soil nitrogen [7,8,9,10,11], can be exploited to address poor soil fertility-related stresses in SSA. However, there is a concern regarding the possibility of losing the nutritional quality of maize while breeding maize germplasm for NUE.
The effect of N fertilization on grain yield and kernel quality traits had long been studied. Tsai et al. [6] observed a significant effect of N fertilizer on grain yield, kernel texture and protein concentration in eight maize varieties evaluated under different N fertilizer levels. By comparing 36 widely grown US commercial hybrids that were released in different eras, Duvick [12] observed a higher percentage of starch content and a lower percentage of grain protein content in newer varieties as compared to older ones under stress environments. These changes are possibly due to the focus only on grain yield under different biotic and abiotic stresses, including low-N tolerance. Likewise, an F2:3 mapping population evaluated under optimum and low soil nitrogen levels showed a reduction in grain protein content and an increase in grain starch content under low soil N levels [13]. Worku et al. [8] evaluated three quality protein maize (QPM) and 13 non-QPM varieties differing in grain yield under different N levels, and reported the increasing effect of applied N on protein quantity in both QPM and non-QPM varieties. In a few cases where oil was studied [12,14], it seemed to be unaffected by soil N levels. Different authors have suggested different reasons for the change in grain quality, particularly for its starch and protein content [8,12,15,16].
The physiological mechanism behind the changes in quality traits could be due to the variation among genotypes in post-anthesis nutrient uptake, and the redistribution of N from vegetative parts to the grain sink [4,17]. Borrás et al. [18] linked differences in kernel composition to changes in the post-flowering source–sink ratio. As the number of sinks per plant increased, it resulted in a change in each kernel component, i.e., a decrease in the source–sink ratio beyond a specific threshold promoted a decrease in the relative protein content and an increase in the relative starch content, but had no effect on oil content. Duarte et al. [19] reported a much greater influence of genotypes rather than N rate on grain quality, though nitrogen fertilizers had an increasing effect on both grain yield and grain nitrogen content. They emphasized the greater importance of genotype selection over N application and other production practices for increasing maize grain quality. Previously, Tsai et al. [6] reported differences among hybrids for N requirements for maximum yield and protein concentration. Despite different physiological reasons for the change in maize kernel composition, most authors agreed on the availability of genotypic differences for grain yield and kernel composition for maize genotypes grown under different soil N conditions [6,16].
However, most of the aforementioned studies were conducted with a limited number of commercial varieties (tropical or temperate) with a soil that had a different cropping history and different applied N levels, except for Worku et al. [9], who used stress-tolerant varieties developed by the global maize program of the International Maize and Wheat Improvement Center (CIMMYT), and tested them under optimum and managed N stress fields. CIMMYT has since developed and evaluated large-set NUE germplasm under optimum and managed low-N stress environments. In addition to grain yield and other agronomic traits, information has been collected on the grain protein content, oil content and starch content of the genotypes in all optimum and low-N trials conducted in Kiboko, Kenya, since 2011. We assume that breeding maize for nitrogen use efficiency (NUE) would not affect genetic potential for grain quality traits, but genotypes might tend to have a higher percentage of starch content and a lower percentage of protein content in response to N stress [12]. Using data from yield trials conducted over four years under optimum and managed low-N stress (severe and moderate stresses) conditions, which is reflective of smallholder farming conditions in SSA, we will try to understand the effect of low soil N on the grain quality of maize. Therefore, the objective of our study was to understand: (1) the effect of low N content in soil on grain yield and quality traits; (2) the relationship between grain yield and each quality trait under optimum and low-N conditions.

2. Materials and Methods

2.1. Germplasm, Experimental Site and Trial Management

The experimental materials, consisting of 1679 genotypes, including hybrids (test crosses, single crosses, three ways crosses) and synthetics, were tested in 16 different trials (Table 1, Supplementary Table S1). Four common commercial checks were included in each trial. The parental lines of the experimental hybrids have been derived from source populations with known tolerance to low soil N stress. Each trial was composed of unique genotypes, except for checks, which were repeated across trials.
All trials were grown at the Kiboko experimental station, Kenya, between 2010 and 2014. Kiboko lies within longitudes 37.7235° E and latitudes 2.2172° S, at an elevation of 975 m above sea level. The station receives between 545 and 629 mm of rainfall split across two seasons. The long rain season is between October and January, while the short rain season is between March and September. Kiboko lies in a hot, semi-arid region with a mean annual temperature of 22.6 °C, a mean annual maximum of 28.6 °C and a mean annual minimum of 16.5 °C. The average minimum and maximum temperatures, relative humidity and rainfall for each trial is given in Table 1. The soils are well drained, very deep, dark-reddish brown to dark red, friable sandy clay to clay (Acri-Rhodic Ferralsols), developed from undifferentiated basement system rocks, predominantly banded gneisses [20]. All trials were grown under optimum and low-N conditions. The low-N block had been previously depleted of N by growing sorghum at high density with no N fertilizer sources added for four cropping cycles. The depletion crop was uprooted at near maturity and removed from the low-N field to prevent the incorporation of crop residues into the soil. Soil N analyses revealed 0.10–0.12 ppm in soil N stress experimental sites, whereas in the optimum sites, it varied from 0.21 to 0.26 ppm.
Trials under both optimum and low-N management were designed as alpha lattices [21], apart from trials number 5, 6 and 15 (Table 1), for which a randomized complete block design (RCBD) was used. The number of replications for each trial and rows per plot is indicated in Table 1. All trials were hand-planted with 2 seeds per hill at 0.75 m between rows and 0.2 m between plant stations. The planting dates of all trials are indicated in Supplementary Table S1. The plots in all trials were thinned to one seed per hill three weeks after germination to achieve a final plant density of 53,000 plants per hectare. At planting, only phosphorous fertilizer triple phosphate (46% P2O5) was applied to the low-N trials at the rate of 50 kg P2O5/ha. In optimum trials, N was applied at the rate of 192 kg N per ha in two splits. At planting, diammonium phosphate (DAP) fertilizer was used at the rate of 54 kg N per hectare.
All trials under both optimum and low N were irrigated throughout the growing period as required to avoid any moisture stress. Trials under both conditions were kept weed-free throughout the growing season, and other recommended agronomic management techniques were followed to prevent trials from other stresses. At harvest, two edge plants from either end of each harvested row were removed from all low-N trials to avoid the border effect.
Phenotypic data were collected for grain yield, grain quality (protein content, oil content and starch contents) and kernel weight. Grain yield was measured in kilograms (kg) and converted to tons per hectare and reported at 12.5% moisture. Grain quality parameters were measured using the FOSS Infratec TM 1241 from 500 g samples of grain taken from each plot, and are reported as a percentage of whole grain. The FOSS Infratec is a non-destructive whole-grain analyzer that uses near-infrared reflectance (NIR) to estimate quality parameters. Five 100 g subsamples were assayed, and the mean reading for each parameter was reported per plot. This resulted in a higher level of accuracy for each quality parameter. Kernel weight was measured in kilograms from 1000 random kernels selected from shelled grain.

2.2. Statistical Analysis

The data for both optimum and low-N stress sites were analyzed separately for each trial using the PROX Mixed procedure of SAS [22]. Low-N trials were further divided into two sets, namely, moderately stressed (MS) and severely stressed (SS), based on the percentage of yield loss in comparison to yield under optimum condition (Table 1). Genotypes were used as fixed effects and incomplete blocks as random effects. Only those traits that showed significant genotypic effects were used for the phenotypic correlation analysis. Correlation analysis between traits and scatter plots were generated using MINITAB 14.2 software [23] and R [24] separately for moderately and severely stressed trials. The broad-sense heritability of traits (repeatability of the trials) was estimated from each entry for the mean squares generated in the ANOVA.

3. Results

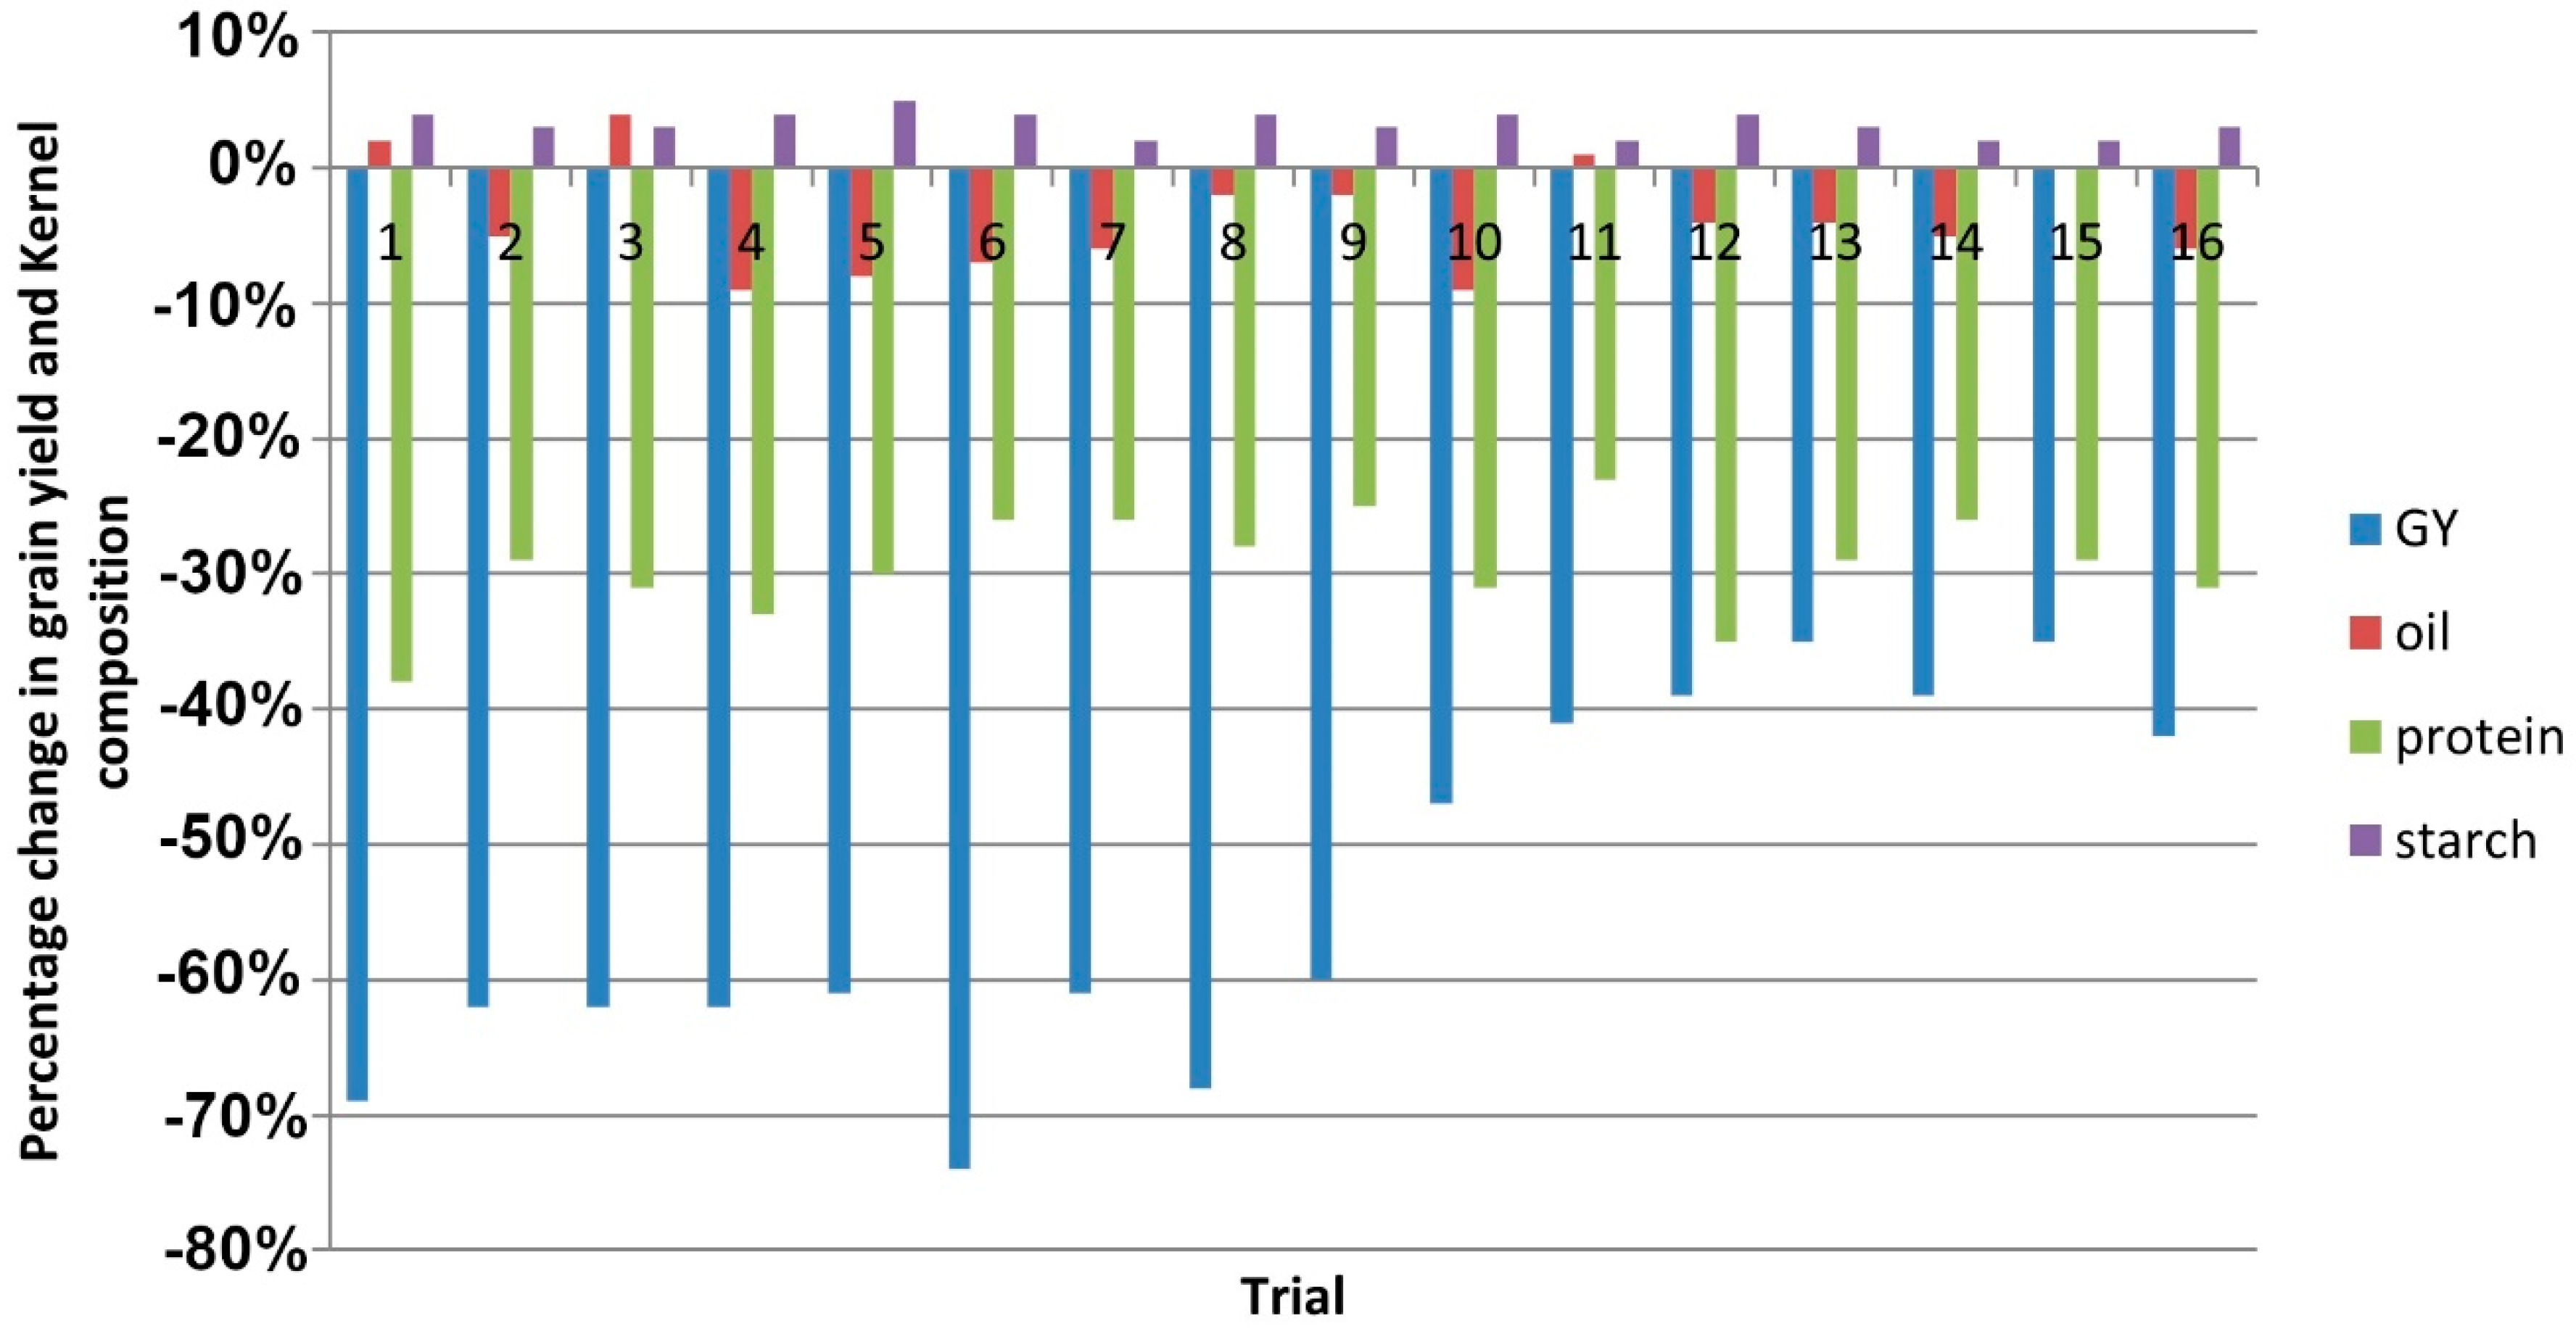
3.1. Grain Yield and Kernel Weight

The genotypic effect was highly significant for grain yield in most of the trials under both optimum and low-N conditions (Table 2). As expected, GY under optimum conditions was higher than low N in all trials and years. Low-N stress resulted in variable yield reduction, ranging from 26 to 65%. The mean performance of genotypes for grain yield across all optimum trials averaged at 9.12 t ha−1, ranging from 6.30 to 12.10 t ha−1. Under low-N conditions, the trials on average yielded 4.35 t ha−1, ranging from 2.11 to 7.07 t ha−1 (Table 2). Considering the average of all trials, high NUE varieties (high yielding under both optimum and low-N soil conditions) had a 40% and 46% yield advantage over commercial checks, and 73 and 96% over poor NUE varieties (low yielding under both optimum and low-N conditions) under optimum and low-N conditions, respectively (data not shown).

3.2. Grain Quality Traits

In this study, we measured three grain quality traits, viz., protein content, starch content and oil content. The genotypes differed significantly for all the three quality parameters in almost all trials (Table 2). Pair-wise t-tests between protein content, starch content and oil content for optimum and low-N conditions showed highly significant differences (p < 0.01) for quality traits between contrasting N conditions. However, the effect of low-N stress was different on each quality parameter (Table 2, Figure 1). The percentage of protein content in grain was generally higher under optimum conditions, whereas genotypes tended to accumulate a relatively higher percentage of starch content under low N compared to optimum (Table 2). On average, the percentage of protein was reduced by 29%, ranging from 23 to 38% in all trials, while the percentage of starch content increased by 3%, ranging from 2 to 5% in all trials. Low-N stress reduced the percentage of oil by 2 to 9% in most trials, but increased it by 1 to 4%, or left it unchanged, in three trials. The mean performance of genotypes for protein content percentage ranged from 10.06 to 11.74% with an average of 10.65% under optimum conditions, and from 7.05 to 7.92 with an average of 7.49% under low N. The percentage of starch content varied between 68.22% and 70.44% with a mean of 69.04% under optimum conditions, and from 69.98% to 73.13% with a mean of 71.24% under low-N stress. The percentage of oil content was between 4.53% and 6.24% with an average of 5.50% under optimum conditions, and 4.57% and 6.02% with an average of 5.28% under low N.
The heritability of various traits was good in most of trials, indicating that the effects were largely attributable to genotype. The heritability of grain yield was generally higher under optimum management (mean of all trials = 0.72) than under low N (mean of all trial = 0.54), as expected. Starch content and protein content had a heritability of greater than 0.60 under both management conditions, while oil content had consistently higher heritability under both management conditions (Table 2).

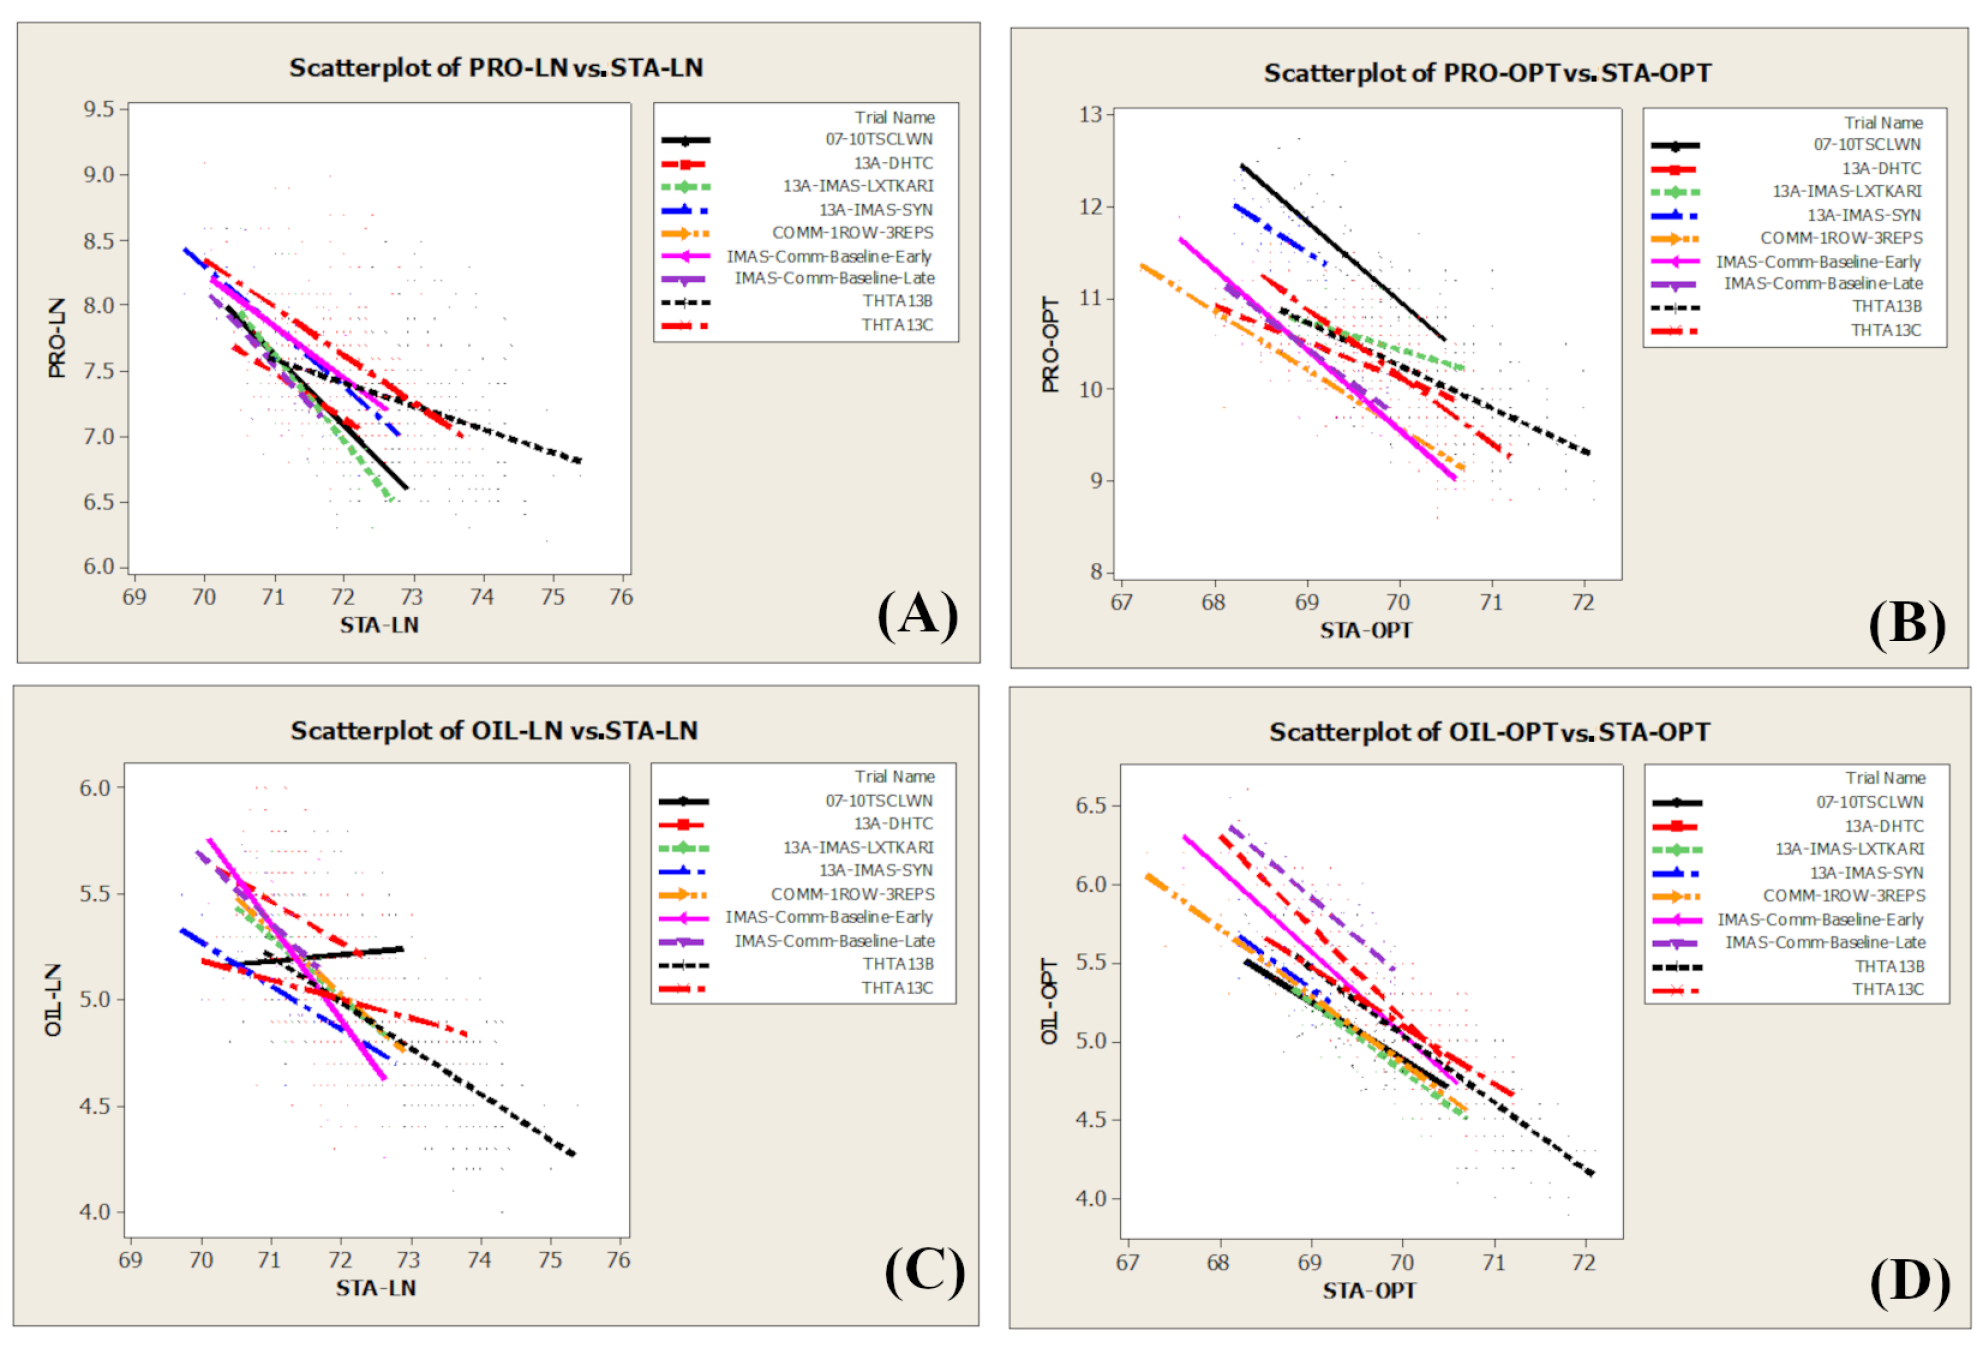
3.3. Phenotypic Correlation among Traits and between N Environments

The association between grain yield and grain quality traits was assessed under both optimum and low-N conditions. A positive and significant correlation was observed between grain yield and oil content, protein content or starch content (Table 3) in a small number of trials under both optimum and low-N conditions. However, most correlations were weak (r < 0.5) under both management conditions (Table 3). The average correlation of grain yield was negligible with oil content (r = 0.07 for optimum and r = 0.03 for low N) and starch content (r = −0.02 for optimum and r = −0.09 for low N) under both optimum and low-N conditions. The relation between grain yield and protein content was very weak under optimum (r = −0.23), but it was negligible under low-N (r = −0.08). An assessment of the relations between protein content and starch content was negative under both optimum and low-N conditions (Figure 2), and so was the relation between starch content and oil content. On the other hand, grain yield was positively correlated with kernel weight under both optimum (mean r = 0.46) and low-N (r = 0.30) conditions (Table 3). Generally, the mean correlation between grain yield was very low with all grain quality traits, but the relationship between gain yield and kernel weight tended to be relatively high (Table 3).

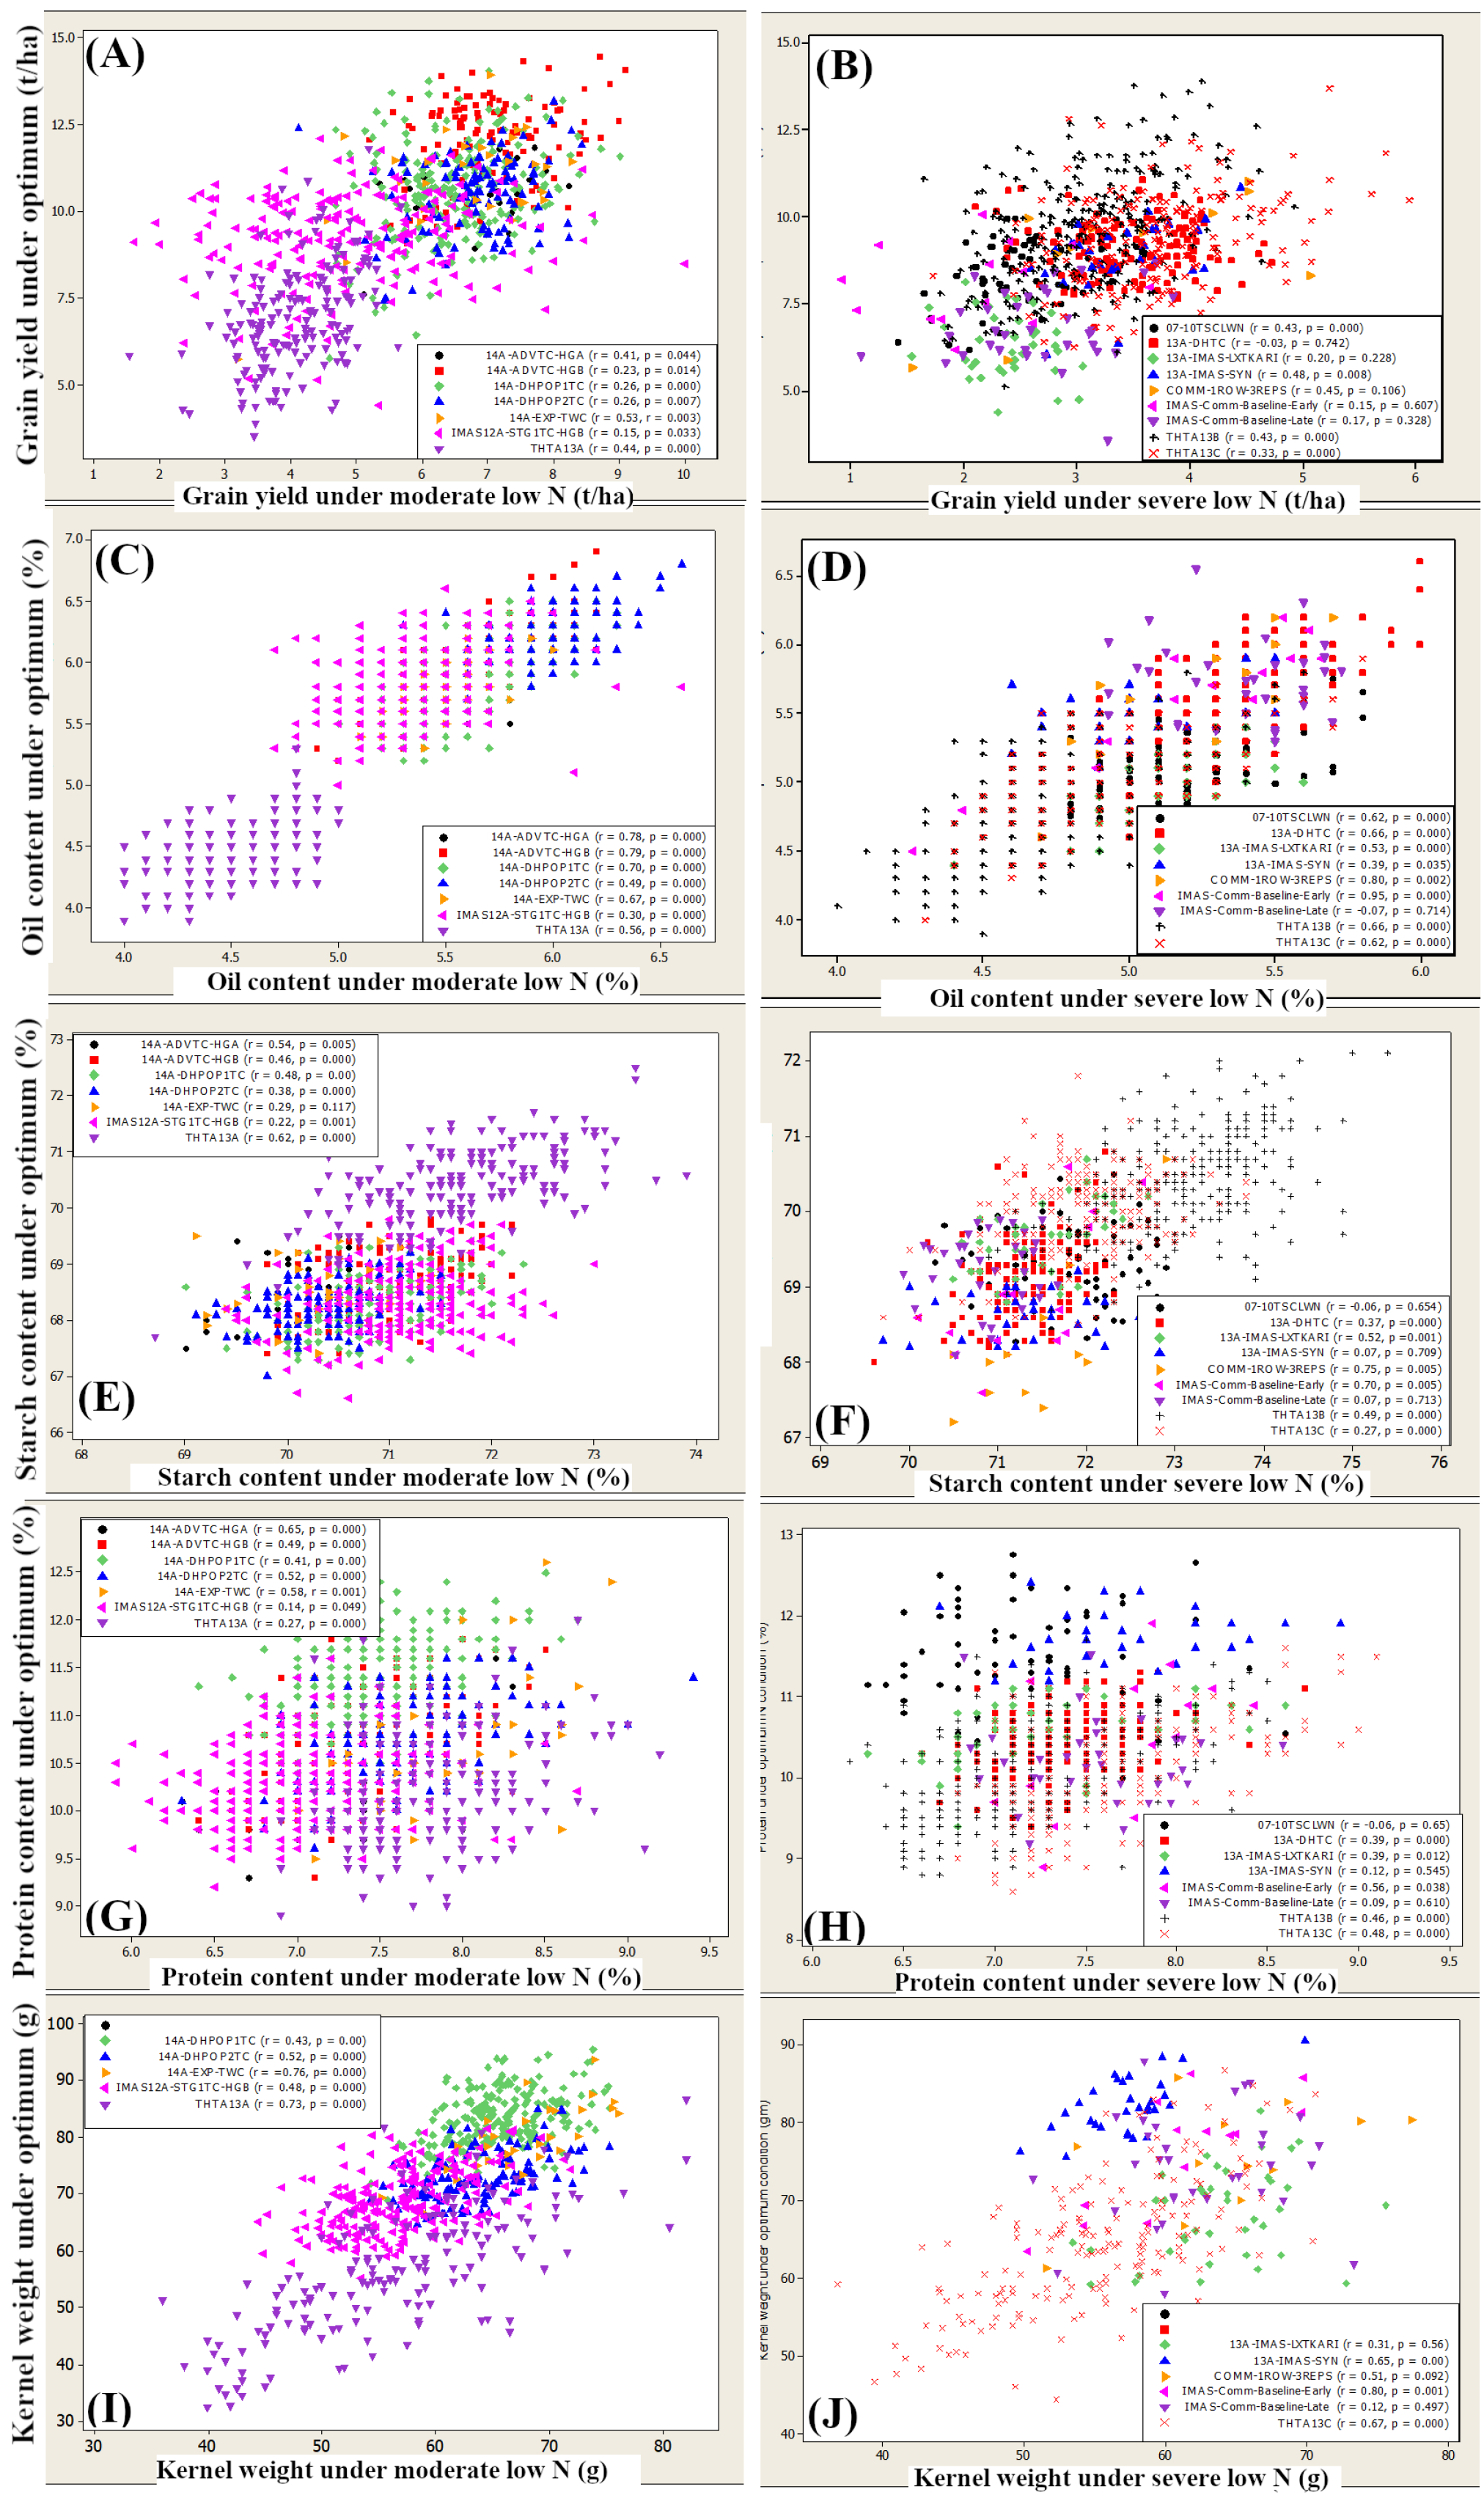
3.4. Relationship between Traits under Low N and Optimum

The estimate of a phenotypic correlation between optimum and low-N management for each trait is presented in Figure 3A–E. For each trait, graphs are plotted separately for trials evaluated under moderate and severe stresses. The grouping of stress into moderate and severe is merely based on the percentage of yield reduction under low N relative to the respective grain yield of the optimally managed trials. Accordingly, the grain yields under the two conditions were positively related between optimum and moderate stress, albeit at a low magnitude (average r = 0.33). However, as the severity of stress increased, the relation for grain yield between optimum and low N tended to be negligible (p > 0.05 in more than 50% of the trials, Figure 3A,B). In the same manner, the relationship between the percentages of protein content, as well as the percentages of starch content, under optimum and low-N stress conditions were weak in both moderate and severe N stresses. The average correlation for the percentages of protein was 0.44, ranging from 0.14 to 0.65, and 0.37, ranging from −0.06 to 0.75, under moderate and severe N stress conditions, respectively. The percentages of starch content tended to be strongly related in most trials under both moderate (average r = 0.43) and severe stress (0.37) conditions, more so than both protein content and grain yield (Figure 3D,E). The percentages of oil content and kernel weight, on the other hand, had a high positive association between optimum and low-N conditions, regardless of the N stress level (Figure 3C,D,I,J).

4. Discussion

4.1. Mean Grain Yield and Grain Composition

Highly significant mean squares for grain yield, grain composition and kernel weight under both high and low soil N conditions in all years were an indication of the presence of huge genotypic variability among the CIMMYT’s current maize germplasm. Some genotypes in all trials were both N-responsive (give a high yield under high N) and N-efficient (give a better yield under low N) as they resulted in a high yield under both optimum and low soil N, while others gave a higher yield only under either of the conditions [8]. Worku et al. [8] observed a consistent association between high grain yield under low N and NUE (post-anthesis N uptake).
The higher heritability of grain yield under optimum conditions implied greater genetic variance under optimum conditions compared to low N, suggesting the effectiveness of selection for grain yield under optimum condition [25]. Consistent with our result, Banziger et al. [26] reported 29% less heritability under low-N conditions than optimum, which agrees with our result (30% less under low N). In addition to grain yield, a large variation was observed for grain composition (oil content, starch content and protein content) and kernel weight under both soil N levels. The broad-sense heritability of oil content, protein content and starch content under optimum conditions were 6, 14 and 20% higher than low-N conditions, respectively. The genetic component of variance tended to be higher under optimum conditions than low N for both protein content and starch content (Table 2). The variance was comparable for oil content under both soil N levels, suggesting the effectiveness of selection for oil under both soil N levels [17,27,28]. This indicates that genetic diversity among genotypes was more or less intact under both soil conditions, particularly for oil content. It is encouraging because the genetic variance in maize germplasm under different soil-N conditions can be exploited through breeding. The percentage of protein content, starch content and oil content recorded for low-N trials was in agreement with results from a wide range of maize germplasm reported by Eckhoff and Paulsen [29], who found approximately 67.8–74% (mean 73%) starch content, 8–11.5% (mean 10%) protein content and 3.9–5.8% (mean 5%) oil content in maize kernels.
The decreased percentage of grain protein content and the corresponding increase in starch content under low N was previously reported by Duvick, [12] and Duvic and Cassman [30]. These changes were observed in new varieties, which they attributed to the increased stress tolerance of the new varieties, including for low N. A similar change was observed in our study in the percentage of protein content and starch content under low N relative to the high-N condition, but it was the same for all genotypes in all trials, regardless of their yield potential under either optimum or low soil N stress conditions. Highly responsive NUE genotypes had shown yield advantage over both commercial checks and poor NUE responsive genotypes in respective trials but, generally, we observed little change in quality traits between these group of genotypes. Genotypes that are adapted to stress are known to minimize protein accumulation in order to maximize grain production with the little nitrogen available in the soil [11,31]. This is because the amount of N fertilizer required to maximize grain yield is known to be lower than the amount needed to produce maximum grain protein content [31]. The remobilization and transport of N from vegetative parts and post-anthesis uptake from the soil constitute the primary sources of grain N [14,31], which are highly related with NUE in tropical germplasm [8].
The decrease in N fertilizer in the soil or inefficiency in N use results in decreased N sink capacity (zein), which causes less sucrose transport to kernels, resulting in less kernel weight and grain yield [32]. Therefore, genotypes that are low yielding under stress and poor in NUE usually attain the yield threshold on little N, and use the remaining N for protein synthesis, because of which such varieties usually have a higher proportion of protein than high-yielding and NUE genotypes [6]. The lack of a clear pattern between increased stress tolerance (NUE varieties) and change in kernel composition [12] could be due to the use of genotypes derived from inbred/source germplasm selected for NUE, i.e., favorable genes for NUE have been accumulated at some stage. Most of the commercial checks included in our trials were also derived from the CIMMYT germplasm screened for multiple stresses, including NUE, over the years. Further, the experimental materials in our trials were obtained from few years of breeding efforts contrary to the genotypes [12], which were from breeding efforts in different eras. To understand the association between change in starch content and protein content with low-N stress tolerance [12,30], we recommend further research with varieties contrasting for NUE. The establishment of a clear relationship between stress tolerance (high yield under low-N stress) and change in grain composition (starch content and protein content) would enable breeders to use starch content and protein content percentages as additional secondary traits for selecting low-N-tolerant genotypes. In the meantime, monitoring the amount of grain protein and starch content in trials conducted under low-N conditions is needed because there are genotypic differences for starch content and protein content. Further reduction in protein content beyond a certain threshold level is not tolerable [12], as seed protein is crucial for seed germination and seedling growth [33].
Oil is an important element for seed germination [12]. The percentage of reduction for oil content in our study was smaller (2 to 9%) than reported by Liu et al. [13], which was a 16% reduction in low-N conditions relative to optimum management. The difference in germplasm (an F2:3 mapping population in their case) and the method of pollination (self-pollinated kernels were used in their case) might have also contributed to the difference. On the other hand, Duvick [12] observed no change in oil percentage between optimum and low-N management conditions, which could be because the low N rate used (92 kg N/ha) was much higher than that in our managed low-N fields. Generally, it seems that the effect of N fertilization has little effect on changing the size of the embryos where oil is stored [18,34].

4.2. Relationship between Grain Yield and Grain Quality Traits

In the current large set of tropical germplasm, we observed a negative association between starch content and protein content under both optimum and low-N soil fertility levels (Figure 2), but not between grain yield and protein content. Within vitro-grown kernels, Singletary and Below (1989) demonstrated that the addition of N fertilizer beyond an optimum level of starch content in kernels leads to a reduction in starch content and the subsequent increase in protein content. The analysis of change in yield potential over a period of time revealed changes in the composition of grain regardless of the species, while an increase in yield leads to a decrease in the protein/starch content and oil content ratio [35]. In maize, for example, the increase in the yield potential after 1967 was accompanied by a decrease in the concentration of protein content and an increase in that of starch content [12,30]. The negative relationship between grain protein content and grain yield could partly be associated with the higher glucose use for the synthesis of protein over that of carbohydrate [31].
Despite an increase in the percentage of starch content under low N, the relationship between grain yield and starch content was either neutral (most of the trials) or weak. The starch in cereal endosperm is synthesized to enhance plant survival for the next generation [36,37], and any stress signal could lead plants to store the available starch in the reproductive organs to ensure the succession of the next generation. Generally, we did not observe a strong relationship between grain yield and any of the quality traits under both soil management conditions. This indicates the feasibility for the simultaneous improvement of grain yield and quality traits under both management conditions [13,16]. Therefore, with the regular monitoring of protein content at harvest, it is feasible to develop NUE maize varieties with acceptable quality.

4.3. Relation between Optimum and Low-Nitrogen Conditions

The association between quantitative characters measured in different environments is a function of the degree to which the same genes influence genetic variation in both environments [10]. The low correlation coefficient between grain yield under optimum and moderate low-N stress observed in our study indicates that only a few genes might be held in common for controlling grain yield under optimum and low soil N conditions. It was also evident from the high genotype-by-management interaction and the inconsistent rank of genotypes for grain yield under two environments (data not shown). Similar to our study, Worku et al. [10] also reported a low correlation for grain yield between optimum and low soil N conditions. As the average yield reduction under low N was increased from 40 to 60% relative to optimum grain yield, the correlation between grain yields under optimum and severely low N had deteriorated quickly, making it difficult to predict the grain yield under one soil N condition based on the performance of genotypes from contrasting environments [8,9,10]. The lack of a strong association between grain yield from high- and low-N environments under this and similar studies confirm the need to evaluate genotypes under optimum and low-N conditions to develop varieties that can perform in a wide range of soil N levels.
Like grain yield, the prediction for protein content and starch content in one management condition based on results from another environment contrasting in N levels seems unfeasible, particularly as the stress level increases. This again could be due to the expression of different genes/QTLs under different management conditions. A strong association was observed for oil content between optimum and low-N management, indicating the presence of genes that are expressed under both management conditions. The performance of the genotypes for oil under one management condition can be fairly predicted based on the performance of other management conditions. Contrary to this result, Liu et al. [13] detected two different QTLs for oil content specifically expressed under different N conditions. The use of a mapping population derived from parents not contrasting for oil content might have affected the result.

5. Conclusions

Breeding for tolerance to Low-N stress is very important to address the challenges faced by small-scale farmers in developing countries and to overcome environmental challenges due to nitrate leaching. NUE genotypes offer an environmentally friendly solution for low-N stress by giving a reasonable yield under a low range of N levels. However, grain quality traits should not be compromised while improving yield under low-N conditions. The increased percentage of starch content and the corresponding decrease in protein content under low soil N conditions could be an indication for increased stress tolerance, but there was no difference for grain composition between genotypes contrasting for NUE under both optimum and low-N conditions. Therefore, genetic variance for grain quality traits was not affected through breeding for NUE, as the values were within the range reported for diverse maize germplasm. However, it is crucial to monitor the protein content of germplasm under both optimum and managed low soil N conditions, as the correlations for protein content and starch content were minimal as the severity of low-N stress increased. Finally, we recommend the testing of a small set of germplasm contrasting for NUE to understand the relationship between low-N stress tolerance and changes in grain composition, particularly for protein content and starch content.

Supplementary Materials

The following supporting information can be downloaded at: https://www.mdpi.com/article/10.3390/agronomy12020438/s1, Table S1. Planting and harvesting dates of each trial planted under low-N and optimum conditions in Kiboko, Kenya from 2011 to 2014.

Author Contributions

Conceptualization, funding acquisition, project and resources administration, B.D., B.T.E. and A.T.T.; methodology, investigations, formal analysis and visualization, B.D., M.G., B.T.E., T.K., M.T.L., M.R.W., M.S.O. and V.C.; supervision, B.D., A.T.T. and M.G.; original draft preparation, B.T.E.; writing—review and editing, all authors. All authors have read and agreed to the published version of the manuscript.

Funding

The research was supported by the Bill and Melinda Gates Foundation (B&MGF), and the United States Agency for International Development (USAID) through the Improved Maize for African Soils (IMAS) project, the AG2MW (Accelerating Genetic Gains in Maize and Wheat for Improved Livelihoods, B&MGF Investment ID INV-003439) project, and the CGIAR Research Program on Maize (MAIZE). MAIZE receives W1&W2 support from the Governments of Australia, Belgium, Canada, China, France, India, Japan, Korea, Mexico, Netherlands, New Zealand, Norway, Sweden, Switzerland, UK, USA and the World Bank.

Data Availability Statement

All datasets generated for this study are summarized and included in the article/Supplementary Materials.

Acknowledgments

The authors are grateful to the International Maize and Wheat Improvement Center (CIMMYT) and the partner scientists and technicians who generated the germplasm, and designed and conducted the experiments which we used to explore our objectives. All the experiments in this article were conducted by the CIMMYT under the Improved Maize for African Soils project with a financial support from the Bill and Melinda Gates foundation and USAID.

Conflicts of Interest

The authors declare no conflict of interest.

References

  1. Prasanna, B.M.; Cairns, J.E.; Zaidi, P.H.; Beyene, Y.; Makumbi, D.; Gowda, M.; Magorokosho, C.; Zaman-Allah, M.; Olsen, M.; Das, A.; et al. Beat the stress: Breeding for climate resilience in maize for the tropical rainfed environments. Theor. Appl. Genet. 2021, 134, 1729–1752. [Google Scholar] [CrossRef]
  2. Food and Agriculture Organization of the United Nations (FAOSTAT), Rome. 2020. Available online: http://www.fao.org/faostat/en/#data/QL (accessed on 31 August 2021).
  3. Cairns, J.E.; Prasanna, B.M. Developing and deploying climate-resilient maize varieties in the developing world. Curr. Opin. Plant Biol. 2018, 45, 226–230. [Google Scholar] [CrossRef] [PubMed]
  4. Das, B.; Atlin, G.N.; Olsen, M.; Burgueño, J.; Tarekegne, A.; Babu, R.; Ndou, E.N.; Mashingaidze, K.; Moremoholo, L.; Ligeyo, D. Identification of donors for low-nitrogen stress with maize lethal necrosis (MLN) tolerance for maize breeding in sub-Saharan Africa. Euphytica 2019, 215, 80. [Google Scholar] [CrossRef] [PubMed] [Green Version]
  5. Morris, M.L.; Kelly, V.A.; Kopicki, R.J.; Byerlee, D. Fertilizer Use in African agriculture: Lessons Learned and Good Practice Guidelines; The World Bank: Washington, DC, USA, 2007. [Google Scholar]
  6. Tsai, C.Y.; Dweikat, I.; Huber, D.M.; Warren, H.L. Interrelationship of nitrogen nutrition with maize (Zea mays) grain yield, nitrogen use efficiency and grain quality. J. Sci. Food Agric. 1992, 58, 1–8. [Google Scholar] [CrossRef]
  7. Presterl, T.; Seitz, G.; Schmidt, W.; Geiger, H.H. Improving nitrogen-use efficiency in European maize—Comparison between line per se and testcross performance under high and low soil nitrogen. Maydica 2002, 47, 83–91. [Google Scholar]
  8. Worku, M.; Bänziger, M.; Erley, G.S.A.; Friesen, D.; Diallo, A.O.; Horst, W.J. Nitrogen uptake and utilization in contrasting nitrogen efficient tropical maize hybrids. Crop Sci. 2007, 47, 519. [Google Scholar] [CrossRef] [Green Version]
  9. Worku, M.; Banziger, M.; Friesen, D.; Erley, G.S.A.; Diallo, A.O.; Vivek, B.; Horst, W.J. Protein quantity and quality, and grain yield performance of quality protein maize and normal endosperm maize under different levels of nitrogen. In Crop Research, Technology Dissemination and Adoption to Increase Food Supply, Reducing Hunger and Poverty in Africa; African Crop Science Society: El-Minia, Egypt, 2007; pp. 1905–1909. [Google Scholar]
  10. Worku, M.; Banziger, M.; Friesen, D.; Schulte, G.; Horst, W.J.; Vivek, B.S. Relative importance of general combining ability and specific combining ability among tropical maize (Zea mays L.) inbreds under contrasting nitrogen environments. Maydica 2008, 53, 279–288. [Google Scholar]
  11. Worku, M.; Banziger, M.; Schulte auf’m Erley, G.; Friesen, D.; Diallo, A.O.; Horst, W.J. Nitrogen efficiency as related to dry matter partitioning and root system size in tropical mid-altitude maize hybrids under different levels of nitrogen stress. Field Crops Res. 2012, 130, 57–67. [Google Scholar] [CrossRef]
  12. Duvick, D.N. What Is Yield? In Developing Drought-and Low N-Tolerant Maize; Edmeades, G.O., Banziger, M., Mickelson, H.R., Pena-Valdivia, C.B., Eds.; CIMMYT: Mexico City, Mexico, 1996; pp. 332–335. [Google Scholar]
  13. Liu, Z.H.; Xie, H.L.; Tian, G.W.; Chen, S.J.; Wang, C.L.; Hu, Y.M.; Tang, J.H. QTL mapping of nutrient components in maize kernels under low nitrogen conditions. Plant Breed. 2008, 127, 279–285. [Google Scholar] [CrossRef]
  14. Borrás, L.; Zinselmeier, C.; Senior, M.L.; Westgate, M.E.; Muszynski, M.G. Characterization of grain-filling patterns in diverse maize germplasm. Crop Sci. 2009, 49, 999. [Google Scholar] [CrossRef]
  15. Borrás, L.; Otegui, M.E. Seed dry weight response to source-sink manipulations in wheat, maize and soybean: A quantitative reappraisal. Crop Sci. 2001, 41, 1816–1822. [Google Scholar] [CrossRef]
  16. Duarte, A.P.; Mason, S.C.; Jackson, D.S.; De Kiehl, J.C. Grain quality of Brazilian maize genotypes as influenced by nitrogen level. Crop Sci. 2005, 45, 1958–1964. [Google Scholar] [CrossRef] [Green Version]
  17. Ertiro, B.T.; Olsen, M.; Das, B.; Gowda, M.; Labuschagne, M. Efficiency of indirect selection for grain yield in maize (Zea mays L.) under low nitrogen conditions through secondary traits under low nitrogen and grain yield under optimum conditions. Euphytica 2020, 216, 134. [Google Scholar] [CrossRef]
  18. Borrás, L.; Curá, J.A.; Otegui, M.E. Maize kernel composition and post-flowering source-sink ratio. Crop Sci. 2002, 42, 781–790. [Google Scholar]
  19. Mayer, L.I.; Cirilo, A.G.; Maddonni, G.A. Kernel hardness-related traits in response to heat stress during the grain-filling period of maize crops. Crop Sci. 2019, 59, 318–332. [Google Scholar] [CrossRef]
  20. CIMMYT. Kiboko Crops Research Station: A Brief and Visitors’ Guide. (Field Visitors Manual); CIMMYT: Nairobi, Kenya, 2013; Available online: https://repository.cimmyt.org/handle/10883/3396?locale-attribute=en (accessed on 17 November 2021).
  21. Patterson, H.D.; Williams, E.R. A new class of resolvable incomplete block designs. Biometrika 1976, 63, 83–89. [Google Scholar] [CrossRef]
  22. SAS Institute Inc. JMP® 13 Documentation Library; SAS Institute Inc.: Cary, NC, USA, 2017. [Google Scholar]
  23. Minitab (Version 16). 2013. Available online: http://www.minitab.com/en-US/products/minitab/default.aspx (accessed on 15 November 2021).
  24. R Development Core Team. R: A Language and Environment for Statistical Computing; R Foundation for Statistical Computing: Vienna, Austria, 2020. [Google Scholar]
  25. Miti, F.; Tongoona, P.; Derera, J. S1 selection of local maize landraces for low soil nitrogen tolerance in Zambia. Afr. J. Plant Sci. 2010, 4, 67–81. [Google Scholar]
  26. Bänziger, M.; Betran, F.J.; Lafitte, H.R. Efficiency of high-N selection environments for improving maize for low-N target environments. Crop Sci. 1997, 37, 1103–1109. [Google Scholar] [CrossRef]
  27. Ertiro, B.T.; Labuschagne, M.; Olsen, M.; Das, B.; Prasanna, B.M.; Gowda, M. Genetic dissection of nitrogen use efficiency in tropical maize through genome-wide association and genomic prediction. Front. Plant Sci. 2020, 11, 474. [Google Scholar] [CrossRef]
  28. Ertiro, B.T.; Olsen, M.; Das, B.; Gowda, M.; Labuschagne, M. Genetic dissection of grain yield and agronomic traits in maize under optimum and low-nitrogen stressed Environments. Int. J. Mol. Sci. 2020, 21, 543. [Google Scholar] [CrossRef] [Green Version]
  29. Eckhoff, S.A.; Paulsen, M.R. Maize. In Cereal Grain Quality; Henry, R.J., Kettlewell, P.S., Eds.; Chapman & Hall: London, UK, 1996; pp. 77–112. [Google Scholar]
  30. Duvic, D.N.; Cassman, K.G. Post—Green revolution trends in yield potential of temperate maize in the North-Central United States. Crop Sci. 1999, 39, 1622–1630. [Google Scholar] [CrossRef]
  31. Wang, Z.; Li, S.; Malhi, S. Effects of fertilization and other agronomic measures on nutritional quality of crops: A review. J. Sci. Food Agric. 2008, 88, 7–23. [Google Scholar] [CrossRef]
  32. Tsai, C.Y.; Huber, D.M.; Warren, H.L. A proposed role of zein and glutelin as N sinks in maize. Plant Physiol. 1980, 66, 330–333. [Google Scholar] [CrossRef] [Green Version]
  33. Shewry, P.R.; Napier, J.A.; Tatham, A.S. Seed storage proteins: Structures and biosynthesis. Plant Cell 1995, 7, 945–956. [Google Scholar]
  34. Uribelarrea, M.; Below, F.E.; Moose, S.P. Grain composition and productivity of maize hybrids derived from the Illinois protein strains in response to variable nitrogen supply. Crop Sci. 2004, 44, 1593. [Google Scholar] [CrossRef]
  35. Triboi, E.; Triboi-Blondel, A.-M. Productivity and grain or seed composition: A new approach to an old problem. Eur. J. Agron. 2002, 16, 163–186. [Google Scholar] [CrossRef]
  36. Smith, A.M.; Martin, C. Starch biosynthesis and the potential for its manipulation. In Biosynthesis and Manipulation of Plant Products; Grierson, D., Ed.; Blackie Academic and Professional Publishers: Glasgow, UK, 1993; pp. 1–54. [Google Scholar]
  37. Wang, T.L.; Bogracheva, T.Y.; Hedley, C.L. Starch: As simple as A, B, C? J. Exp. Bot. 1998, 49, 481–502. [Google Scholar] [CrossRef] [Green Version]
Figure 1. Percentage increase or decrease in grain yield, oil content, protein content and starch content under low-N management compared to their performance under optimum soil nitrogen condition.
Agronomy 12 00438 g001
Figure 2. Scatter plots with regression lines showing the relationship between different quality traits in nine different trials conducted under optimum and severe N stress: (A) protein and starch content under low N, (B) protein and starch content under optimum conditions, (C) oil and starch content under low N and (D) oil and starch content under optimum conditions. OIL—oil content; PRO—protein content; STA—starch content; LN—low N; OPT—optimum.
Agronomy 12 00438 g002
Figure 3. Relationship between optimum and stress environments (moderate and severe low-N stress) for grain yield (A,B), percentage of oil content (C,D), percentage of starch content (E,F), percentage of protein content (G,H) and kernel weight (I,J).
Agronomy 12 00438 g003
Table 1. Trial name, number of replications, design, number of genotypes tested and the average of weather parameters between planting and harvesting for each trial.
Trial
Code
Trial NameExperimental
Design
RepYearNo. of
Genotypes
Type of
Germplasm
MIN T (°C)MAX T (°C)RH (%)RF (mm)
OPLNOPLNOPLNOPLN
107-10TSCLWNAlpha lattice22011126Experimental hybrids30.930.916.416.479.879.80.10.1
213A-DHTCAlpha lattice22013120DH testcrosses29.029.415.116.487.590.05.0311.7
313A-IMAS-LXTKARIAlpha lattice2201340Experimental hybrids28.630.615.317.088.686.739.8188.5
413A-IMAS-SYNAlpha lattice2201330Synthetics31.130.618.117.087.886.7241.5188.5
5COMM-1ROW-3REPSRCBD3201212Commercial varieties29.631.615.117.888.585.276.5331.2
6IMAS-Baseline-EarlyRCBD3201114Commercial varieties30.530.916.016.477.879.87.07.0
7IMAS-Baseline-LateAlpha lattice3201135Commercial varieties30.531.616.017.877.885.27.0331.2
8THTA13BAlpha lattice22013250Experimental hybrids29.029.516.016.689.189.9252.9323.0
9THTA13CAlpha lattice22013180Experimental hybrids29.029.516.016.689.189.9252.9323.0
10IMAS12A-STG1TC-HGBAlpha lattice22012210Experimental hybrids29.629.615.115.188.588.576.576.5
11THTA13AAlpha lattice22013168Experimental hybrids29.229.516.216.690.289.9252.9323.0
1214A-DHPOP1TCAlpha lattice22014215DH testcrosses29.329.315.415.484.184.118.318.3
1314A-DHPOP2TCAlpha lattice22014110DH testcrosses29.329.315.415.484.184.118.318.3
1414A-EXP-TWCAlpha lattice2201430Experimental hybrids29.329.315.415.484.184.118.318.3
1514A-ADVTC-HGARCBD2201425Experimental hybrids29.329.315.415.484.184.118.318.3
1614A-ADVTC-HGBAlpha lattice22014114Experimental hybrids29.329.315.415.484.184.118.318.3
Rep—Replication; OP—optimum; LN—low N; MIN T—minimum temperature; MAX T—maximum temperature; RH—relative humidity; RF—rainfall.
Table 2. Trial mean performance of genotypes for grain yield (GY), oil content, protein content and starch content, and their heritability estimates for 16 different trials evaluated under optimum and low-nitrogen conditions in Kiboko during 2011 to 2014.
Trial CodeGrain Yield (t/ha)% Yield ReductionOil Content (%)Protein Content (%)Starch Content (%)
OPTh2LNh2 OPTh2LNh2OPTh2LNh2OPTh2LNh2
18.35 **0.522.56 **0.71695.12 **0.855.21 **0.7911.53 **0.537.15 **0.7069.35 **0.6771.80 **0.60
29.09 **0.473.48 **0.33625.66 **0.925.37 **0.8410.47 **0.567.38 **0.6869.12 **0.8371.29 **0.56
36.30 **0.632.40 **0.65624.97 **0.885.15 **0.7610.55 **0.687.29 **0.8569.64 **0.6671.52 **0.57
48.90 **0.803.38 *0.47625.49 **0.705.00 **0.6511.74 **0.777.69 **0.7768.63 *0.5271.30 *0.55
58.69 **0.913.42 *0.58615.62 **0.945.20 **0.8610.71 **0.917.54 NS0.3768.22 **0.8571.41 *0.50
68.08 **0.792.11 **0.88745.62 **0.975.22 **0.9510.48 **0.957.71 *0.6368.91 **0.9271.35 **0.78
76.87 **0.792.70 **0.55615.76 **0.685.41 **0.8810.22 *0.447.61 **0.7169.29 *0.5670.94 **0.69
89.65 **0.823.09 **0.53684.85 **0.904.74 **0.8310.06 **0.867.21 **0.8070.43 **0.7473.13 **0.71
99.36 **0.803.74 **0.48605.09 **0.854.98 **0.8510.14 **0.887.62 **0.6970.02 **0.6772.00 **0.65
109.25 **0.664.93 **0.37475.84 **0.735.30 **0.5310.29 **0.717.05 **0.5968.36 **0.6371.11 **0.40
116.92 **0.864.08 **0.62414.53 **0.794.57 **0.8210.21 **0.787.81 **0.7870.44 **0.7771.69 **0.77
1210.60 **0.556.49 **0.35395.89 **0.885.66 **0.7611.46 **0.747.49 **0.5168.27 **0.6370.85 **0.44
1310.48 **0.636.82 *0.33356.24 **0.796.02 **0.6110.77 **0.727.69 **0.5968.28 **0.5270.34 NS0.30
1410.92 **0.786.63 **0.82395.79 **0.735.49 **0.8010.73 **0.957.92 NS0.3768.59 **0.7570.21 *0.57
1510.42 **0.886.79 NS0.44355.65 **0.785.63 **0.7310.39 **0.867.32 **0.6968.51 NS0.4769.98 *0.54
1612.10 **0.697.07 *0.51425.95 **0.845.58 **0.8210.70 **0.847.41 **0.7168.62 **0.7170.93 **0.58
Mean9.100.684.290.54545.510.785.280.7810.710.727.490.6669.030.6471.240.59
Min6.300.002.110.33354.530.004.570.5310.060.017.050.3768.220.0469.980.30
Max12.100.917.070.88746.240.976.020.9511.740.957.920.8570.440.9273.130.78
*, ** Significant difference at p = 0.05, 0.01 level, respectively, when compared the trait’s performance under optimum versus low-N stress conditions; NS—not significant; h2—heritability, OPT—optimum; LN—low N.
Table 3. Pearson correlation between grain yield and grain quality parameters (oil, starch, protein) and Kernel weight under optimum and low N in 16 trials evaluated in Kiboko, Kenya from 2011 to 2014.
NoTrial NameOptimum NLow N
OILPROSTAKNWTOILPROSTAKNWT
107-10TSCLWN−0.120.040.13NA−0.34 **−0.13−0.08NA
213A-DHTC0.14−0.10−0.14NA0.090.02−0.19 *NA
313A-IMAS-LXTKARI0.24−0.32−0.230.42 **0.29 *−0.32 *0.050.22
413A-IMAS-SYN−0.29−0.030.170.35−0.14−0.050.020.29
5COMM-1ROW-3REPS0.05−0.470.220.380.15NA−0.180.71 **
6IMAS-Comm-Baseline-Early0.01−0.370.190.61 *0.280.03−0.23−0.14
7IMAS-Comm-Baseline-Late−0.16−0.34 *0.210.41 **0.09−0.39 *0.280.03
8THTA13B0.45 **−0.30 **−0.26 **NA0.03−0.15 *−0.34 **0.29 **
9THTA13C0.20 **−0.31 **−0.060.60 **0.15 *−0.02−0.35 **0.32 **
1014A-DHPOP1TC0.15 *−0.29 **0.030.30 **0.060.18 **−0.120.25 **
1114A-DHPOP2TC0.12−0.15−0.030.25 **−0.000.24 **−0.26 **0.45 **
1214A-EXP-TWC0.290.12−0.40 *0.62 **0.10−0.280.290.40 *
13IMAS12A-STG1TC-HGB−0.10−0.34 **0.130.43 **0.080.03−0.19 **0.37 **
14THTA13A0.03−0.57 **−0.37 **0.67 **−0.15−0.12−0.38 **0.46 **
1514A-ADVTC-HGA0.02−0.05−0.04NA0.12−0.200.20NA
1614A-ADVTC-HGB0.09−0.20 *0.12NA−0.26 **−0.020.11NA
Mean0.07−0.23−0.020.460.03−0.08−0.090.30
NA = data not available; OIL—oil content; PRO—protein content; STA—starch content; KNWT—kernel weight; *, ** significant at p = 0.05 and 0.01 level, respectively (the minimum value for considering significance varies for each trial, since each trial had a different number of genotypes evaluated).
Publisher’s Note: MDPI stays neutral with regard to jurisdictional claims in published maps and institutional affiliations.

