
Evaluation of Agrobiodiversity and Cover Crop Adoption in Southern Ontario Field Crops


Abstract
:1. Introduction
2. Methods
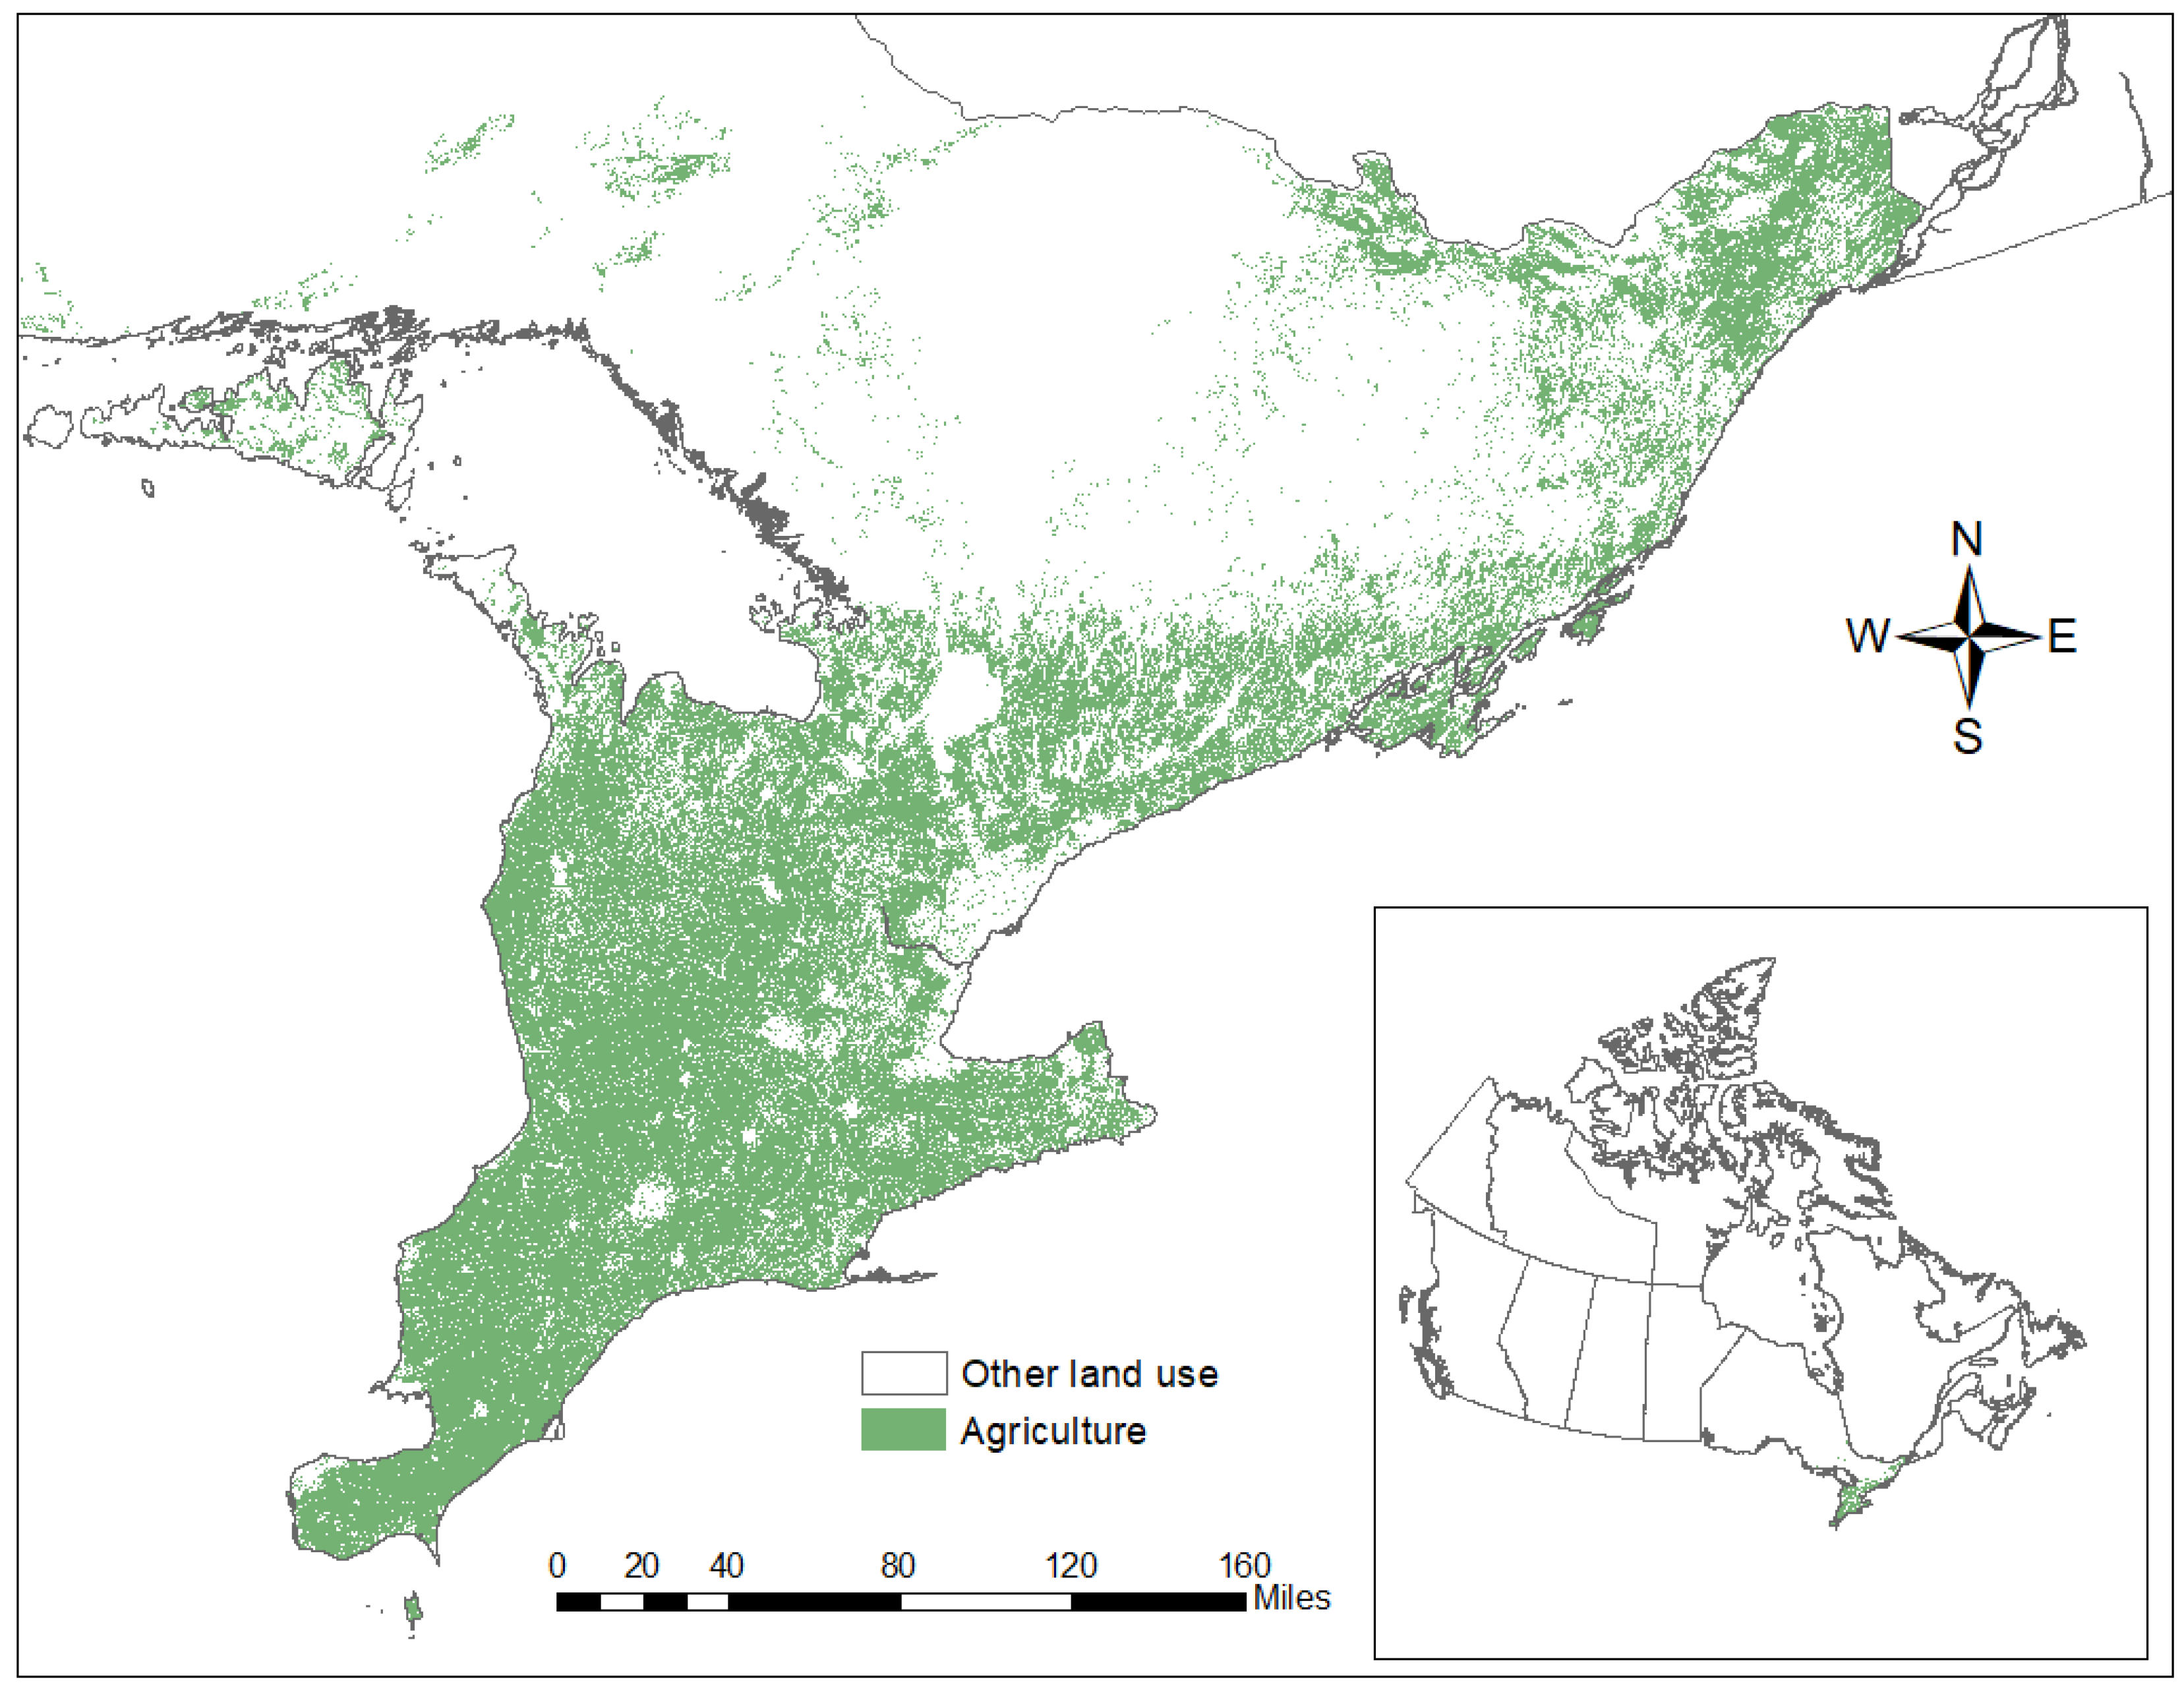
2.1. Study Area
2.2. Identifying Trends in Field Crop Production and Diversification across Southern Ontario
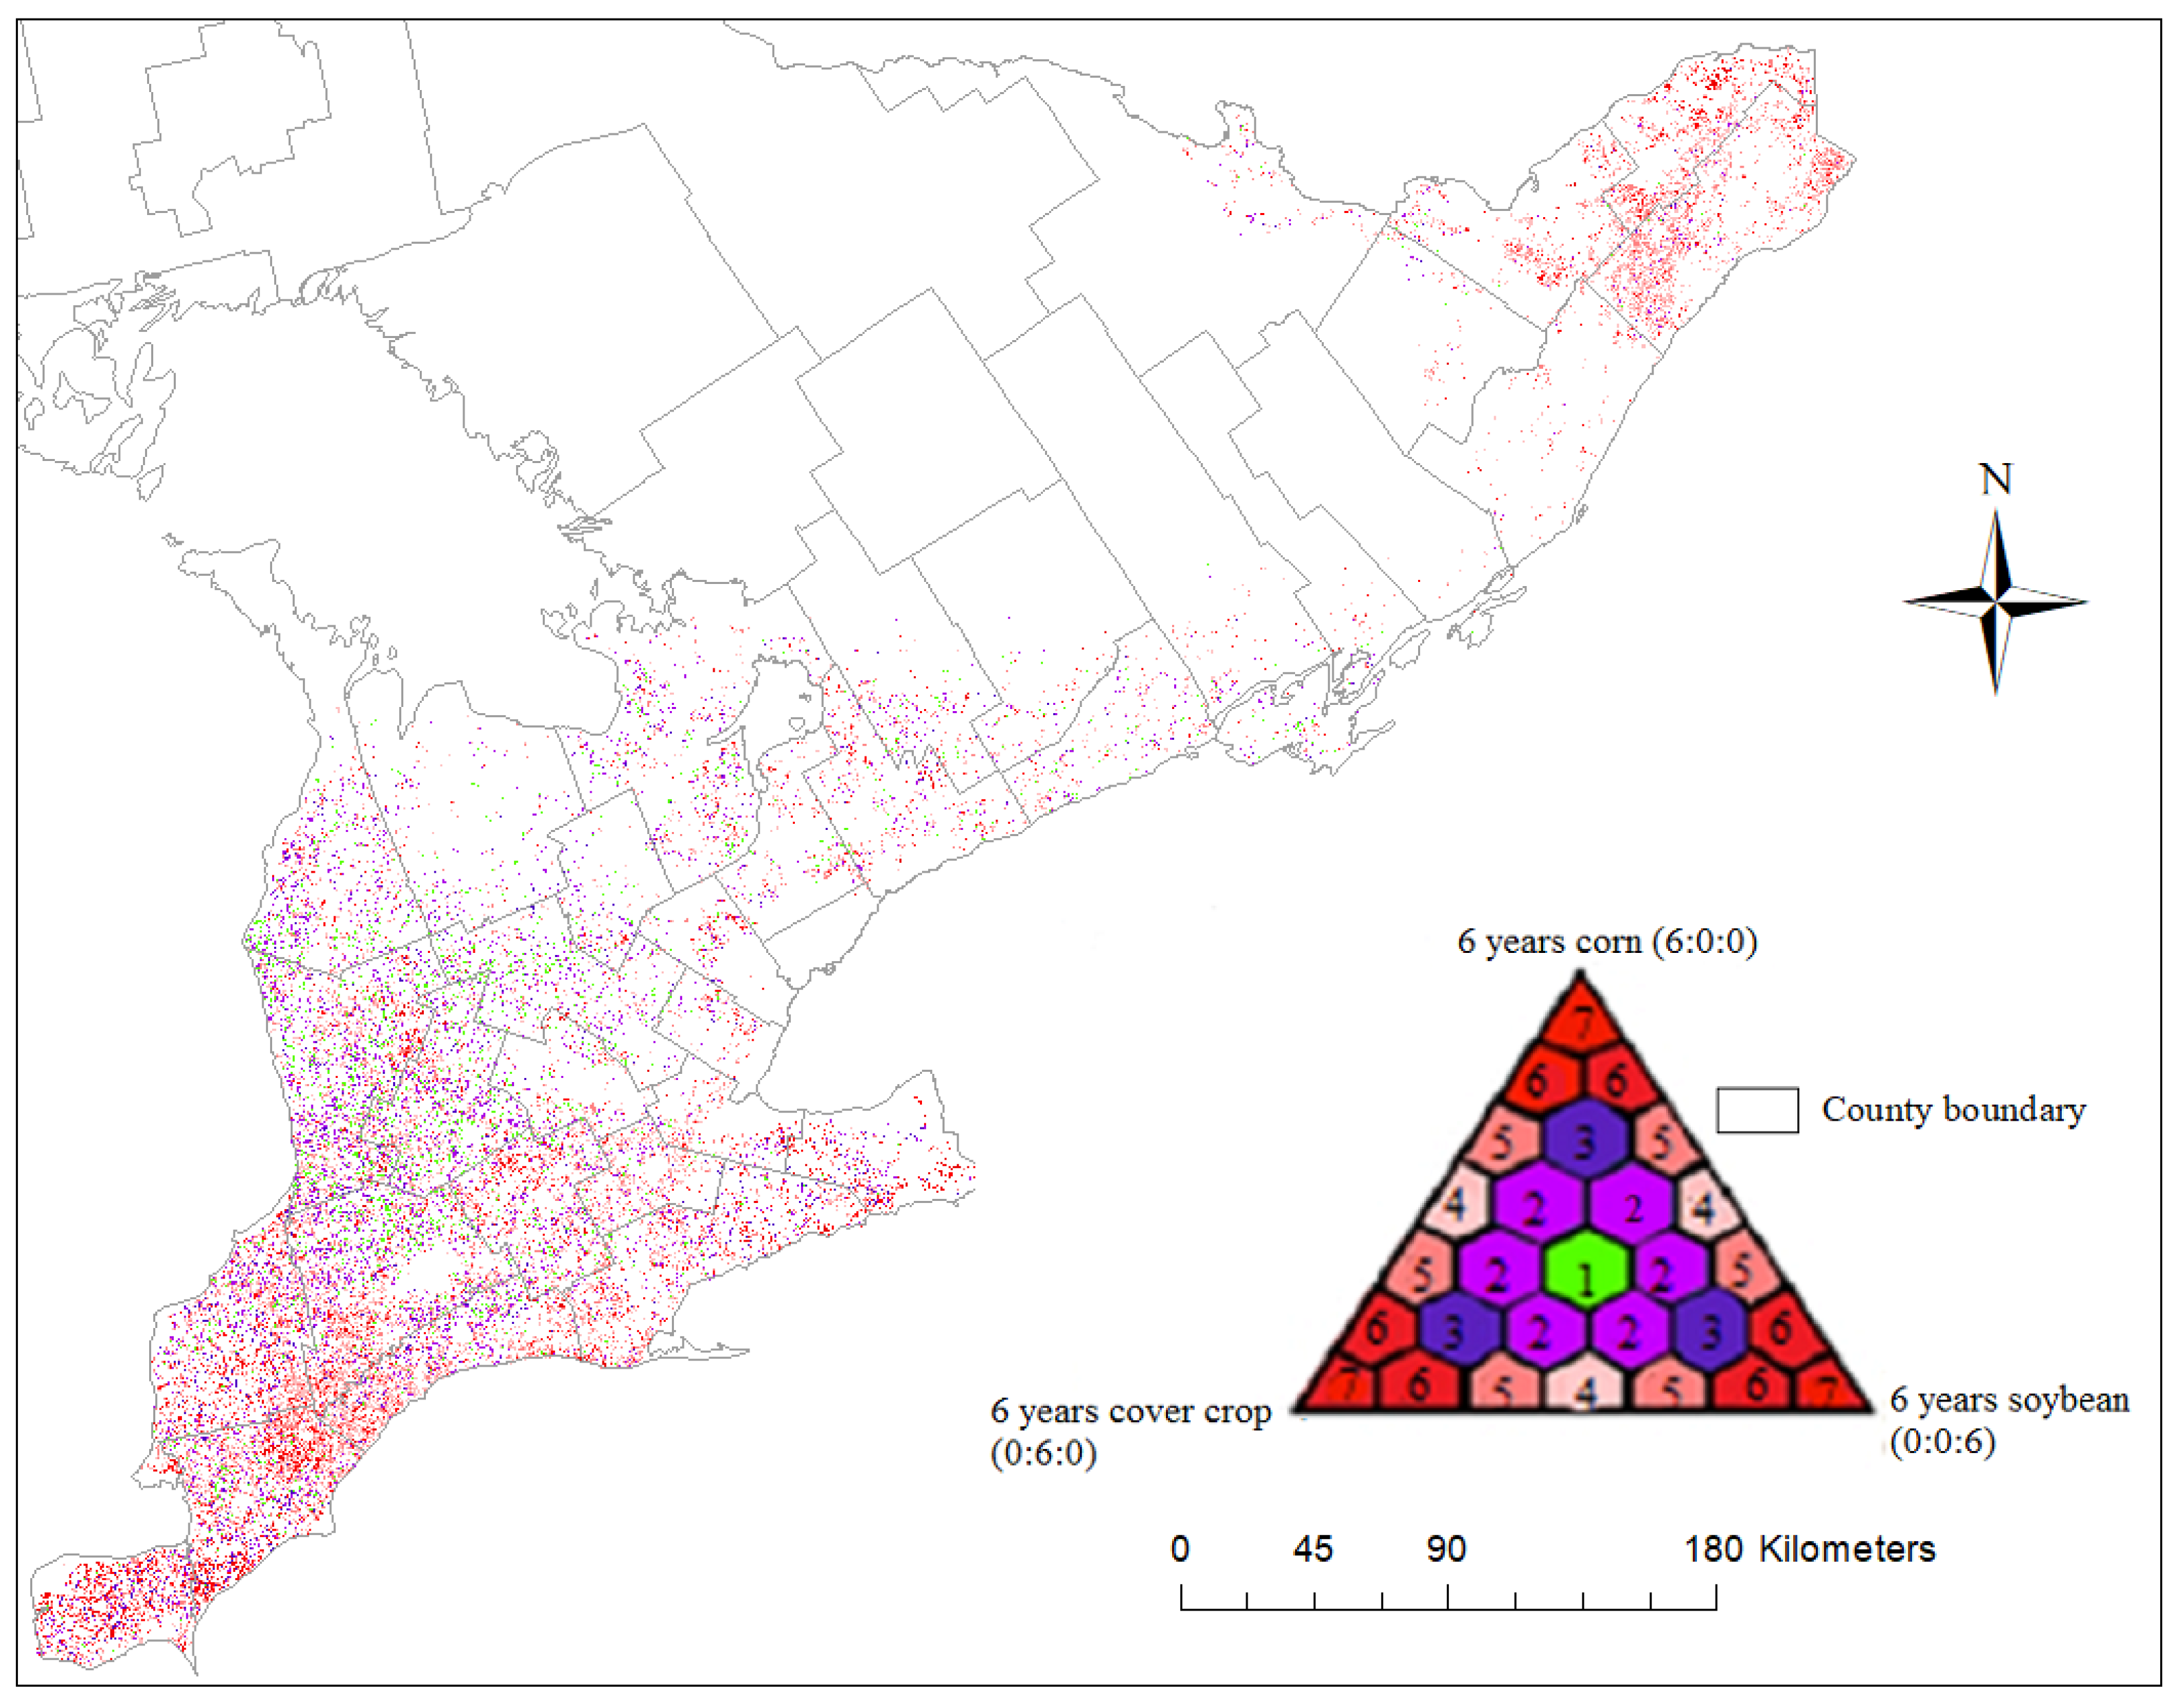
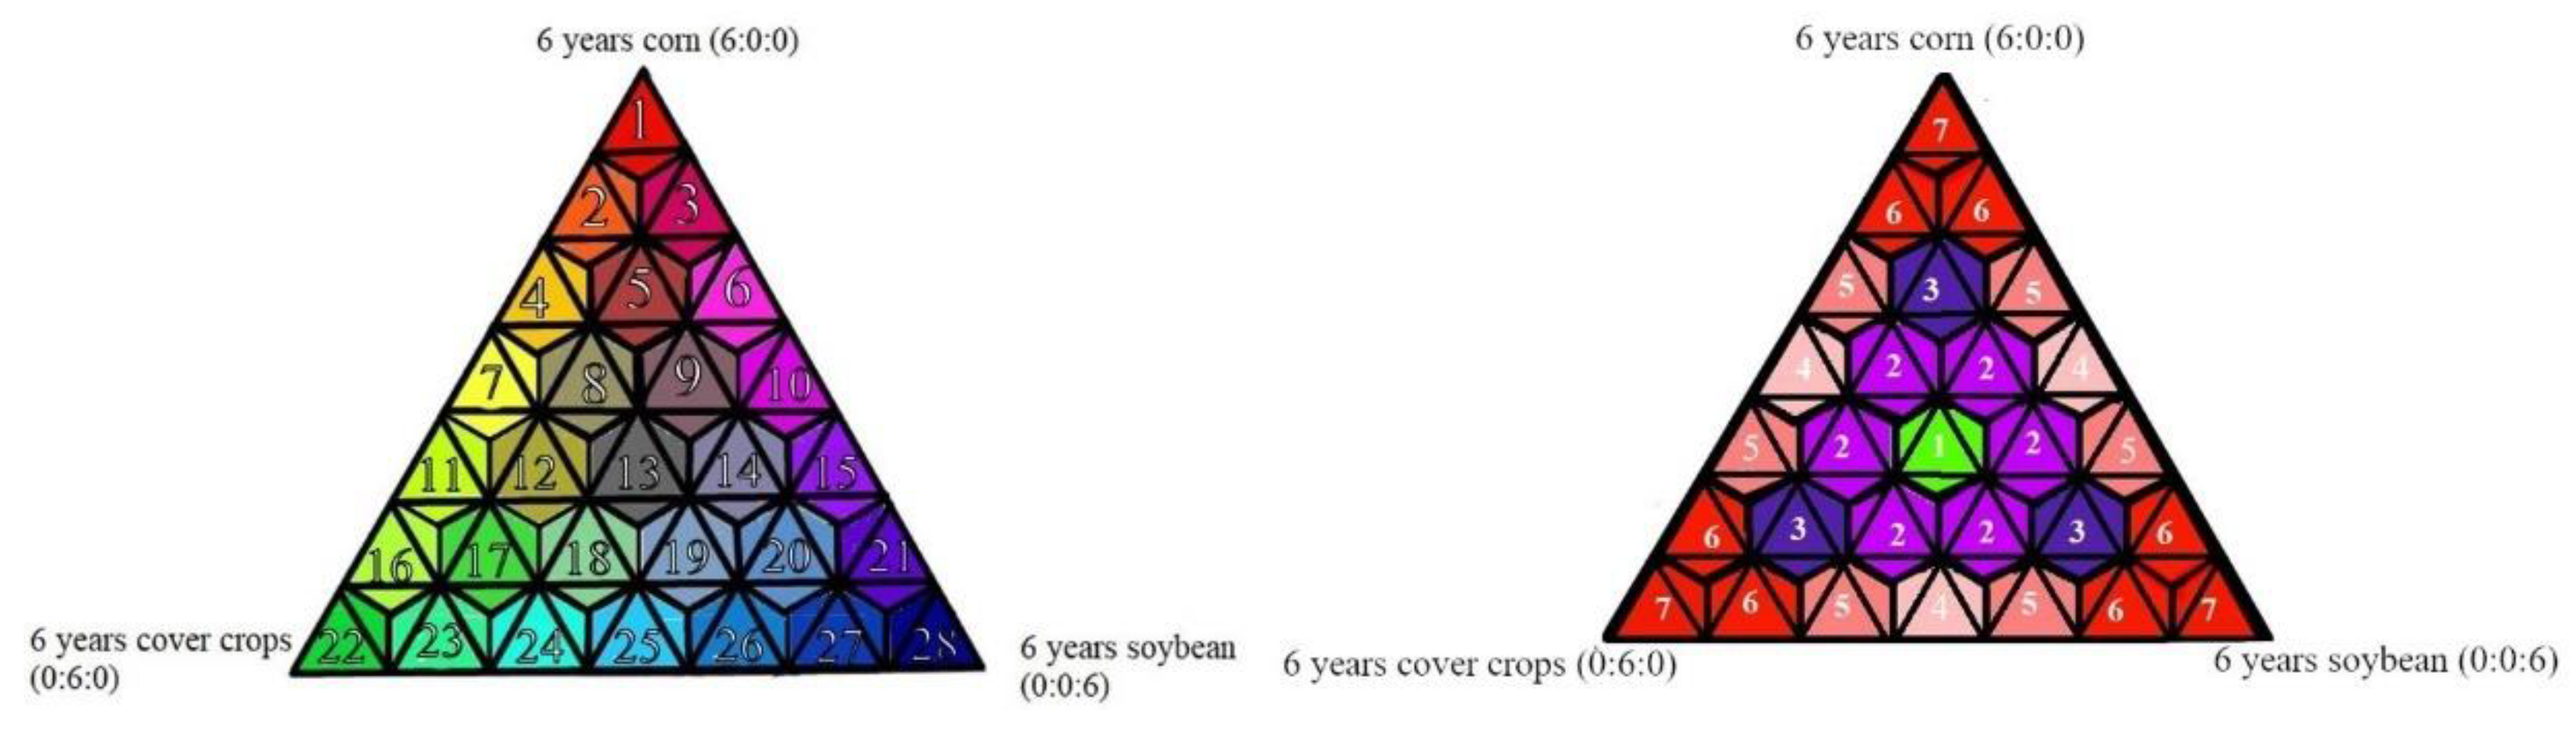
2.3. Analysis of Winter Wheat, Rye, and Oat Cover Crop Adoption in Corn and Soybean Rotations across Southern Ontario
3. Results and Discussion
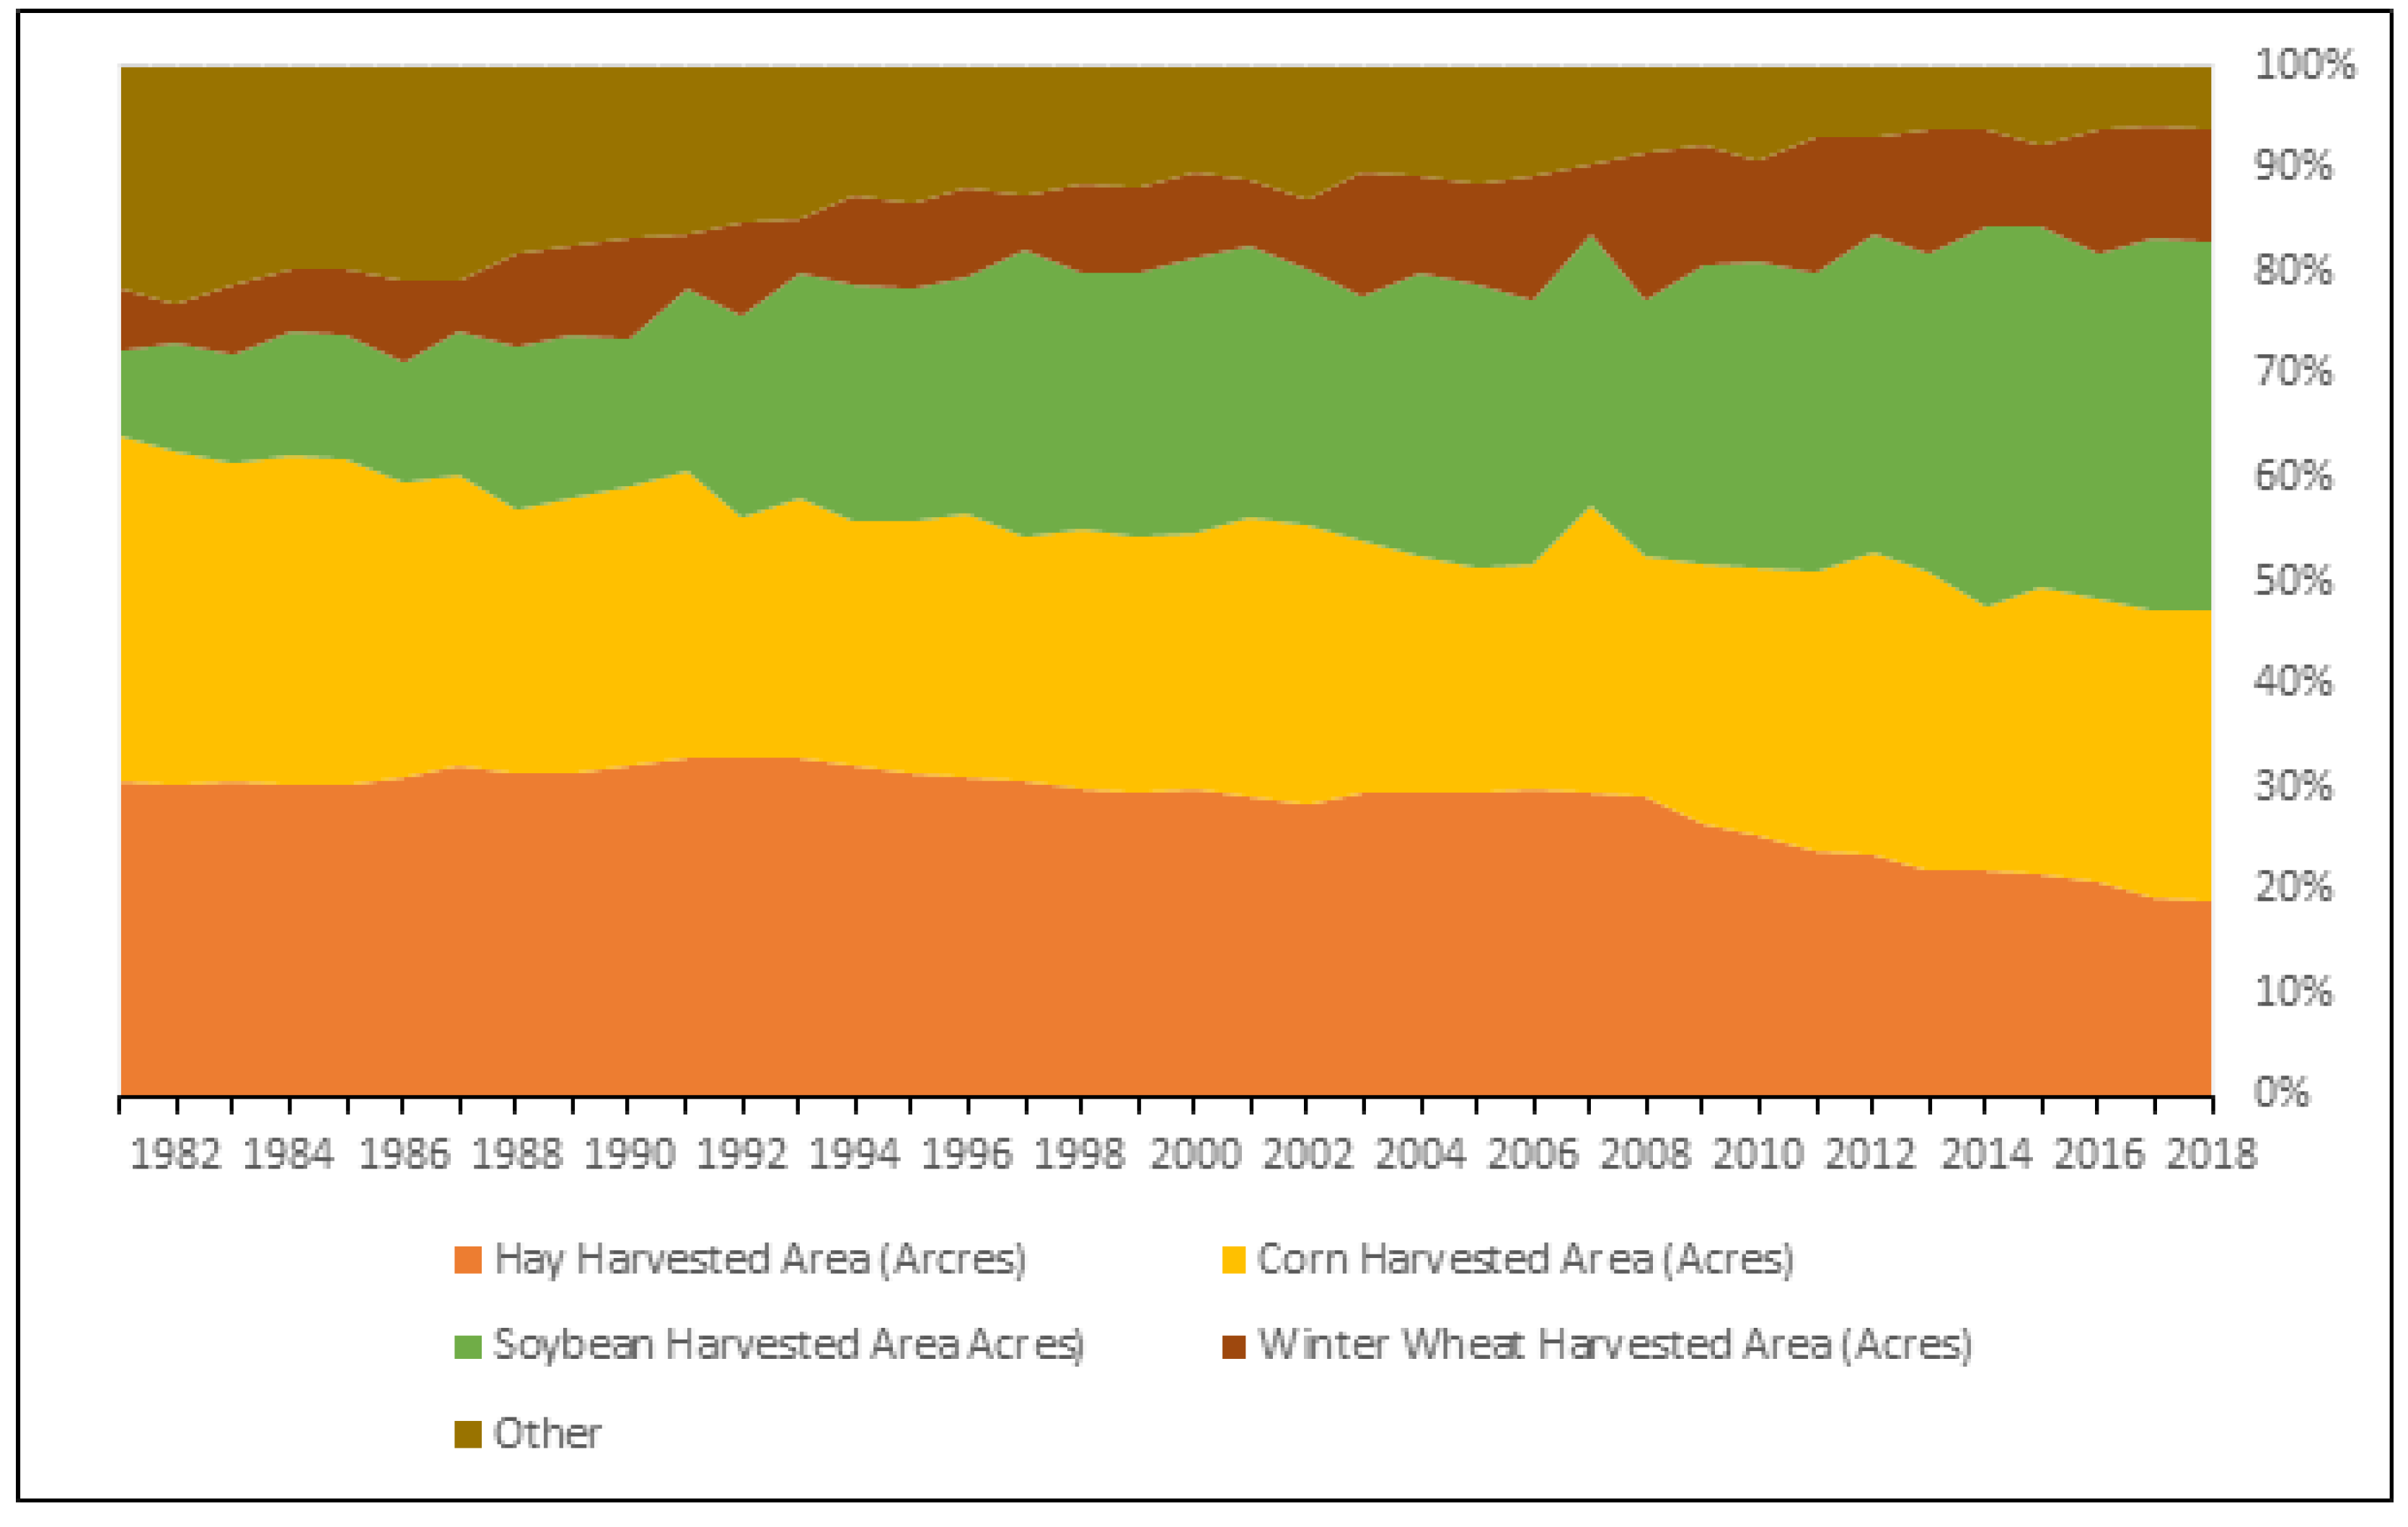
3.1. Field Crop Trends across Southern Ontario
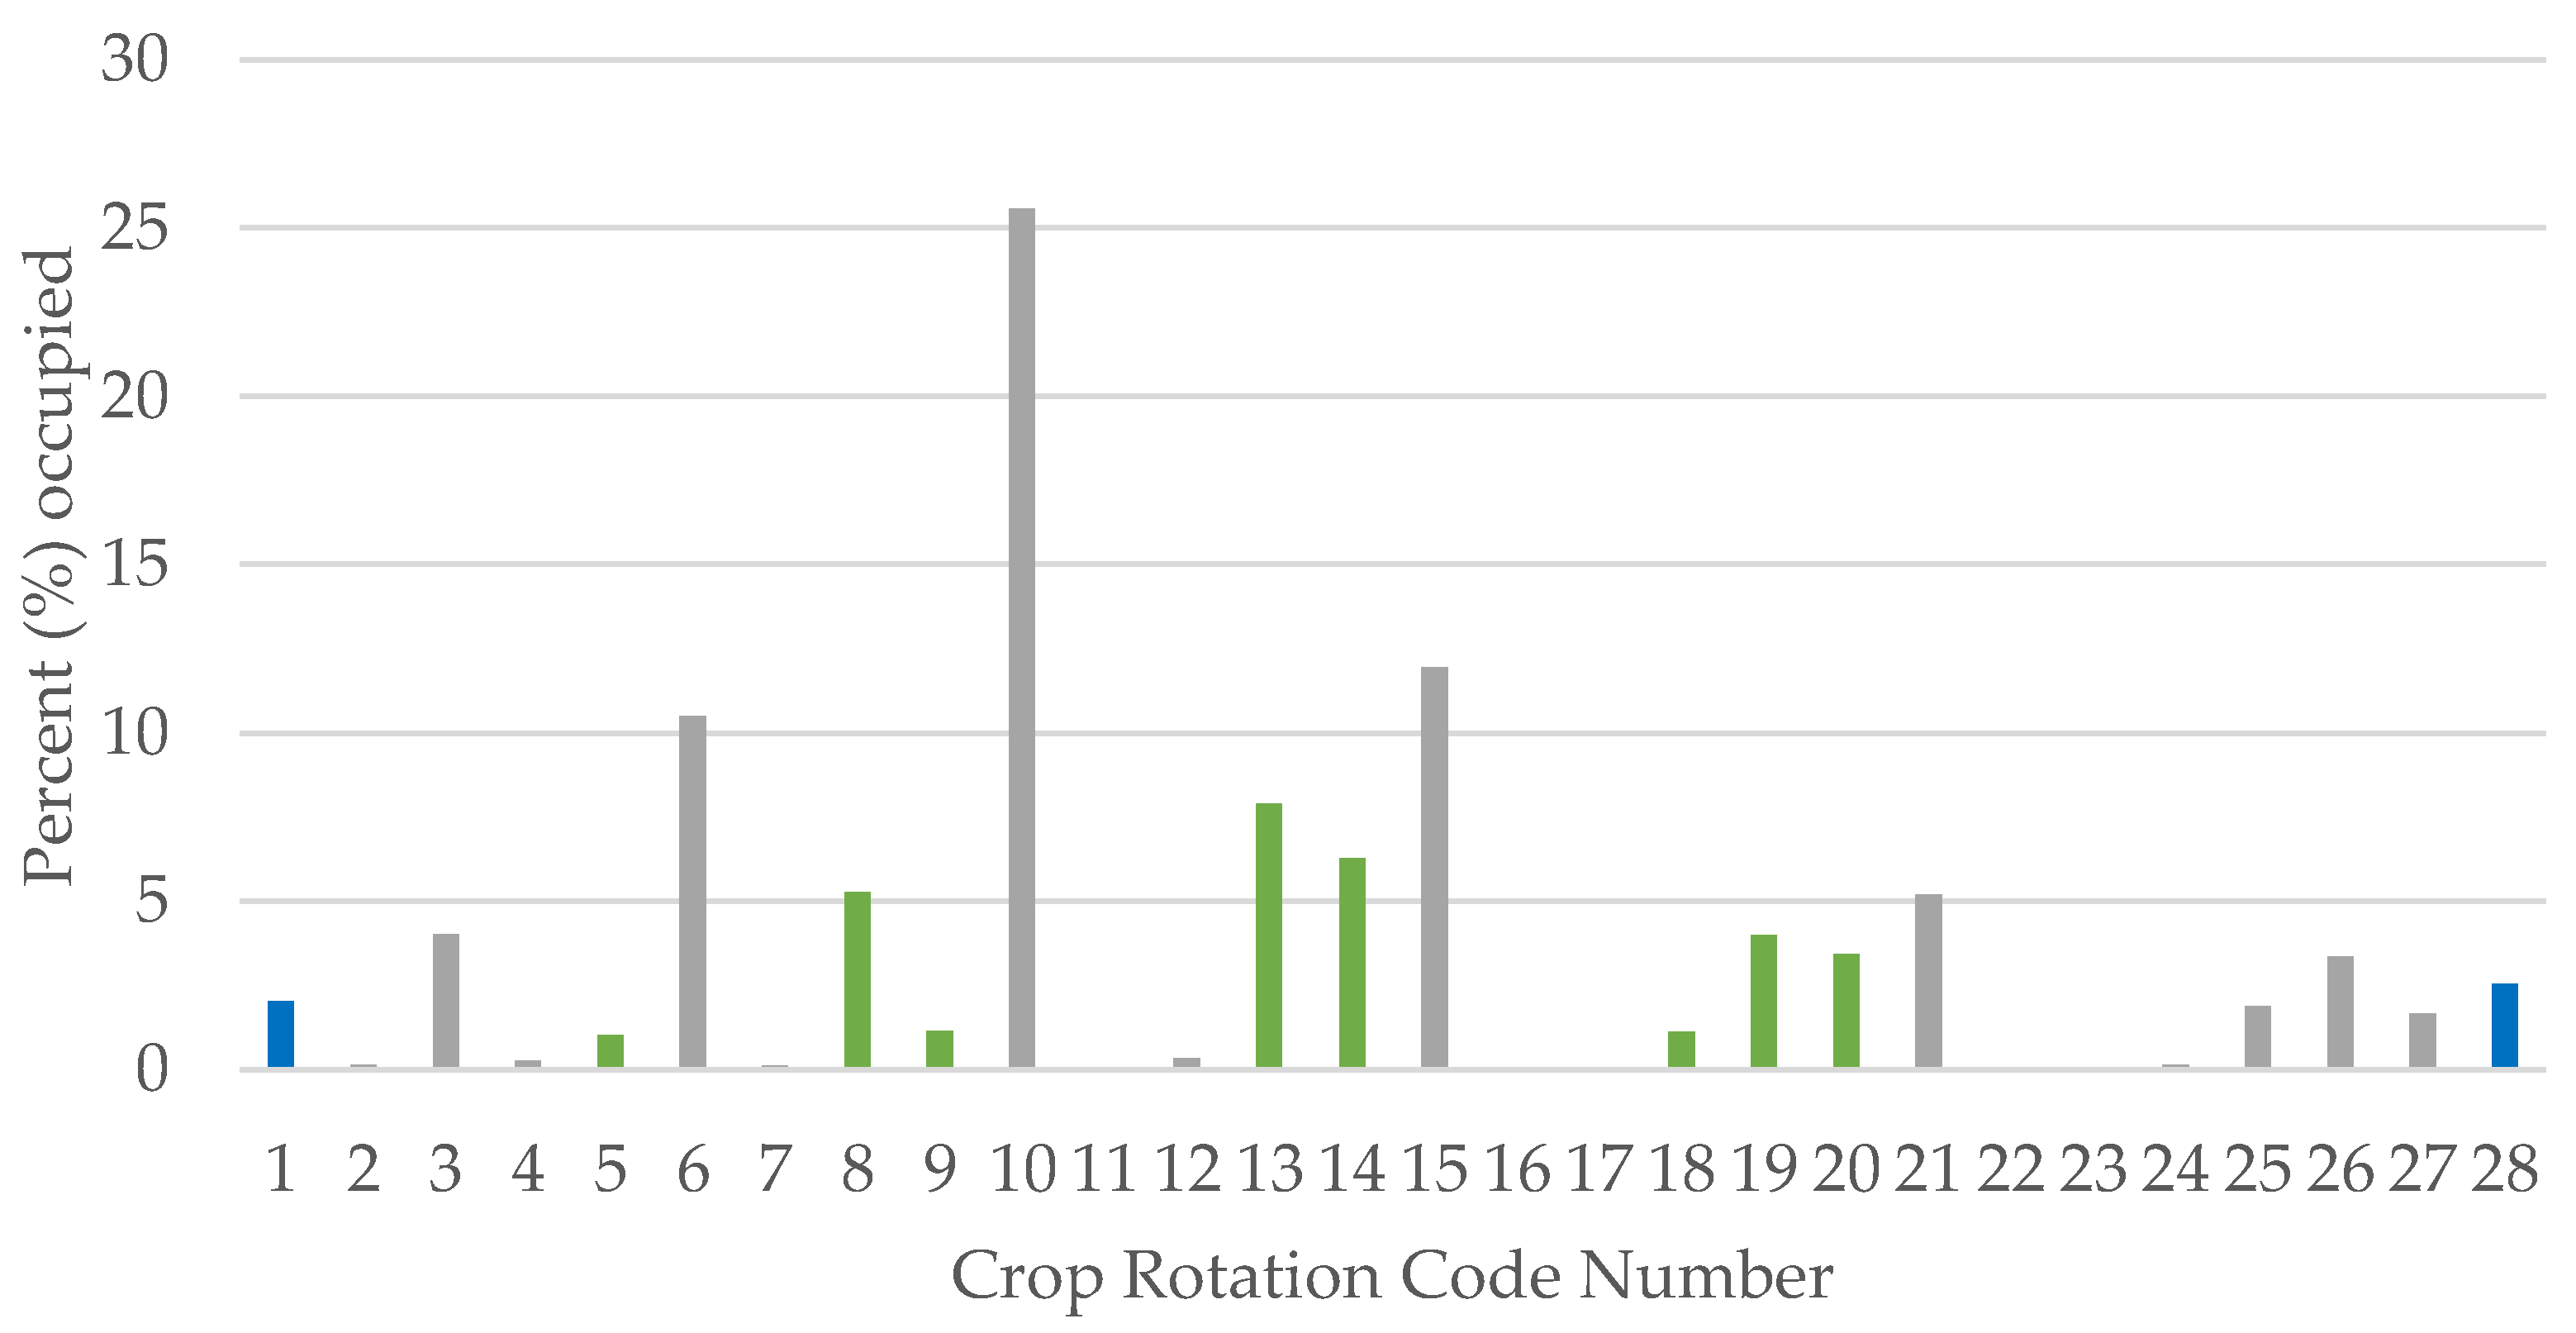
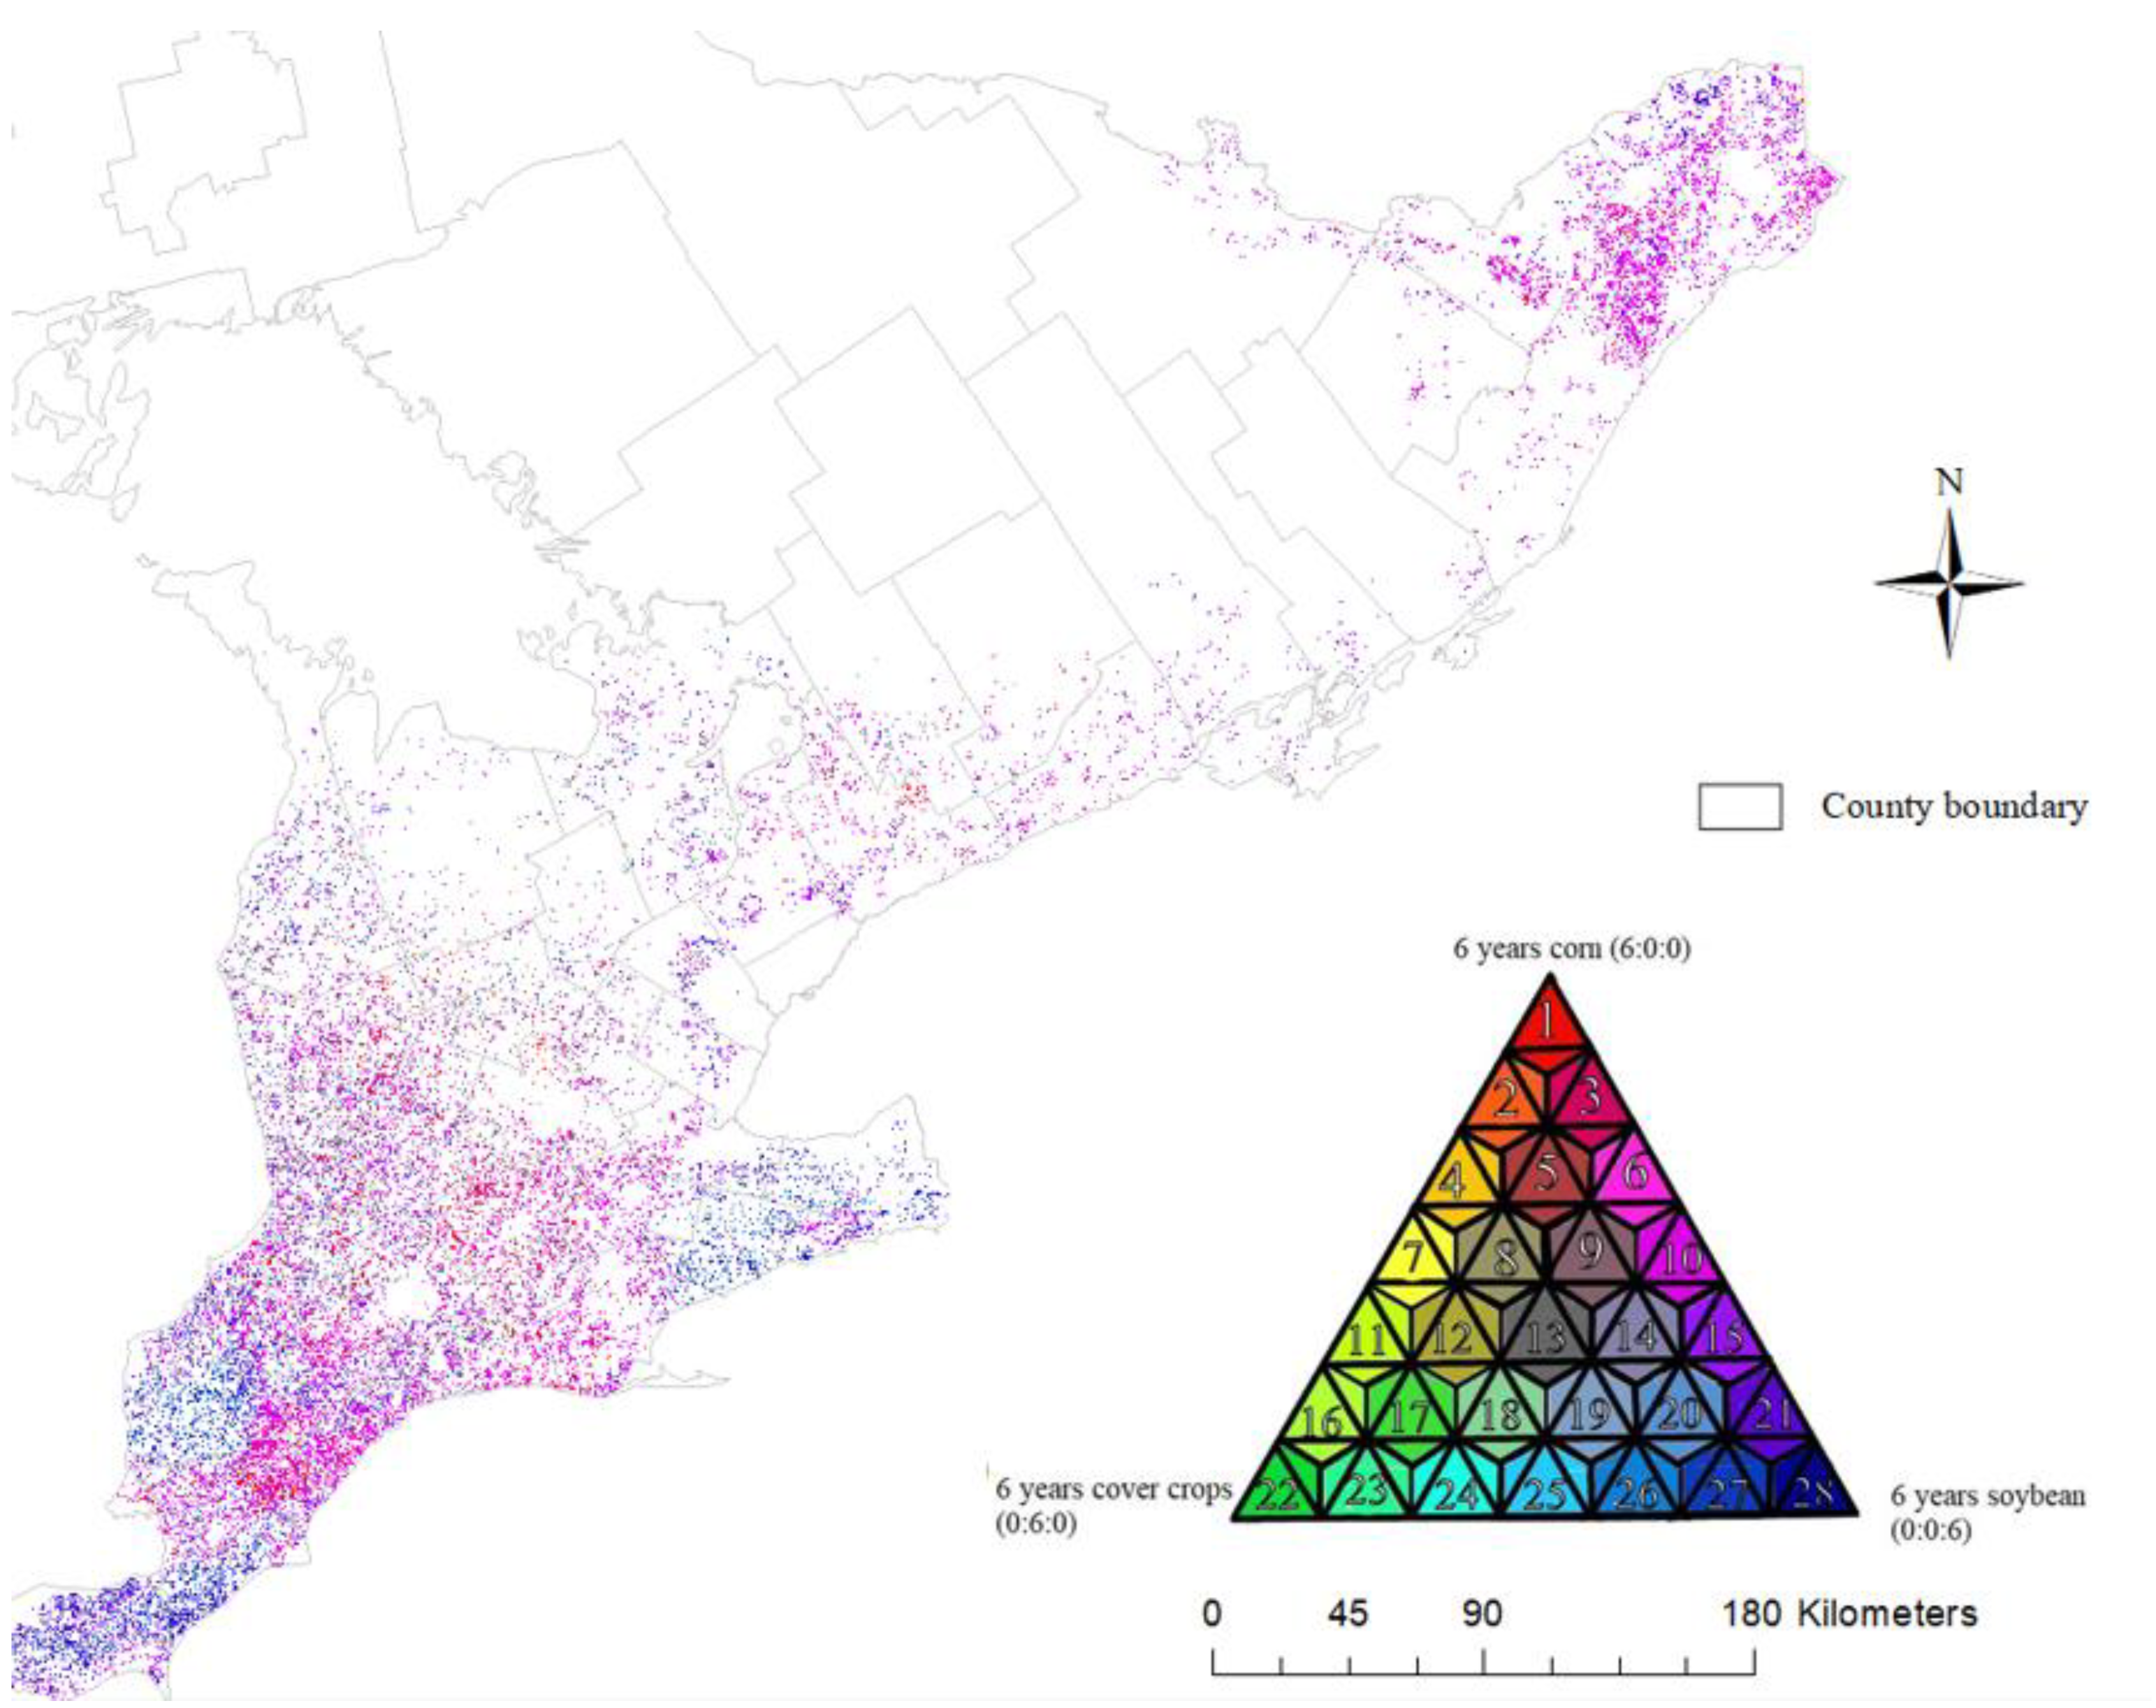
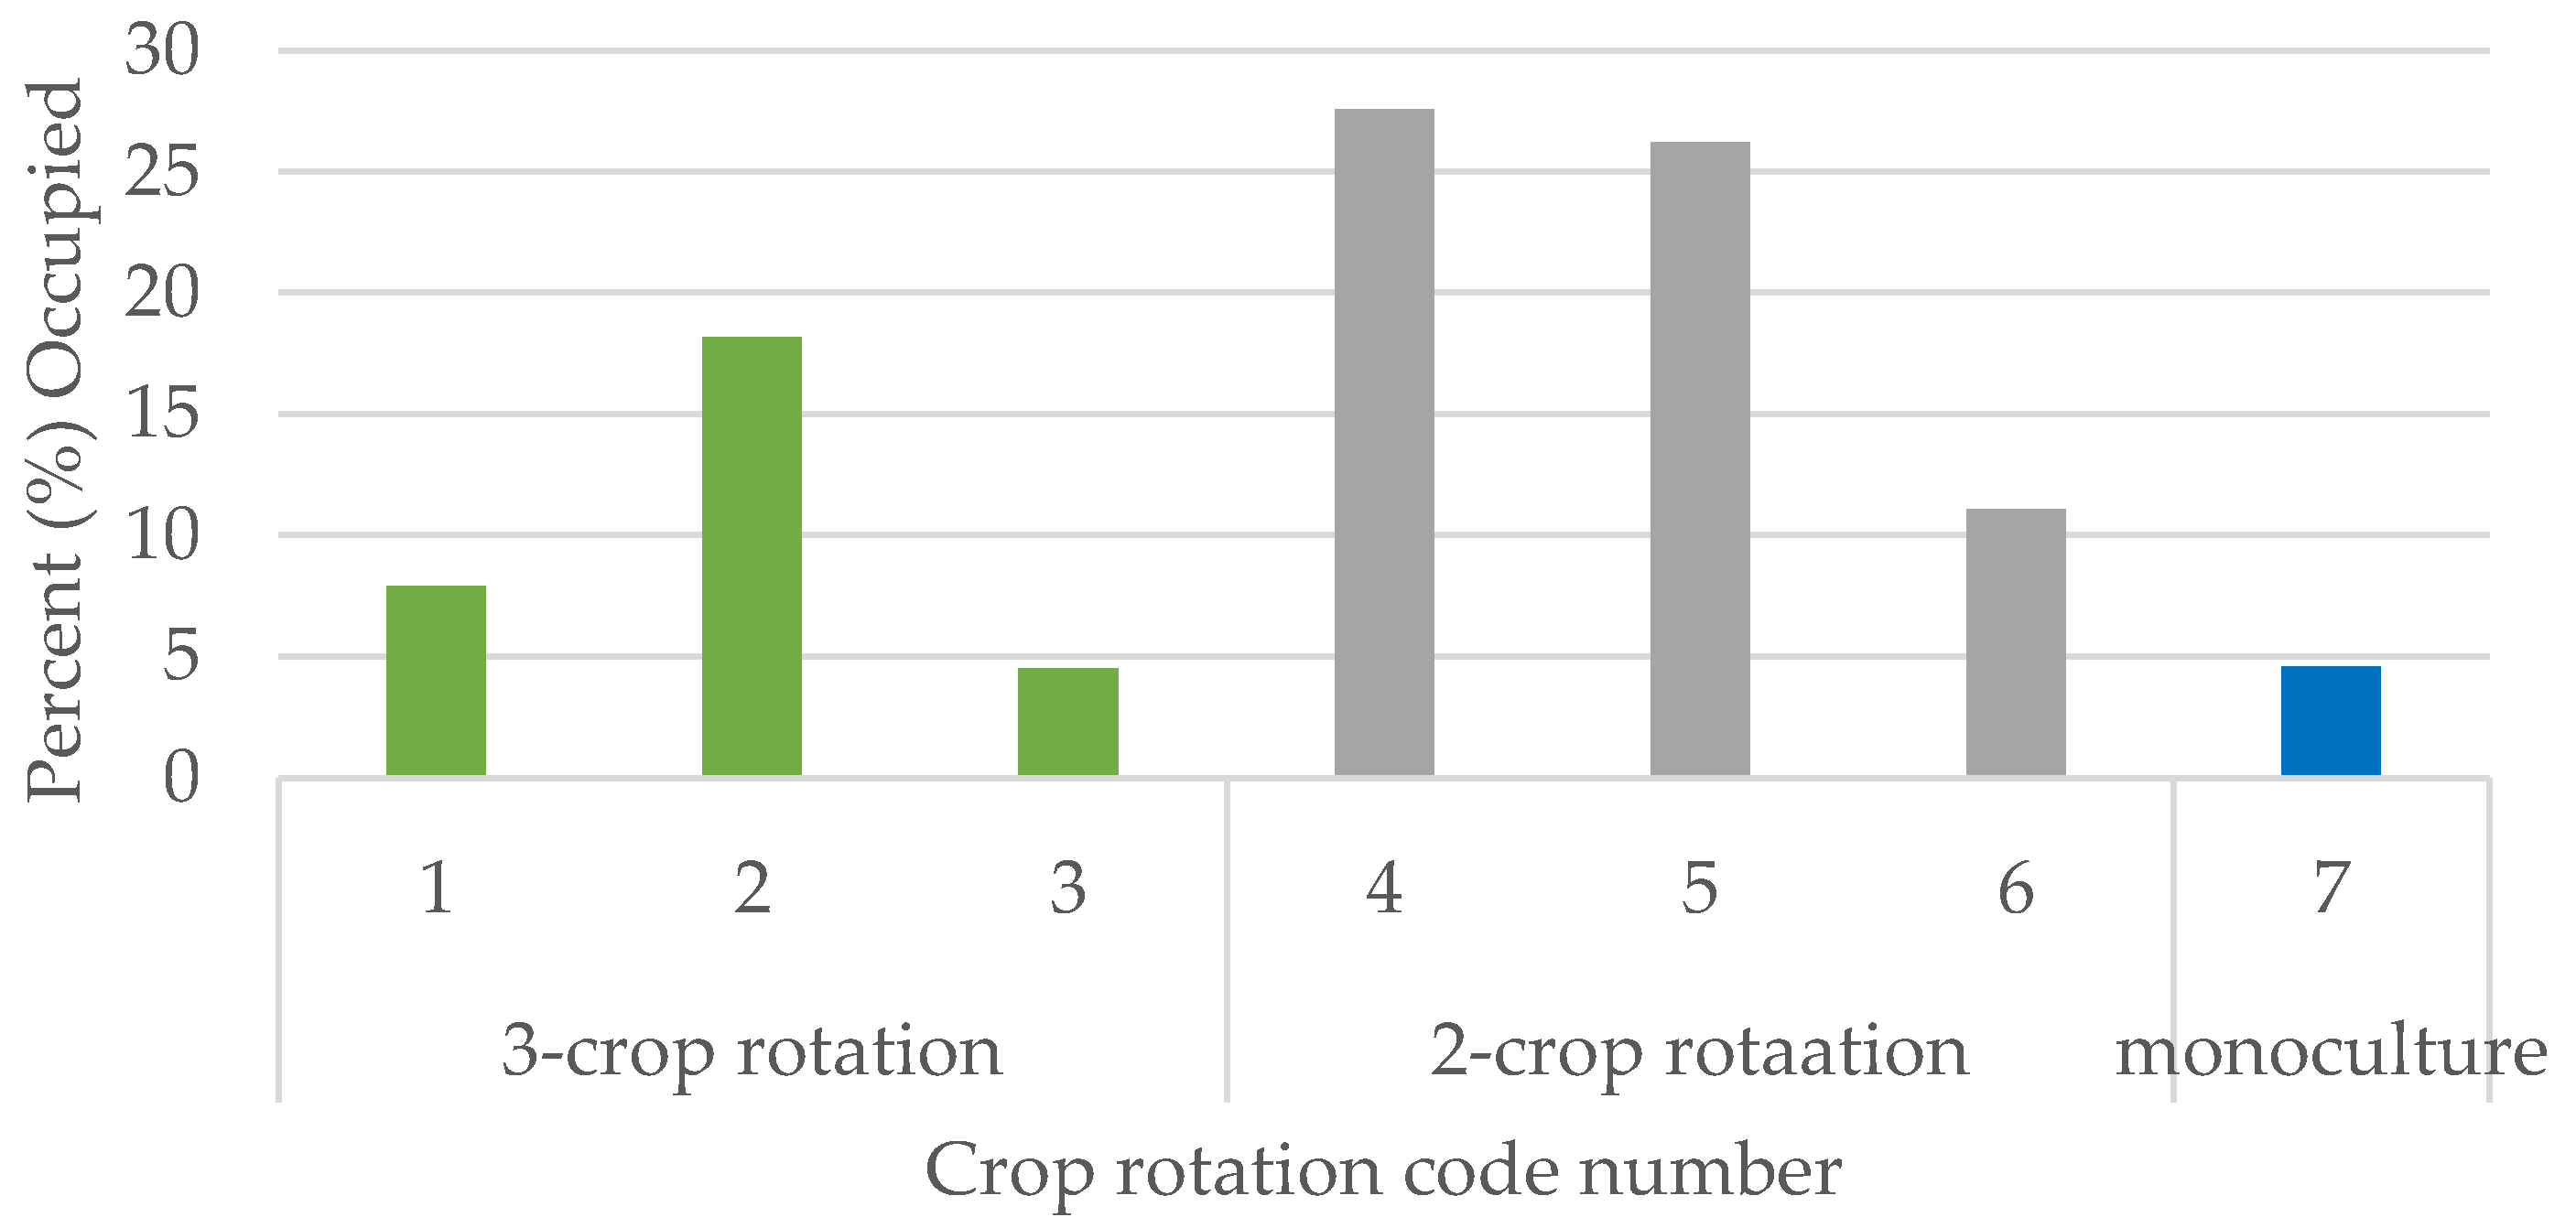
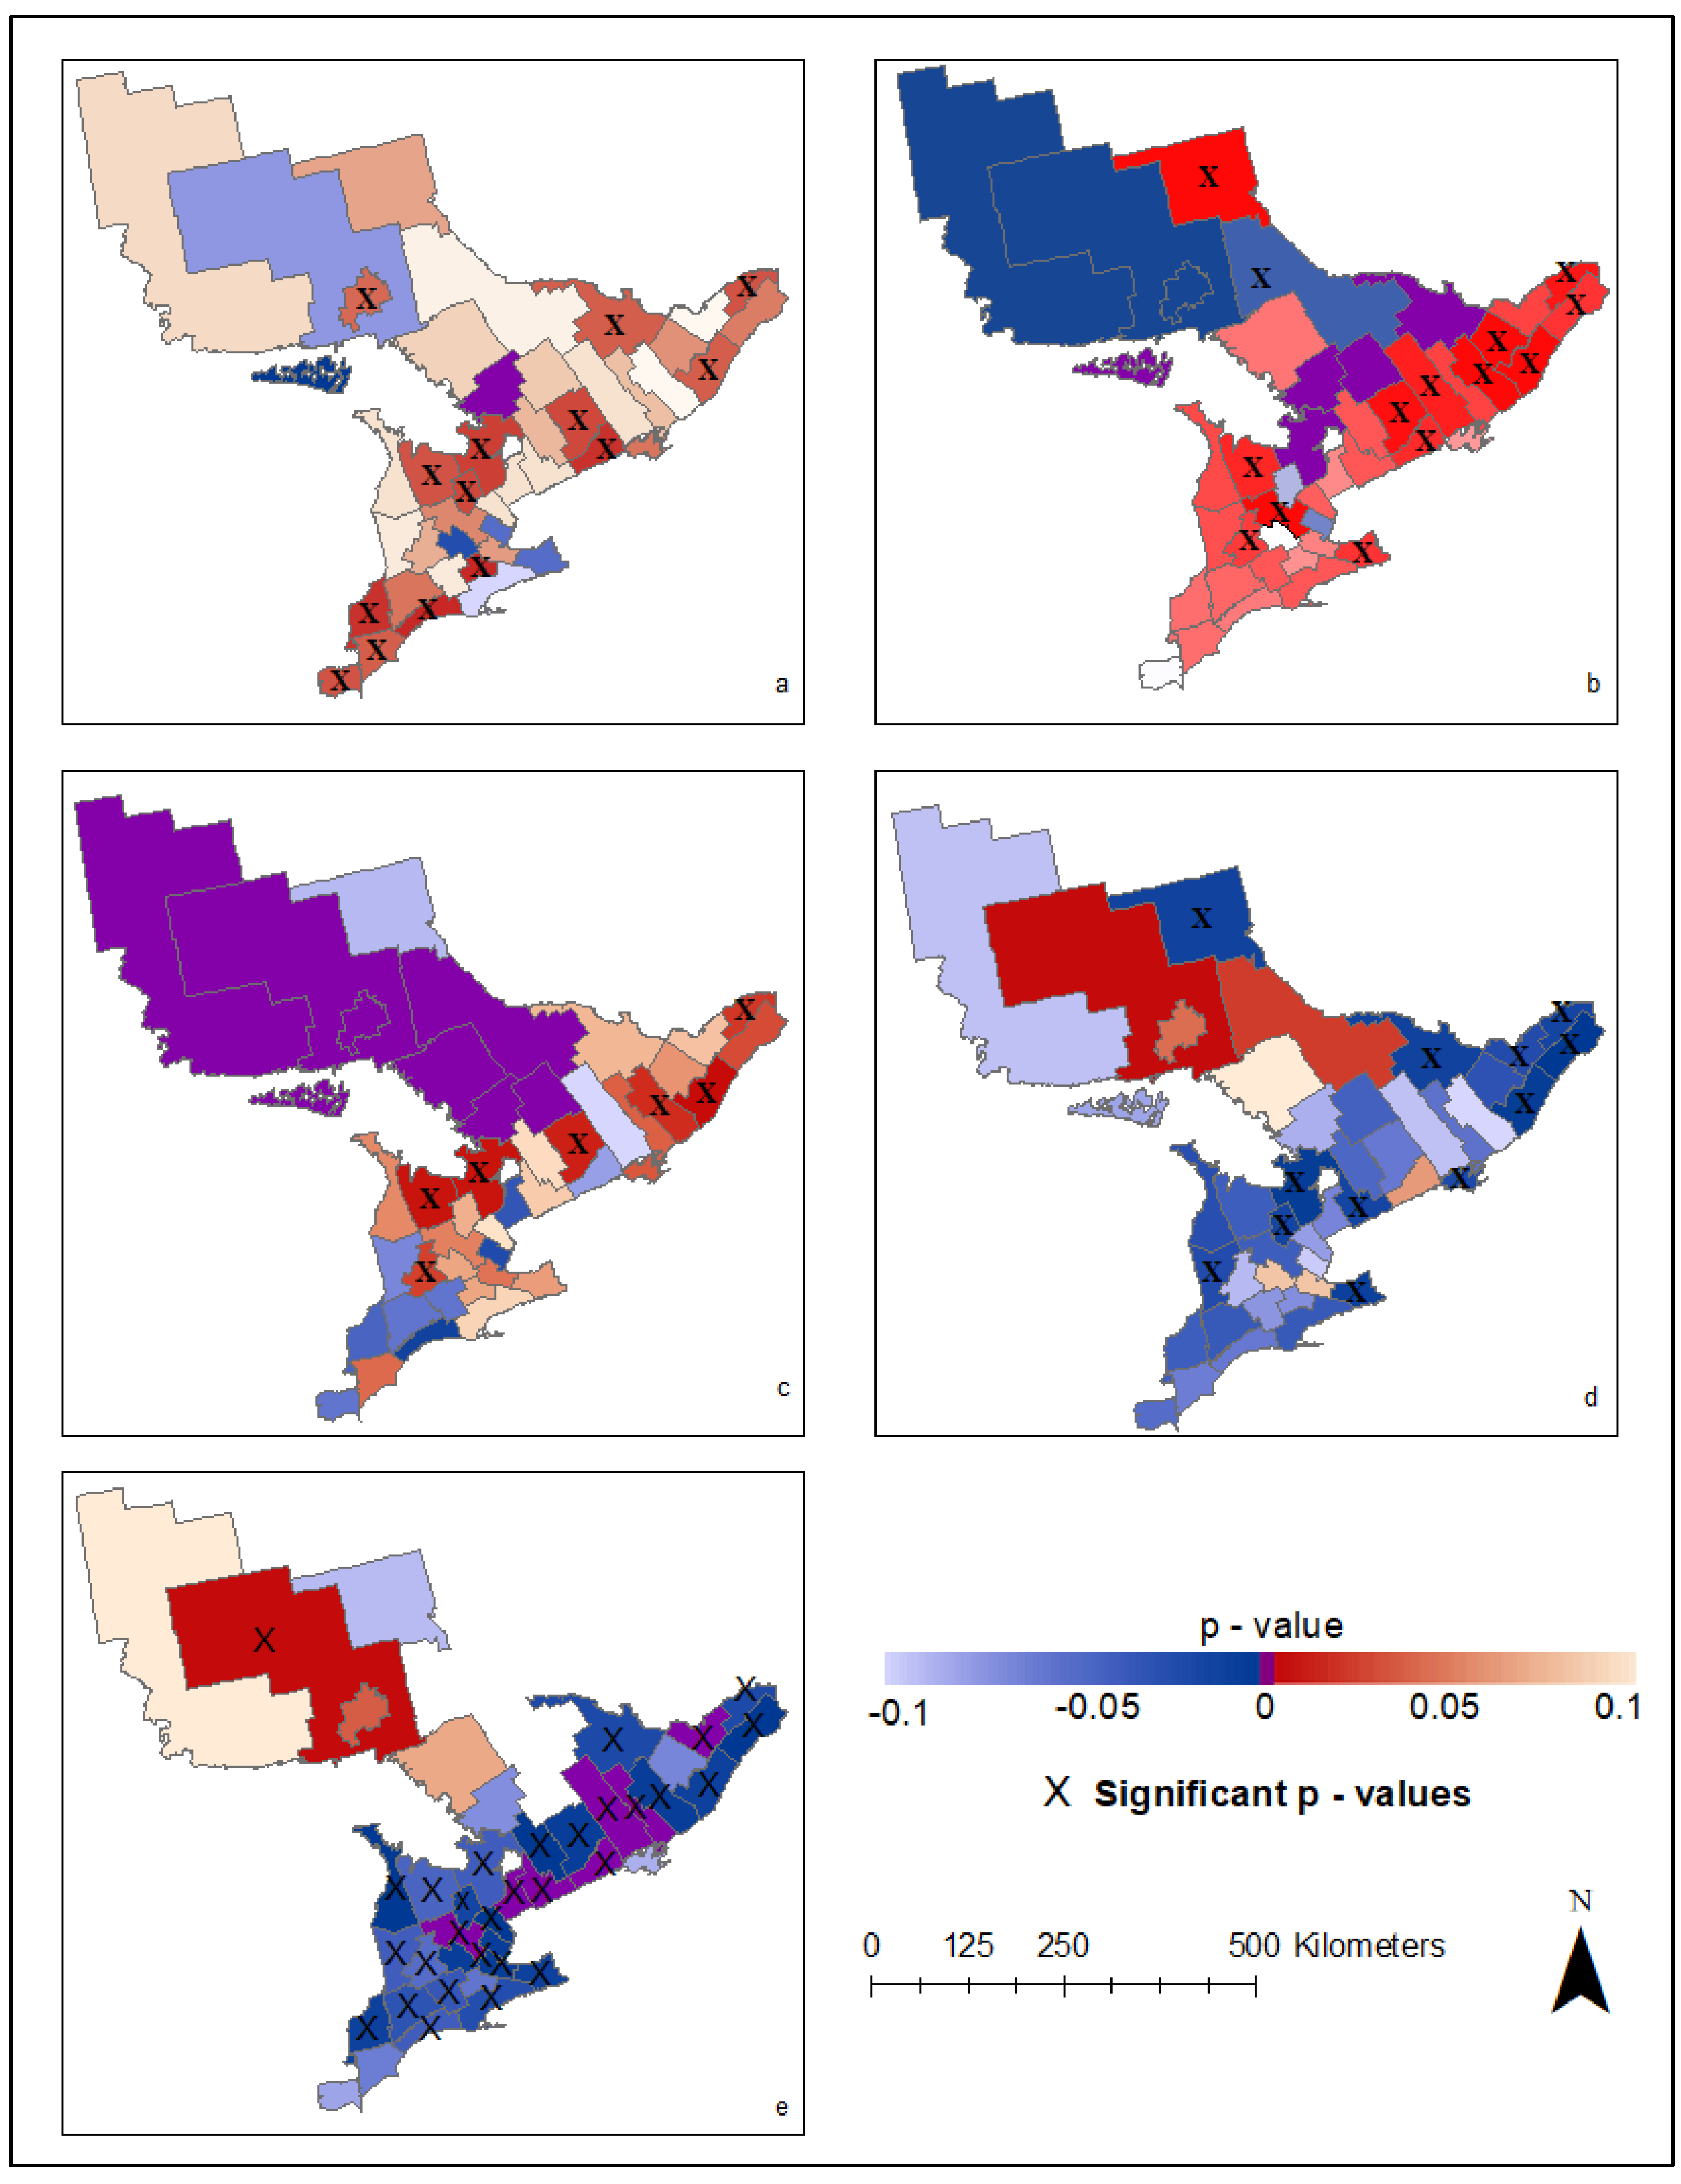
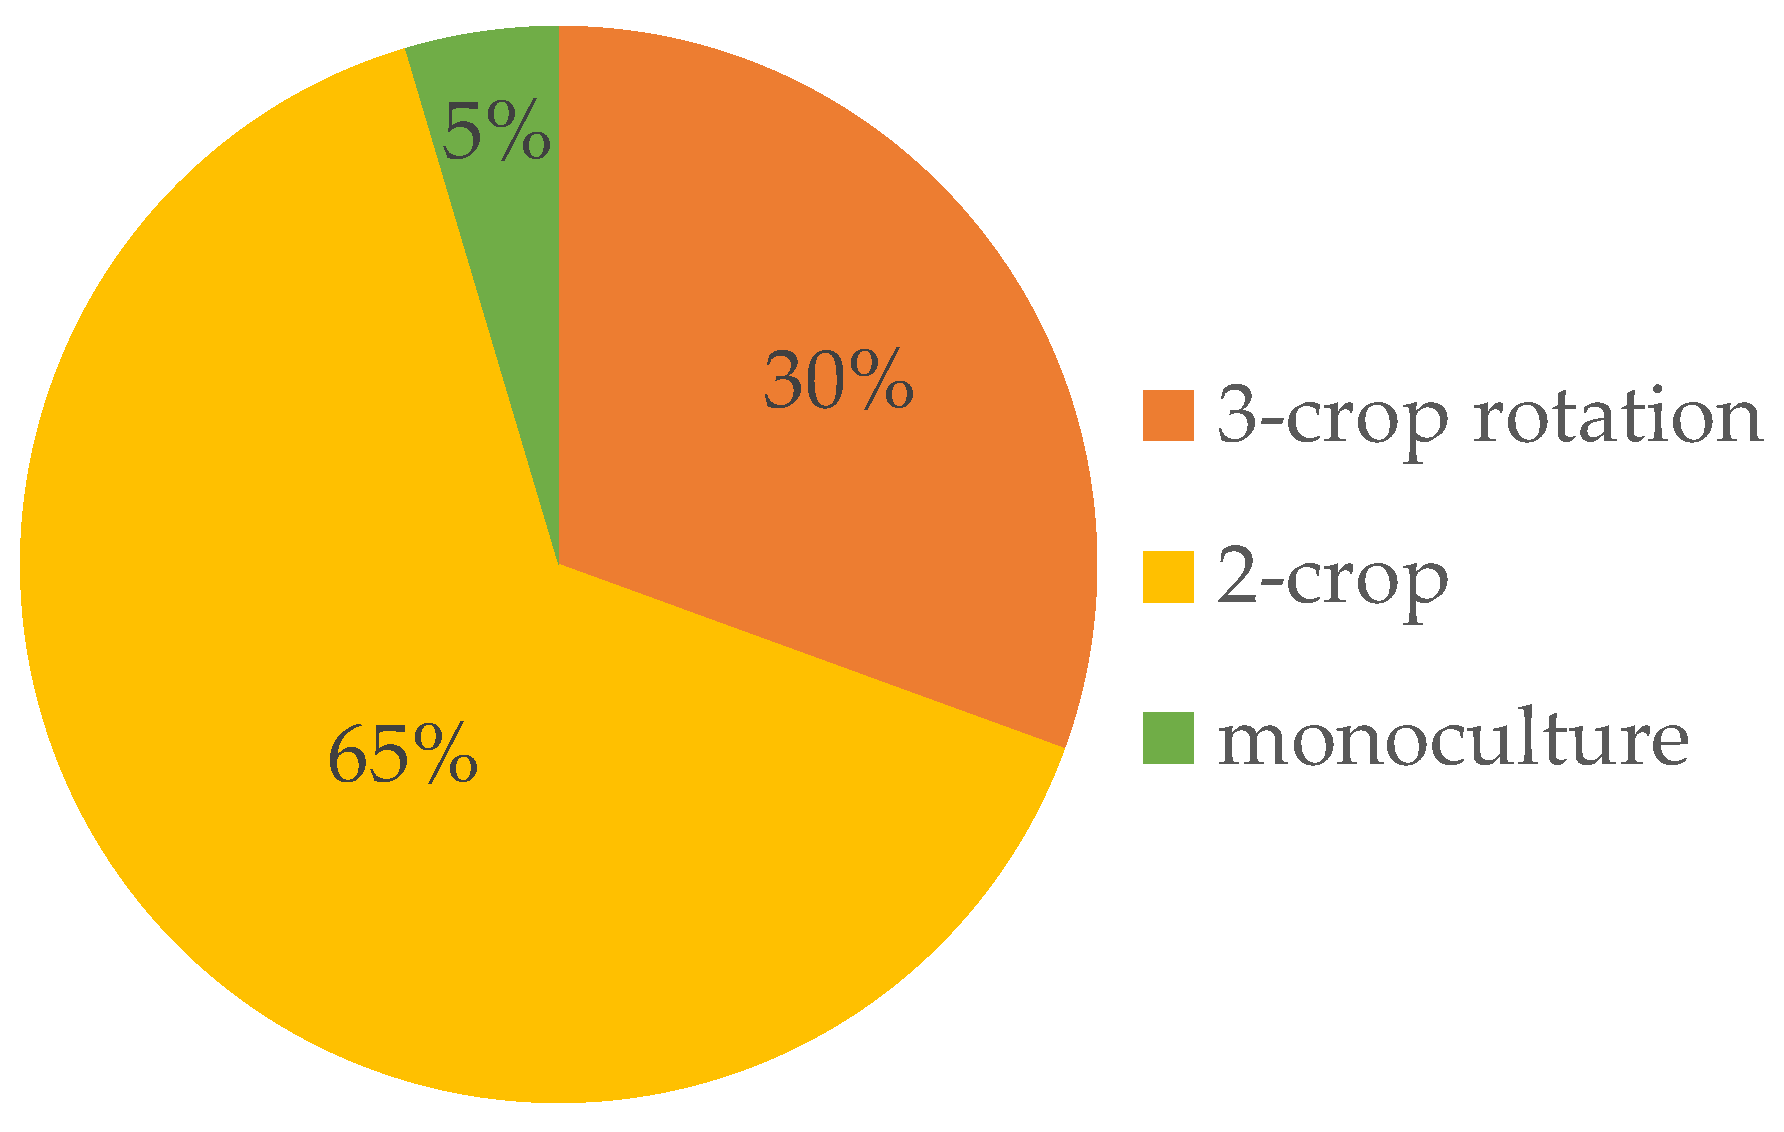
3.2. Cover Crop Adoption in Corn and Soybean Rotations across Southern Ontario
4. Conclusions
Author Contributions
Funding
Data Availability Statement
Acknowledgments
Conflicts of Interest
References
- USDA. World Agricultural Production: Monthly Circular Series for World Agricultural Production; USDA: Washington, DC, USA, 2012. Available online: https://www.fas.usda.gov/search?keyword=World+Agricultural+Production (accessed on 24 April 2021).
- USDA-NASS. Commodity Statistics Database; USDA: Washington, DC, USA, 2012. Available online: http://www.nass.usda.gov/Statistics_by_Subject/index.php?sector=CROPS (accessed on 24 April 2021).
- Statistics Canada. Croplands in Ontario grows despite fewer farms. Farm and Farm Operator Data. 2017. Available online: https://www150.statcan.gc.ca/n1/pub/95-640-x/2016001/article/14805-eng.htm (accessed on 24 April 2021).
- Reid, S.; Smit, B.; Caldwell, W.; Belliveau, S. Vulnerability and adaptation to climate risks in Ontario agriculture. Mitig. Adapt. Strateg. Glob. Chang. 2007, 12, 609–637. [Google Scholar] [CrossRef]
- Smith, J.V. Adapting to climate variability and change in Ontario: Volume IV of the Canada Country Study: Climate Impacts and Adaptation; Environment. Canada: ON, Canada, 1998.
- Harrison, G.W. Stability under environmental stress: Resistance, resilience, persistence, and variability. Am. Nat. 1979, 113, 659–669. [Google Scholar] [CrossRef]
- Gaudin, A.C.; Tolhurst, T.N.; Ker, A.P.; Janovicek, K.; Tortora, C.; Martin, R.C.; Deen, W. Increasing crop diversity mitigates weather variations and improves yield stability. PLoS ONE 2015, 10, e0113261. [Google Scholar] [CrossRef] [PubMed] [Green Version]
- Zhu, J.C.; Gantzer, C.J.; Anderson, S.H.; Alberts, E.E.; Beuselinck, P.R. Runoff, soil, and dissolved nutrient losses from no-till soybean with winter cover crops. Soil Sci. Soc. Am. J. 1989, 53, 1210–1214. [Google Scholar] [CrossRef]
- Kaspar, T.C.; Radke, J.K.; Laflen, J.M. Small grain cover crops and wheel traffic effects on infiltration, runoff, and erosion. J. Soil Water Conserv. 2001, 56, 160–164. Available online: http://sfx.scholarsportal.info.subzero.lib.uoguelph.ca/guelph/docview/220973477?accountid=11233 (accessed on 24 April 2021).
- Kladivko, E.J.; Prankenberger, J.R.; Jaynes, D.B.; Meek, D.W.; Jenkinson, B.J.; Fausey, N.R. Nitrate leaching to subsurface drains as affected by drain spacing and changes in crop production system. J. Environ. Qual. 2004, 33, 1803–1813. [Google Scholar] [CrossRef] [PubMed]
- Strock, J.S.; Porter, P.M.; Russelle, M.P. Cover cropping to reduce nitrate loss through subsurface drainage in the northern US corn belt. J. Environ. Qual. 2004, 33, 1010–1016. [Google Scholar] [CrossRef]
- Kaspar, T.C.; Jaynes, D.B.; Parkin, T.B.; Moorman, T.B. Rye cover crop and gamagrass strip effects on NO3 concentration and load in tile drainage. J. Environ. Qual. 2007, 36, 1503–1511. [Google Scholar] [CrossRef] [Green Version]
- Lapierre, J.; Machado, P.V.; Debruyn, Z.; Brown, S.E.; Jordan, S.; Berg, A.; Biswas, A.; Henry, H.A.; Wagner-Riddle, C. Cover crop mixtures: A powerful strategy to reduce post-harvest surplus of soil nitrate and leaching. Agric. Ecosyst. Environ. 2022, 325, 107750. [Google Scholar] [CrossRef]
- Pieters, A.J. Green Manuring; John Wiley and Sons, Inc.: New York, NY, USA, 1927. [Google Scholar]
- Singer, J.W.; Nusser, S.M.; Alf, C.J. Are cover crops being used in the US corn belt? J. Soil Water Conserv. 2007, 62, 353–358. [Google Scholar]
- Sarrantonio, M.; Gallandt, E. The role of cover crops in north American cropping systems. J. Crop Prod. 2003, 8, 53–74. [Google Scholar] [CrossRef]
- Gaudin, A.C.; Janovicek, K.; Deen, B.; Hooker, D.C. Wheat improves the nitrogen use efficiency of maize and soybean-based cropping systems. Agric. Ecosyst. Environ. 2015, 210, 1–10. [Google Scholar] [CrossRef]
- Williams, M.M.; Mortensen, D.A.; Doran, J.W. No-tillage soybean performance in cover crops for weed management in the western Corn Belt. J. Soil Water Conserv. 2000, 55, 79–84. [Google Scholar]
- Laamrani, A.; Voroney, P.R.; Berg, A.A.; Gillespie, A.W.; March, M.; Deen, B.; Martin, R.C. Temporal change of soil carbon on a long-term experimental site with variable crop rotations and tillage systems. Agronomy 2020, 10, 840. [Google Scholar] [CrossRef]
- Seifert, C.A.; Azzari, G.; Lobell, D.B. Satellite detection of cover crops and their effects on crop yield in the Midwestern United States. Environ. Res. Lett. 2018, 13, 064033. [Google Scholar] [CrossRef]
- Hively, W.D.; Duiker, S.; McCarty, G.; Prabhakara, K. Remote sensing to monitor cover crop adoption in southeastern Pennsylvania. J. Soil Water Conserv. 2015, 70, 340–352. [Google Scholar] [CrossRef] [Green Version]
- OMAFRA (The Ontario Ministry of Agriculture, Food and Rural Affairs). Field Crops: Area and Production Estimates by County (2004–2018). 2018. Available online: http://www.omafra.gov.on.ca/english/stats/crops/ (accessed on 27 April 2021).
- AAFC. Annual Crop Inventory. Agriculture and Agri-Food Canada. 2018. Available online: https://www.open.canada.ca/data/en/ (accessed on 26 April 2021).
- Laamrani, A.; Joosse, P.; McNairn, H.; Berg, A.A.; Hagerman, J.; Powell, K.; Berry, M. Assessing Soil Cover Levels during the Non-Growing Season Using Multitemporal Satellite Imagery and Spectral Unmixing Techniques. Remote Sens. 2020, 12, 1397. [Google Scholar] [CrossRef]
- Pilger, N.; Berg, A.; Joosse, P. Semi-Automated Roadside Image Data Collection for Characterization of Agricultural Land Management Practices. Remote Sens. 2020, 12, 2342. [Google Scholar] [CrossRef]
- Walton, M. Agriculture in the Central Ontario Zone. Neptis Foundation. 2003. Available online: https://www.neptis.org/sites/default/files/smart_growth_issue_papers_agriculture/ (accessed on 6 June 2021).
- OMAFRA. Best Management Practices: Winter Cover Crops. The Ontario Ministry of Agriculture, Food and Rural Affairs. 2020. Available online: http://www.omafra.gov.on.ca/english/environment/bmp/series.htm#AF189 (accessed on 3 May 2021).
- Wright, C.K.; Wimberly, M.C. Recent land use change in the Western Corn Belt threatens grasslands and wetlands. Proc. Natl. Acad. Sci. USA 2013, 110, 4134–4139. [Google Scholar] [CrossRef] [Green Version]
- Liebman, M.; Helmers, M.J.; Schulte, L.A.; Chase, C.A. Using biodiversity to link agricultural productivity with environmental quality: Results from three field experiments in Iowa. Renew. Agric. Food Syst. 2013, 28, 115–128. [Google Scholar] [CrossRef] [Green Version]
- Hume, D.J.; Pearson, C.J. Transforming Farming Systems: Expanding the Production of Soybeans in Ontario. In Rainfed Farming Systems; Springer: Dordrecht, The Netherlands, 2011; pp. 791–803. [Google Scholar] [CrossRef]
- O’Neal, M.R.; Nearing, M.A.; Vining, R.C.; Southworth, J.; Pfeifer, R.A. Climate change impacts on soil erosion in Midwest United States with changes in crop management. Catena 2005, 61, 165–184. [Google Scholar] [CrossRef]
- Knowler, D.; Bradshaw, B. Farmers’ adoption of conservation agriculture: A review and synthesis of recent research. Food Policy 2007, 32, 25–48. [Google Scholar] [CrossRef]
- KC, K.B.; Pant, L.P.; Fraser, E.D.G.; Shrestha, P.K.; Shrestha, D.; Lama, A. Assessing links between crop diversity and food self-sufficiency in three agroecological regions of Nepal. Reg. Environ. Chang. 2016, 16, 1239–1251. [Google Scholar] [CrossRef]


| Possible Rotation Type (Rotation Code) | Corn: Cover Crop: Soybean |
|---|---|
| 1 | 6:0:0 |
| 2 | 5:1:0 |
| 3 | 5:0:1 |
| 4 | 4:2:0 |
| 5 | 4:1:1 |
| 6 | 4:0:2 |
| 7 | 3:3:0 |
| 8 | 3:2:1 |
| 9 | 3:1:2 |
| 10 | 3:0:3 |
| 11 | 2:4:0 |
| 12 | 2:3:1 |
| 13 | 2:2:2 |
| 14 | 2:1:3 |
| 15 | 2:0:4 |
| 16 | 1:5:0 |
| 17 | 1:4:1 |
| 18 | 1:3:2 |
| 19 | 1:2:3 |
| 20 | 1:1:4 |
| 21 | 1:0:5 |
| 22 | 0:6:0 |
| 23 | 0:5:1 |
| 24 | 0:4:2 |
| 25 | 0:3:3 |
| 26 | 0:2:4 |
| 27 | 0:1:5 |
| 28 | 0:0:6 |
| Rotation Type | Code | Corn: Cover Crops: Soybean |
|---|---|---|
| 3-crop rotation | 1 | 2:2:2 |
| 2 | 3:2:1 or: 2:3:1 or 1:2:3 or 1:3:2 or 3:1:2 or 2:1:3 | |
| 3 | 4:1:1 or 1:4:1 or 1:1:4 | |
| 2-crop rotation | 4 | 3:3:0 or 0:3:3 or 3:0:3 |
| 5 | 4:2:0 or 4:2:0 or 0:4:2 or 0:4:2 or 4:0:2 or 4:0:2 | |
| 6 | 5:1:0 or 1:5:0 or 0:5:1 or 0:1:5 or 1:0:5 or 5:0:1 | |
| Monoculture | 7 | 6:0:0 or 0:6:0 or 0:0:6 |
Publisher’s Note: MDPI stays neutral with regard to jurisdictional claims in published maps and institutional affiliations. |
© 2022 by the authors. Licensee MDPI, Basel, Switzerland. This article is an open access article distributed under the terms and conditions of the Creative Commons Attribution (CC BY) license (https://creativecommons.org/licenses/by/4.0/).
Share and Cite
Shirriff, K.; KC, K.B.; Berg, A. Evaluation of Agrobiodiversity and Cover Crop Adoption in Southern Ontario Field Crops. Agronomy 2022, 12, 415. https://doi.org/10.3390/agronomy12020415
Shirriff K, KC KB, Berg A. Evaluation of Agrobiodiversity and Cover Crop Adoption in Southern Ontario Field Crops. Agronomy. 2022; 12(2):415. https://doi.org/10.3390/agronomy12020415
Chicago/Turabian StyleShirriff, Katherine, Krishna Bahadur KC, and Aaron Berg. 2022. "Evaluation of Agrobiodiversity and Cover Crop Adoption in Southern Ontario Field Crops" Agronomy 12, no. 2: 415. https://doi.org/10.3390/agronomy12020415
APA StyleShirriff, K., KC, K. B., & Berg, A. (2022). Evaluation of Agrobiodiversity and Cover Crop Adoption in Southern Ontario Field Crops. Agronomy, 12(2), 415. https://doi.org/10.3390/agronomy12020415