
Future Scenarios for Olive Tree and Grapevine Potential Yields in the World Heritage Côa Region, Portugal


Abstract
:1. Introduction
2. Materials and Methods
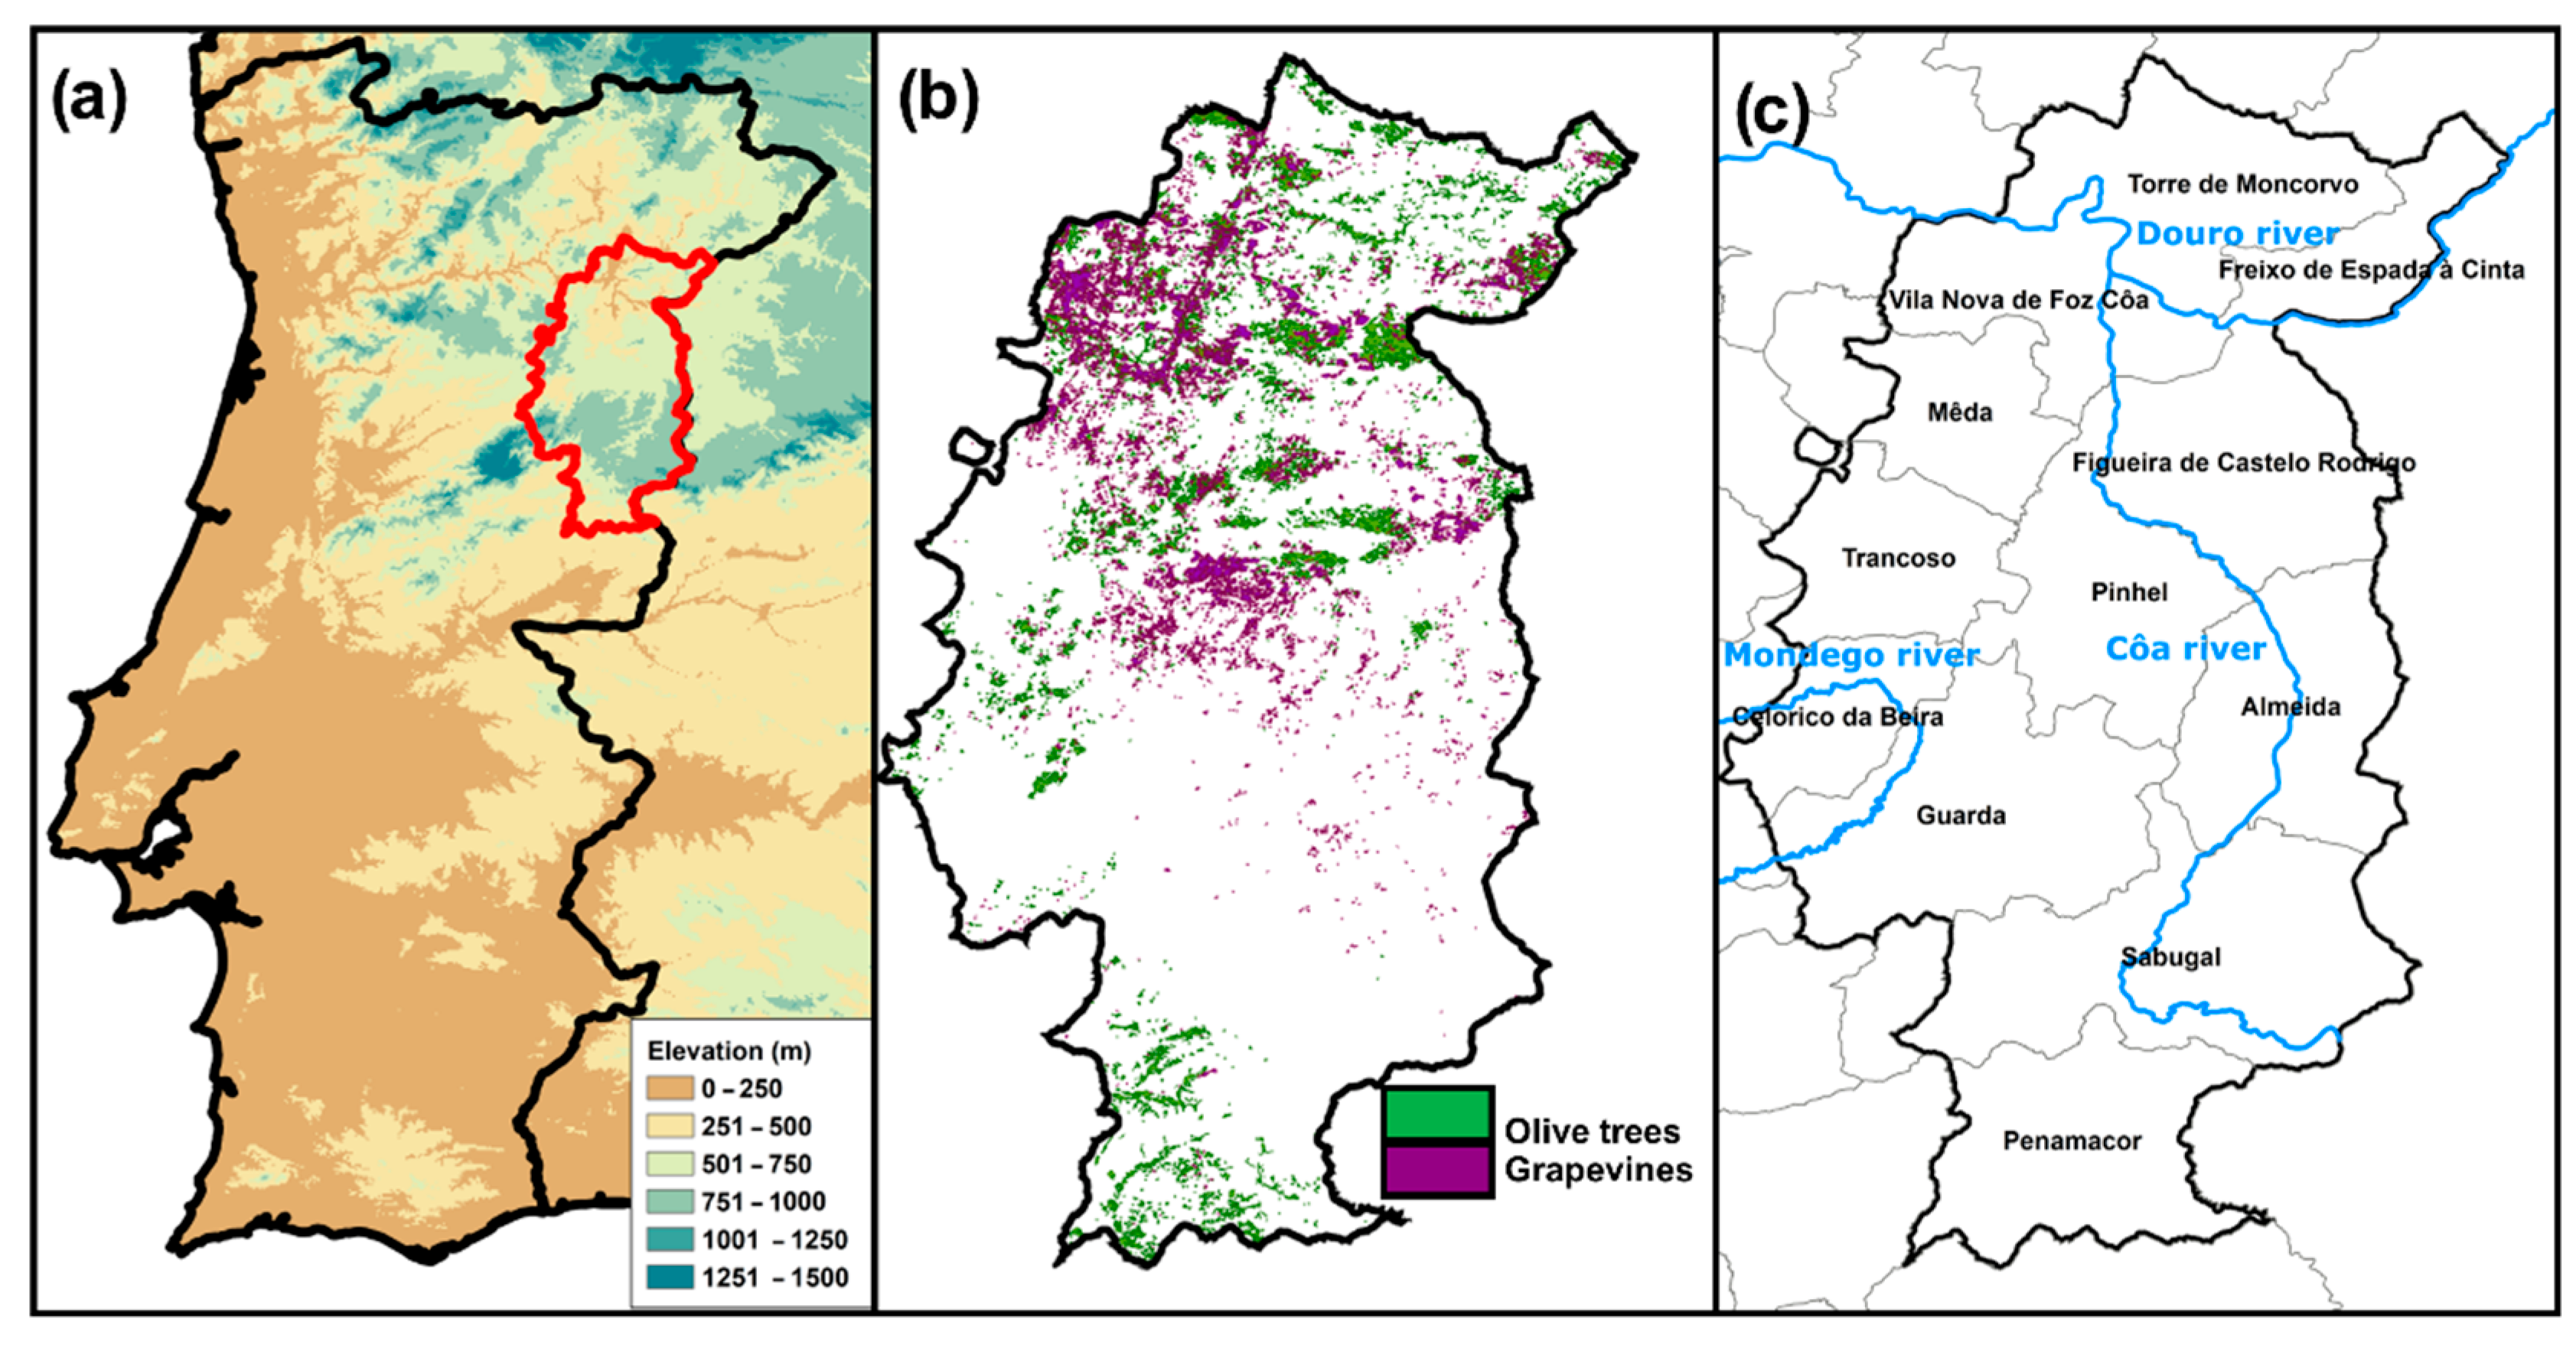
2.1. Study Area
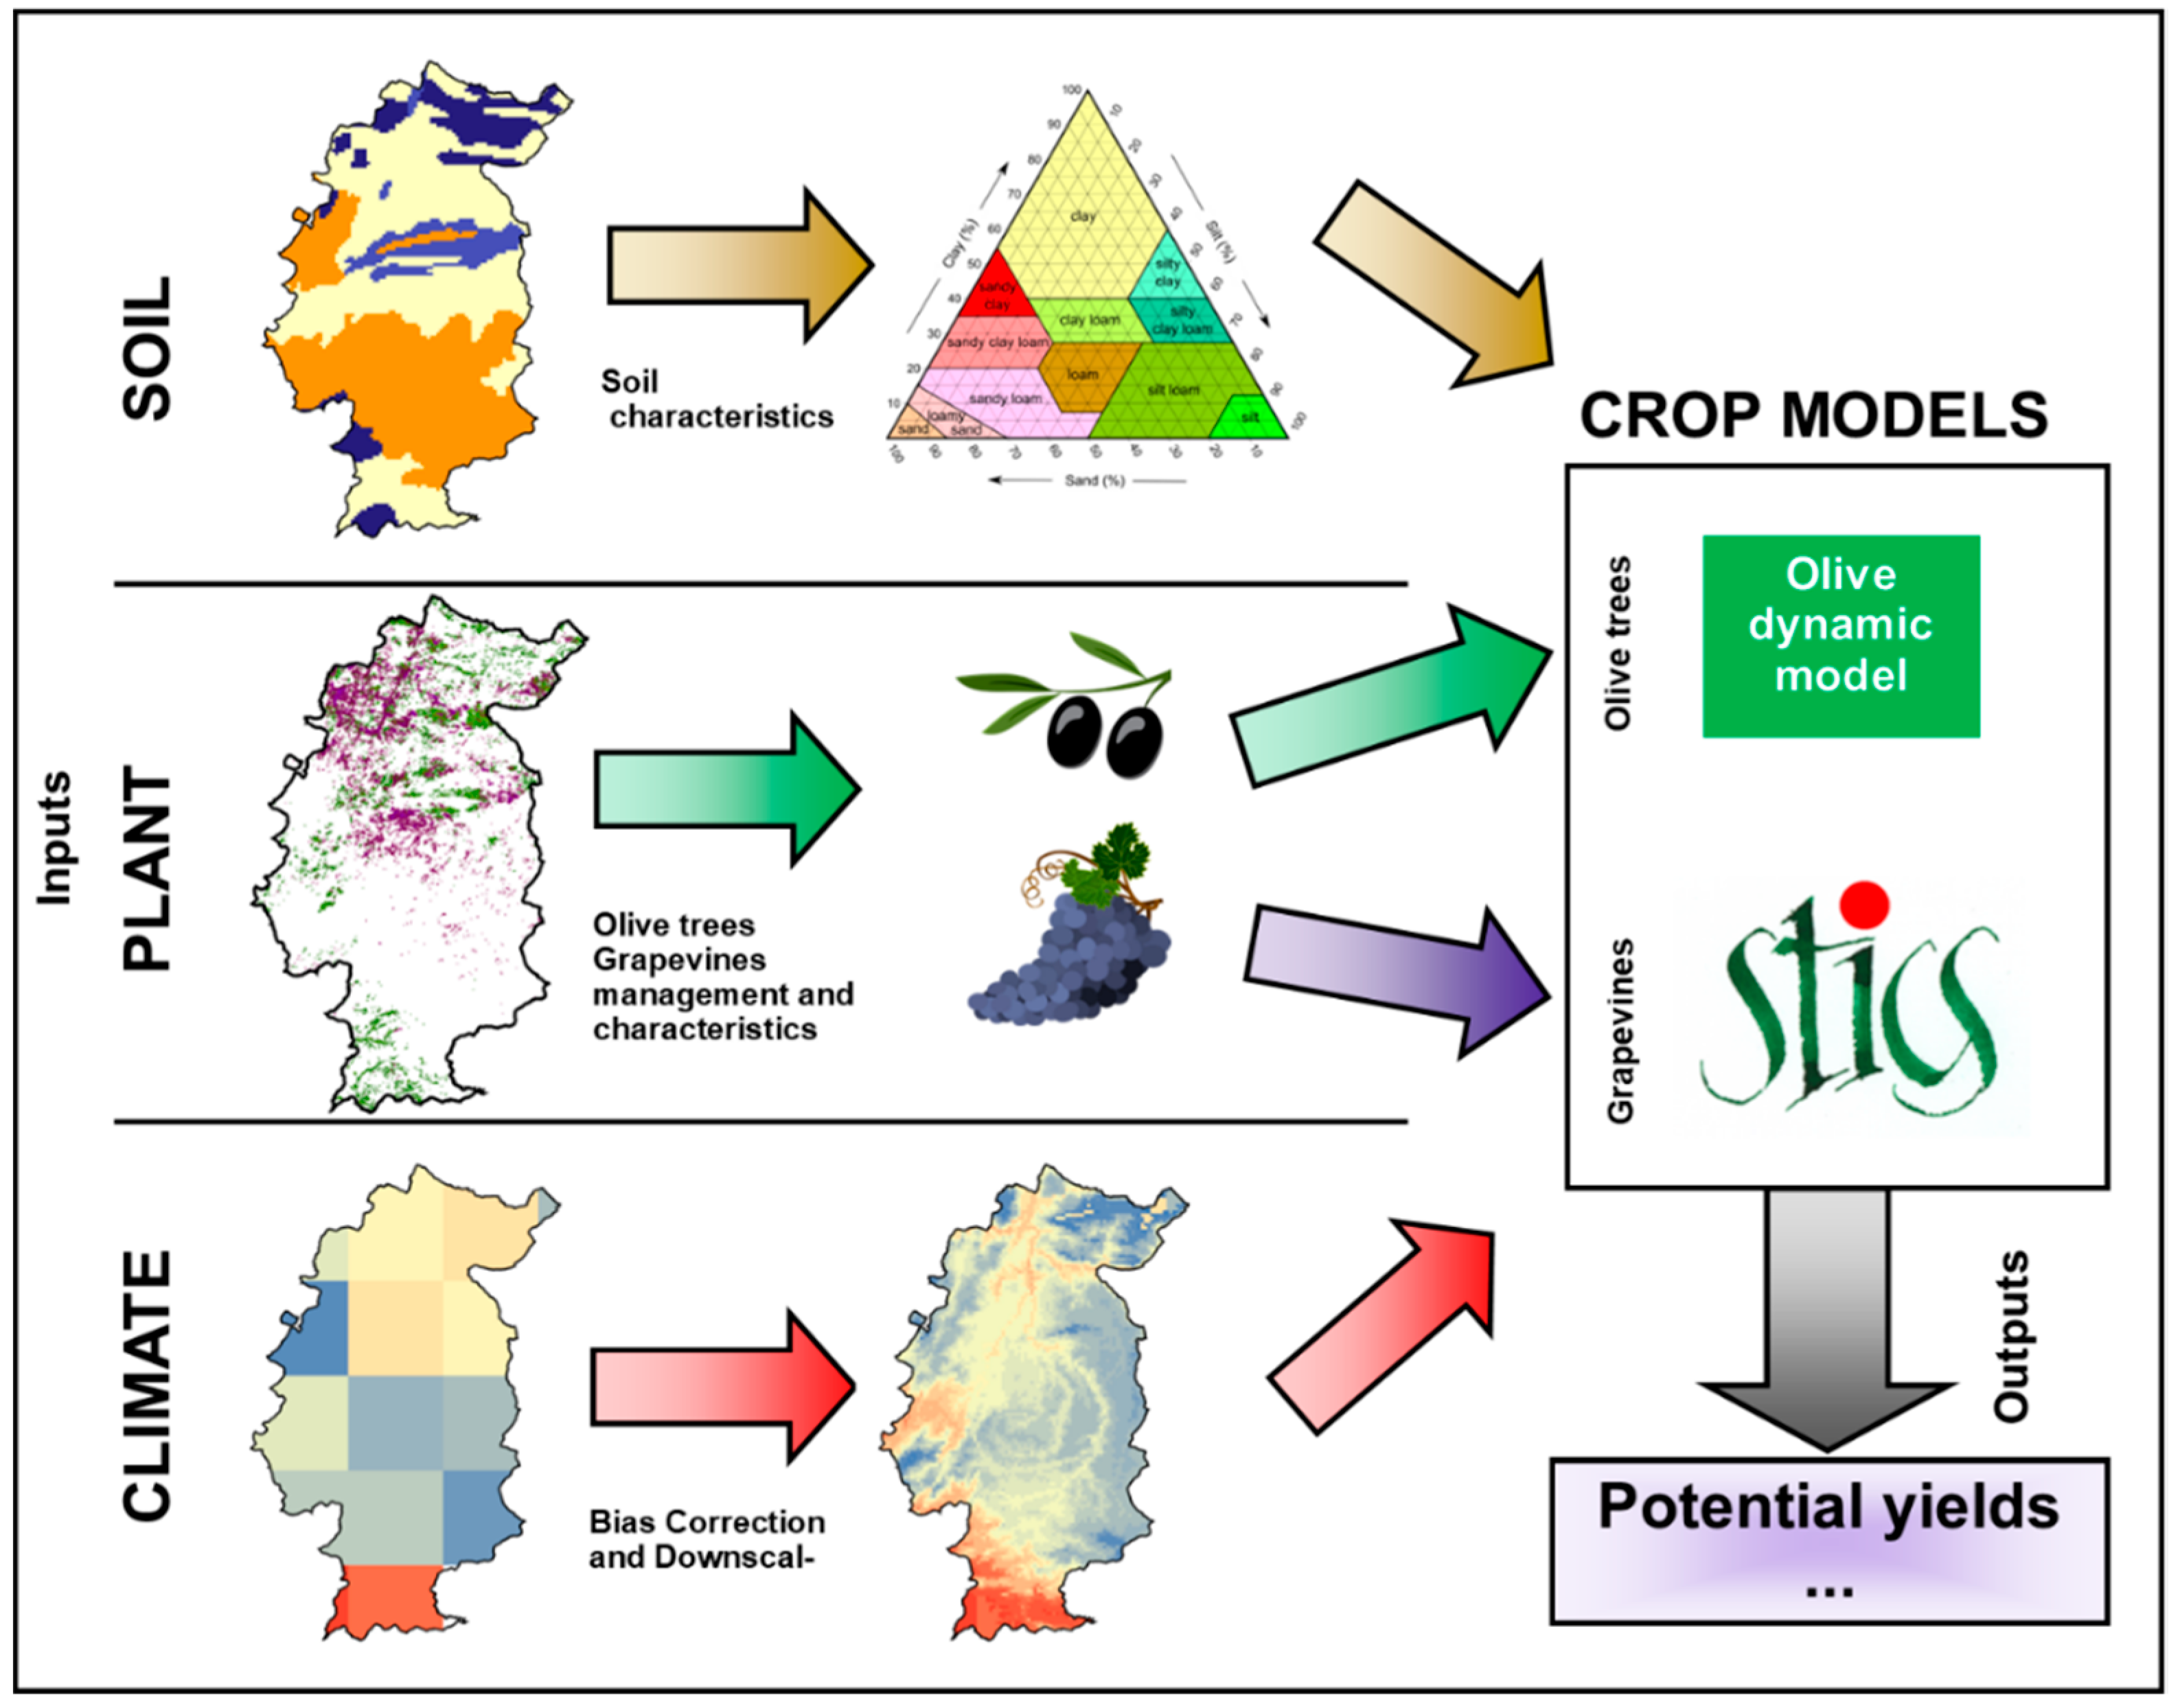
2.2. Crop Models
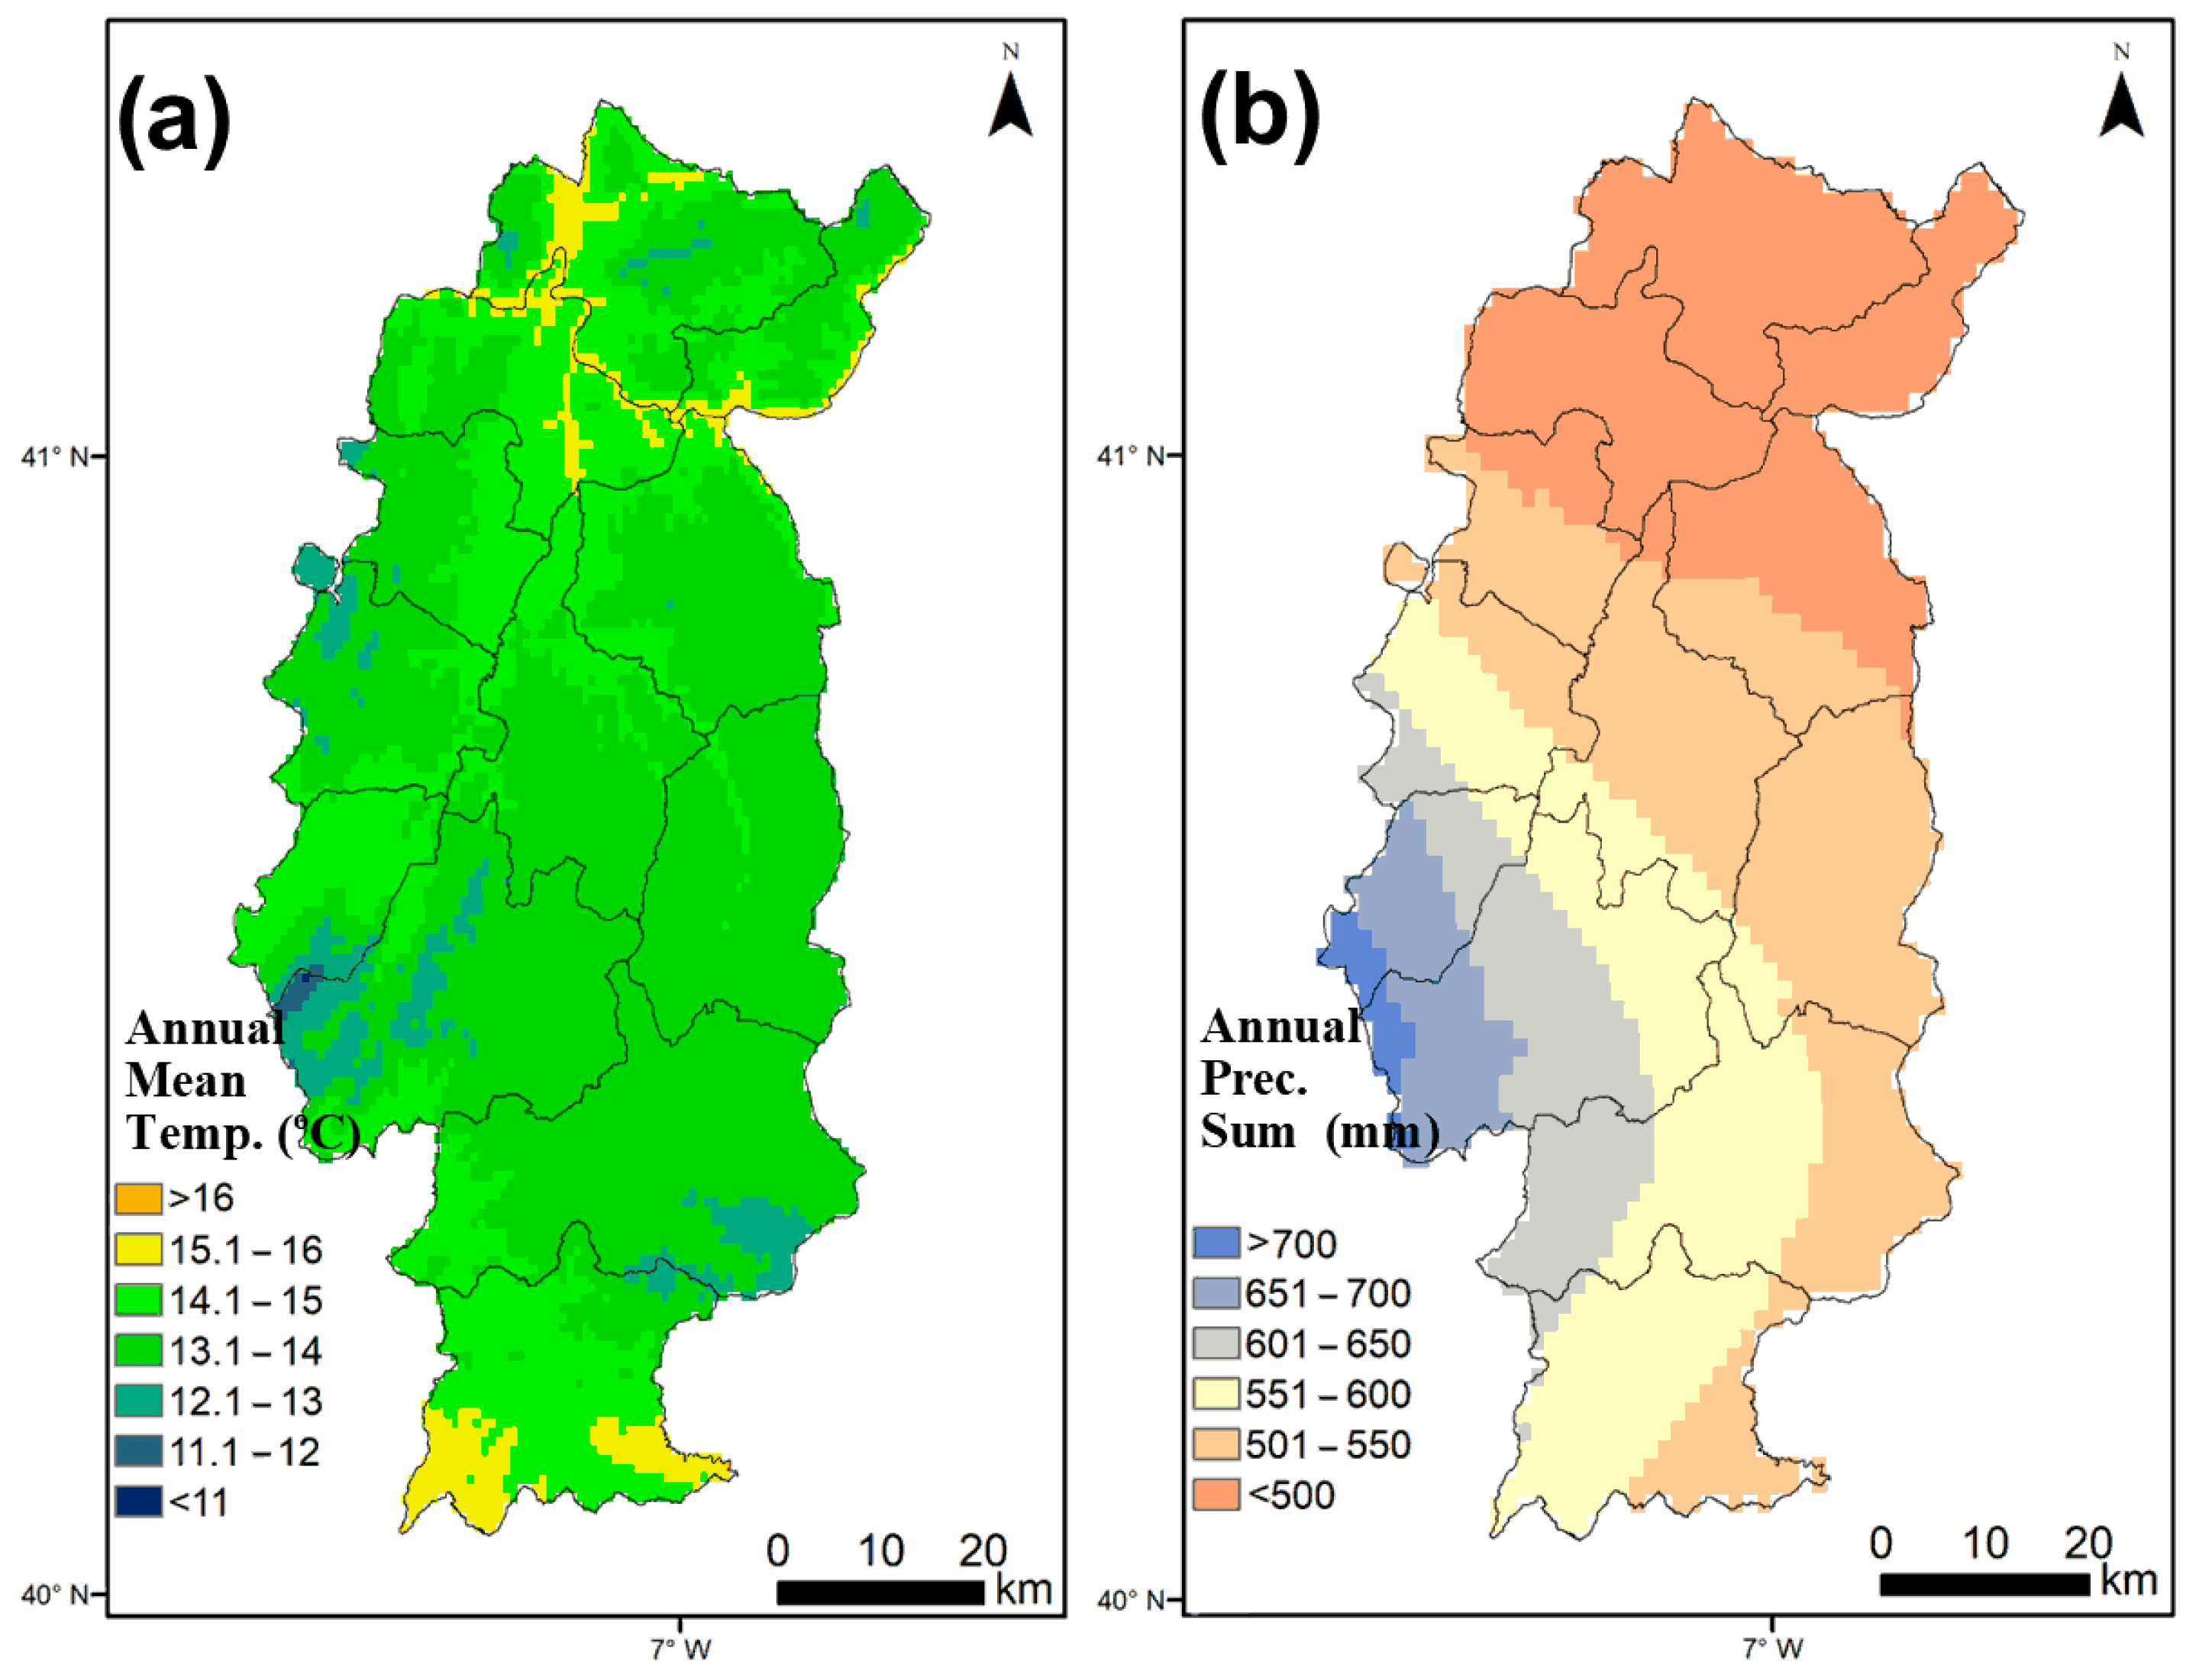
2.3. Climate Data
2.4. Other Datasets
2.5. Model Runs
3. Results
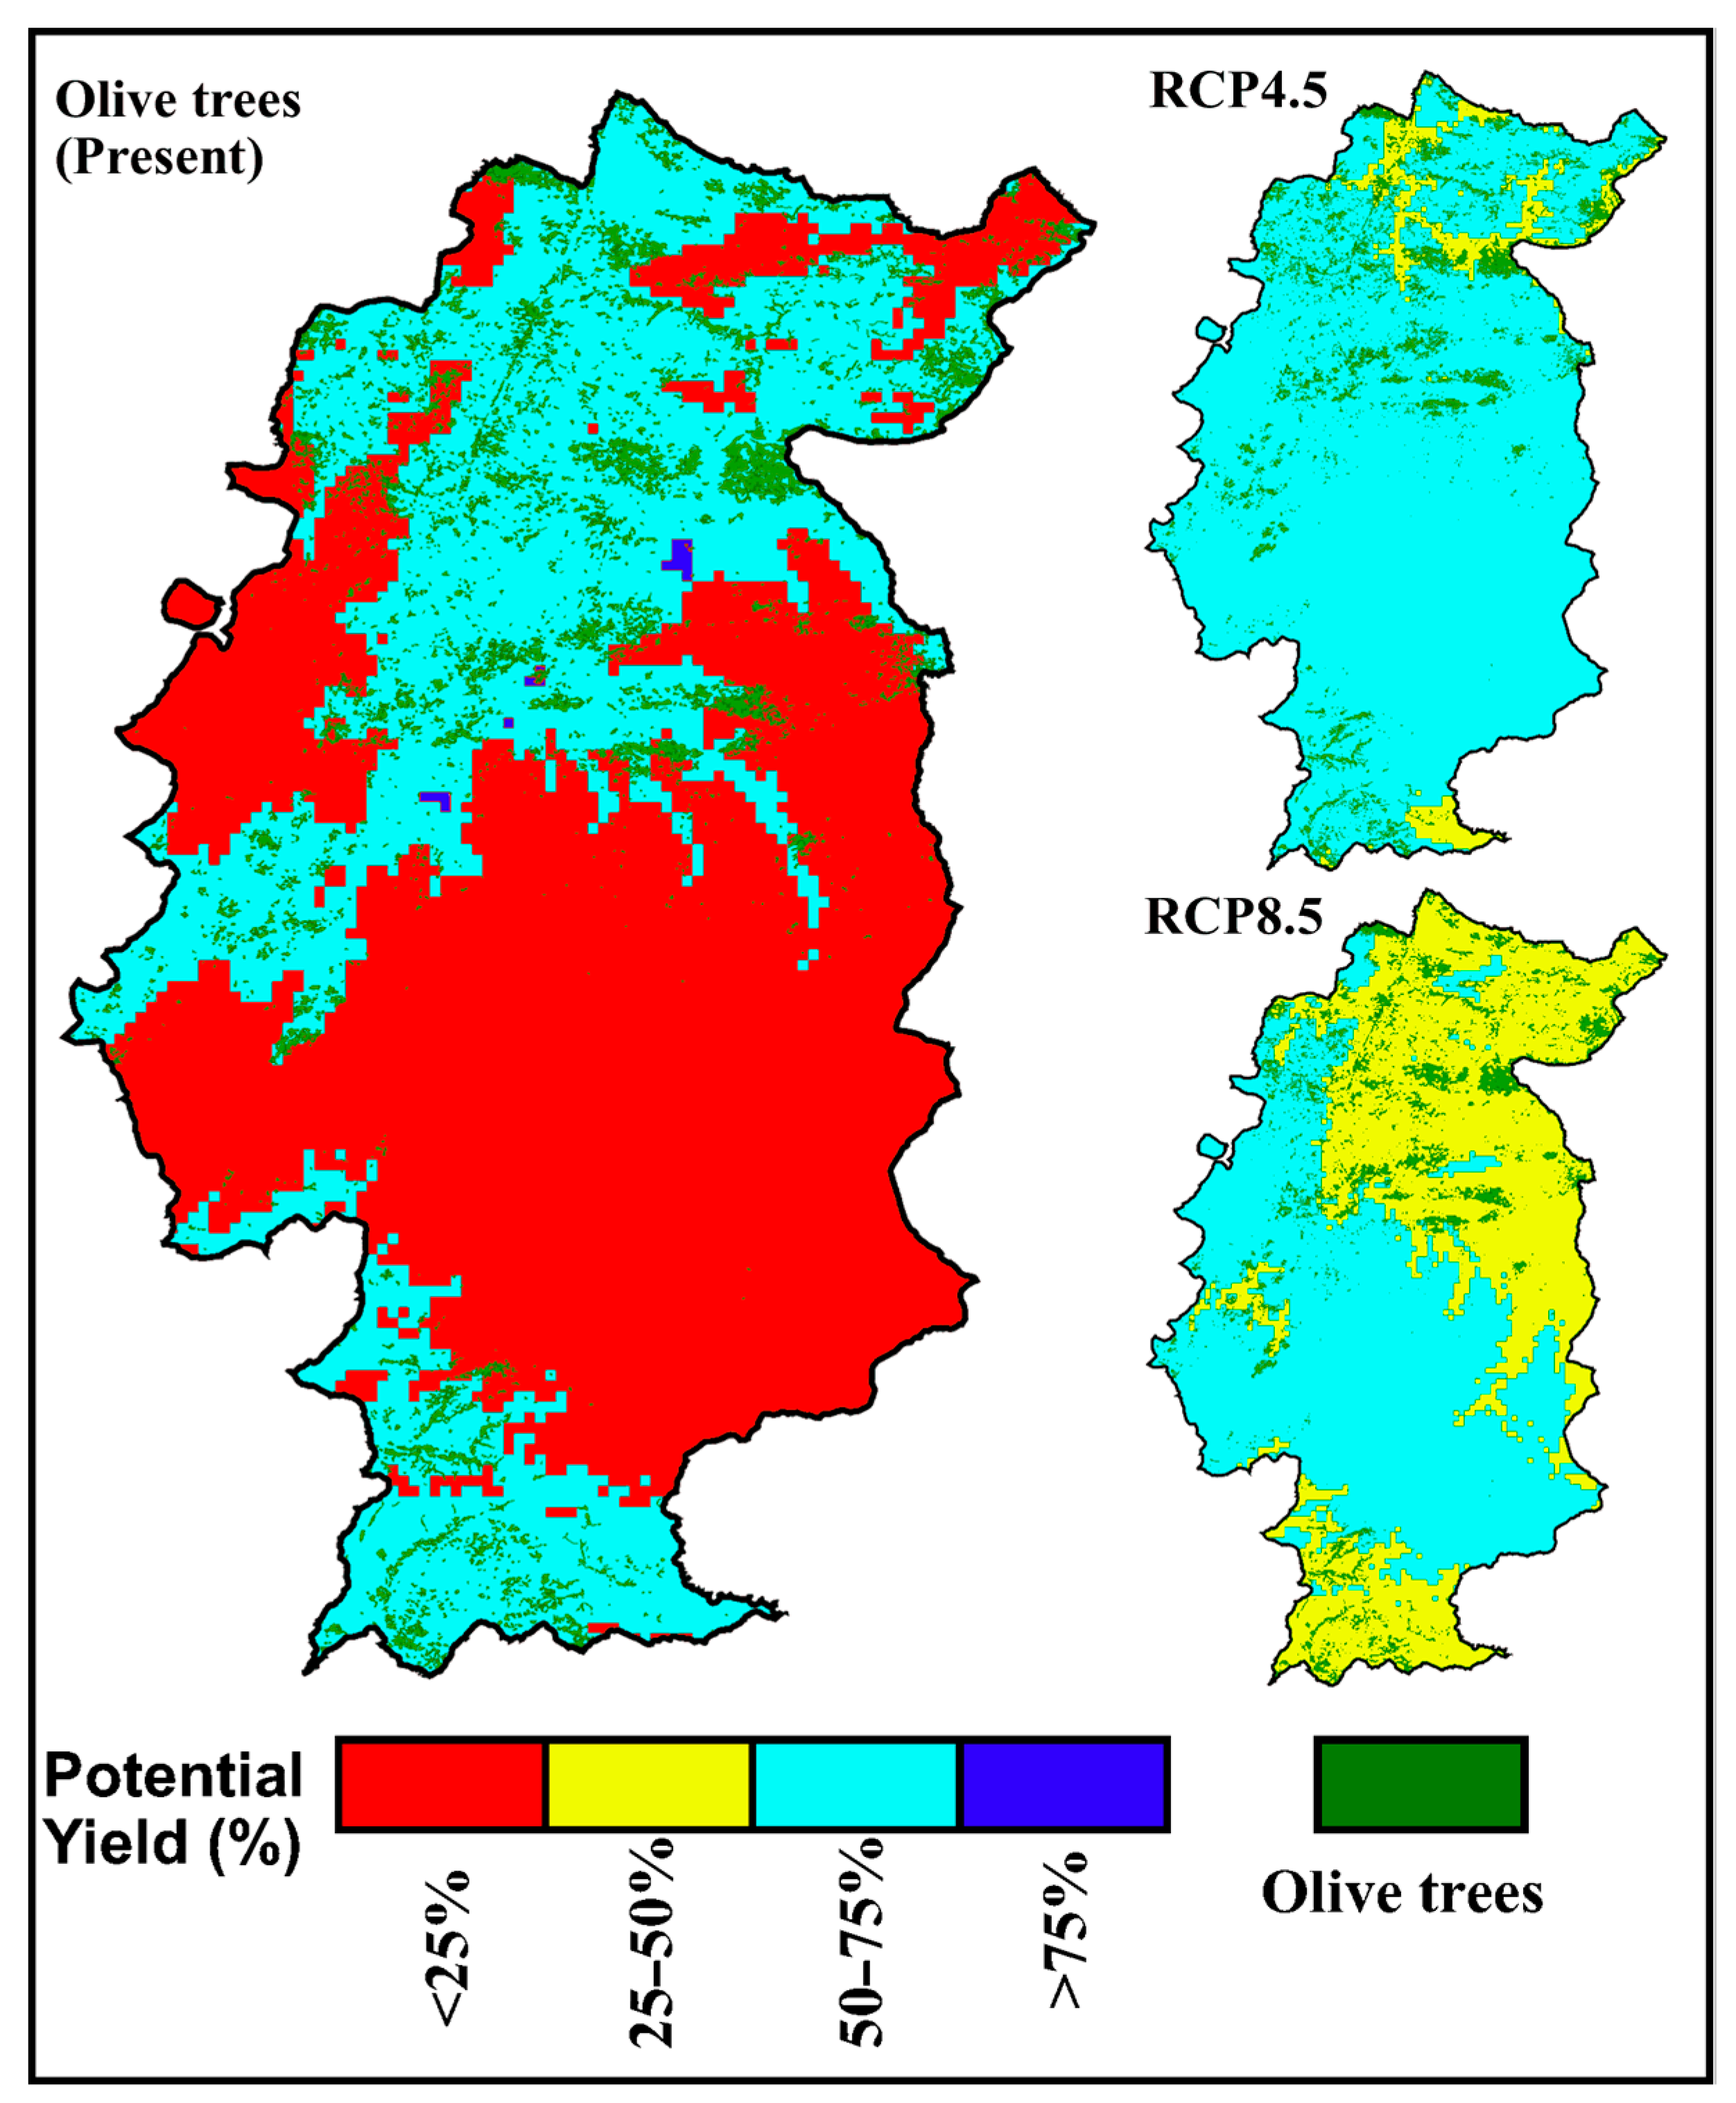
3.1. Results for Olive Trees
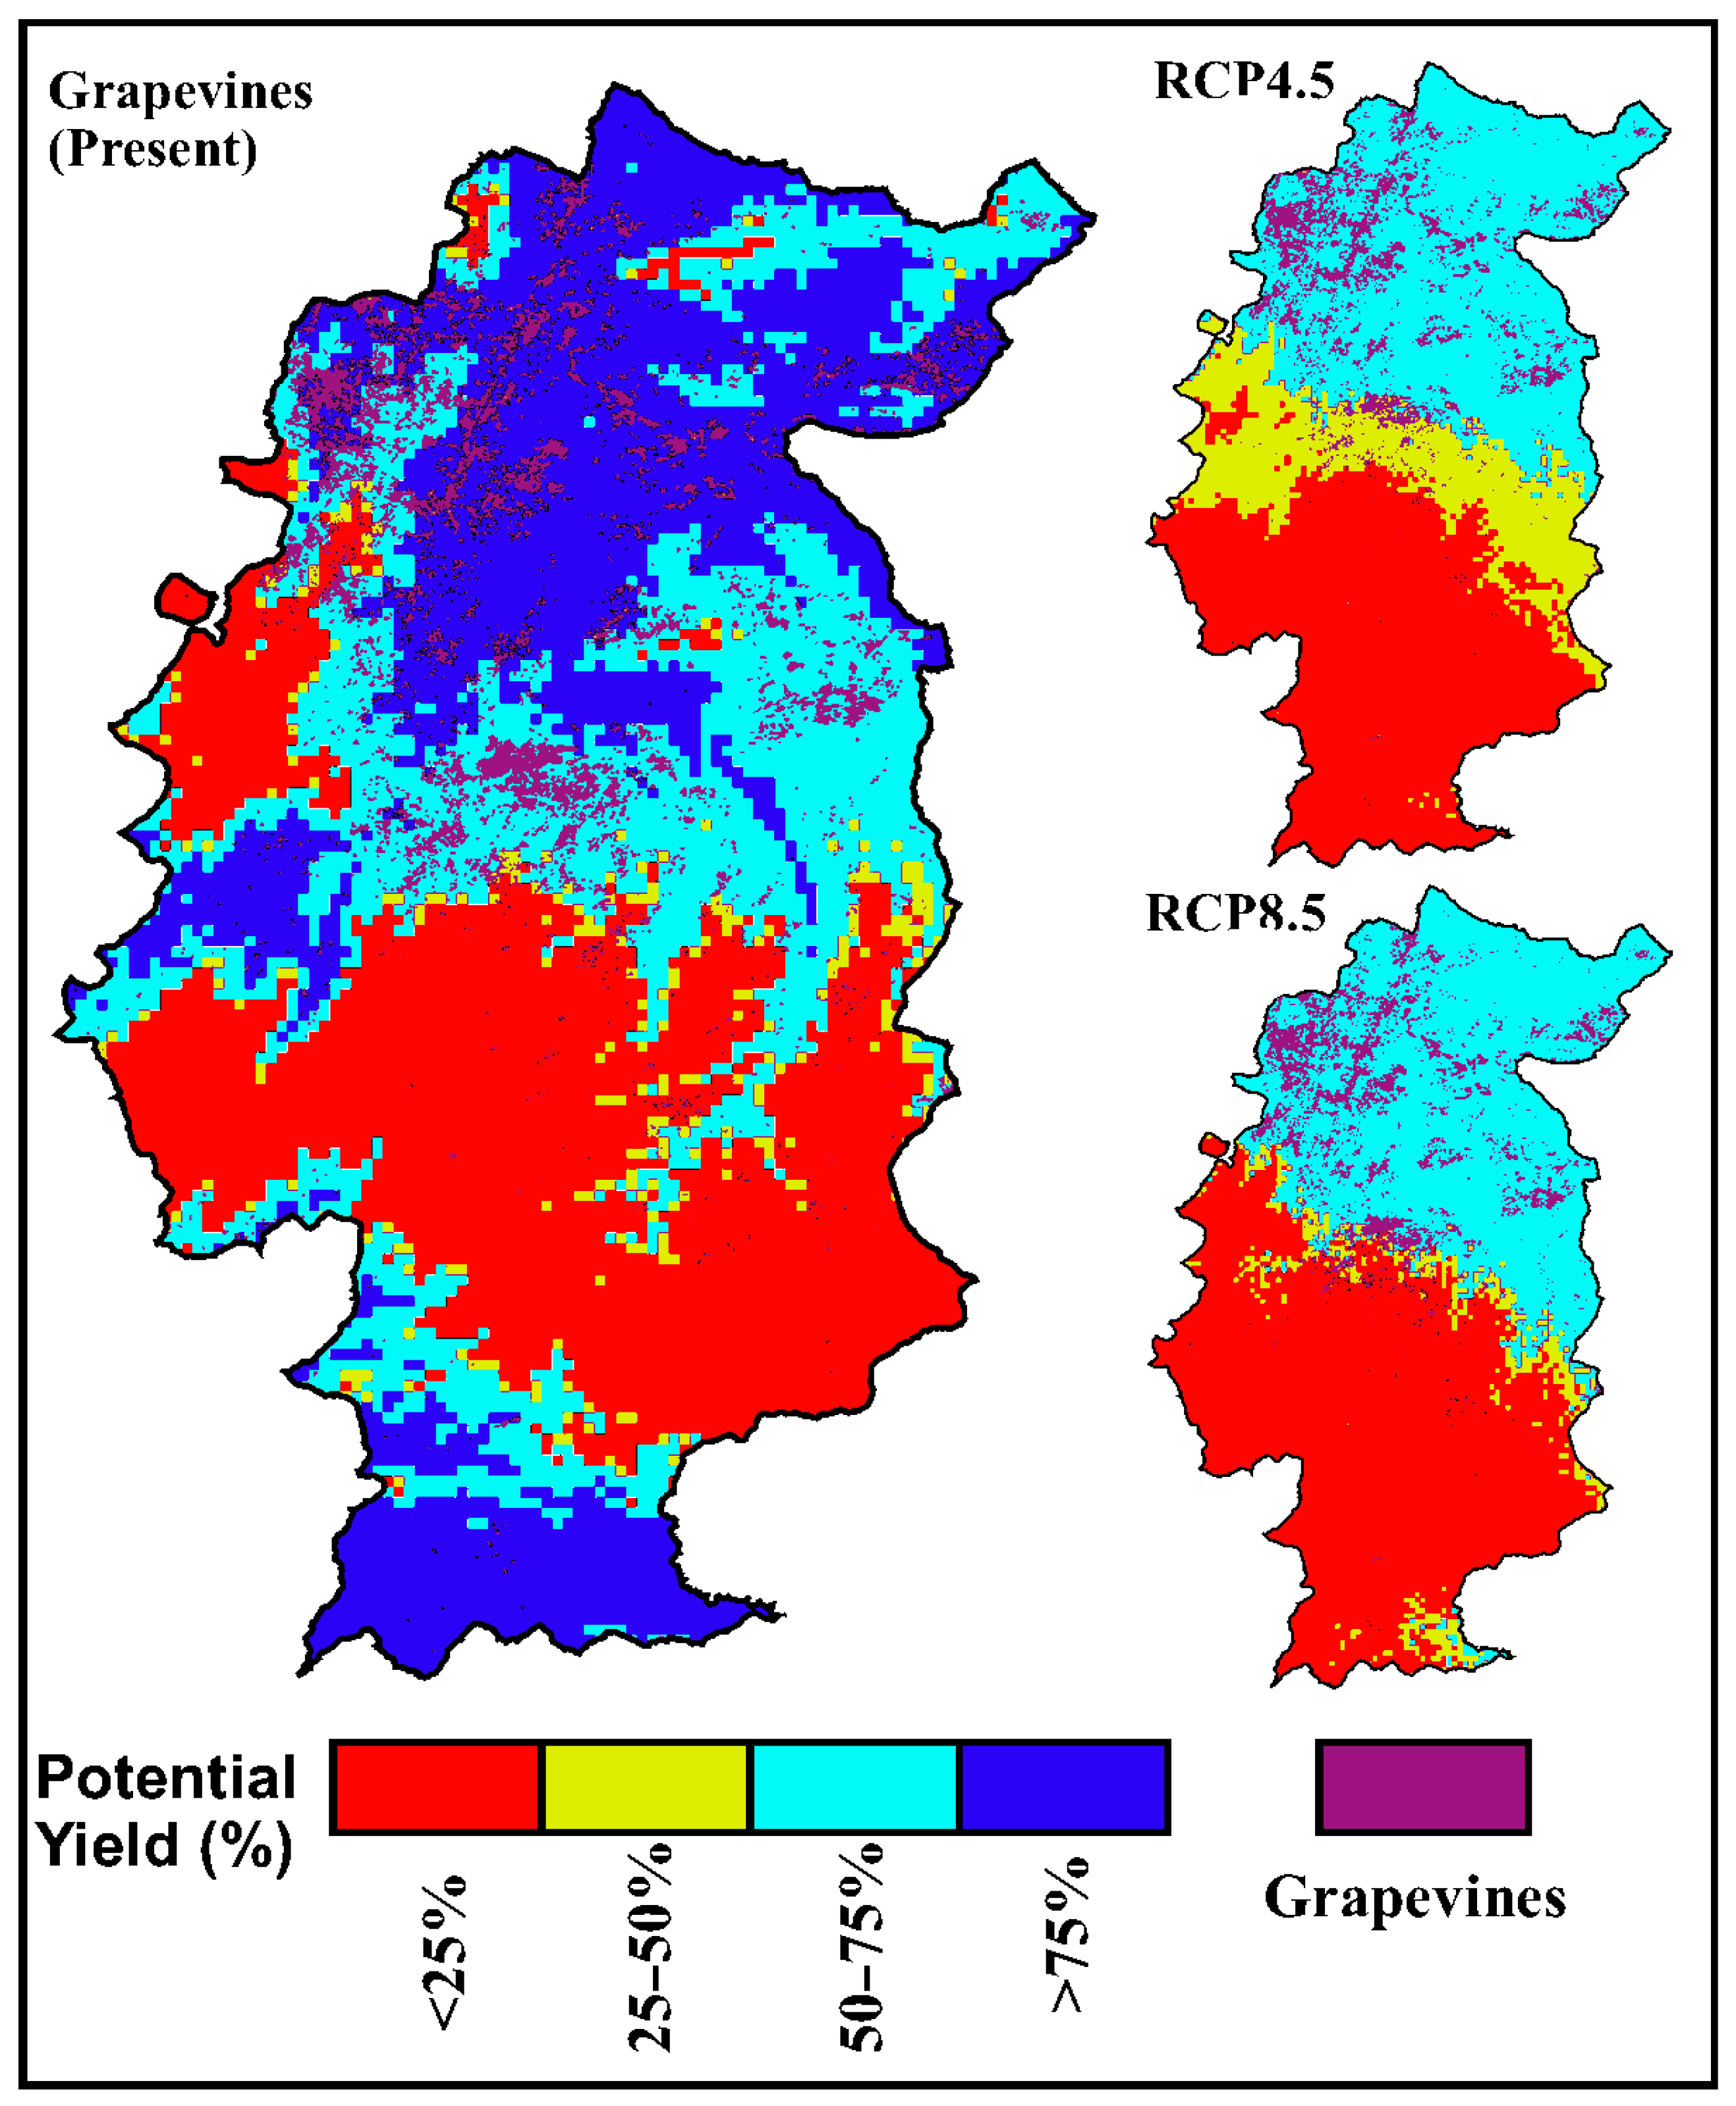
3.2. Results for Grapevines
4. Discussion
Author Contributions
Funding
Data Availability Statement
Conflicts of Interest
References
- Fraga, H.; Pinto, J.G.; Viola, F.; Santos, J.A. Climate change projections for olive yields in the Mediterranean Basin. Int. J. Clim. 2020, 40, 769–781. [Google Scholar] [CrossRef] [Green Version]
- Fraga, H.; Moriondo, M.; Leolini, L.; Santos, J.A. Mediterranean Olive Orchards under Climate Change: A Review of Future Impacts and Adaptation Strategies. Agronomy 2021, 11, 56. [Google Scholar] [CrossRef]
- Leolini, L.; Costafreda-Aumedes, S.; Santos, J.A.; Menz, C.; Fraga, H.; Molitor, D.; Merante, P.; Junk, J.; Kartschall, T.; Destrac-Irvine, A.; et al. Phenological Model Intercomparison for Estimating Grapevine Budbreak Date (Vitis vinifera L.) in Europe. Appl. Sci. 2020, 10, 3800. [Google Scholar] [CrossRef]
- Fraga, H.; Molitor, D.; Leolini, L.; Santos, J.A. What Is the Impact of Heatwaves on European Viticulture? A Modelling Assessment. Appl. Sci. 2020, 10, 3030. [Google Scholar] [CrossRef]
- Yang, C.; Menz, C.; Fraga, H.; Costafreda-Aumedes, S.; Leolini, L.; Ramos, M.C.; Molitor, D.; van Leeuwen, C.; Santos, J.A. Assessing the grapevine crop water stress indicator over the flowering-veraison phase and the potential yield lose rate in important European wine regions. Agric. Water Manag. 2021, 261, 107349. [Google Scholar] [CrossRef]
- IPCC. Climate Change 2013: The Physical Science Basis: Contribution of Working Group I to the Fifth Assessment Report of the Intergovernmental Panel on Climate Change; Stocker, T.F., Qin, D., Plattner, G.-K., Tignor, M., Allen, S.K., Boschung, J., Nauels, A., Xia, Y., Bex, V., Midgley, P.M., Eds.; Cambridge University Press: Cambridge, UK, 2014. [Google Scholar]
- Ponti, L.; Gutierrez, A.P.; Ruti, P.M.; Dell’Aquila, A. Fine-scale ecological and economic assessment of climate change on olive in the Mediterranean Basin reveals winners and losers. Proc. Natl. Acad. Sci. USA 2014, 111, 5598–5603. [Google Scholar] [CrossRef] [Green Version]
- Fraga, H.; Pinto, J.G.; Santos, J.A. Olive tree irrigation as a climate change adaptation measure in Alentejo, Portugal. Agric. Water Manag. 2020, 237, 106193. [Google Scholar] [CrossRef]
- Rickards, L.; Howden, S.M. Transformational adaptation: Agriculture and climate change. Crop Pasture Sci. 2012, 63, 240–250. [Google Scholar] [CrossRef]
- Aryal, J.P.; Sapkota, T.B.; Khurana, R.; Khatri-Chhetri, A.; Rahut, D.B.; Jat, M.L. Climate change and agriculture in South Asia: Adaptation options in smallholder production systems. Environ. Dev. Sustain. 2020, 22, 5045–5075. [Google Scholar] [CrossRef] [Green Version]
- Di Gregorio, M.; Fatorelli, L.; Paavola, J.; Locatelli, B.; Pramova, E.; Nurrochmat, D.R.; May, P.H.; Brockhaus, M.; Sari, I.M.; Kusumadewi, S.D. Multi-level governance and power in climate change policy networks. Glob. Environ. Chang. 2019, 54, 64–77. [Google Scholar] [CrossRef]
- Taylor, M. Climate-smart agriculture: What is it good for? J. Peasant Study 2018, 45, 89–107. [Google Scholar] [CrossRef]
- Paz, J.O.; Fraisse, C.W.; Hatch, L.U.; Garcia, A.Y.G.; Guerra, L.C.; Uryasev, O.; Bellow, J.G.; Jones, J.W.; Hoogenboom, G. Development of an ENSO-based irrigation decision support tool for peanut production in the southeastern US. Comput. Electron. Agric. 2007, 55, 28–35. [Google Scholar] [CrossRef]
- Semenov, M.A.; Doblas-Reyes, F.J. Utility of dynamical seasonal forecasts in predicting crop yield. Clim. Res. 2007, 34, 71–81. [Google Scholar] [CrossRef]
- Challinor, A.J.; Wheeler, T.R. Crop yield reduction in the tropics under climate change: Processes and uncertainties. Agric. For. Meteorol. 2008, 148, 343–356. [Google Scholar] [CrossRef] [Green Version]
- Campbell, B.M.; Vermeulen, S.J.; Aggarwal, P.K.; Corner-Dolloff, C.; Girvetz, E.; Loboguerrero, A.M.; Ramirez-Villegas, J.; Rosenstock, T.; Sebastian, L.; Thornton, P.K.; et al. Reducing risks to food security from climate change. Glob. Food Secur.-Agric. Policy Econ. Environ. 2016, 11, 34–43. [Google Scholar] [CrossRef] [Green Version]
- Rosenzweig, C.; Elliott, J.; Deryng, D.; Ruane, A.C.; Muller, C.; Arneth, A.; Boote, K.J.; Folberth, C.; Glotter, M.; Khabarov, N.; et al. Assessing agricultural risks of climate change in the 21st century in a global gridded crop model intercomparison. Proc. Natl. Acad. Sci. USA 2014, 111, 3268–3273. [Google Scholar] [CrossRef] [PubMed] [Green Version]
- van Ittersum, M.K.; Cassman, K.G.; Grassini, P.; Wolf, J.; Tittonell, P.; Hochman, Z. Yield gap analysis with local to global relevance-A review. Field Crops Res. 2013, 143, 4–17. [Google Scholar] [CrossRef] [Green Version]
- Olesen, J.E.; Trnka, M.; Kersebaum, K.C.; Skjelvåg, A.O.; Seguin, B.; Peltonen-Sainio, P.; Rossi, F.; Kozyra, J.; Micale, F. Impacts and adaptation of European crop production systems to climate change. Eur. J. Agron. 2011, 34, 96–112. [Google Scholar] [CrossRef]
- Moriondo, M.; Ferrise, R.; Trombi, G.; Brilli, L.; Dibari, C.; Bindi, M. Modelling olive trees and grapevines in a changing climate. Environ. Model. Softw. 2015, 72, 387–401. [Google Scholar] [CrossRef]
- Orlandi, F.; Avolio, E.; Bonofiglio, T.; Federico, S.; Romano, B.; Fornaciari, M. Potential shifts in olive flowering according to climate variations in Southern Italy. Met. Appl. 2012, 20, 497–503. [Google Scholar] [CrossRef]
- Quiroga, S.; Iglesias, A. A comparison of the climate risks of cereal, citrus, grapevine and olive production in Spain. Agric. Syst. 2009, 101, 91–100. [Google Scholar] [CrossRef]
- Moriondo, M.; Orlandini, S.; Nuntiis, P.D.; Mandrioli, P. Effect of agrometeorological parameters on the phenology of pollen emission and production of olive trees (Olea europea L.). Aerobiologia 2001, 17, 225–232. [Google Scholar] [CrossRef]
- Garcia-Mozo, H.; Orlandi, F.; Galan, C.; Fornaciari, M.; Romano, B.; Ruiz, L.; Diaz de la Guardia, C.; Trigo, M.M.; Chuine, I. Olive flowering phenology variation between different cultivars in Spain and Italy: Modeling analysis. Theor. Appl. Clim. 2008, 95, 385–395. [Google Scholar] [CrossRef]
- Oteros, J.; Orlandi, F.; García-Mozo, H.; Aguilera, F.; Dhiab, A.B.; Bonofiglio, T.; Abichou, M.; Ruiz-Valenzuela, L.; del Trigo, M.M.; Díaz de la Guardia, C.; et al. Better prediction of Mediterranean olive production using pollen-based models. Agron. Sustain. Dev. 2014, 34, 685–694. [Google Scholar] [CrossRef] [Green Version]
- Aguilera, F.; Dhiab, A.B.; Msallem, M.; Orlandi, F.; Bonofiglio, T.; Ruiz-Valenzuela, L.; Galán, C.; Díaz-de la Guardia, C.; Giannelli, A.; del Mar Trigo, M.; et al. Airborne-pollen maps for olive-growing areas throughout the Mediterranean region: Spatio-temporal interpretation. Aerobiologia 2015, 31, 421–434. [Google Scholar] [CrossRef]
- Cesaraccio, C.; Spano, D.; Snyder, R.L.; Duce, P. Chilling and forcing model to predict bud-burst of crop and forest species. Agric. For. Meteorol. 2004, 126, 1–13. [Google Scholar] [CrossRef]
- De Melo-Abreu, J.P.; Barranco, D.; Cordeiro, A.M.; Tous, J.; Rogado, B.M.; Villalobos, F.J. Modelling olive flowering date using chilling for dormancy release and thermal time. Agric. For. Meteorol. 2004, 125, 117–127. [Google Scholar] [CrossRef]
- Moriondo, M.; Leolini, L.; Brilli, L.; Dibari, C.; Tognetti, R.; Giovannelli, A.; Rapi, B.; Battista, P.; Caruso, G.; Gucci, R.; et al. A simple model simulating development and growth of an olive grove. Eur. J. Agron. 2019, 105, 129–145. [Google Scholar] [CrossRef]
- Maselli, F.; Chiesi, M.; Brilli, L.; Moriondo, M. Simulation of olive fruit yield in Tuscany through the integration of remote sensing and ground data. Ecol. Model. 2012, 244, 1–12. [Google Scholar] [CrossRef]
- Villaobos, F.J.; Testi, L.; Hidalgo, J.; Pastor, M.; Orgaz, F. Modelling potential growth and yield of olive (Olea europaea L.) canopies. Eur. J. Agron. 2006, 24, 296–303. [Google Scholar] [CrossRef]
- Viola, F.; Noto, L.V.; Cannarozzo, M.; La Loggia, G.; Porporato, A. Olive yield as a function of soil moisture dynamics. Ecohydrology 2012, 5, 99–107. [Google Scholar] [CrossRef]
- Gu, S. Growing degree hours—A simple, accurate, and precise protocol to approximate growing heat summation for grapevines. Int. J. Biometeorol. 2016, 60, 1123–1134. [Google Scholar] [CrossRef] [PubMed]
- Coucheney, E.; Buis, S.; Launay, M.; Constantin, J.; Mary, B.; García de Cortázar-Atauri, I.; Ripoche, D.; Beaudoin, N.; Ruget, F.; Andrianarisoa, K.S.; et al. Accuracy, robustness and behavior of the STICS soil–crop model for plant, water and nitrogen outputs: Evaluation over a wide range of agro-environmental conditions in France. Environ. Model. Softw. 2015, 64, 177–190. [Google Scholar] [CrossRef]
- Valade, A.; Vuichard, N.; Ciais, P.; Ruget, F.; Viovy, N.; Gabrielle, B.; Huth, N.; Martine, J.F. ORCHIDEE-STICS, a process-based model of sugarcane biomass production: Calibration of model parameters governing phenology. Gcb Bioenergy 2014, 6, 606–620. [Google Scholar] [CrossRef] [Green Version]
- Cola, G.; Mariani, L.; Salinari, F.; Civardi, S.; Bernizzoni, F.; Gatti, M.; Poni, S. Description and testing of a weather-based model for predicting phenology, canopy development and source–sink balance in Vitis vinifera L. cv. Barbera. Agric. For. Meteorol. 2014, 184, 117–136. [Google Scholar] [CrossRef]
- IPCC. Climate Change 2001: Synthesis Report. A Contribution of Working Groups I, II, III to the Third Assessment Report of the Intergovernmental Panel on Climate Change; Watson, R.T., The Core Team, Eds.; Cambridge University Press: Cambridge, UK, 2001; p. 398. [Google Scholar]
- Hersbach, H.; Bell, B.; Berrisford, P.; Hirahara, S.; Horanyi, A.; Munoz-Sabater, J.; Nicolas, J.; Peubey, C.; Radu, R.; Schepers, D.; et al. The ERA5 global reanalysis. Q. J. R. Meteorol. Soc. 2020, 146, 1999–2049. [Google Scholar] [CrossRef]
- Pekel, J.F.; Cottam, A.; Gorelick, N.; Belward, A.S. High-resolution mapping of global surface water and its long-term changes. Nature 2016, 540, 418–422. [Google Scholar] [CrossRef]
- Jacob, D.; Petersen, J.; Eggert, B.; Alias, A.; Christensen, O.B.; Bouwer, L.M.; Braun, A.; Colette, A.; Deque, M.; Georgievski, G.; et al. EURO-CORDEX: New high-resolution climate change projections for European impact research. Reg. Environ. Chang. 2014, 14, 563–578. [Google Scholar] [CrossRef]
- Compo, G.P.; Whitaker, J.S.; Sardeshmukh, P.D.; Matsui, N.; Allan, R.J.; Yin, X.; Gleason, B.E.; Vose, R.S.; Rutledge, G.; Bessemoulin, P.; et al. The Twentieth Century Reanalysis Project. Q. J. R. Meteorol. Soc. 2011, 137, 776. [Google Scholar] [CrossRef]
- Hall, A.; Jones, G.V. Spatial analysis of climate in winegrape-growing regions in Australia. Aust. J. Grape Wine Res. 2010, 16, 389–404. [Google Scholar] [CrossRef]
- Anderson, J.D.; Jones, G.V.; Tait, A.; Hall, A.; Trought, M.C.T. Analysis of Viticulture Region Climate Structure and Suitability in New Zealand. OENO One 2012, 46, 149–165. [Google Scholar] [CrossRef] [Green Version]
- Jones, G.V.; Duff, A.A.; Hall, A.; Myers, J.W. Spatial Analysis of Climate in Winegrape Growing Regions in the Western United States. Am. J. Enol. Vitic. 2010, 61, 313–326. [Google Scholar]
- COS. Carta de Uso e Ocupação do Solo. 2018. Available online: https://dados.gov.pt/pt/datasets/carta-de-uso-e-ocupacao-do-solo-cos-2018-rdf-projeto-cross-forest-land-use-land-cover-map-cos-2018-rdf-cross-forest-project/ (accessed on 15 November 2021).
- Yang, C.; Menz, C.; Fraga, H.; Reis, S.; Machado, N.; Malheiro, A.C.; Santos, J.A. Simultaneous Calibration of Grapevine Phenology and Yield with a Soil–Plant–Atmosphere System Model Using the Frequentist Method. Agronomy 2021, 11, 1659. [Google Scholar] [CrossRef]
- Orlandi, F.; Garcia-Mozo, H.; Dhiab, A.B.; Galán, C.; Msallem, M.; Romano, B.; Abichou, M.; Dominguez-Vilches, E.; Fornaciari, M. Climatic indices in the interpretation of the phenological phases of the olive in mediterranean areas during its biological cycle. Clim. Chang. 2013, 116, 263–284. [Google Scholar] [CrossRef]
- Brisson, N.; Launay, M.; Mary, B.; Beaudoin, N. Conceptual Basis, Formalisations and Parameterization of the STICS Crop Model; Editions Quae: Versailles, France, 2008; p. 297. [Google Scholar]
- García de Cortazar-Atauri, I. Adaptation du Modèle STICS à la Vigne (Vitis vinifera L.). Utilisation Dans le Cadre D’une Étude D’impact du Changement Climatique à L’échelle de la France. Ph.D. Thesis, SupAgro, Montpellier, France, 2006. [Google Scholar]
- Fraga, H.; Costa, R.; Moutinho-Pereira, J.; Correia, C.M.; Dinis, L.-T.; Gonçalves, I.; Silvestre, J.; Eiras-Dias, J.; Malheiro, A.C.; Santos, J.A. Modeling Phenology, Water Status, and Yield Components of Three Portuguese Grapevines Using the STICS Crop Model. Am. J. Enol. Vitic. 2015, 66, 482–491. [Google Scholar] [CrossRef]
- Valdes-Gomez, H.; Celette, F.; García de Cortazar-Atauri, I.; Jara-Rojas, F.; Ortega-Farias, S.; Gary, C. Modelling Soil Water Content and Grapevine Growth and Development with the Stics Crop-Soil Model under Two Different Water Management Strategies. OENO One 2009, 43, 13–28. [Google Scholar] [CrossRef] [Green Version]
- Courault, D.; Ruget, F. Impact of local climate variability on crop model estimates in the south-east of France. Clim. Res. 2001, 18, 195–204. [Google Scholar] [CrossRef] [Green Version]
- Gonzalez-Camacho, J.M.; Mailhol, J.C.; Ruget, F. Local impact of increasing Co2 in the atmosphere on maize crop water productivity in the Drome valley, France. Irrig. Drain. 2008, 57, 229–243. [Google Scholar] [CrossRef] [Green Version]
- Brisson, N.; Levrault, F. Climate change, agriculture and forests in France: Simulations of the impacts on the main species. In The Green Book of the CLIMATOR Project (2007–2010); Green Book Climator ADEME: Angers, France, 2010. [Google Scholar]
- Fick, S.E.; Hijmans, R.J. WorldClim 2: New 1-km spatial resolution climate surfaces for global land areas. Int. J. Clim. 2017, 37, 4302–4315. [Google Scholar] [CrossRef]
- Cofiño, A.S.; Bedia, J.; Iturbide, M.; Vega, M.; Herrera, S.; Fernández, J.; Frías, M.D.; Manzanas, R.; Gutiérrez, J.M. The ECOMS User Data Gateway: Towards seasonal forecast data provision and research reproducibility in the era of Climate Services. Clim. Serv. 2018, 9, 33–43. [Google Scholar] [CrossRef]
- FAO/IIASA/ISRIC/ISSCAS/JRC. Harmonized World Soil Database (Version 1.2); FAO: Rome, Italy; IIASA: Luxemburg, Austria, 2012. [Google Scholar]
- Beven, K. Linking parameters across scales: Subgrid parameterizations and scale dependent hydrological models. Hydrol. Process. 1995, 9, 507–525. [Google Scholar] [CrossRef]
- Ringrose-Voase, A.; Young, R.; Paydar, Z.; Huth, N.; Bernardi, A.; Cresswell, H.; Keating, B.A.; Scott, J.; Stauffacher, M.; Banks, R. Deep Drainage under Different Land Uses in the Liverpool Plains Catchment; NSW Agriculture: Camberra, Australia, 2003. [Google Scholar]
- Chapman, D.C.; Lake, D.W. Computing Runoff. In New York Standards and Specifications for Erosion and Sediment Control; Springer: Boston, MA, USA, 2003; p. 406. [Google Scholar]
- Ritchie, J.T. A User-Orientated Model of the Soil Water Balance in Wheat. In Wheat Growth and Modelling; Day, W., Atkin, R.K., Eds.; New York State Soil and Water Conservation Committee: New York, NY, USA, 1985; Volume 86, pp. 293–305. [Google Scholar]
- Jamagne, M.; Bétrémieux, R.; Bégon, J.C.; Mori, A. Quelques données sur la variabilité dans le milieu naturel de la réserve en eau des sols. Bull. Technol. Inf. 1977, 324–325, 627–641. [Google Scholar]
- Brito, C.; Dinis, L.T.; Moutinho-Pereira, J.; Correia, C.M. Drought Stress Effects and Olive Tree Acclimation under a Changing Climate. Plants 2019, 8, 232. [Google Scholar] [CrossRef] [PubMed] [Green Version]
- Moriana, A.; Orgaz, F.; Pastor, M.; Fereres, E. Yield responses of a mature olive orchard to water deficits. J. Am. Soc. Hortic. Sci. 2003, 128, 425–431. [Google Scholar] [CrossRef]
- Ferreira, M.I.; Green, S.; Conceicao, N.; Fernandez, J.E. Assessing hydraulic redistribution with the compensated average gradient heat-pulse method on rain-fed olive trees. Plant Soil 2018, 425, 21–41. [Google Scholar] [CrossRef]
- Gambetta, G.A.; Herrera, J.C.; Dayer, S.; Feng, Q.S.; Hochberg, U.; Castellarin, S.D. The physiology of drought stress in grapevine: Towards an integrative definition of drought tolerance. J. Exp. Bot. 2020, 71, 4658–4676. [Google Scholar] [CrossRef]
- Chaves, M.M.; Santos, T.P.; Souza, C.R.; Ortuno, M.F.; Rodrigues, M.L.; Lopes, C.M.; Maroco, J.P.; Pereira, J.S. Deficit irrigation in grapevine improves water-use efficiency while controlling vigour and production quality. Ann. Appl. Biol. 2007, 150, 237–252. [Google Scholar] [CrossRef]
- Dinis, L.T.; Malheiro, A.C.; Luzio, A.; Fraga, H.; Ferreira, H.; Gonçalves, I.; Pinto, G.; Correia, C.M.; Moutinho-Pereira, J. Improvement of grapevine physiology and yield under summer stress by kaolin-foliar application: Water relations, photosynthesis and oxidative damage. Photosynthetica 2018, 56, 641–651. [Google Scholar] [CrossRef]
- Bahar, E.; Yasasin, A.S. The yield and berry quality under different soil tillage and clusters thinning treatments in grape (Vitis vinifera L.) cv. Cabernet-Sauvignon. Afr. J. Agric. Res. 2010, 5, 2986–2993. [Google Scholar]
- Fraga, H.; Santos, J.A. Vineyard mulching as a climate change adaptation measure: Future simulations for Alentejo, Portugal. Agric. Syst. 2018, 164, 107–115. [Google Scholar] [CrossRef]
- Fraga, H.; Santos, J.A.; Malheiro, A.C.; Moutinho-Pereira, J. Climate Change Projections for the Portuguese Viticulture Using a Multi-Model Ensemble. Ciênc. Téc. Vitiv. 2012, 27, 39–48. [Google Scholar]
- Santos, J.A.; Costa, R.; Fraga, H. New insights into thermal growing conditions of Portuguese grapevine varieties under changing climates. Theor. Appl. Clim. 2018. [Google Scholar] [CrossRef]
- Fraga, H.; Costa, R.; Santos, J.A. Multivariate Clustering of Viticultural Terroirs in the Douro Winemaking Region. Ciênc. Téc. Vitiv. 2017, 32, 142–153. [Google Scholar] [CrossRef] [Green Version]


| GCM-RCM | Institutions |
|---|---|
| CNRM-CERFACS-SMHI-RCA4 | Centre National de Recherches Météorologiques |
| IPSL-CM5A-MR-SMHI-RCA4 | Institut Pierre Simon Laplace |
| MOHC-HadGEM2-SMHI-RCA4 | Met Office Hadley Centre |
| MPI-M-MPI-SMHI-RCA4 | Max Planck Institute |
| Parameter | Calculation |
|---|---|
| Clay content in the surface layer (%) | HWSD |
| Limestone content in the surface (%) | HWSD |
| Soil pH | HWSD |
| Albedo of the dry soil | [58] |
| Cumulative evaporation limit (mm) | [59] |
| Fraction of runoff in soil | [60] |
| Dominant soil unit (FAO) | HWSD |
| Permeability classes | [61,62] |
| Texture class | HWSD |
| USDA Texture | HWSD |
| Mean slope (%) | GTOPO30 |
| Orientation | GTOPO30 |
| Initial soil water content | set at field capacity |
| Soil organic N | 6% dry soil |
| Maximum unimpeded root depth | 2.0 m |
| Olive canopy cover fraction | 0.4 |
| Olive tree LAI | 1.4 m2·m−2 |
| Vine density | 4000 vines/ha |
| Vine trellis system | Bilateral Cordon |
| Yield Class | Present | RCP45 | RCP85 | |
|---|---|---|---|---|
| Olive tree | Low | 327,121 (57%) | 0 (0%) | 0 (0%) |
| Low-Moderate | 0 (0%) | 39,651 (7%) | 272,797 (48%) | |
| Moderate-High | 237,254 (42%) | 528,181 (93%) | 295,035 (52%) | |
| High | 3456 (1%) | 0 (0%) | 0 (0%) | |
| Grapevine | Low | 188,930 (33%) | 226,363 (40%) | 279,775 (49%) |
| Low-Moderate | 18,717 (3%) | 100,236 (18%) | 30,390 (5%) | |
| Moderate-High | 173,408 (31%) | 241,232 (42%) | 257,667 (45%) | |
| High | 186,777 (33%) | 0 (0%) | 0 (0%) |
Publisher’s Note: MDPI stays neutral with regard to jurisdictional claims in published maps and institutional affiliations. |
© 2022 by the authors. Licensee MDPI, Basel, Switzerland. This article is an open access article distributed under the terms and conditions of the Creative Commons Attribution (CC BY) license (https://creativecommons.org/licenses/by/4.0/).
Share and Cite
Fraga, H.; Guimarães, N.; Freitas, T.R.; Malheiro, A.C.; Santos, J.A. Future Scenarios for Olive Tree and Grapevine Potential Yields in the World Heritage Côa Region, Portugal. Agronomy 2022, 12, 350. https://doi.org/10.3390/agronomy12020350
Fraga H, Guimarães N, Freitas TR, Malheiro AC, Santos JA. Future Scenarios for Olive Tree and Grapevine Potential Yields in the World Heritage Côa Region, Portugal. Agronomy. 2022; 12(2):350. https://doi.org/10.3390/agronomy12020350
Chicago/Turabian StyleFraga, Helder, Nathalie Guimarães, Teresa R. Freitas, Aureliano C. Malheiro, and João A. Santos. 2022. "Future Scenarios for Olive Tree and Grapevine Potential Yields in the World Heritage Côa Region, Portugal" Agronomy 12, no. 2: 350. https://doi.org/10.3390/agronomy12020350
APA StyleFraga, H., Guimarães, N., Freitas, T. R., Malheiro, A. C., & Santos, J. A. (2022). Future Scenarios for Olive Tree and Grapevine Potential Yields in the World Heritage Côa Region, Portugal. Agronomy, 12(2), 350. https://doi.org/10.3390/agronomy12020350