Article

Increased Nitrogen Retention and Reduced Methane Emissions of Beef Cattle Grazing Legume vs. Grass Irrigated Pastures in the Mountain West USA

by
Jennifer W. MacAdam
1,*,
Lance R. Pitcher
2,
Andrea I. Bolletta
3,
Raul D. Guevara Ballesteros
4,
Karen A. Beauchemin
5,
Xin Dai
6 and
Juan J. Villalba
7
1
Department of Plants, Soils and Climate, Utah State University, Logan, UT 84322, USA
2
Amalgamated Sugar Company, Boise, ID 83709, USA
3
Estación Experimental Agropecuaria Bordenave, Instituto Nacional de Tecnología Agropecuaria, Bordenave, Buenos Aires 8187, Argentina
4
Animal Welfare Education Centre, Universidad Autonoma de Barcelona, 08193 Bellaterra, Spain
5
Lethbridge Research and Development Centre, Agriculture and Agri-Food Canada, Lethbridge, AB T1K 4B1, Canada
6
Utah Agricultural Experiment Station, Utah State University, Logan, UT 84322, USA
7
Department of Wildland Resources, Utah State University, Logan, UT 84322, USA
*
Author to whom correspondence should be addressed.
Agronomy 2022, 12(2), 304; https://doi.org/10.3390/agronomy12020304
Submission received: 28 December 2021 / Revised: 18 January 2022 / Accepted: 21 January 2022 / Published: 25 January 2022
(This article belongs to the Special Issue New Paradigms in Sustainable Forage-Livestock Production Systems)

Abstract

:
Grazing studies were carried out over a 5-year period using pregnant cows, yearling calves and 2-year-old heifers to investigate the influence of diet on intake, methane (CH4) emissions and retention of nitrogen (N). Monoculture legume (birdsfoot trefoil, BFT and cicer milkvetch, CMV) or grass (meadow bromegrass, MBG) pastures were rotationally stocked, and during year 4 and year 5, treatments were contrasted with total mixed rations (TMR) fed in confinement. The sulfur hexafluoride (SF6) method was used to continuously measure enteric CH4 emissions. Intake was greater on legume pastures and on TMR than on grass pastures, and enteric CH4 emissions per unit of intake were lower on legumes compared with grass pastures. Legume pastures had elevated non-fiber carbohydrate (NFC) concentrations (400 g kg−1 dry matter; DM) typical of perennial legumes cultivated in the Mountain West. A N balance calculated in 2017–2018 demonstrated that N retention was greater for TMR and legume than grass pastures. Enteric CH4 emissions of grazing cow herds account for the majority of greenhouse gas (GHG) emissions from beef production and can be significantly reduced by using highly digestible forage legumes. The N retention of legumes can potentially enhance the efficiency of N use, thereby increasing the sustainability of grasslands.

1. Introduction

The sustainability of U.S. agriculture is threatened by the degradation and/or loss of ecosystem services due to global warming and anthropogenic interventions such as reduced biological diversity; water and air pollution; and loss of soil quality [1,2,3]. The sustainability of beef production has come under considerable scrutiny given increased concerns over the use of cereal grain for livestock feed [4,5] and the contributions of CH4 and N2O from livestock production to global warming [6]. U.S. wetlands and grasslands have been converted to cropland for the production of annual feed grains, reducing ecosystem services provided by these lands. Of the annual grains produced in the U.S., 70% is used as livestock feed and approximately 35% of the grain consumed by livestock is fed to beef and dairy cattle [7]. Cereal grains require annual nitrogen (N) fertilization and periodic replacement of soil phosphorus and other mineral nutrients that are removed as they are harvested. Mechanization and fuel are needed for their cultivation, planting and harvesting, and annual grain crop production is associated with significant soil loss via erosion. When grain is used for livestock feed instead of human consumption, the negative environmental effects accrue relative to animal agriculture, while the ecosystem service of provisioning is reduced by the inefficient conversion of grains to ruminant products such as meat and milk. However, the ruminant digestive system does not require concentrates such as grain and can derive energy from the cellulose of forages and other feeds that cannot be digested by swine or poultry. The ability to utilize plant fiber for energy places ruminants in a unique position in the world’s economy [8], but this advantage is lost when concentrates are fed to ruminants. On the other hand, the nutrient density of grasses is low relative to concentrates [8], which adds to inefficiencies in nutrient use and results in increased time needed for the finishing process, which constitutes constraints that result in increments in greenhouse gas (GHG) emissions by the beef sector [9].
An increasing global population and improved standards of living provide a market for high-quality ruminant protein in meat and milk. In contrast to cereal grains and pasture grasses, perennial legumes fix their own N, present high nutritional quality and are productive for multiple years after establishment without additional cultivation or planting. Thus, by establishing perennial legume pastures on lands unsuitable for intensive cropping, ruminant productivity per land unit area could be optimized, making it unnecessary for ruminants to compete with humans for agricultural land or crops. In addition, legumes such as BFT and CMV are non-bloating and can, therefore, be grazed in pure stands, and legumes grown under irrigation in the Mountain West contain high concentrations of NFC that increase the efficiency of protein use.
Perennial legumes are digested more rapidly than grasses by ruminants; thus, intake and production are typically greater than for forage grasses. In addition, the unique plant secondary compounds (i.e., condensed tannins, CT) produced by some temperate legumes such as birdsfoot trefoil (Lotus corniculatus L.; BFT), as well as their high fiber digestibility [10,11,12] enhance the efficiency of energy and protein use in ruminants relative to other forages. Thus, it is likely that ruminant productivity per land unit area could be optimized with perennial legume pastures under management-intensive grazing. Consistent with this idea, the dry matter intake (DMI) and milk yields of cows fed with legume silage were greater than cows fed grass silage [13], but a meta-analysis of in vivo grass and legume ruminant methane (CH4) emission studies did not find differences in intake and therefore in CH4 emissions [14]. While the proportion of perennial legumes such as alfalfa (Medicago sativa L.), red clover (Trifolium pratense L.) and white clover (T. repens L.) must be limited in pasture mixtures to prevent bloat, non-bloating legumes such as BFT, cicer milkvetch (Astragalus cicer L., CMV) and sainfoin (Onobrychis viciifolia Scop.) can be grazed alongside grasses or as monoculture alternatives to grass pastures.
It was demonstrated for Western Canadian beef cattle production systems that enteric CH4 accounted for 63% of all GHG emissions in terms of carbon dioxide (CO2) equivalents and that 80% of GHG emissions occurred in the cow-calf phase [15]. Systems that include feedlot-finished cattle have been found to have a smaller carbon footprint than grazing-based systems largely because more time is needed for finishing (679 vs. 440 d for grass vs. feedlot, respectively; [9]), but red meat production can be nearly as rapid on Mountain West perennial legume pastures as in the feedlot, with comparable consumer appeal and an increased healthful balance of omega-6 to omega-3 fatty acids [16,17].
We designed the current study to determine the influence of forage nutritive value and intake on the relative enteric CH4 emissions of cows, calves and heifers, the classes of animals comprising the grazing cowherd. In the final 2 years of the study, a N balance calculation of 2-year-old heifers grazing a CT-containing legume (BFT), a non-tannin legume (CMV) and a cool-season grass, meadow bromegrass (Bromus biebersteinii Roem. and Schult., MBG) also included a total mixed ration (TMR) confinement diet treatment.
The legume BFT contains a relatively low concentration of CT that is sufficient to prevent bloating, while the non-tannin legume CMV is non-bloating because the digestion of leaves is slowed by their structural anatomy [18]. The CT in BFT may favor N retention due to the formation of stable tannin–protein complexes in the rumen that reduce proteolysis and ammonia formation, while dissociating in the abomasum and thereby supplying high-quality protein to the intestines [19]. We used the cool-season grass, MBG, which is a bunchgrass with good nutritive value that is productive at high elevations of the Mountain West [20].
Birdsfoot trefoil and CMV have been found to accumulate high concentrations of non-fiber carbohydrates (NFC) when grown under irrigation in the Mountain West [21,22]. The enteric CH4 emissions of dairy cattle fed with legume silages or pastures were less than those of cows fed with grass silage or pasture due to reduced fiber concentration, greater nutritive concentration and rapid reduction in particle size that allows legumes to leave the rumen more quickly than grasses [13,23]. The elevated NFC of Mountain West-grown perennial legumes complements their high N concentrations, which contributes to enhanced N retention [21,24].
Our hypothesis was that enteric CH4 emissions would be significantly lower for cattle grazing legumes than grasses in a Mountain West environment due to greater nutritive value of legumes and resulting elevated intakes. Based on earlier studies [17,21], we hypothesized that N retention would be enhanced in cattle grazing legume pastures relative to grass pastures and similar to that of cattle fed a TMR.

2. Materials and Methods

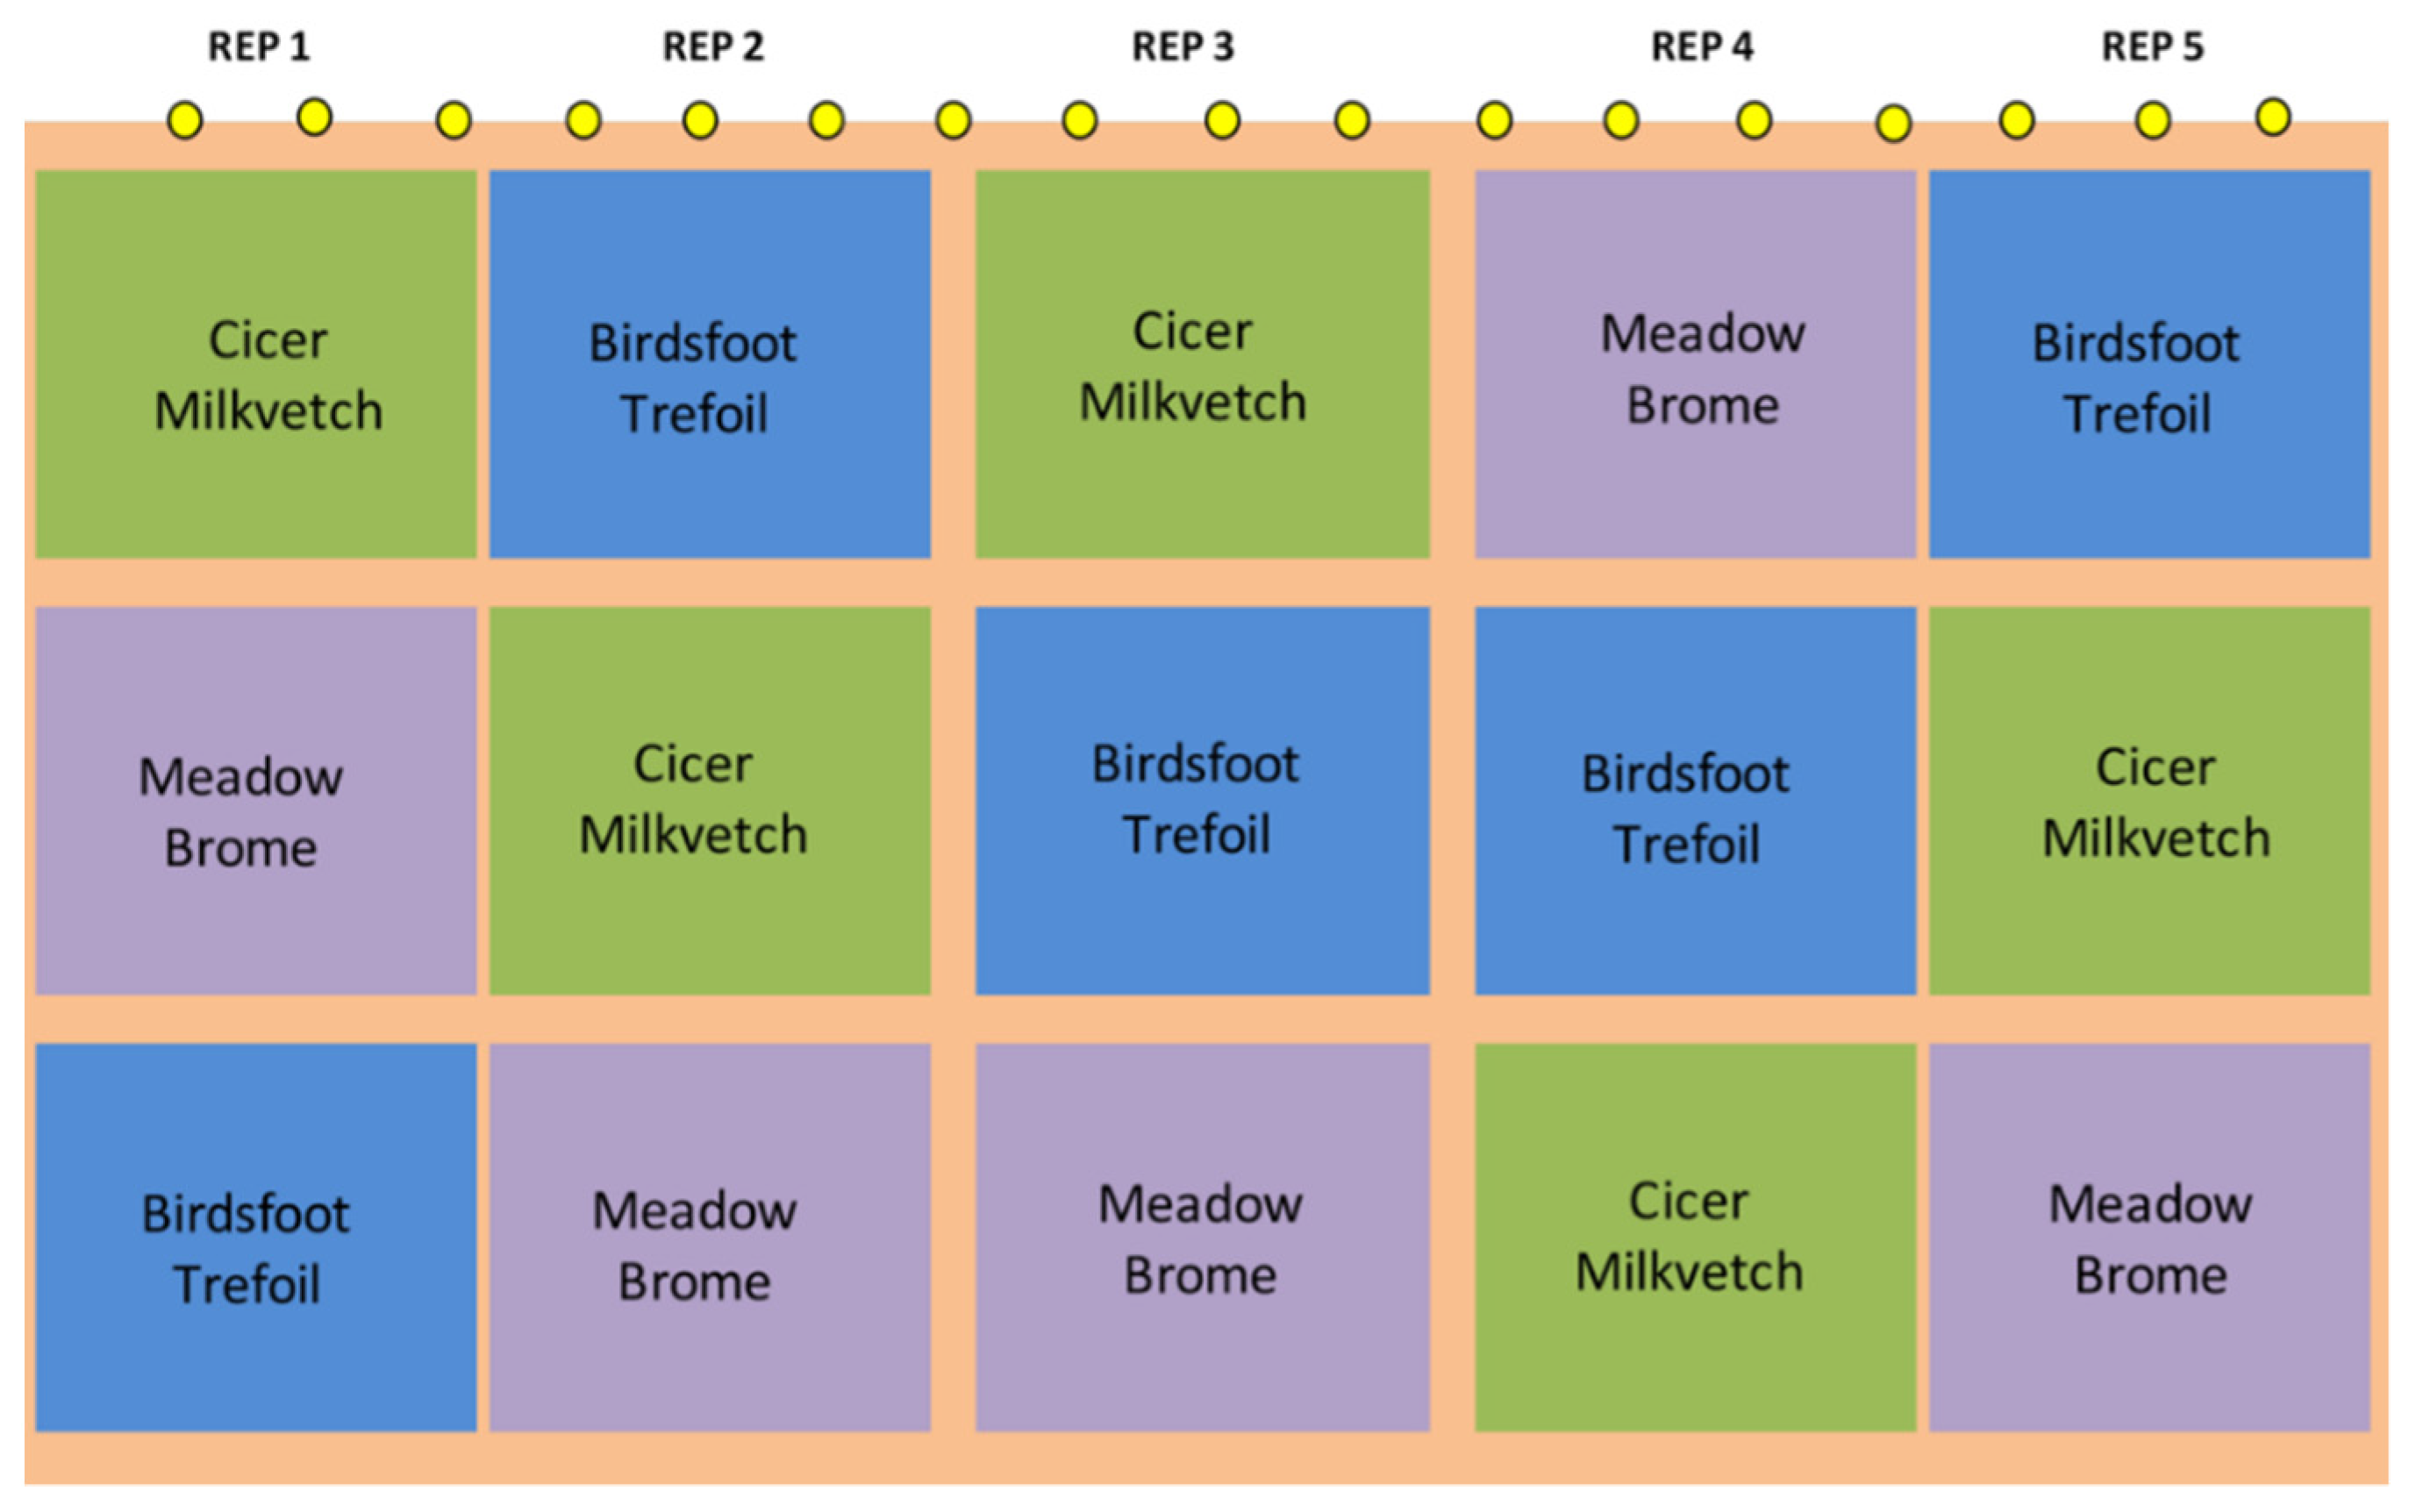
2.1. Pasture Establishment

This study was carried out between 2014 and 2018 on 6.7 ha at the Utah State University (USU) Intermountain Irrigated Pasture Project in Lewiston, UT, USA (latitude 41°56′ N, longitude 111°52′ W; 1374 m a.s.l.). Two soil series are present: Kidman fine sandy loam (coarse-loamy, mixed and mesic Calcic Haploxeroll) and Lewiston fine sandy loam (coarse-loamy, mixed and mesic Aeric Calciaquoll). Soil tests were conducted during the summer of 2012, and deficiencies of phosphorus and potassium were addressed by adding 112 kg/ha P2O5 and 135 kg/ha K2O prior to planting. Three monoculture pasture treatments, CMV cv. ‘Monarch,’ BFT cv. ‘Langille’ and MBG cv. ‘Cache,’ were replicated five times in a randomized complete block design (Figure 1); individual pastures were approximately 0.365 ha (64 × 57 m).
Birdsfoot trefoil seed was inoculated with Mesorhizobium loti bacterium and CMV seed with Rhizobium leguminosarum bacterium at planting, and grass pastures received 56 kg/ha 34-0-0 fertilizer (N-P2O5-K2O) in early June, mid-July and early Sept. of each year. Pastures were sprinkler irrigated for 12 h every 2 weeks during the growing season at a rate of 3.8 mm/h for a total of 46 mm of water per irrigation, equaling the available water-holding capacity of the soil. Pastures were broadcast seeded 14–15 August 2012 with CMV, BFT or MBG at 20, 34, and 37 kg pure live seed/ha, respectively. Temperature, evapotranspiration and solar radiation data were collected from an on-site Utah Climate Center meteorological weather station, and precipitation data were provided by a Utah Climate Center meteorological weather station approximately 7 km from the experimental site (Figure 2). The relatively alkaline soils, long (15 h) warm (>30 °C) sunny (350 W m−2) days and cool (60 °C) nights characteristic of the Mountain West growing season (Figure 2a,c) are favorable for the production of deep-rooted perennial legumes such as BFT, CMV and alfalfa, particularly under irrigation. Precipitation in the Mountain West is variable (Figure 2b,d) but typically occurs as rain in spring and autumn or as snowfall in winter. Evaporative demand has the opposite profile (Figure 2b,d), peaking in mid-summer, and can be addressed using irrigation except in periods of prolonged drought when water supply becomes limiting. Irrigation was unrestricted during this study.

2.2. Grazing and Feeding

During each year of this study, the pasture experimental unit was a rotationally stocked pasture with its assigned animal or pair of animals (Table 1). In 2014, each pasture was stocked with a pregnant 4- or 5-year-old Angus cow, in 2015 with a pair of yearling calves (Angus on 2 reps and Charolais on 3 reps), in 2016 with a 7- or 8-year-old dry Angus cow and in 2017 and 2018 with a 2-year-old Angus heifer. Each year, cattle were sorted into three groups of five animals (pairs in 2015) with similar body weight (BW), and one animal from each group was randomly assigned to each of the five replications of a given treatment. In 2015, pairs of Angus calves were randomly assigned to replications 3 and 4 of each treatment and pairs of Charolais calves were randomly assigned to replications 1, 2 and 5 of each treatment. Results for CH4 from cows and calves in 2014 and 2015 were used to formulate models and tests that were applied to CH4 data from 2017 to 2018 for 2-year-old heifers. In 2017 and 2018, a fourth treatment comprised five 2-year-old Angus heifers randomly assigned to one of five pens at the USU Animal Science Farm (latitude 41°40′ N, longitude 111°53′ W; 1370 m a.s.l.) and fed a TMR in confinement. Cattle were weighed before being moved to treatment pastures or confinement stalls and at the end of the study when they were removed from treatments. The yearling calves used in 2015 were previously on a diet of 50% alfalfa hay and 50% corn silage and were, therefore, not expected to gain weight during the 7 weeks they were assigned to grass and legume pastures.
Cattle on pastures were moved to an ungrazed paddock within their pasture every 3.5 days; fresh water and trace-mineralized salt blocks (Morton iOFIXT T-M, Morton Salt Inc., Chicago, IL, USA) were provided ad libitum. In 2014, cows grazed for 5 weeks before CH4 data collection began, whereas in 2015, 2017 and 2018, calves or heifers grazed for 2 weeks before CH4 data collection began. In 2015, one calf from each pair was assigned to enteric CH4 determinations and the other was used for DMI calculations. In 2016, dry cows grazed the pastures for 12 weeks but no CH4 data were collected. Cattle were dewormed with albendazole (Valbazen broad spectrum dewormer, Pfizer Animal Health, Exton, PA, USA) at 8.8 mL/100 kg of BW before being permitted on pastures, and they were provided with permethrin ear tags (GardStar Plus, Y-Tex Corp., Cody, WY, USA) to reduce horn flies.
In 2017 and 2018, cattle in the confinement treatment were randomly assigned to individual adjacent pens measuring 5 × 10 m inside a covered barn and received a TMR consisting of 25% of alfalfa hay, 25% corn silage and 50% chopped barley (dry matter (DM) basis). The TMR was offered each day at 0900 h and 27 kg/animal was offered in both years. Refused feed was collected at 0850 h on the following day and weighed; fresh feed was offered immediately upon refusal collection. Feed intake was measured from day 5 to 9 of each collection period and the difference between amounts of feed offered and refused (on a DM basis) was recorded as feed intake. Each animal had ad libitum access to water and trace mineral salt blocks (Morton iOFIXT T-M). Methane data were collected in 2017 and 2018, but urine and fecal samples were only collected from feedlot animals in 2018.

2.3. Plant Production, Intake, Nutritive Value and Chemical Composition

Available herbage DM in the grazed paddock that cattle were entering, and remaining DM in the paddock that was being vacated, were non-destructively sampled using a Farmworks (Feilding, NZ) rising plate meter (RPM) calibrated for each forage species [25]. Forage DM disappearance was calculated as the difference between pre- and post-grazing DM availability [26,27]. Mean RPM values for pre- and post-grazing paddocks were determined by walking in a “lazy W” pattern to accumulate a minimum of 30 RPM readings [25]. Calibration samples were collected in pre-grazing and post-grazing paddocks each week (2014–2016) or month (sampling period) (2017–2018) from the area under the RPM by clipping forage to a 1-cm height above the soil surface. Calibration samples were dried in a forced-air oven at 60 °C to constant weight. These samples were collected from a range of plant growth heights each year, and a linear regression of herbage dry mass on RPM readings was used to determine pasture production and forage disappearance.
To estimate intake for grazing animals during 2017 and 2018, we used fecal output estimates determined through the daily delivery of an external marker, chromic oxide (Cr2O3; see below) and forage DM digestibility estimated through near infrared spectroscopy (NIRS) analyses [28] (see below). Intake was calculated by the following equation.
Intake on Pasture (kg/d) = Fecal output (kg/d)/(1 − Digestibility of DM (kg/kg))
Intake values were then converted to units of percentage of body weight per day (% BW/d) for each legume. These percentages, in combination with the animals’ individual BW, were used to estimate intake on pasture for years when fecal output estimates were not assessed (2014–2016).
Forage nutritive value samples were collected weekly (2014–2016) or monthly (2017 and 2018) from pre-grazing paddocks by clipping a small handful of stems every few steps to a height of approximately 7.5 cm along a diagonal transect of the next paddock to be grazed. Samples for determining the content of CT were taken in a similar manner but included only seeded pasture treatment species (BFT, CMV or MBG). Samples for nutritive value estimates and CT analyses were frozen under dry ice in the field, stored at –20 °C until freeze-dried and milled to pass the 1 mm screen of a Wiley mill (Thomas Scientific, Swedesboro, NJ, USA).
Forage nutritive value was determined using an NIRS analyzer (FOSS DS2500, Hillerød, Denmark) and NIRS Forage and Feed Consortium (Berea, KY, USA) forage nutritive value prediction equations. Crude protein (CP), neutral detergent fiber (aNDF), acid detergent fiber (ADF), lignin and ash of NIRS calibration samples were determined according to AOAC [29] methods 984.13, 2002.04, 973.18 and 942.05, respectively, and crude fat (CF) by AOAC [28] method 920.39. The in vitro true dry matter digestibility (IVTDMD) of calibration samples was determined by incubating samples in buffered rumen fluid for 48 h followed by refluxing indigestible residues in a neutral detergent solution [30,31]. Non-fiber carbohydrate concentration was calculated as suggested by NRC [32] as 1000 − ((NDF − NDFIP) + CP + CF + ash) where NDFIP (NDF insoluble protein) was estimated as NDF × 0.93 [33]. The distribution and boundaries of our forage sample spectra were well-represented by the population structure of spectra in the calibration set; thus, no additional wet chemistry was required.
In 2017 and 2018, representative TMR samples were collected during each sampling period, freeze dried, milled to 1 mm and analyzed by Cumberland Valley Analytical Services (Waynesboro, PA, USA) for NDF [34], ADF ([28] Method 973.18), total N ([28] Method 990.03) and NFC concentration as described above. Total digestible nutrients (TDN) were calculated from CP and fiber concentration based on equations by [35]. Samples were analyzed for CT using the butanol-hydrochloric acid-acetone-iron method of [36], with CT isolated from BFT [37] serving as the standard.

2.4. Enteric Methane Emissions

Enteric CH4 emissions were determined using the sulfur hexafluoride (SF6) trace gas technique [38,39]. Before grazing began, animals to be used for CH4 sampling were trained to wear halters and polyvinyl chloride canisters. Canisters equipped with quick-connect couplers were clipped to halters under the chin and attached to capillary tubing running along the halter from above the nose and mouth. Canisters were constructed of schedule 40 polyvinyl chloride 10-cm-diameter, 28-cm-long with slip caps attached to both ends; canister volume was approximately 2.5 L. Canisters were fitted with Swagelok ball valves and quick connect fittings. A brass permeation tube with a known release rate of SF6 that served as an internal standard for respiration volume [39] was placed in the reticulorumen of each animal using a bolus gun. The SF6 release rate of each permeation tube was determined gravimetrically during six weeks of in vitro incubation at 39 °C.
Enteric CH4 was collected for 4 consecutive days from one (2014) or two (2015) replications of each pasture treatment each week for five weeks or for 5 consecutive days at monthly intervals (2017 and 2018). Before CH4 collection, canisters were evacuated to a tension of approximately 0.250 psi using a diaphragm vacuum pump (Vacuubrand Model MZ2NT, Wertheim, Germany) and an inline digital pressure meter (Druck, Model DPI 705, Druck Ltd., Groby, Leicester, UK). Halters were fitted with a 50 cm length of 125 µm ID × 1/16” OD U160 capillary tubing (IDEX, Oak Harbor, WA, USA) that connected a filtered inlet above the mouth and nose to a quick connect fitting near the chin. Each sampled animal was fitted with a halter and evacuated canister, and the canister was connected to the capillary tubing on the halters: Its valve was opened, the time was noted, and after approximately 24 h its valve was closed, the time was noted, and canisters were disconnected from the collection system and returned to the lab. After 24 h of collection, acceptable final tensions in canisters were between 0.25 and 0.67 atm. Tensions above or below that range indicated a leak or blockage, respectively [39].
Before field collection began, canisters fitted with capillary tubing systems were placed in pastures to determine background SF6. During each collection period, control canisters were placed in grazed sections of each treatment pasture. The inlet was positioned on top of a fence post at 1.5 m height, and data were used to correct values obtained from cattle for ambient CH4 [40].

2.5. Methane Analysis

At the end of the 24-h collection period, the tension remaining in each sample canister was recorded; canisters were pressurized to 1.1 atm with high-purity N2 gas; and the exact dilution pressure was recorded. Duplicate gas subsamples were analyzed for CH4 and SF6 concentrations at the Lethbridge Research and Development Centre, Agriculture and Agri-Food Canada, Lethbridge, Alberta, Canada. SF6 corrects CH4 for respiration volume because both gases are exhaled from the rumen at once and mixed with ambient air at the same dilution rates. Therefore, the CH4 emission rate was calculated as the product of the known release rate of SF6 and the ratio of CH4 and SF6 corrected for control canister concentrations [39,40].
CH4 emission rate (g d−1) = SF6 release rate (g d−1) × [(sample CH4 (g d−1) − control CH4 (g d−1))/
(sample SF6 (g d−1) − control SF6 (g d−1))]

2.6. Fecal Output (2017–2018)

During 9-day (Thursday–Saturday) sampling periods spaced 4 weeks apart in 2017 and 2018, 2-year-old heifers were moved each day between 0800 and 0900 h to a holding area with a squeeze chute. A gelatin capsule containing 15 g of the indigestible marker Cr2O3 lubricated with mineral oil was administered to each animal using a bolus gun. Fecal grab samples of approximately 50 g DM were collected on days 5 to 9 of the sampling period and transported to the lab on dry ice where they were stored at −20 °C. At the end of each collection period, fecal samples were thawed, and daily fecal samples for each animal were composited for that period. The homogenized composited samples were frozen and lyophilized (Free Zone 18 L, Labconco Corporation, Kansas City, MO, USA). The dry sample weight was recorded, and feces were milled to pass the 1 mm screen of a Wiley mill (Thomas Scientific, Swedensboro, NJ, USA). Composite fecal samples for each animal and period were analyzed for Cr2O3 concentration using the method of [41], and the concentration of fecal Cr2O3 was used to calculate fecal output as described by Parker et al. [42] using the following equation.
Fecal output (g d−1) = daily Cr2O3 dose (g) ÷ Cr2O3 concentration in feces (g Cr2O3 ∗ g−1 feces DM)
Fecal samples were also analyzed for DM concentration by drying further at 100 °C for 24 h ([28]; Method 967.03). All freeze-dried samples were analyzed for NDF, ADF and total N concentration as previously described.

2.7. Blood and Urine Collection and Nitrogen Balance (2017–2018)

Blood and urine samples were collected at the end of each sampling period for each animal. Blood was taken from the coccygeal vein of the tail using 10 mL vacuum tubes without additives [43]. Blood was allowed to clot at room temperature; serum was separated by centrifugation at 2000× g for 20 min; and aliquots of serum were removed and frozen at −20 °C until analysis for blood urea N (BUN). Blood serum samples were analyzed for BUN using Siemens Urea Nitrogen Flex Reagent (Siemens Healthcare Diagnostics, Newark, DE, USA) at the Utah Veterinary Diagnostic Laboratory.
Urine was collected through vulva massage. A volume of 25 mL/cow was measured using a calibrated cylinder, and 3.125 mL of HCl 6N was added to reduce pH in order to avoid N volatilization. Samples were stored at −20 °C until N analysis [44]. Urine samples were analyzed for urinary N concentration (Leco Corporation FP-528 Protein/Nitrogen Determinator) expressed in grams per liter (g/L). Daily urinary N excretion was calculated using the following equation [45].
Urinary N output (g d−1) = Clearance rate (L blood cleared of BUN d−1 kg−1 BW) ∗ BUN (g L−1) ∗ BW (kg).
The clearance rate for cattle was determined to be 1.3 L of blood cleared d−1 kg BW−1 [45].
Dietary N intake was calculated as follows.
Dietary N intake (g d−1) = CP content of the forage consumed (g kg−1 DM) ∗ 0.16 (proportion of N in CP) ∗ DMI (kg DM d−1) calculated as described above.
Finally, N retained (g d−1) by the animals was calculated by subtracting the amount of N excreted in feces and urine from N intake. Total N excretion in urine and feces was estimated as a percentage of N intake (total N excretion, percentage (%) of intake); N retention by the animals was calculated as a percentage of N intake (N retention, percentage (%) of intake); and urinary and fecal N excretion as a percentage of N intake (urinary N, percentage (%) of intake and fecal N, percentage (%) of intake), respectively.

2.8. Statistical Analysis

Trials carried out between 2014 and 2016 employed a different class of cattle in each year; thus, data were analyzed separately for each year, while data for 2-year-old heifers collected in 2017 and 2018 were combined. Data from 2014–2016 informed the statistical models and tests for data collected in 2017 and 2018, including a confinement-fed TMR treatment. Data from 2017 and 2018 were pooled because the same class of cattle was managed under the same experimental conditions. Herbage biomass (pre-grazing, post-grazing and their difference) and the nutritive composition (CP, aNDF, ADF, fat, lignin, ash, IVTDMD, NFC and CT) of samples collected before grazing began in each paddock. BW, DMI and CH4 emissions per animal per day on the basis of DMI were analyzed using a mixed model with repeated measures in which species (treatment) and week or period were fixed factors. Random factors were replication, species–replication interaction and year (for 2017 and 2018 data). The error variance-covariance matrix was unstructured and varied by year. Interaction between species and period or week was either not significant or marginally significant. Examination of the interaction revealed that the interaction was mainly caused by the magnitude of species differences; the nature of the species difference remained the same regardless of week or period. Therefore, the main effects of species were estimated and compared. All analyses were conducted using SAS PROC GLIMMIX (SAT/STAT 15.1, SAS Institute, Cary, NC, USA). Least squares means (LSMEANS) were estimated and compared pairwise with the Tukey–Kramer method to adjust for multiplicity. Statistical significance is specified at α = 0.05.

3. Results

In all 5 years, legumes had greater CP, IVTDMD and NFC than the grass, while grass had greater aNDF, ADF and CF than legumes (Table 2). Digestibility was greater for the legumes than for the grass; the TDN of legumes was always greater than 700 g kg−1 DM, and in 2017 and 2018 it was greater than that of the high-forage confinement TMR (Table 2). The available forage DM in pastures before they were grazed was greater for CMV than for MBG in most years (Table 3). Forage utilization rarely exceeded 50% and, thus, forage intake was not limited by availability.
The DMI (kg d−1) of cattle on BFT and CMV pastures was greater than for cattle on MBG pasture in all 5 years (Figure 3a–d). The difference in the BW of cows in 2014 and 2016, yearling calves in 2015 and 2-year-old heifers in 2017 and 2018 is reflected in the magnitude of DMI in these years. Enteric CH4 emissions per unit of DMI were less for cattle grazing perennial legume pastures than for cattle on grass pastures in every year of the study (Figure 3e–g). In 2017 and 2018, CH4 emissions by heifers fed with TMR was intermediate to cattle on legume and grass pastures (Figure 3g).
The N balance calculated for 2017–2018 data (Table 4) demonstrated that greater DMI and CP concentration of legumes resulted in greater dietary N intake and greater urinary N output for cattle grazing legume pastures than for cattle grazing MBG or offered the TMR (Table 4). The N retention of legume-fed cattle was also much greater for cattle grazing legumes than for cattle on grass or fed with TMR, with the opposite pattern observed for the proportion of N excreted relative to N intake (N excretion, percentage (%) intake; Table 4). The urinary output was greater for legumes than for other treatments due to the greater concentration and intake of dietary N, and urinary N excretion as a proportion of N ingested (urinary N, % intake) was greater for CMV and BFT. Finally, fecal N as a proportion of N intake was the lowest for legumes, with the opposite pattern for the urinary:fecal N ratio (Table 4).

4. Discussion

The Mountain West climate has a unique influence on forage quality. Low annual precipitation and high evapotranspiration have resulted in moderately alkaline soils that are naturally high in calcium, phosphorus and potassium. The growing-season climate regimen includes high daytime temperatures, high solar radiation and low nighttime temperatures, maximizing photosynthesis and minimizing aerobic respiration. We have recently determined that perennial legumes (e.g., alfalfa, BFT, sainfoin and CMV) not only persist and yield well in this environment, but they accumulate levels of NFC comparable to beet pulp or corn silage [24,46]. For comparison with forage yields from other locations, annual yields of four replications of 0.8-ha monoculture stands of ‘NexGrow 6409 HVRX’ alfalfa and ‘Cache’ MBG planted in fall of 2019 and harvested in early June, mid-July and late August of 2020 and 2021 averaged 12,296 and 10,475 kg ha−1, respectively (MacAdam, pers. comm.).
This study sought to demonstrate the value of perennial legumes for reducing environmental impacts of Mountain West beef cattle production. We investigated enteric CH4 emissions and the retention of N in cows, calves and heifers because beef cows produce the greatest proportion of the emissions from the cowherd [15], and we sought to determine the potential of perennial legumes to reduce beef system GHG by contrasting cattle grazing legume monocultures with cattle grazing grass monocultures or those fed with TMR in confinement.

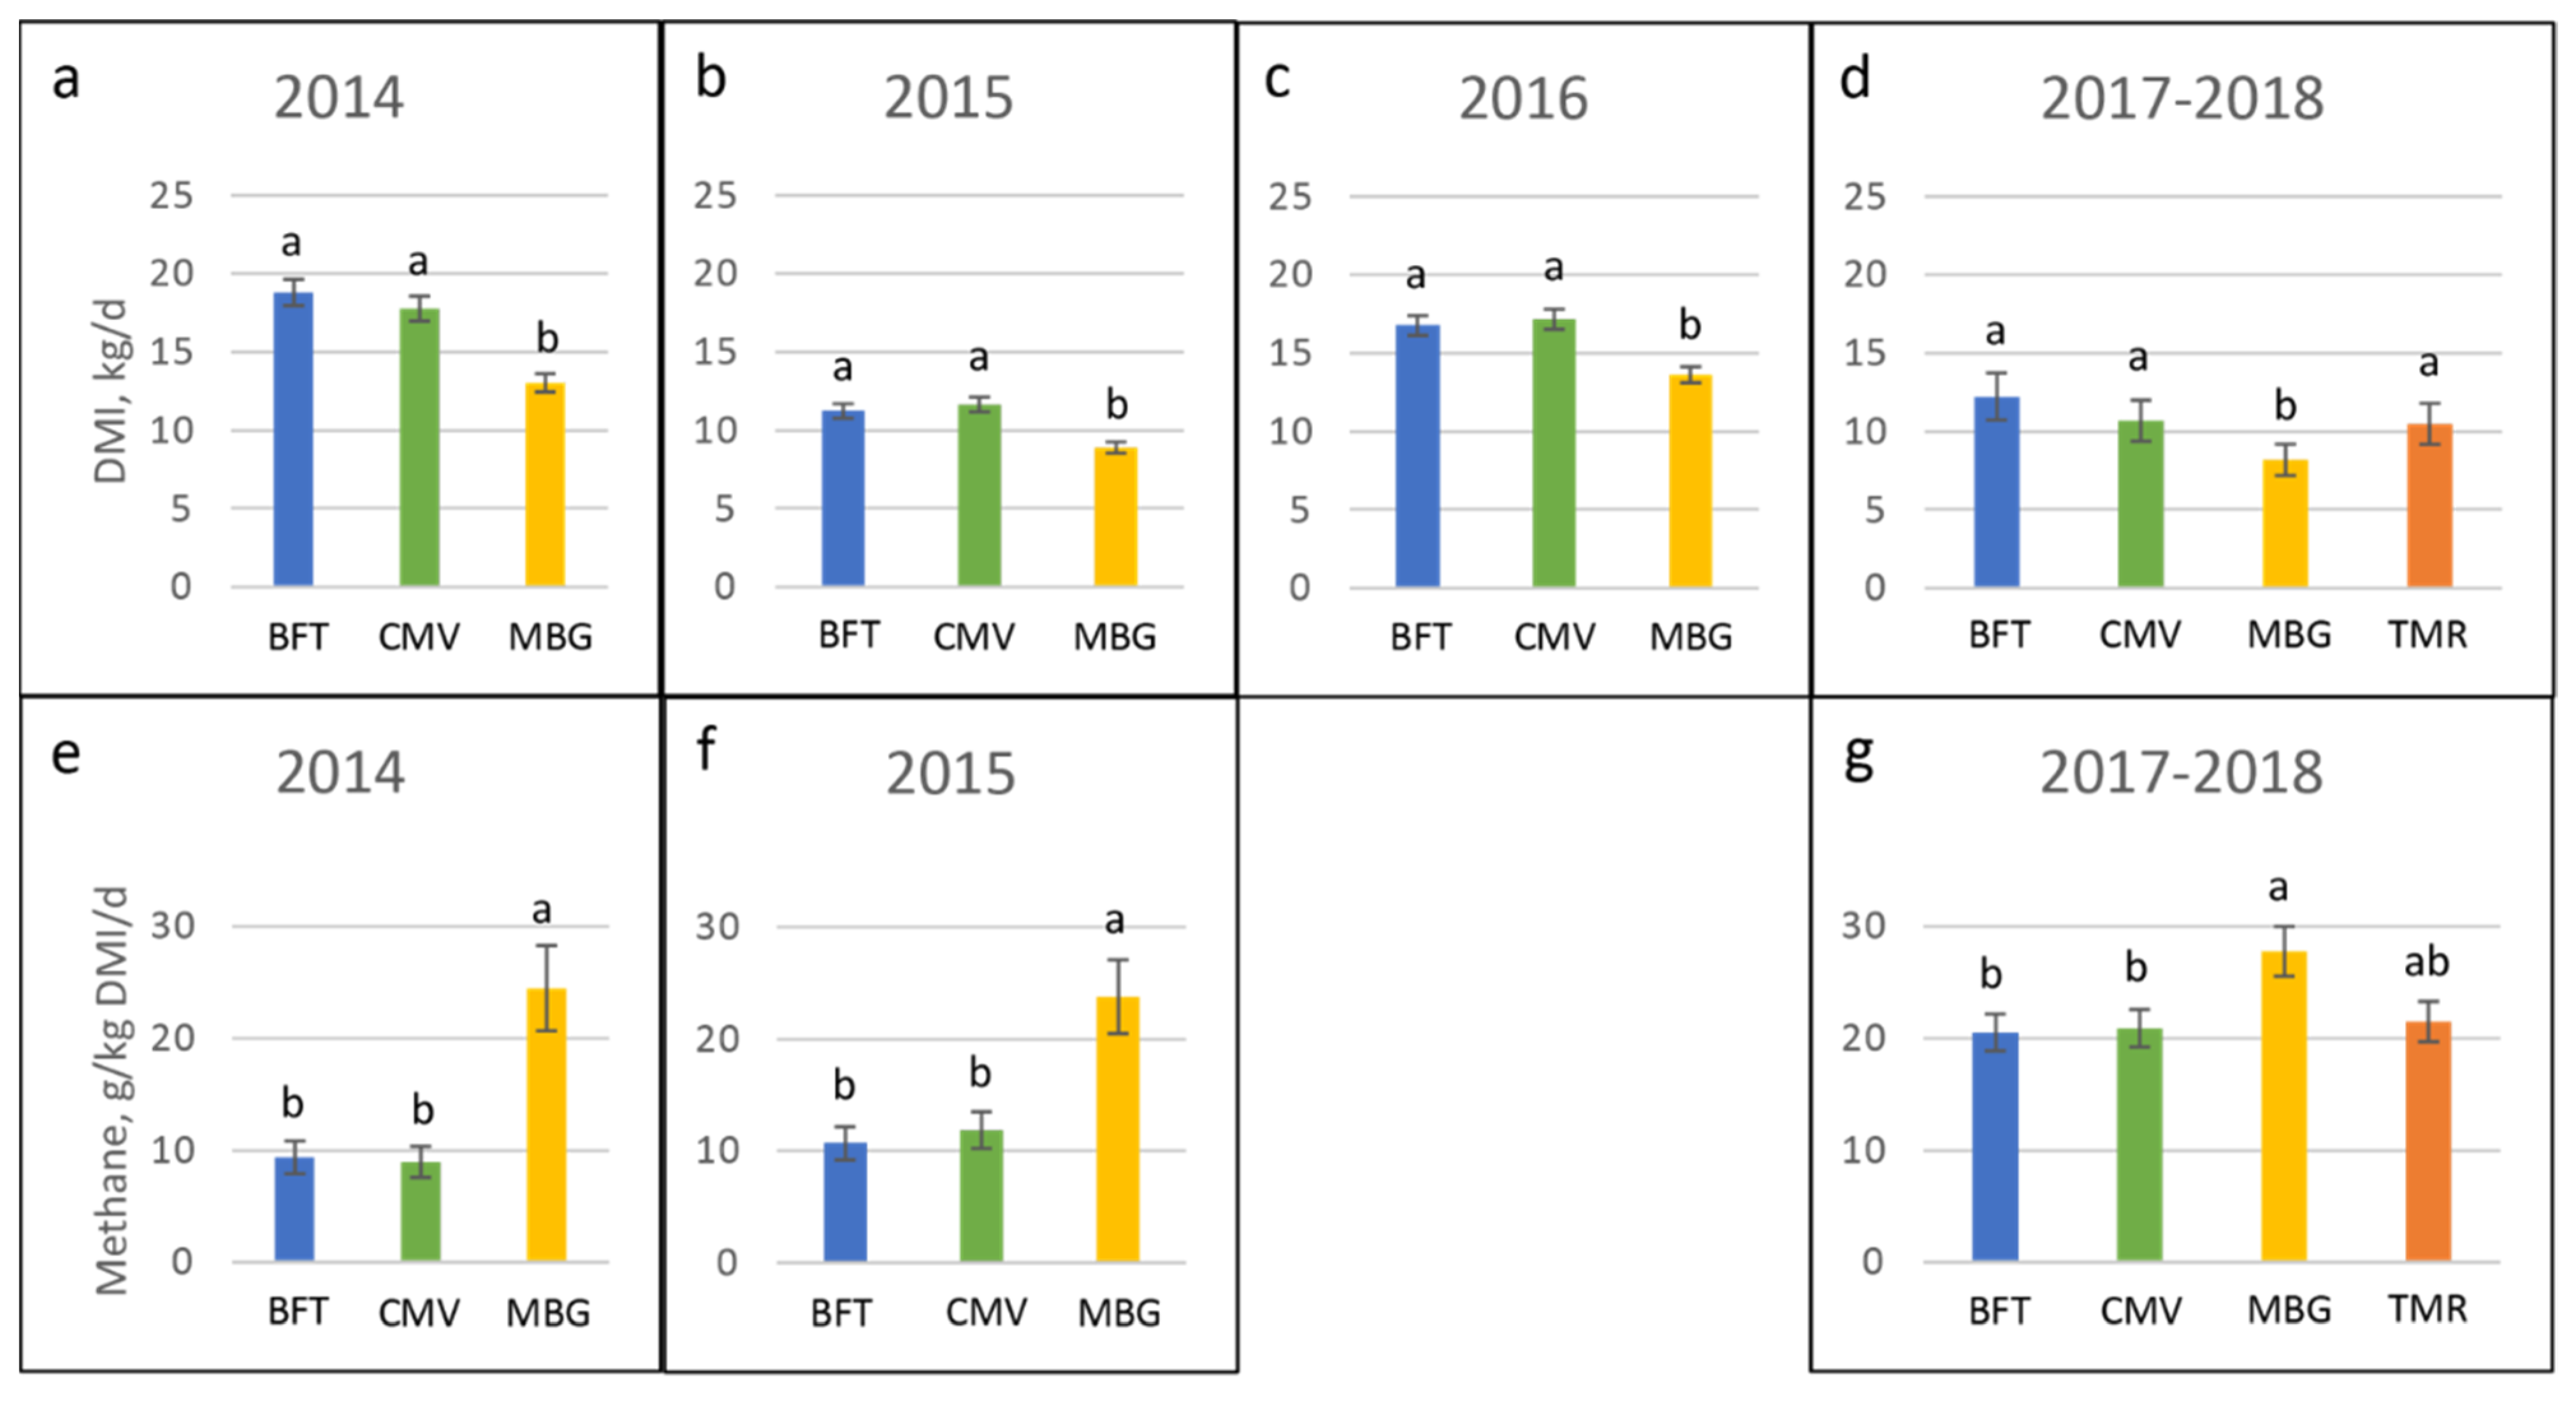
4.1. Nutritional Quality and Intake

The nutritional quality of the legumes explains the high values of DM disappearance observed for these treatments. For data reported in Table 2, the 5-year mean of aNDF concentration of the two legumes was 271 g kg−1 DM while the mean aNDF concentrations of the grass and TMR diet were 563 and 344 g kg−1 DM, respectively. The 5-year mean NFC concentration of the two legumes was 410 g kg−1 DM and their mean TDN concentration was 752 g kg−1 DM, whereas NFC mean concentrations for the grass and TMR diet were 196 and 433, respectively, and their mean TDN concentrations were 606 and 702 g kg−1 DM. The CP concentrations of the legumes were much greater than of grass or TMR. Legumes with lower cell wall (aNDF) content allow for increased passage rates [47], and greater CP and NFC concentrations enhanced fermentation rates and intake in ruminants [8].
The DMI of animals grazing BFT and CMV was always greater than the DMI of animals grazing MBG (Figure 3a–d), and in 2017 and 2018, the DMI of heifers on BFT and CMV pastures did not differ from the intake of TMR-fed confinement heifers. There was some deterioration of the BFT pastures over time, with the presence of weeds revealed by increments in aNDF and ADF concentrations relative to CMV (Table 2).

4.2. Methane Emissions

Enteric CH4 emission per unit of DMI was less for cattle grazing perennial legume pastures than for cattle on grass and did not differ from cattle fed with TMR. Diet quality affects the amount of CH4 emitted by ruminants. Forages with higher fiber concentrations (i.e., MBG in this study) constrain passage rate and increase ruminal retention time [47,48], which in turn results in an increment of CH4 production per unit of forage intake (CH4 yield), because as fiber increases the extent of rumen fermentation increases and there is more hydrogen available as a substrate for methanogenic archaea [49]. In addition, a more fibrous diet usually results in greater acetic acid production, which increases CH4 production [50,51].
On the other hand, forages with lower fiber concentration have greater passage rates and favor propionate production, which is considered a competitive pathway for hydrogen use in the rumen [49]. In addition, legumes with high NFC concentrations that are rapidly fermented in the rumen and a low proportion of structural carbohydrates can yield proportions of ruminal microorganisms similar to those present in grain-fed animals, increasing proportions of propionate-forming bacteria, decreasing H2 production and resulting in decreased CH4 emissions relative to forages with lower concentrations of NFC, such as grasses [52]. Finally, it is known that CT, such as those present in BFT, may inhibit CH4 production in the rumen either in absolute amounts (g/d) or as CH4 yield (g/kg DMI). The CT concentration of BFT was borderline (12 to 20 g/kg DM) during the 5 years of this study compared with the effective BFT range (20 to 50 g/kg DM) known to decrease CH4 emissions [53,54,55], and CH4 emissions for cattle on BFT pastures were no less than that of cattle on CMV pastures. Thus, it is likely that high NFC concentrations in BFT were more consequential than CT for reducing CH4 emissions in this study.

4.3. Nitrogen Retention and Emissions

Nitrogen lost to the environment as nitrous oxide (N2O) has far greater warming potential per weight of gas than either CO2 or CH4, and ammonia can contribute to particulate (PM2.5) air pollution. The CP concentration of the two pasture legumes was greater than for the TMR which was greater than for MBG. Along with the greater DMI of animals consuming legumes, this led to greater N intake and greater urinary N excretion but reduced total N excretion as a proportion of intake, compared with the grass. The N retention by cattle grazing legumes was greater than for the grass and the same as for TMR diets, suggesting that N consumed from legume pastures will contribute more to meat, milk and wool production than N consumed from grass pastures (i.e., greater N efficiencies). Nevertheless, it is worth mentioning that N balance studies are prone to measurement errors (e.g., N volatilization and fecal N excretion) and, in particular, under grazing studies with a high degree of spatial and animal variation [56,57] that adds uncertainty to the estimates.
The high N retention values observed in this study are consistent with previous results reported for legume-based diets, e.g., [21,58,59]. Legumes present high concentrations of NFC, and the provision of readily available sources of energy such as NFC to the rumen may enhance the efficiency of N use as these carbohydrates provide substrate, along with ammonia, for the production of microbial protein. In addition, increased N retention values in legume diets have been attributed to augmented levels of highly digestible CP intake consumed with synchronous sources of carbohydrates [58]. Finally, the CT in BFT may have contributed to enhanced fecal N excretion relative to CMV, resulting in a greater urinary:fecal N ratio in cattle grazing CMV.

5. Conclusions

The legume pastures grazed in this study resulted in reductions in CH4 emissions as a function of intake of between 25 and 63% relative to grass pasture and reductions in excretion as a proportion of dietary N between 36 and 47% compared with animals on the grass pasture. The elevated concentrations of both NFC and CP and reduced concentrations of aNDF in legume pastures compared with the grass pasture resulted in intake and methane emissions comparable to TMR confinement-fed cattle in 2017–2018 and in N retention greater than grass-fed cattle and not different from cattle fed with TMR containing 50% grain, thereby enhancing the sustainability of beef agroecosystems. Condensed tannins produced by BFT and other temperate legumes have the potential to further enhance the efficiency of energy and protein use in ruminants relative to other perennial species. Life cycle assessment will be used to determine the implications of these results for beef system GHG emissions.

Author Contributions

Conceptualization, J.W.M., K.A.B. and J.J.V.; formal analysis, X.D.; investigation, L.R.P., A.I.B. and R.D.G.B.; methodology, J.W.M., L.R.P., K.A.B., X.D. and J.J.V.; writing—original draft, J.W.M., L.R.P., A.I.B., R.D.G.B. and X.D.; writing—review and editing, J.W.M., K.A.B., X.D. and J.J.V. All authors have read and agreed to the published version of the manuscript.

Funding

This research was supported by the Utah Agricultural Experiment Station, Utah State University, and approved as journal paper number 9360.

Institutional Review Board Statement

Livestock procedures were approved by the USU Institutional Animal Care and Use Committee as protocols 2351 dated 17 April 2014 (2014–2017), protocol 2733 dated 2 March 2017 (2017–2020) and protocol 2858 dated 14 May 2018 (2018–2021).

Data Availability Statement

The data generated during the study are available upon request from the corresponding author.

Acknowledgments

The authors thank Kristen Johnson for providing an overview of methane methodology; Darrell Vedres for methane analysis; Alan Iwaasa and Nicholas Dilorenzo for provision of permeation tubes; and Peter Armstrong, Matthew Endicott, Brian Fluckiger, Breann Bitner McFarlane, Tara Roche, Britney Allen and Beth Floyd for technical assistance.

Conflicts of Interest

The authors declare no conflict of interest. The funders had no role in the design of the study; in the collection, analyses or interpretation of data; in the writing of the manuscript; or in the decision to publish the results.

Abbreviations

ADFAcid detergent fiber
BFTBirdsfoot trefoil
BUNBlood urea nitrogen
BWBody weight
CO2Carbon dioxide
Cr2O3Chromic oxide
CMVCicer milkvetch
CTCondensed tannins
CFCrude fat
CPCrude protein
DMDry matter
DMIDry matter intake
GHGGreenhouse gas
IVTDMDIn vitro true dry matter digestibility
LSMEANSLeast squares means
MBGMeadow bromegrass
CH4Methane
NDFIPNDF insoluble protein
NIRSNear infrared spectroscopy
aNDFNeutral detergent fiber
NNitrogen
N2ONitrous oxide
NFCNon-fiber carbohydrates
P2O5Phosphorus pentoxide
K2OPotassium oxide
RPMRising plate meter
SF6Sulfur hexafluoride
TMRTotal mixed ration
USUUtah State University

References

  1. Watson, R. Living Beyond Our Means: Natural Assets and Human Well-Being; Millennium Ecosystem Assessment; Island Press: Washington, DC, USA, 2005. [Google Scholar]
  2. Villalba, J.J.; A Beauchemin, K.; Gregorini, P.; Macadam, J.W. Pasture chemoscapes and their ecological services. Transl. Anim. Sci. 2019, 3, 829–841. [Google Scholar] [CrossRef] [PubMed] [Green Version]
  3. Coffin, A.W.; Sclater, V.; Swain, H.; Ponce-Campos, G.E.; Seymour, L. Ecosystem Services in Working Lands of the Southeastern USA. Front. Sustain. Food Syst. 2021, 5, 541590. [Google Scholar] [CrossRef]
  4. Wilkinson, J.M.; Lee, M.R.F. Review: Use of human-edible animal feeds by ruminant livestock. Anim. Int. J. Anim. Biosci. 2018, 12, 1735–1743. [Google Scholar] [CrossRef] [PubMed]
  5. USDA-ERS. Feedgrains Sector at a Glance; USDA Economic Research Service: Washington, DC, USA, 2021.
  6. Shen, J.; Melaku, N.D.; Treu, R.; Wang, J. Inventories of methane and nitrous oxide emissions from animal and crop farms of 69 municipalities in Alberta, Canada. J. Clean. Prod. 2019, 234, 895–911. [Google Scholar] [CrossRef]
  7. Hendy, C.R.C.; Kleih, U.; Crawshaw, R.; Phillips, M. Livestock and the Environment: Finding a Balance: Interactions between Livestock Production Systems and the Environment: Impact Domain: Concentrate Feed Demand; United Nations Food and Agriculture Organization: Rome, Italy, 1995. [Google Scholar]
  8. Van Soest, P.J. Nutritional Ecology of the Ruminant, 2nd ed.; Cornell University Press: Ithaca, NY, USA, 1994. [Google Scholar]
  9. Capper, J.L. Is the Grass Always Greener? Comparing the Environmental Impact of Conventional, Natural and Grass-Fed Beef Production Systems. Animals 2012, 2, 127–143. [Google Scholar] [CrossRef] [PubMed]
  10. Christensen, R.G.; Yang, S.Y.; Eun, J.-S.; Young, A.J.; Hall, J.O.; MacAdam, J.W. Effects of feeding birdsfoot trefoil hay on neutral detergent fiber digestion, nitrogen utilization efficiency, and lactational performance by dairy cows. J. Dairy Sci. 2015, 98, 7982–7992. [Google Scholar] [CrossRef]
  11. Hunt, S.R.; Griggs, T.C.; MacAdam, J.W. Change in birdsfoot trefoil (Lotus corniculatus L.) nutritive value with stem elongation, flowering and pod formation. In Proceedings of the European Grassland Federation Change in Birdsfoot Trefoil (Lotus corniculatus) Nutritive Value with Stem Elongation, Flowering and Pod Formation, Aberystwyth, Wales, 7–11 September 2014; Hopkins, A., Ed.; Grassland Science in Europe: Aberystwyth, Wales, 2014; pp. 884–886. [Google Scholar]
  12. Hunt, S.R.; MacAdam, J.W.; Griggs, T.C. Lignification and tannin localization during the development of birdsfoot trefoil stems. Crop. Sci. 2014, 54, 1876–1886. [Google Scholar] [CrossRef]
  13. Dewhurst, R.J. Milk production from silage: Comparison of grass, legume and maize silages and their mixtures. Agric. Food Sci. 2013, 22, 57–69. [Google Scholar] [CrossRef] [Green Version]
  14. Archimède, H.; Eugène, M.; Marie Magdeleine, C.; Boval, M.; Martin, C.; Morgavi, v.; Lecomte, P.; Doreau, M. Comparison of methane production between C3 and C4 grasses and legumes. Anim. Feed Sci. Technol. 2011, 166–167, 59–64. [Google Scholar] [CrossRef]
  15. Beauchemin, K.A.; Henry Janzen, H.; Little, S.M.; McAllister, T.A.; McGinn, S.M. Life cycle assessment of greenhouse gas emissions from beef production in western Canada: A case study. Agric. Syst. 2010, 103, 371–379. [Google Scholar] [CrossRef]
  16. MacAdam, J.W.; Villalba, J.J. Beneficial Effects of Temperate Forage Legumes that Contain Condensed Tannins. Agriculture 2015, 5, 475–491. [Google Scholar] [CrossRef] [Green Version]
  17. Chail, A.; Legako, J.F.; Pitcher, L.R.; Griggs, T.C.; Ward, R.E.; Martini, S.; MacAdam, J.W. Legume finishing provides beef with positive human dietary fatty acid ratios and consumer preference comparable with grain-finished beef. J. Anim. Sci. 2016, 94, 2184–2197. [Google Scholar] [CrossRef] [PubMed] [Green Version]
  18. Lees, G.L.; Howarth, R.E.; Goplen, B.P. Morphological characteristics of leaves from some legume forages: Relation to digestion and mechanical strength. Can. J. Bot. 1982, 60, 2126–2132. [Google Scholar] [CrossRef]
  19. Waghorn, G.C.; Ulyatt, M.J.; John, A.; Fisher, M.T. The effect of condensed tannins on the site of digestion of amino acids and other nutrients in sheep fed on Lotus corniculatus L. Br. J. Nutr. 1987, 57, 115–126. [Google Scholar] [CrossRef] [PubMed] [Green Version]
  20. Jensen, K.B.; Waldron, B.L.; Larson, S.R.; Peel, M.D. Registration of ‘Cache’ Meadow Bromegrass. Crop Sci. 2004, 44, 2263–2264. [Google Scholar] [CrossRef]
  21. Stewart, E.K.; Beauchemin, K.A.; Dai, X.; MacAdam, J.W.; Christensen, R.G.; Villalba, J.J. Effect of tannin-containing hays on enteric methane emissions and nitrogen partitioning in beef cattle. J. Anim. Sci. 2019, 97, 3286–3299. [Google Scholar] [CrossRef] [PubMed]
  22. Zhang, Y.; MacAdam, J.W.; Villalba, J.J.; Dai, X. In vitro digestibility of mountain-grown irrigated perennial legume, grass and forb forages is influenced by elevated non-fibrous carbohydrates and plant secondary compounds. J. Sci. Food Agric. 2021, 101, 334–340. [Google Scholar] [CrossRef]
  23. Dewhurst, R.J.; Delaby, L.; Moloney, A.; Boland, T.; Lewis, E. Nutritive value of forage legumes used for grazing and silage. Ir. J. Agric. Food Res. 2009, 48, 167–187. [Google Scholar]
  24. Villalba, J.J.; Ates, S.; MacAdam, J.W. Non-fiber Carbohydrates in Forages and Their Influence on Beef Production Systems. Front. Sustain. Food Syst. 2021, 5, 566338. [Google Scholar] [CrossRef]
  25. MacAdam, J.W.; Hunt, S.R. Using a Rising Plate Meter to Determine Paddock Size for Rotational Grazing; Utah State University: Logan, UT, USA, 2015. [Google Scholar]
  26. Pinares-Patiño, C.S.; Franco, F.E.; Molano, G.; Kjestrup, H.; Sandoval, E.; MacLean, S.; Battistotti, M.; Koolaard, J.; Laubach, J. Feed intake and methane emissions from cattle grazing pasture sprayed with canola oil. Livest. Sci. 2016, 184, 7–12. [Google Scholar] [CrossRef]
  27. Box, L.A.; Edwards, G.R.; Bryant, R.H. Milk production and urinary nitrogen excretion of dairy cows grazing plantain in early and late lactation. N. Z. J. Agric. Res. 2017, 60, 470–482. [Google Scholar] [CrossRef]
  28. AOAC. Official Methods of Analysis of the AOAC, 15th ed.; Association of Analytical Chemists: McLean, VA, USA, 1990. [Google Scholar]
  29. AOAC. Official Method of Analysis, 19th ed.; Association of Analytical Chemists: Washington DC, USA, 2012. [Google Scholar]
  30. Goering, H.K.; Van Soest, P.J. Forage Fiber Analyses; USDA Agricultural Research Service: Washington, DC, USA, 1970.
  31. Peters, J. Wisconsin Procedures for Soil Testing, Plant Analysis and Feed & Forage Analysis; University of Wisconsin: Madison, WI, USA, 2013. [Google Scholar]
  32. NRC. Nutrient Requirements of Dairy Cattle, 7th ed.; National Research Council, National Academies Press: Washington, DC, USA, 2001. [Google Scholar]
  33. Undersander, D.; Moore, J.E. Relative Forage Quality. Focus Forage Wis. Coop. Ext. 2002, 4, 1–2. [Google Scholar]
  34. Van Soest, P.J.; Robertson, J.B.; Lewis, B.A. Methods for Dietary Fiber, Neutral Detergent Fiber, and Nonstarch Polysaccharides in Relation to Animal Nutrition. J. Dairy Sci. 1991, 74, 3583–3597. [Google Scholar] [CrossRef]
  35. Weiss, W.P.; Conrad, H.R.; St. Pierre, N.R. A theoretically-based model for predicting total digestible nutrient values off orages and concentrates. Anim. Feed Sci. Technol. 1992, 39, 95–110. [Google Scholar] [CrossRef]
  36. Grabber, J.H.; Zeller, W.E.; Mueller-Harvey, I. Acetone enhances the direct analysis of procyanidin and prodelphinidin-based condensed tannins in Lotus species by the butanol−HCl−iron assay. J. Agric. Food Chem. 2013, 61, 2669–2678. [Google Scholar] [CrossRef]
  37. Hagerman, A.E. Extraction of phenolics from plants, Sephadex LH 20 and separation of tannin from non-tannin phenolics. In The Tannin Handbook; Miami University: Oxford, OH, USA, 2011. [Google Scholar]
  38. Johnson, K.; Huyler, M.; Westberg, H.; Lamb, B.; Zlmmerman, P. Measurement of Methane Emissions from Ruminant Livestock Using a SF6 Tracer Technique. Environ. Sci. Technol. 1994, 28, 359–362. [Google Scholar] [CrossRef]
  39. Johnson, K.A.; Westberg, H.H.; Michal, J.J.; Cossalman, M.W. The SF6 Tracer Technique: Methane Measurement from Ruminants. In Measuring Methane Production from Ruminants; Springer: Dordrecht, The Netherlands, 2007; pp. 33–67. [Google Scholar]
  40. Williams, S.R.O.; Moate, P.J.; Hannah, M.C.; Ribaux, B.E.; Wales, W.J.; Eckard, R.J. Background matters with the SF6 tracer method for estimating enteric methane emissions from dairy cows: A critical evaluation of the SF6 procedure. Anim. Feed Sci. Technol. 2011, 170, 265–276. [Google Scholar] [CrossRef]
  41. Fenton, T.W.; Fenton, M. An improved procedure for the determination of chromic oxide in feed and feces. Can. J. Anim. Sci. 1979, 59, 631–663. [Google Scholar] [CrossRef]
  42. Parker, W.J.; McCutcheon, S.N.; Carr, D.H. Effect of herbage type and level of intake on the release of chromic oxide from intraruminal controlled release capsules in sheep. N. Z. J. Agric. Res. 1989, 32, 537–546. [Google Scholar] [CrossRef]
  43. Kolver, E.S.; Muller, L.D. Performance and Nutrient Intake of High Producing Holstein Cows Consuming Pasture or a Total Mixed Ration. J. Dairy Sci. 1998, 81, 1403–1411. [Google Scholar] [CrossRef]
  44. Bargo, F.; Muller, L.D.; Delahoy, J.E.; Cassidy, T.W. lk Response to Concentrate Supplementation of High Producing Dairy Cows Grazing at Two Pasture Allowances. J. Dairy Sci. 2002, 85, 1777–1792. [Google Scholar] [CrossRef] [Green Version]
  45. Kohn, R.A.; Dinneen, M.M.; Russek-Cohen, E. Using blood urea nitrogen to predict nitrogen excretion and efficiency of nitrogen utilization in cattle, sheep, goats, horses, pigs, and rats. J. Anim. Sci. 2005, 83, 879–889. [Google Scholar] [CrossRef] [PubMed] [Green Version]
  46. Getachew, G.; Robinson, P.H.; DePeters, E.J.; Taylor, S. Relationships between chemical composition, dry matter degradation and in vitro gas production of several ruminant feeds. Anim. Feed Sci. Technol. 2004, 111, 57–71. [Google Scholar] [CrossRef]
  47. Allen, M.S. Physical constraints on voluntary intake of forages by ruminants. J. Anim. Sci. 1996, 74, 3063–3075. [Google Scholar] [CrossRef] [PubMed] [Green Version]
  48. Meyer, K.; Hummel, J.; Clauss, M. The relationship between forage cell wall content and voluntary food intake in mammalian herbivores. Mammal Rev. 2010, 40, 221–245. [Google Scholar] [CrossRef] [Green Version]
  49. Angela, R.; Moss, A.R.; Jouany, J.-P.; Newbold, J. Methane production by ruminants: Its contribution to global warming. Ann. Zootech. 2000, 49, 231–253. [Google Scholar]
  50. Johnson, K.A.; Johnson, D.E. Methane emissions from cattle. J. Anim. Sci. 1995, 73, 2483–2492. [Google Scholar] [CrossRef]
  51. Undersander, D.; Albert, B.; Cosgrove, D.; Johnson, D.; Peterson, P. Pastures for Profit: A Guide to Rotational Grazing; University of Wisconsin Cooperative Extension and University of Minnesota Extension Service; Cooperative Extension Publishing, University of Wisconsin-Extension: Madison, WI, USA, 2002. [Google Scholar]
  52. Sun, X.; Henderson, G.; Cox, F.; Molano, G.; Harrison, S.J.; Luo, D.; Janssen, P.H.; Pacheco, D. Lambs Fed Fresh Winter Forage Rape (Brassica napus L.) Emit Less Methane than Those Fed Perennial Ryegrass (Lolium perenne L.), and Possible Mechanisms behind the Difference. PLoS ONE 2015, 10, e0119697. [Google Scholar] [CrossRef]
  53. Woodward, S.L.; Waghorn, G.C.; Laboyrie, P.G. Condensed tannins in birdsfoot trefoil (Lotus corniculatus) reduce methane emissions from dairy cows. Proc. N. Z. Soc. Anim. Prod. 2004, 64, 160–164. [Google Scholar]
  54. Moreira, G.D.; Lima, P.D.M.T.; Borges, B.O.; Primavesi, O.; Longo, C.; McManus, C.; Abdalla, A.; Louvandini, H. Tropical tanniniferous legumes used as an option to mitigate sheep enteric methane emission. Trop. Anim. Health Prod. 2013, 45, 879–882. [Google Scholar] [CrossRef]
  55. Wang, S.; Terranova, M.; Kreuzer, M.; Marquardt, S.; Eggerschwiler, L.; Schwarm, A. Supplementation of pelleted hazel (Corylus avellana) leaves decreases methane and urinary nitrogen emissions by sheep at unchanged forage intake. Sci. Rep. 2018, 8, 5427. [Google Scholar] [CrossRef] [PubMed]
  56. Hristov, A.N.; Bannink, A.; Crompton, L.A.; Huhtanen, P.; Kreuzer, M.; McGee, M.; Nozière, P.; Reynolds, C.K.; Bayat, A.R.; Yáñez-Ruiz, D.R.; et al. Invited review: Nitrogen in ruminant nutrition: A review of measurement techniques. J. Anim. Sci. 2018, 102, 5811–5852. [Google Scholar] [CrossRef] [PubMed] [Green Version]
  57. Hall, W.B.; Rickert, K.G.; McKeon, G.M.; Carter, J.O. Simulation studies of nitrogen concentration in the diet of sheep grazing Mitchell and mulga grasslands in western Queensland. Aust. J. Agric. Res. 2000, 51, 163–172. [Google Scholar] [CrossRef]
  58. Farghaly, M.M.; Abdullah, M.A.M.; Youssef, M.I.M.; Abdel-Rahim, I.R.; Abouelezz, K. Effect of feeding hydroponic barley sprouts to sheep on feed intake, nutrient digestibility, nitrogen retention, rumen fermentation and ruminal enzymes activity. Livest. Sci. 2019, 228, 31–37. [Google Scholar] [CrossRef]
  59. Tripathi, M.K.; Chaturvedi, O.H.; Karim, S.A.; Singh, V.K.; Sisodiya, S.L. Effect of different levels of concentrate allowances on rumen fluid pH, nutrient digestion, nitrogen retention and growth performance of weaner lambs. Small Rumin. Res. 2007, 72, 178–186. [Google Scholar] [CrossRef]
Figure 1. Plot plan of the grazing study. Cattle were assigned to one of fifteen plots between 2014 and 2018 and rotationally grazed for 7 to 12 weeks depending on the year. Yellow circles indicate irrigation risers.
Agronomy 12 00304 g001
Figure 2. (a) Temperature and (b) precipitation (columns) and evapotranspiration demand (lines) for 2014–2016 and (c) temperature and (d) precipitation and evapotranspiration demand for 2017 and 2018.
Agronomy 12 00304 g002
Figure 3. (ad) Least squares means (LSMEANS) of daily dry matter intake (DMI) based on forage quality and body weight and (eg) methane (CH4) emissions as a function of DMI for (a,e) pregnant cows (653 kg) in 2014, (b,f) yearling calves (439 kg) in 2015, (c) dry cows (659 kg) in 2016 and (d,g) 2-year-old heifers (562 kg) in 2017–2018 on the three pasture treatments (BFT, birdfoot trefoil; CMV, cicer milkvetch; MBG, meadow bromegrass) and on a confinement total mixed ration (TMR) in 2017 and 2018. Data for DMI and CH4 were analyzed separately for 2014 and 2015 and combined for 2017 and 2018; no CH4 data were collected in 2016. Error bars are standard errors of the estimate. LSMEANS for each treatment within each year with the same letter are not different at ⍺ = 0.05 (ac). Error bars represent ± SEM.
Agronomy 12 00304 g003
Table 1. Details of cattle used in the grazing study along with grazing start and end dates. Values for 2017 and 2018 include the confinement treatment.
YearBreedStatusn Per Spatial
Replication
Initial and Final Body
Weight, kg
Start-End Date
2014AngusPregnant cows1617 (±8.4) to 689 (±15.9)9 June–22 August
2015AngusYearlings2, 2 reps414 (±9.7) to 413 (±9.3)6 July–21 August
2015CharolaisYearlings2, 3 reps462 (±9.3) to 450 (±9.7)6 July–21 August
2016AngusDry cows1654 (±19.2) to 664 (±17.4)31 May–12 August
2017Angus2-year-old heifers1504 (±6.7) to 542 (±7.8)22 May–17 August
2018Angus2-year-old heifers1587 (±12.9) to 614 (±13.4)29 May–22 August
Table 2. Grazing period forage nutritive value characteristics determined using near infrared spectroscopy (NIRS).
CPaNDFADFFatLigninAshIVTDMDNFCTDNCT
Species 2g kg−1 DM
2014
BFT271 a188 b188 b24 b62 a85 c942 a432 a778 a22.14 a
CMV254 b186 b173 c23 c60 a89 b924 b444 a754 b2.84 b
MBG178 c492 a311 a40 a35 b126 a862 c185 b572 c3.10 b
2015
BFT219 b324 b271 b14 b67 a59 c790 b382 b708 b15.12 a
CMV258 a244 c220 c14 b59 b76 b912 a415 a773 a2.44 b
MBG199 c531 a317 a24 a31 c92 a805 b169 c663 c3.32 b
2016
BFT201 b325 b251 b16 b60 a52 b803 b406 a735 a16.41 a
CMV228 a289 c243 b14 c57 b68 a867 a400 a744 a1.91 b
MBG139 c583 a354 a25 a39 c70 a749 c194 b619 b1.73 b
2017
BFT206 b333 b237 b20 b49 ab62 ab863 b387 ab745 a19.29 a
CMV253 a250 c211 c18 c45 b78 a915 b408 a775 a1.89 b
MBG129 c568 a348 a27 a51 a40 b766 c232 b618 b1.25 b
Confinement 1147329206243985 4357240.71
2018
BFT200 a310 b233 b23 b57 a60 b827 b401 a754 a12.94 a
CMV226 a261 c225 b15 c64 a73 a870 a429 a765 a0.85 b
MBG73 b639 a406 a37 a49 b66 ab713 c201 b557 b−0.62 b 2
Confinement 1121359248244185 4316800.68
Means
BFT21929623619596484540274417.18
CMV2442462141757778984197621.99
MBG1445633473141797791966061.76
Confinement 1134344227244085 4337020.70
Values in columns within years with different letters are significantly different at p < 0.05. BFT, birdfoot trefoil; CMV, cicer milkvetch; MBG, meadow bromegrass; CP, crude protein; aNDF, neutral detergent fiber determined with the addition of amylase; ADF, acid detergent fiber; IVTDMD, in vitro true dry matter digestibility; NFC, non-fiber carbohydrates; TDN, total digestible nutrients; CT, condensed tannins. 1 Confinement TMR samples are the mean of unreplicated samples for 2 (2017) or 3 (2018) periods. 2 A negative value resulted from absorbance less than that of the assay blank.
Table 3. Mean pre-grazing and post-grazing dry matter (DM), their difference, forage disappearance (SEM) and resulting pasture utilization.
SpeciesPre-GrazingPost-GrazingForage DisappearanceUtilization
kg DM/ha%
2014
BFT4089 (178) a2479 (132) a1113 (124) b27
CMV3781 (165) a2031 (105) b1528 (120) a40
MBG2741 (119) b2038 (148) b1485 (174) a54
2015
BFT4687 (132) b2719 (98) a1998 (139) b43
CMV5345 (132) a2652 (98) a2733 (139) a51
MBG3060 (132) c1396 (98) b1664 (136) b54
2016
BFT5641 (168) b3057 (77) b2584 (140) a46
CMV6398 (168) a3713 (77) a2685 (140) a42
MBG4862 (168) c2805 (77) b2047 (140) b42
2017 and 2018
Period 1
BFT4568 (684) c2547 (402) b2365 (412) b52
CMV7810 (1170) a4242 (670) a3886 (412) a50
MBG6232 (933) b4653 (735) a1705 (412) b27
Period 2
BFT4030 (603) b2821 (446) b1035 (412) b26
CMV6316 (946) a3263 (516) b3012 (412) a48
MBG6126 (917) a4365 (690) a1861 (412) ab30
Period 3
BFT4665 (698) a3022 (478) a1698 (412) a36
CMV5200 (779) a3191 (504) a2004 (412) a39
MBG4747 (711) a3558 (562) a1302 (412) a27
Values in columns within years with different letters are significantly different at p < 0.05. BFT, birdfoot trefoil; CMV, cicer milkvetch; MBG, meadow bromegrass.
Table 4. Intake, retention and output of nitrogen (N) in urine and feces in 2017 and 2018.
BFTCMVMBGConfinement
Dietary N intake, g/d425.57 a449.40 a162.91 b201.60 b
Urinary N output, g/d133.75 a131.38 a54.07 b66.77 b
Fecal N output, g/d97.72 a70.49 b68.15 b101.73 a
Total N excretion, g/d221.89 a200.66 a128.73 b157.93 ab
N retention, g/d202.99 a263.57 a44.30 b42.72 a
Urinary N, % of intake34.15 ab31.87 b42.75 a22.12 c
Fecal N, % of intake25.81 b17.05 c47.98 a41.94 a
Total N excretion, % of intake55.85 bc45.87 c86.82 a64.10 b
N retention, % of intake42.58 a53.65 a27.31 b39.51 ab
Urinary: Fecal N1.21 b1.70 a0.71 c0.53 c
Blood urea N, mg/dL18.24 a19.22 a7.68 b8.96 b
Urinary N, g/L 5.5 a4.8 a2.7 b4.0 ab
Least squares means (LSMEANS) for each treatment within each year with the same letter are not different at ⍺ = 0.05.
Publisher’s Note: MDPI stays neutral with regard to jurisdictional claims in published maps and institutional affiliations.

