Abstract
A field experiment on green pea (Pisum Sativum L.) was conducted under drip irrigation to determine the irrigation schedule based on real-time soil moisture measurements with irrigation treatments (main plots) and fertilizer treatments (sub-plots) in a split-plot design with three replications. Main plots consisted of fourirrigation levels at different matric potential ranges (I1: −20 kPa; I2: −30 kPa; I3: −35 kPa; and I4: −40 kPa), while the sub-plots consisted of three fertigation levels (F1: 120%, F2: 100% and F3: 80%) of recommended dose of fertilizers (40:60:50 kg/ha of NPK). The tensiometer with digital pressure transducer transferred the soil matric potential data to the irrigation controller, which activated the solenoid valves for irrigation. Observations were collected on plant growth parameters, pod yield, and quality parameters. Descriptive statistics of different plant growth parameters were made. The higher SMP threshold (−20 kPa) and lower SMP threshold (−40 kPa) greatly reduced the yield and water-use efficiency. Considering the results, real-time soil moisture-based irrigation at the soil matric potential threshold level of −30 kPa with 120% of recommended dose of fertilizers through fertigation was recommended for attaining maximum green pea pod yield and water-use efficiency under semi-arid Inceptisols.
1. Introduction
Among different vegetables, green pea is an important vegetable being consumed in India. Green pea is a highly nutritive value vegetable crop. This crop is mostly grown during winter season in India. Improper irrigation scheduling with deficit quantity of water has led to water stress in pea production, causing a decrease in the evapotranspiration, growth parameters and pea yield [1]. Harmful effects of improper water management, such asover application of water, deficit application of water, effect of water on soil salinity, water stress, and lack of research to determine the optimum quantity of water in pea production, have been reported by many researchers [1,2,3]. An irrigation moisture regimen for green pea crop is crucial to optimize yield and avoid over-watering. Estimation of soil moisture is the key for irrigation scheduling [4]. The use of soil moisture sensing devices for irrigation scheduling has ensured a low-volume and high-frequency irrigation supply for different vegetable crops. This has overcome the difficulty in employing more laborers as required in case of the traditionally followed surface irrigation system [5]. Few studies have identified the effect of fertilizer levels through drip fertigation methods in green pea production. Application of morefertilizer compared to the recommended dose of fertilizer hasalso been studied by many researchers. However, there is a void in the study of drip fertigation in the cultivation of green pea.
Different varieties of green pea with varying irrigation levels, viz., 50%, 75%, 100%, and 125% ETc were tested under the drip irrigation and found a decrease in the productivity of pea at an excess and deficit irrigation treatments [3]. Green pod yield decreased with an increase in drought conditions, occurringat the vegetative and flowering stages [6]. Hence, sufficient moisture content and proper irrigation scheduling should be ensured for better green pea production.
The effects of irrigation on soil moisture distribution under different soil matric potential need to be studied. Tensiometers are highly accurate instruments and most appropriate tools for measuring the soil matric potential [7,8,9]. The irrigation controller activated the operation of drip irrigation system when the soil moisture potential was below the specified lower limit, and deactivated the irrigation when the soil moisture was above the specified threshold limit [10]. Irrigation at 85% field capacity based on the tensiometer data, and 75% of the recommended fertilizer dose to green pea, increased the yield by 20% and saved water by 16 to 35% under an automated drip irrigation system [11]. Irrigation at different soil matric potential ranges of −20kPa, −40 kPa, and −60 kPa in guava was experimented, and it was found that irrigation at −40 kpawas suited for the better growth of guava plantation [12].
Irrigation scheduling based on real time soil moisture measurement improves yield and water-use efficiency of crops, rather than irrigation scheduling based on climatological approach. Research works on real time soil moisture-based irrigation scheduling in green pea are scant. Thus, the present study was carried out to determine the irrigation scheduling based on real time soil moisture measurement and to evaluate the outcome of growth, yield, and water use-efficiency of green pea under drip irrigation in a sandy loam Inceptisol under semi-arid conditions.
2. Materials and Methods
2.1. Experimental Details
A field experiment was conducted in the experimental plots of Water Technology Centre, Indian Agricultural Research Institute (IARI), New Delhi, during 2020–2021. The weather conditions in New Delhi arecategorized as semi-arid and sub-tropical climate. The salinity of irrigation water was low with EC value of 0.22 dS/m and SAR value of 7.8. Soil properties of the experimental site were studied. The textual composition of the soil was 16:27:57 clay:silt:sand in the top layer of 0–20 cm depth. The RETC model was used to predict the soil hydraulic properties of the experimental field. The values obtained for the soil textural property (57:27:16% of sand:silt:clay) and bulk density (1.43 g.cm−3) from the model were = 0.053; = 0.401; = 0.019; n = 1.448, and Ks Saturated Hydraulic conductivity = 29.45 cm/day. Soil moisture was estimated at different levels of soil matric potential and soil moisture characteristics curve was derived for the experimental field. The soil moisture for different soil matric potential was fitted in Retention curve (RETC) Model and a graph was plotted for assessing the relationship between the observed and fitted values. The observed data were found to be in convergence with the soil water RETention Curve (RETC) modeled data with coefficient of determination (R2) value of 0.994,** which is significant at p < 0.01 level. The field capacity was 24.35%, while the permanent wilting point was 9.15% based on the volumetric basis in the sandy loam Inceptisol where the study was conducted.
2.2. Field Preparation and Seed Sowing
The size of experimental area was 28 m × 30 m. Drip laterals with inline emitter of capacity of 2 L per hour were laid on the raised beds. The green pea seeds (Pusa shree variety) were sown on raised beds of 75 cm size with furrow size of 15 cm with spacing of 30 cm × 10 cm. Pusa shree seeds are produced at Indian Agricultural Research Institute, New Delhi, India. A set of 12 treatments comprising of 4 irrigation treatments and 3 fertigation treatments were tested with 3 replications in a split-plot design. Irrigation levels were superimposed to the main plots, while the fertigation levels were superimposed to the subplots.
2.3. Soil Matric Potential Measurement
The soil matric potential was measured using tensiometers with a digital pressure transducer during the entire crop growth period. A tensiometermeasures the vacuum pressure of soil at the depth it is installed. Tensiometers (Irrometers, size: 30 cm; output: 0.5–5 V DC) were installed in each irrigation level treatments at a depth of 20 cm, which is the effective root zone depth of green pea crop. The digital pressure transducer acted as an electronic sensor to convert the mechanical pressure into an electric signal, and facilitates digital recording of the soil matric potential data continuously. The digital pressure transducer transferred the soil matric potential data to the irrigation controller, which automatically switch on and off the motor and solenoid valves (24 VAC solenoid and flow range 0.7–150 lpm) for irrigation. The data were recorded at hourly interval during a day.
2.4. Details of Irrigation and Fertigation Levels
For proper irrigation scheduling, four matric potential ranges were considered. The soil matric potential limit was programmed in the irrigation control unit. The four irrigation levels, i.e., I1: −20 kPa, I2: −30 kPa, I3: −35 kPa; and I4: −40 kPa were assigned as irrigation levels in the controller unit, and three fertigation levels 120%, 100%, and 80% of recommended NPK fertilizer dose (RDF) were established in drip irrigated plots.Soil moisture content data were observed in the oven dry method for different matric potential ranges and the soil moisture characteristics curve was derived. The soil matric potential at the pressure range of −20 kPa was equivalent to 20% of Maximum Allowable Depletion (MAD) in the experimental field. Similarly, −30 kPa, −35 kPa, and −40 kPa soil matric potential were equivalent to 30% of MAD, 40% of MAD, and 50% of MAD. When the soil moisture reached the specified soil matric potential, irrigation began automatically.
The uniformity distribution of water under drip irrigation was 93.15% and 91.85% before and after experimental season, respectively. The total volume of application of water differed for each of the 4 irrigation treatments. When the soil matric potential reached the specified limit, automatic activation of irrigation took place. The tensiometer sensors were placed at a depth of 20 cm. Since the hydraulic conductivity of soil is 1.4 cm/h, it took several hours to reach the tensiometer sensor tip. In order to enable the gaining of specified soil moisture potential data in the tensiometer, the irrigation time of operation was limited. The irrigation quantity was determined based on the soil moisture content present in each irrigation treatment as given in Equation (1):
where I is the irrigation quantity (mm) to be given; A is the surface area (m2) of each plot; FC is the Field capacity (m3/m3); is the volumetric water content before irrigation; and Z is the effective root zone depth (mm). Based on the depth of water determined under each treatment, the time of operation was controlled after activation of irrigation.Fertigation was given in five split doses on 20th day, 35th day, 50th day, 65th day, and 80th day of sowing through venturi device.
2.5. Plant Growth and Yield Parameters
Different parameters, viz., plant height, number of branches per plant, leaf area index (LAI), number of pods per plant, 100 pods weight, number of seeds per pods, and total soluble solid (TSS) content () of green pea under each treatment were observed. Five plants in each treatment were tagged randomly for observations. The leaf area index per plant was measured from each treatment (five plants per replication) using LAI 2000 LI-COR Plant canopy analyzer. The total green pea pod yield was calculated in all the treatments.
2.6. Water-Use Efficiency
The water-use efficiency (WUE) was determined for each irrigation treatment as given in Equation (2):
2.7. Statistical Analysis
Analysis of variance (ANOVA) of data was carried out in order to determine the effects of main plot treatments, sub-plot treatments, and their interactions using the data generated based on split plot design in the study [13]. Based on Snedecor’s F-test, the effects of treatments were tested at p < 0.05 and p < 0.01 levels of significance [14]. Estimates of correlation between different parameters were derived and tested at p < 0.05 and p < 0.01 levels of significance. Regression model of yield through different variables was calibrated to assess the effects of variables on pea yield [15]. The prediction of yield was assessed based on the coefficient of determination (R2) and standard error of mean (SEM) of predicted yield derived based on a regression model.
3. Results and Discussion
3.1. Soil Matric Potential Range under Different Treatments
The irrigation treatments were superimposed after 20 days of sowing based on the tensiometer reading in each treatment. The depth of water was determined based on the soil moisture depletion rate in order to bring the soil moisture status up to the field capacity level during each irrigation event. The irrigation treatment I1 maintained between −20 kPa and−11 kPa soil moisture tension value, whereas the treatments I2, I3, and I4 maintained the soil moisture tension value between −30 kPa and−11 kPa; −35 kPa and−11 kPa; and −40 kPa and−11 kPa throughout the crop growing season, respectively. When the rainfall occurred continuously for four days, all the soil matric potential readings of treatments reached the same tension value continuously for one week. After this, regular irrigation was provided as per the treatments. The soil moisture tension values observed under different treatments throughout the crop growing season are depicted in Figure 1.
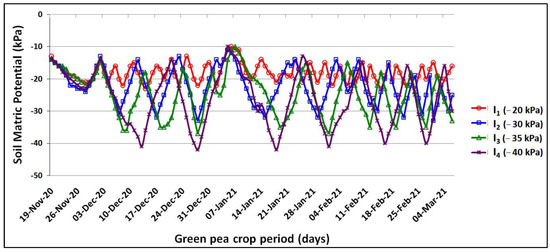
Figure 1.
Soil matric potential range in the treatments I1 (−20 kPa), I2 (−30 kPa), I3 (−35 kPa), and I4 (−40 kPa) during the crop growing period.
3.2. Soil Moisture Distribution under Different Soil Matric Potential
At the SMP threshold of −20 kPa, the soil moisture content was 21.9% (90% of field capacity). Similarly, for the SMP threshold of −30 kPa, −35 kPa, and −40 kPa, the soil moisture content was 20% (80% of field capacity), 18.3% (75% of field capacity), and 16.9% (70% of field capacity), respectively. The distribution of soil moisture content under I1, I2, I3, and I4 treatments throughout the crop growing season is depicted in Figure 2. The plants were found to receive sufficient water when the soil moisture range was below the field capacity and above the permanent wilting point and not more than 50% of maximum allowable depletion range [16]. The volumetric soil water content was studied at different field capacity level of 85%, 75%, and 60% based on soil matric potential measurement by tensiometer in pea crop [11].
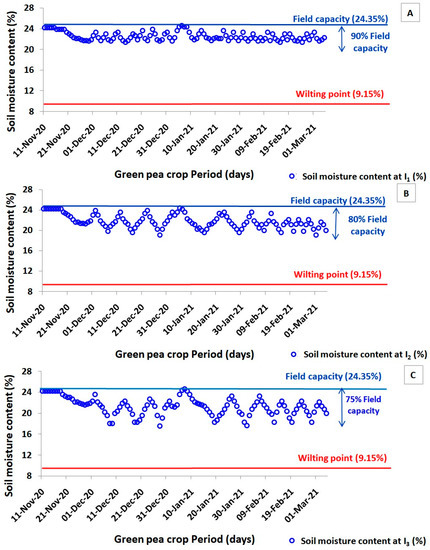
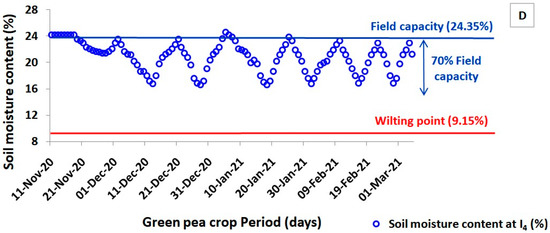
Figure 2.
(A–D) Soil moisture distribution under different soil matric potential I1 (−20 kPa) (A), I2 (−30 kPa) (B), I3 (−35 kPa) (C), and I4 (−40 kPa) (D) treatments throughout the crop growing season.
3.3. Irrigation Scheduling for Green Pea
The effect of different soil matric potential levels on pea crop was studied to determine the irrigation scheduling with an exact depth of irrigation and frequency of irrigation. Observation on volumetric soil moisture content is the prerequisite for proper irrigation scheduling [17]. The depth of irrigation determined for the soil matric potential of −20 kPa (I1), −30 kPa (I2), −35 kPa (I3), and −40 kPa (I4) were 4.9 mm, 8.7 mm, 12.1 mm, and 14.9 mm, respectively, per irrigation cycle in order to bring the soil moisture nearer to the field capacity level. The applied irrigation depth over a period of time is depicted in Figure 3.
Figure 3.
Irrigation depth and Frequency of irrigation at I1 (−20 kPa), I2 (−30 kPa), I3 (−35 kPa), and I4 (−40 kPa).
A similar finding was reported that the amount of irrigation given to all the treatments was constant and the frequency of irrigation varied for tomato cultivation under drip irrigation [8]. The optimal tomato yield was attained under the irrigation treatment scheduled at the soil matric potential level of −20 kPa range in the tensiometer installed at a depth of 20 cm below the emitting point. Higher frequency of drip irrigation kept the root zone at optimum moisture level, which led for good plant growth [18].
3.4. Green Pea Growth, Quality Parameters, and Analysis of Variance
The mean values of plant height, number of branches, and leaf area index (LAI) during the middle stage of the crop, number of pods per plant, length of pod, 100 pods weight, number of seeds per pod, and total soluble solids (°Brix) were determined and are given in Table 1.

Table 1.
Growth and quality parameters of green pea under irrigation and fertigation treatments.
The Analysis of variance (ANOVA) of effects of irrigation and fertigation treatments, and their interaction on different plant growth parameters tested based on Snedecor’s F-test, are given in Table 2. There was a significant difference in the effects of irrigation and fertigation and their interaction on plant height, number of branches, leaf area index, number of pods per plant, 100 pods weight, and total soluble solids. Although the effects of irrigation and fertilizer were significant, there was no significant interaction effect in case of number of seeds per pod. Based on the Least Significant Difference (LSD) criteria at p < 0.05 level of significance, the irrigation and fertilizer treatments, which are significantly superior for different parameters, were identified.
Table 2.
Analysis of variance of effects of irrigation andfertigation treatments, and their interaction on growth andquality parameters of green pea.
The plant height was found to be significantly higher in the irrigation treatment at −30 kPa, followed by −35 kPa, −20 kPa, and −40 kPa treatments. Maximum plant height was attained with 120% of the recommended fertilizer dose through fertigation compared to other doses. The irrigation and fertigation treatments showed significant differences at p < 0.01 level for plant height, number of branches, leaf area index, number of pods per plant, weight of 100 pods, and total soluble solids, whereas the interaction effect showed a significant difference at the p < 0.05 level. The length of pods showed a non-significant difference under different irrigation treatments, whereas the fertigation treatments showed a significant difference at the p < 0.05 level. The fertigation treatments showed a significant difference at the p < 0.01 level for number of seeds per pod. On the whole, irrigation and fertigation treatments showed a significant difference for the plant growth and pod quality parameters (Table 2).
The leaf area index is an important parameter since it decides the level of photosynthetic activity and crop production. Leaf area index is the ratio of total upper leaf surface area of vegetation divided by the surface area of the land. The LAI is related with the photosynthesis process and would vary for different crops [19]. The maximum level of fertilizer application to green pea hassignificantly enhanced the plant height, dry matter, and yield compared to lower levels of fertilizer applied through drip fertigation [20]. From the analysis of ninevarieties of green pea, significant higher number of pods per plant, more pod weight, and higher yield of 18.6 t/ha were obtained in PB-89 pea variety at a low altitude range in the Himalayan region [21]. The authors observed that among different parameters, number of pods per plant was the most determining parameter that significantly influenced the yield.
3.5. Descriptive Statistics of Plant Growth Parameters
The descriptive statistics of different plant growth parameters, viz., minimum, maximum, mean, standard deviation (SD), standard error of mean (SEM), coefficient of variation (CV), skewness, and kurtosis as influenced by the irrigation and fertilizer treatments are given in Table 3. The skewness of parameters indicated that all parameters were symmetrical with lower skewness value in the range of −0.48 for shelling to 0.81 for fresh pods, except LAI, which had a relatively higher skewness value of 1.18. Similarly, all the parameters had a kurtosis value of less than three, which indicated that the parameters had a platy-kurtic distribution.
Table 3.
Descriptive statistics of different plant growth parameters in green pea.
3.6. Effect of Irrigation and Fertilizer Treatments on Pea Yield
The highest yield was found in the irrigation treatment at −30 kPa followed by −35 kPa, −20 kPa, and −40 kPa with 120% of recommended dose of fertilizers. The yield was found higher in the treatment of −30 kPa SMP with 120 percentage RDF (17.9 t/ha). Next best yield was obtained in the treatment of −35 kPa SMP with 120 percentage RDF (15.5 t/ha). The dry pod yield was obtained almost equal in all the treatments. In all the irrigation treatment, 120% of RDF through fertigation recorded higher yield than 100% and 80% of RDF. Fertigation with 80% RDF yield less in the −40 kPa SMP treatment as the frequency of water application was less and the fertilizers could not be taken by the root system due to uneven distribution of moisture content. At −20 kPa SMP treatment, the green pea yield was not obtained maximum at this high soil matric potential range due to high moisture content (90% of field capacity) in the effective root zone. The root growth and function might have been affected by inadequate aeration in the soil. Due to the frequent application of water, the nutrients might have been replaced from the effective root zone depth as well as the oxygen concentration.
In the treatment −30 kPa, the soil moisture regime was kept at 80% of field capacity, which might have enhanced the root uptake of water with good aeration with in the soil registered high yield. Similarly, the treatment −35 kPa showed a better result than −20 kPa and −40 kPa in which 70% of the field capacity was maintained. The treatment −40 kPa did not yield much because of the uneven soil moisture availability in the soil regime with 70% of field capacity (Figure 4). ANOVA table indicated, irrigation treatments and fertigation treatments effects were significant at the 5% probability level (Table 4).
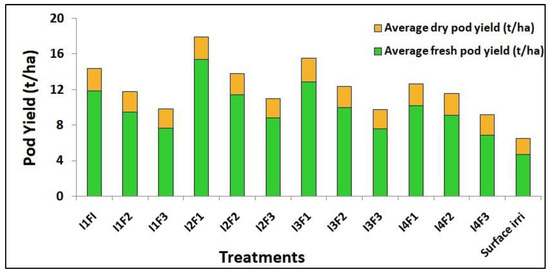
Figure 4.
Effect of irrigation and fertigation treatments on green pea yield.
Table 4.
Statistical analysis of yield and water-use efficiency.
The irrigation and fertigation interaction effect was significant at the 5% level. Maximum pea yield was obtained in the irrigation treatment at 75% of field capacity measured through the automatic tensiometer [11]. Pea yield was 7.75 t/ha under drip irrigation system with higher water saving percentage compared to surface irrigation system [22]. Highest green pea yield of 15.43 t/ha was obtained with 100% of recommended dose of fertilizers with 0.5 Epan irrigation level [23]. Low irrigated water supply to pea plant recorded poor yield due to decreased photosynthetic rate for the study conducted at four different locations in Riyadh city, KSA [24].
3.7. Effect of Irrigation and Fertilizer Treatments on Water-Use Efficiency
The water-use efficiency is the ratio between green pea yield and water applied throughout the crop season. Water-use efficiency indicates the relationship between plant water uptake and crop productivity. The total amount of water added under I1, I2, I3, and I4 treatments was 170.9 mm, 163.1 mm, 159.2 mm, and 153.7 mm, respectively. The maximum value of water-use efficiency (11 kg/m3) was found in I2 (−30 kPa) treatment. Among the real time moisture-based drip irrigation treatment minimum water-use efficiency was recorded in I1 treatment as the yield was minimum with maximum water application. The maximum water-use efficiency for the four irrigation treatments were arranged as I2 > I3 > I4 > I1. The lowest fertigation level (80% of RDF) treatment yielded less water-use efficiency as the yield was less in all the treatments (Figure 5).
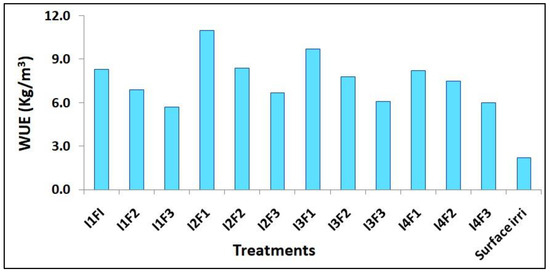
Figure 5.
Water-use efficiency under different treatments.
Total water consumption of green peas was 707 m3 /fed for the whole growing season, and the highest water-use efficiency obtained when scheduling irrigation, based on meteorological data and maximum fertilizer-use efficiency, was 75% of the recommended dose of fertilizer through drip fertigation in green peas [25]. Higher yield, good quality of produce, and maximum water productivity were obtained at the SMP range between −30 kPa and −40 kPa in the vegetable crop compared to higher and lower soil matric potential value [26].
From the result of ANOVA on water-use efficiency, it was confirmed that irrigation treatments and fertigation treatments effects were significant at the 5% probability level (Table 4). The result confirmed that the highest green pea yield and water-use efficiency could be obtained when considering real-time soil moisture status with a drip irrigation system. The irrigation treatment and fertigation treatment had a significant effect at the 1% level, and the interaction effect appeared at the 5% significant level. The irrigation depth at 0.8 cumulative pan evaporation gave a high yield and 0.4 cumulative pan evaporation gave maximum water-use efficiency in green pea [27]. Water-use efficiency was found higher for the green peas grown under the surface drip irrigation system (0.75 kg/m3) and the subsurface drip irrigation system (1.07 kg/m3), than the furrow irrigation system (0.67 kg/m3) [28]. The highest water-use efficiency was recorded in dry pea with higher cropping density compared to other pulse crops [29].
3.8. Estimates of Correlation between Plant Growth Parameters
Estimates of correlation were derived between different pairs of parameters observed in green pea, and are given in Table 5. Fresh pea pod yield, dry pod yield, and shelling percentage were found to have a significant positive correlation with other plant growth parameters. Similarly, other plant parameters also have a significant positive correlation with other plant parameters, as well as with water-use efficiency based on the analysis.
Table 5.
Estimates of correlation between different parameters in green pea.
3.9. Regression Models for Prediction of Yield through Different Parameters
Two regression models of green pea yield through different parameters were calibrated for assessing the predictability of yield and identifying the significant parameters thathave influenced the pea yield. The regression coefficients of different parameters, coefficient of determination (R2), and the standard error of mean (SEM) measured under each regression model are given in Table 6. Under regression model (1) with two parameters, viz., fresh and dry pod yield, and the effects of both fresh pods and dry pods were positive and significant in influencing the total pea yield. The model gave significant coefficient of determination (R2) of 0.980** and standard error of mean of 0.044. Under regression model (2) with eightplant parameters, viz., plant height, no. of branches, LAI, no. of pods, length of pod, pod weight, no. of seeds/pod, and TSS, the total pea yield was found to have a significant predictability with coefficient of determination of 0.962* and SEM of 0.958. Out of eight parameters, the effect number of seeds/pod was negative, while the effects of all the remaining sevenplant parameters were positive. Although the model gave significant R2 value at p < 0.05 level for prediction of yield, the effects of different parameters on yield were found to be non-significant in influencing the yield based on the model.
Table 6.
Regression models for prediction of green pea yield through different parameters.
The analysis indicated that the regression models were useful for significantly predicting the green pea yield through different parameters considered in the study.
4. Conclusions
A study was conducted to test the effects of different combinations of irrigation and fertilizer levels, viz., irrigation at different soil matric potential threshold levels of −20 kPa, −30 kPa, −35 kPa, and −40 kPa; and fertilizer with 120%, 100%, and 80% of recommended fertilizer dose (40:60:50 kg/ha of NPK) on green pea yield during 2020–2021. The volumetric moisture content at different SMP threshold levels was observed throughout the crop growing season. Maximum pod yield (17.9 t/ha) and maximum water-use efficiency (11 kg/m3) were obtained in I2 (−30 kPa) SMP with 120% RDF treatment. Descriptive statistics of different plant growth parameters and water-use efficiency were derived, and an assessment of variability in the data due to varying irrigation and fertigation treatments wasmade. Significant correlations were found to exist between different parameters observed at different levels of irrigation and fertilizer application. Two regression models of green pea yield through different combinations of parameters were calibrated to predict the yield and assess the effects of parameters on yield. The models were assessed based on coefficient of determination (R2) and standard error of mean (SEM) of predicted yield. The models gave significant R2 in the range of 0.962* to 0.987** for prediction of yield. The study indicated that under −30 kPa SMP threshold irrigation treatment, the soil moisture regime from top layer to the depth of 20 cm was always at 80% of field capacity, which enhanced the plant growth and yield with significantly higher moisture content and good aeration in the effective root zone. Based on the findings made in the study, it is recommended that the superior treatment could be adopted by farmers for attaining maximum fresh and dry pea yield, and water-use efficiency under similar soil and agro-climatic conditions. This would greatly benefit the farmers to improve their livelihood under similar soil and agro-climatic conditions in any part of the world.
Author Contributions
Conceptualization, A.K. and S.M.; field trial, A.K., D.F. and P.V.K.; writing—original draft preparation, A.K., writing—review and editing, A.K. and R.J., statistical analysis, M.S.G.R. All authors have read and agreed to the published version of the manuscript.
Funding
This research was funded by Indian Council of Agricultural Research, New Delhi. Ref. No. PGS-II/78-02/PDF/2020-21 dt. 12.10.2020.
Institutional Review Board Statement
Not Applicable.
Informed Consent Statement
Not Applicable.
Data Availability Statement
The data presented in this study are available on request from the author.
Acknowledgments
The research work is part of the Post-Doctoralstudy of the first author at Indian Agricultural Research Institute (IARI), Indian Council of Agricultural Research(ICAR), New Delhi.The authors are grateful to ICAR, and Director, IARI for providing financial support and facilities to conduct the study.
Conflicts of Interest
The authors declare that they have no known competing financial interests or personal relationships that could have appeared to influence the work reported in this paper.
References
- Duzdemir, O.; Kurunc, A.; Unlukara, A. Response of pea (Pisum sativum) to salinity and irrigation water regime. Bulg. J. Agric. Sci. 2009, 15, 400–409. [Google Scholar]
- Alvino, A.; Leone, A. Response to low soil water potential in pea genotypes (Pisum sativum L.) with different leaf morphology. Sci. Hortic. 1993, 53, 21–34. [Google Scholar] [CrossRef]
- Santos, O.F.; Cunha, F.F.; Taira, T.L.; Souza, E.J.; Leal, A.J. Increase in pea productivity associated with irrigation management. Hortic. Bras. 2018, 36, 178–183. [Google Scholar] [CrossRef]
- Gu, Z.; Qi, Z.; Burghate, R.; Yuan, S.; Jiao, X.; Xu, J. Irrigation Scheduling Approaches and Applications: A Review. J. Irrig. Drain. Eng. 2020, 146, 04020007. [Google Scholar] [CrossRef]
- Munoz-Carpena, R.; Dukes, M.D.; Li, Y.C.; Klassen, W. Field comparison of tensiometer and granular matrix sensor automatic drip irrigation on tomato. HortTechnology 2005, 15, 584–590. [Google Scholar] [CrossRef] [Green Version]
- Osman, H.S. Enhancing antioxidant–yield relationship of pea plant under drought at different growth stages by exogenously applied glycine betaine and proline. Ann. Agric. Sci. 2015, 60, 389–402. [Google Scholar] [CrossRef] [Green Version]
- Shock, C.C.; Wang, F.X. Soil water Tension, a powerful measurement for productivity and stewardship. HortScience 2011, 46, 178–185. [Google Scholar] [CrossRef] [Green Version]
- Wang, D.; Kang, Y.; Wan, S. Effect of soil matric potential on tomato yield and water use under drip irrigation condition. Agric. Water Manag. 2007, 87, 180–186. [Google Scholar] [CrossRef]
- Whalley, W.R.; Ober, E.S.; Jenkins, M. Measurement of the matric potential of soil water in the rhizosphere. J. Exp. Bot. 2013, 64, 3951–3963. [Google Scholar] [CrossRef] [Green Version]
- Lailhacar, B.C.; Dukes, M.D.; Miller, G.L. Sensor based automation of irrigation on bermuda grass during dry weather conditions. J. Irrig. Drain. Eng. 2010, 136, 184–193. [Google Scholar] [CrossRef] [Green Version]
- Marwa, M.A.; Abdelraouf, R.E.; Wahba, S.A.; El-Bagouri, K.F.; El-Gindy, A.G. Scheduling Irrigation using automatic tensiometers for pea crop. Agric. Eng. Int. CIGR J. 2017, 19, 174–183. Available online: http://www.cigrjournal.org (accessed on 20 November 2021).
- Khan, J.N.; Jain, A.K.; Singh, V.P.; Kumar, R.; Sharda, R.; Siag, M. Simulation of Mulch and No-Mulch Conditions for Various Soil Matric Potential Thresholds for Drip-Fertigated Guava (Psidium guajava L.) in the Semiarid Region of Northwest India. J. Irrig. Drain. Eng. 2016, 142, 04016040. [Google Scholar] [CrossRef]
- Gomez, K.A.; Gomez, A. Statistical Procedures for Agricultural Research, 2nd ed.; John Wiley Publications Inc.: New York, NY, USA, 1984. [Google Scholar]
- Snedecor, G.W.; Cochran, W.G. Statistical Methods, 8th ed.; Iowa State University Press: Iowa city, IA, USA, 1989. [Google Scholar]
- Draper, N.R.; Smith, H. Applied Regression Analysis; John Wiley Publications Inc.: New York, NY, USA, 1998. [Google Scholar]
- Lozoya, C.; Mendoza, C.; Aguilar, A.; Roman, A.; Castello, R. Sensor-Based Model Driven Control Strategy for Precision Irrigation. J. Sens. 2016, 2016, 9784071. [Google Scholar] [CrossRef] [Green Version]
- Adeyemi, O.; Grove, I.; Peets, S.; Domun, Y.; Norton, T. Dynamic Neural Network Modelling of Soil Moisture Content for Predictive Irrigation Scheduling. Sensors 2018, 18, 3408. [Google Scholar] [CrossRef] [PubMed] [Green Version]
- Satpute, S.T.; Singh, M.; Khanna, M.; Singh, A.K.; Ahmad, T. Response of drip irrigated onion crop to irrigation intervals and fertigation strategies. Indian J. Hortic. 2013, 70, 293–295. [Google Scholar]
- Sadik, S.K.; AL-Taweel, A.A.; Dhyeab, N.S. New computer program for estimating leaf area of several vegetable crops. Am.-Eurasian J. Sustain. Agric. 2011, 5, 304–309. [Google Scholar]
- Singh, K.G.; Siag, M.; Mahajan, G. Irrigation water requirements of green pea. In Best Management Practices for Drip Irrigated Crops; Singh, K.G., Goyal, M.R., Rudra, R.P., Eds.; Apple Academic Press: Boca Raton, FL, USA, 2015; pp. 261–267. [Google Scholar] [CrossRef]
- Sharma, D.; Chauhan, A.; Jarial, K. Performance of Pea Varieties in Different Altitude Ranges under North-Western Himalayan Region. Int. J. Curr. Microbiol. Appl. Sci. 2020, 9, 3292–3302. [Google Scholar] [CrossRef]
- Rao, K.V.R.; Gangwar, S.; Bajpai, A.; Keshri, R.; Chourasia, L.; Soni, K. Performance of pea under different irrigation systems. Legume Res. 2017, 40, 559–561. [Google Scholar] [CrossRef]
- Singh, K.G.; Siag, M.; Mahajan, G. Water and nutrient requirement of drip irrigated green pea. Haryana J. Hortic. Sci. 2006, 35, 320–322. [Google Scholar]
- Ali, A.; Alfarhan, A.; Aldjain, I.; Bokhari, N.; Al-Taisan, W.; Al-Rasheid, K.; Al-Quraishi, S. Photosynthetic responses of pea plants (Pisum sativum L. cv. Little marvel) exposed to climate change in Riyadh city, KSA. Afr. J. Biotechnol. 2008, 7, 2630–2636. [Google Scholar]
- Wahba, S.A.; El-Gindy, A.M.; El-Bagouri, K.F.; Marwa, M.A. Response of Green Peas to Irrigation Automatic Scheduling and Potassium Fertigation. Int. J. ChemTech Res. 2016, 9, 228–236. [Google Scholar]
- Liu, H.; Yin, C.; Gao, Z.; Hou, L. Evaluation of cucumber yield, economic benefit and water productivity under different soil matric potentials in solar greenhouses in North China. Agric. Water Manag. 2021, 243, 106442. [Google Scholar] [CrossRef]
- Saroch, K.; Sandal, S.K.; Rana, K. Effect of irrigation scheduling and NK fertigation on productivity of garden peas (Pisum sativum var. hortenseL.). Himachal J. Agric. Res. 2015, 41, 126–131. [Google Scholar]
- Nassar, A.A.; El Azem, A.A.M. Irrigation Technologies for improving salt distribution, pea production and water relations. Misr J. Agric. Eng. 2006, 23, 1175–1189. [Google Scholar]
- Gan, Y.T.; Wang, J.; Bing, D.J.; Miller, P.R.; McDonald, C.L. Water use of pulse crops at various plant densities under fallow and stubble conditions in a semiarid environment. Can. J. Plant Sci. 2007, 87, 719–722. [Google Scholar] [CrossRef]
Publisher’s Note: MDPI stays neutral with regard to jurisdictional claims in published maps and institutional affiliations. |
© 2022 by the authors. Licensee MDPI, Basel, Switzerland. This article is an open access article distributed under the terms and conditions of the Creative Commons Attribution (CC BY) license (https://creativecommons.org/licenses/by/4.0/).