Article

Evaluation of the Sustainability of Vineyards in Semi-Arid Climates: The Case of Southeastern Spain

by
Begoña García Castellanos
,
Benjamín García García
and
José García García
*
Department of Bioeconomy, Water and Environment, Murcian Institute for Agricultural and Environmental Research and Development (IMIDA), Calle Mayor s/n, La Alberca, 30150 Murcia, Spain
*
Author to whom correspondence should be addressed.
Agronomy 2022, 12(12), 3213; https://doi.org/10.3390/agronomy12123213
Submission received: 8 November 2022 / Revised: 12 December 2022 / Accepted: 12 December 2022 / Published: 18 December 2022
(This article belongs to the Section Farming Sustainability)

Abstract

:
Vineyards in southeastern Spain, although subjected to a semi-arid climate, generate multiple environmental and socioeconomic benefits. However, they have an uncertain future, mainly due to the price of grapes, as well as the limited water resources and the effects of climate change. For this reason, in this work a sustainability evaluation was carried out through life cycle costing analysis (LCC) combined with life cycle assessment (LCA) for four vineyard models characteristic of the area: two rainfed (conventional and organic) and two irrigated (conventional and organic). The greatest differences in the cost structure between the rainfed and irrigated systems are due to the amortization of the infrastructure of the irrigated vineyards, which requires high gross production, via productivity in kilos or in a grape price that prioritizes quality. In addition, the environmental impacts are greater due to this infrastructure. The differences between conventional and organic production for each type of vineyard are of little relevance. The inputs of this crop are minimized, to lower costs, and this entails low economic and environmental costs. However, conventional management entails slightly higher impacts than organic management.

1. Introduction

The wine sector in Spain plays a fundamental role in the economy, as it contributes significantly to GDP (Gross Domestic Product) and job creation. At a global level, Spain has the greatest area of vineyards (915,000 ha) and is also the leader in organic vineyards (121,000 ha). It is the third-largest producer of wine, at around 38 million hL. These facts indicate the socioeconomic relevance of wine production at the national level. The sector generates a gross value added (GVA) of more than 223,700 million euros, equivalent to 2.2% of the Spanish GVA, and sustains around 427,700 jobs [1]. Winemaking in Spain is characterized by being geographically widespread, since wine is produced in practically the entire country. About 150 native grape varieties are grown in the country, which give rise to a wide range of wines. In addition, there is an extensive network of quality indicators: 97 Denominations of Origin (DD.OO), 42 protected geographical indications, and 26 premium wines [1].
The Region of Murcia (southeastern Spain) is situated in an intermediate position in the Spanish national panorama, hosting 2.43% of the total vineyard area (23,251 ha) and 1.94% of the wine production (738,192 hL). Murcia has three DD.OO (Jumilla, Yecla, and Bullas) and one protected geographical indication (Vino de la Tierra “Campo de Cartagena”) [1]. It should be noted that in the regional context this sector plays an important historical–cultural, environmental, economic, and social role. Viticulture in the Region of Murcia produces benefits: environmental, since it preserves the landscape against the advance of desertification, and socioeconomic, linking the population to the territory through the generation of wealth and employment [2,3].
The grape variety Monastrell is grown in around 80% of the vineyards in Murcia, as it is a highly rustic variety with the ability to withstand long periods of drought. It has a medium-high sensitivity to mildew and powdery mildew, and is very resistant to phylloxera, excoriosis, gray rot, and moths [3]. This variety is grafted on a rootstock; the ones most used in Murcia are 161-49 de Couderc, 110 Richter, and 140 Ruggeri. They all confer medium-high resistance to active limestone in the soil and drought, the edaphoclimatic conditions characteristic of this area [3,4].
However, in Murcia, the area occupied by vineyards in 2020 was 21,759 ha, while in 2011 it was 29,791 ha. In other words, in 10 years the area has been reduced by 8032 ha (26.96%). This decrease is fundamentally due to the decrease in the rainfed area, which has declined by 6082 ha (27.38%) in this same period [5]. The irrigated area has been reduced by 25.74%, although in absolute terms the loss of area has been less (1905 ha). This drastic decline in the area devoted to wine grape production is mainly due to the low prices paid for the grapes, which has made many farms economically unviable. Above all, rainfed farms and those with under-resourced irrigation have disappeared, as they are the most vulnerable, both from a production perspective and from a climatological point of view. The reduction of vineyard crops in the region of Murcia in the last decade is linked to a certain profile of the farmers and/or land uses (age, type of farm, method of cultivation of the vineyard, area of the farm, structure of farm ownership, etc.). Unfortunately, we do not have information in this regard.
Another factor, in addition to the low price paid for the grapes, caused by the aforementioned circumstances, is the most widespread form of payment in the southeast of Spain (€ kg−1). This system prioritizes productivity over quality, so that the less productive farms, which are those that produce higher quality grapes (rainfed and under-endowed irrigated land), often fail to reach viability [6,7]. This fact causes (1) a sustained loss in the area of regional vineyards. This represents a serious socioeconomic and environmental problem, since there are few crops that are viable in the face of advancing desertification; (2) an increase in the size of the farms that resist, with an accompanying economy of scale. This has caused the Region of Murcia to have the largest wine grape farms in the country [8]. Even so, the wine sector accounts for approximately 1.57% of the value of agricultural production in the Region of Murcia; it comprises 3308 wine grape growers and 83 wineries [1]. It is important to point out that organic vineyards represent almost 50% of the total vineyard area.
Within Spain, the southeast is considered the area of the country most vulnerable to the impact of climate change, as its edaphoclimatic conditions are very limiting and are becoming more acute. In viticulture, this phenomenon already has an influence on the phenology of the vine and on the composition of the grape berry, with yields being reduced and the concentrations of sugars, acids, and polyphenols being affected. This influences the quality of the wine, producing changes in chemical and microbiological aspects and modifying the organoleptic characteristics [9]. Currently, many farms and wineries in Murcia are taking measures to mitigate and adapt to climate change.
Another problem facing this region is the process of desertification [10,11]. In a semi-arid zone in which water resources are highly limiting [12,13], in terms of both availability and price, it is essential to search for systems and strategies that maximize efficiency and productivity in the use of water [4]. The diversity of water sources used (surface, underground, transfer, reclaimed, desalinated) determines a price that is highly variable from one Irrigation Community to another in Murcia, but the prices are generally high, exceeding, in many cases, €0.30 m−3 [14]. Due to these limitations, regulated deficit irrigation (RDI) and alternative techniques based on it, such as partial root drying (PRD), have been widely tested in various territories of the Region of Murcia and for Monastrell in particular [6,9,15].
The intensification of agriculture during the green revolution meant an increase in productivity, but also converted the agri-food sector into one of the largest consumers of raw materials and energy. The widespread adoption of intensive production systems has resulted in agriculture causing or contributing to various environmental impacts: global warming, potential acidification, depletion of abiotic resources, etc. [16]. In addition, the rate of growth of these impacts is higher than the rate of regeneration of ecosystems, which will generate significant long-term environmental consequences and serious social and economic damage. Currently, in the European Union, this sector is responsible for 10% of greenhouse gas emissions, it is the main source of ammonia emissions (90% of the total produced), and it consumes 40% of the freshwater resources [17,18].
Given this situation, in recent decades consumer awareness of the impacts of the agri-food sector has been increasing. Environmental concern is now a key variable in purchasing processes, and in some cases consumers are willing to pay an added value premium for products that are sustainable [19,20]. This is reflected in the increased consumption of products with eco and bio certifications [21]. In this way, the reduction of these environmental impacts represents one of the most significant challenges for developed countries and is being firmly supported by the European Union through the European Green Deal and the Climate Target Plan for 2030 [22]. These are intended to reduce emissions and to increase renewable energy and energy efficiency.
In relation to this, Life Cycle Assessment (LCA) is a powerful tool that allows evaluation of the environmental impact of a product, service, or process, considering the entire life cycle or a part of it [23]. This methodology has been widely used in agricultural production [24,25], especially in wine grape cultivation [16,26], in order to identify the processes that entail greater environmental impacts, so that cleaner alternatives can be employed to minimize them. In addition, LCA applied together with Life Cycle Cost (LCC) is proving to be a very useful tool to assess sustainability in agricultural production [27,28,29,30,31], as well as in aquaculture [32], since it allows the evaluation of the production and environmental costs in a productive system, so that scenarios can be achieved that allow economic profitability at the lowest possible environmental cost.
The purpose of this work is to evaluate the current sustainability of wine grape cultivation in the three DD.OO in the Region of Murcia, where, as previously stated, cultivation occurs in unique soil and climatic conditions, which are problematic for its viability. To do this, first four vineyard models were established based on the information provided by the wine sector; and second, an economic and environmental analysis was developed, through an LCC and an LCA.

2. Materials and Methods

2.1. Data Collection

This work was carried out within the framework of the Qvalitas Operational Group, made up of the Coordinating Union of Farmers and Ranchers Organizations (COAG) and the wineries Esencia Wine Cellars (Jumilla), Bodegas Castaño (Yecla), and Bodegas del Rosario (Bullas). All are located in the Region of Murcia. These three wineries grow their own crops and represent three very important Designations of Origin in southeastern Spain. From the data collected from these entities and companies in various surveys carried out in situ, four vineyard systems were identified and four production systems were established: (i) conventional rainfed vineyard (CR); (ii) organic rainfed vineyard (OR); (iii) conventional irrigated vineyard with trellis formation (CI); and (iv) organic vines on irrigated land with trellis formation (OI).

2.2. Characterization of the Zone

The production of wine grapes in the Region of Murcia is concentrated in two areas: Altiplano (DO Jumilla and DO Yecla) and Northwest (DO Bullas). These are inland areas with a continental Mediterranean climate, with scarce and irregular rainfall typical of semi-arid areas. The average annual precipitation in the last 20 years in this area is 305 mm, while the evapotranspiration is 1195 mm. The average annual temperature is about 16 °C. Being inland areas, they are not influenced by the sea and have extreme temperatures. In the summer, the temperature frequently exceeds 35 °C, while winters are cold, reaching temperatures below zero (data extracted from [33]). The soils are poor in organic matter, with a high pH, low salinity, and high contents of calcium carbonate and active limestone. Most of them have a clay-loam or sandy-clay loam texture [15,34].
In the Region of Murcia, 96% of the grape production corresponds to red varieties, the most widespread being Monastrell, which occupies 80% of the vineyards of the indicated DD.OO [3,5]. The area dedicated to Monastrell in southeastern Spain represents 99% of the total national area for this variety, it being a very localized variety that has adapted to the arid conditions of this territory. It is grafted on rootstocks, among which are: 161-49 Couderc, 110 Richter, and 140 Ruggeri.

2.3. Establishment of Vineyard Production Systems

This work was carried out within two operating groups in which the partner entities were COAG, Esencia Wine Cellars, Bodegas Castaño, and Bodegas del Rosario. Based on the information provided by these entities, the characteristics of the four vineyard models were established (Table 1).

2.3.1. Rainfed Vineyards

For both rainfed vineyard models in which the vines have a goblet form (CR and OR), the established average holding is 30 ha, with a planting scheme of 2.5 m × 2.5 m. The estimated useful life of the rainfed vineyards is 30 years (Table 1), with two unproductive years of vine establishment and a third year of entry into production, in which production is considered to be 50%. The remaining 27 years are considered fully productive.
In CR, inorganic fertilizers, chemical phytosanitary products, and Bacillus thuringiensis are used, while in OR, manure and formulated organic fertilizers are used; sulfur is the only phytosanitary product applied (Table 1 and Table 2). In OR, iron chelate is used together with humic and fulvic acids. In both cases, herbicides are not used, with weeds being eliminated by cultivation. The two rainfed systems differ in their average production in mature vineyards, being 3500 kg ha−1 for CR and 3250 kg ha−1 for OR, as well as in the fertilizers and phytosanitary products applied (Table 1).
The CR and OR infrastructure consists of a tool shed, while the preparation of the land and planting are also considered, comprising uprooting and collecting the previous vines, clearing the land of stones, refining and leveling, spacing and planting of young vines, and the corresponding grafting.

2.3.2. Irrigated Vineyards

In the two types of irrigated trellis vineyard (CI and OI), a plot of 10 ha was established, with a vine spacing of 3 m × 1.2 m (Table 1). The useful life coincides in both scenarios and is 25 years, with two unproductive years of establishment (in the second year there is partial production, but it is advisable to eliminate bunches to promote vegetative growth). In the third year, the vine enters into regular production; that is, the remaining 23 years are considered fully productive.
In CI, inorganic fertilizers, chemical phytosanitary products, and Bacillus thuringiensis are used, as well as herbicides, while in OI, organic fertilizers are used together with sulfur and potassium hydrogen carbonate as phytosanitary products (Table 1). Both use iron chelate, as well as humic and fulvic acids. The irrigated vineyard scenarios differ in their average productivities, with the conventional one (8000 kg ha−1) being slightly more productive than the organic one (7250 kg ha−1).
The infrastructure or investment required in these two scenarios includes a warehouse for the irrigation head and tools, preparation and planting of the land, an irrigation head, an irrigation network, and a regulating reservoir. The preparation and planting of the land includes ripping out the previous vines with a moldboard plough and their collection, clearing the land of stones, refining and leveling, planting the already grafted vines, and trellising. The trellis used is made up of a formation wire and three vegetation wires. The posts, tensioners, and anchors are made of galvanized steel, and the wires are zinc-aluminum. The selected head is 25 m3 h−1, sized according to the required flow rate and the size of the farm, and includes a booster pump, mixing tanks, and PVC and polyethylene parts. The irrigation network is dimensioned in the same way, with low-density polyethylene pipes (PE BD) and self-compensating drippers with a flow rate of 4 dm3 h−1. The reservoir, built of soil and waterproofed with a high-density polyethylene sheet (HDPE), has the capacity to store half the water required in the month of maximum water demand (in this case, a capacity of 1145 m3).

2.4. Economic Analysis

To comprehensively analyze and compare the scenarios, the economic analysis was subdivided into two parts. First, a financial analysis was carried out for the accounting analytics [35,36], and then a series of indicators of an economic nature [4] were calculated.

2.4.1. Productive Structure of Costs and Income

The financial analysis in the accounting analytics aspect was carried out by establishing the productive cost and income structure of each of the scenarios. It is important to note that this structure was developed for a year in full production. The costs were established first, subdivided into fixed costs (FC) and variable costs (VC) [7,36]. In addition, the opportunity cost was taken into account for each of the costs [7]; that is, the alternative use of money in bank savings accounts without risk was considered. The opportunity cost was calculated using an interest rate of 1.5%, which was determined by subtracting the average inflation of the last 15 years from the average of the Public Debt in this period. The hypothesis of self-financing was considered so as not to introduce financial variables that could affect the comparison of the scenarios. It was assumed that the land is owned, and since it has not depreciated, this concept was not taken into account as a cost.
The fixed costs (FC) are equivalent to the costs derived from the amortization of the investment. The amortizations were calculated using the constant installment method. The final cost of each concept, expressed in € ha−1 yrs−1, includes the corresponding opportunity cost.
  • Rainfed vineyards. In the rainfed vineyard scenarios (CR and OR), the investments coincide, since the farms are identical in terms of the surface area, planting scheme, and plant material. The investments are a warehouse for tools, preparation and planting of the land (uprooting of the previous vines and their collection, clearing the land of stones, refining and leveling, planting of the rootstocks, and grafting), and the auxiliary material (shovels, hoes, scissors, etc.).
  • Irrigated vineyards. Scenarios CI and OI have the same general characteristics, so the investments coincide: a warehouse for tools, a header, preparation and planting of the land (uprooting with a moldboard plough of the previous vines and their collection, clearing the land of stones, refining and levelling, planting of the already grafted vines, and the trellis, including its installation cost), auxiliary material (shovels, hoes, scissors, etc.), irrigation head, irrigation network, and regulating reservoir.
The irrigation head is sized according to the flow required by the emitters (per unit of surface area) and the size of the farm. The irrigation network is dimensioned in the same way, with polyethylene pipes (63 mm and 16 mm in diameter) and self-compensating drippers (4 dm3 h−1). To dimension the reservoir, it is considered that it has the capacity to store half of the water required for the month of maximum water demand.
The variable costs (VC) are those that can vary from one production cycle to another. In this case the costs are for fertilizers, phytosanitary products, and tasks such as pruning. The machinery was accounted for as a variable cost, since it is considered that the farms do not have their own machinery but rather contract external services.
Next, the necessary factors in each production cycle are detailed, when the plantation has reached its average production as a mature vineyard. All the final costs of the factors of production in each scenario include the opportunity cost.
  • Production insurance. To establish the cost of the insurance, the report “Average cost of insurance in the Autonomous Community of Murcia”, published by Agroseguro, was used [37]. In vine cultivation, the insurance depends on the selection of cover for hail or for hail and other adversities. For this work, the most common coverage, hail (0.024 € kg−1), was chosen, with the cost of the insurance being a premium based on the average production [37].
  • Pruning. This refers to the cost of the labor associated with the pruning, carried out manually. In all scenarios, annual winter pruning is carried out, and in irrigated areas green pruning is also carried out to eliminate excess biomass. The prunings are crushed between the rows of vines and incorporated into the soil, due to the agronomic and economic advantages [38].
  • Machinery. It was considered that the farms contract external services. Therefore, the cost of machinery was accounted for based on the unit market cost. Each job includes tractors, implements, and labor. The machinery involved in the harvest was accounted for as a harvesting cost.
  • Fertilizers. The fertilizer units used to calculate the amounts of fertilizer required were 20-12-35 (N-P2O5-K2O) for rainfed land and 42-23-73 (N-P2O5-K2O) for irrigated land (Table 1). These values were quantified based on the optimum balance for vineyards derived from fertilization programs recommended by [39], as well as a specific bibliography on Monastrell grape cultivation in southeastern Spain [4,40]. In CR, inorganic fertilizers are applied to the soil (Table 2). In OR, according to surveys, the most frequent method is to use sheep/goat manure, which is applied every 4 years, and an organic pellet fertilizer every 2 years. In CI, mineral fertilizers, iron chelate, and humic and fulvic acids are applied through fertigation. In OI, organic pellets are supplied every 2 years, as well as iron chelate and humic and fulvic acids through fertigation.
  • Phytosanitary practices. A standard treatment program was established for each of the scenarios, whose products and quantities are shown in Table 2. The most common practice, for both rainfed and irrigated land, is to carry out four annual treatments, which coincide with or are close to the following phenological stages: (1) budding (10–15 cm); (2) beginning of flowering; (3) pea-size grain; (4) beginning of veraison.
  • Herbicides. Herbicides are only used in the CI vineyard (Table 2), in which two annual treatments are carried out during the vegetative period. In the other types of vineyards, tillage is practiced. For the application of herbicides, a tank is used to which two sprayers are attached. Two operators use these to spray both rows of each lane. The herbicide used is glyphosate; despite its danger, it is still the most widely used due to its effectiveness and low cost.
  • Harvesting. This is carried out manually, and a tractor with a trailer is used to transport the grapes from the farm to the winery. In this way, the item “harvesting” accounts for the manual and mechanical means required for the harvest.
  • Maintenance. The cost of the maintenance is calculated as a percentage (1.50%) of the cost of the fixed assets: the warehouse, the head, and the irrigation installation (the latter two exclusively in CI and OI).
  • Permanent staff. The most frequent tenure regime for vineyards in Murcia is ownership. The owner usually works on the farm in tasks related to management and the production process, such as acquisition of production factors, irrigation programming, where appropriate, contracting external workers, and supporting them (harvesting, pruning, etc.). The owner is a figure similar to that of a manager of a farm belonging to a company. This concept is reflected as a cost in hours per hectare and year.
  • Water (irrigation). The irrigation programs were designed using data from three SIAM [33] agrometeorological stations: JU12 (Cañada del Judío), JU71 (Las Encebras), and JU81 (Román). The irrigation allocations were obtained through the calculation of the water demand for an average year, and an RDI strategy was applied [4,6,15]. The annual allocation of the irrigated vineyards is 1230 m3 ha−1 (Table 2).
  • Electric power. This is the power consumed by the irrigation head in the distribution of water. It was calculated based on the flow rate, irrigation hours, average manometric height, and unit cost of energy.
The total income (TI) for each of the scenarios was obtained based on the production, the Baumé degrees of the grapes, and the average annual sales price (€ kg °Baumé−1) of the Monastrell grape paid in the period 2017–2019 in the Region of Murcia. Baumé degree is used to measure concentrations of solutions, so that 1 Baumé degree (°Baumé) corresponds to 25 g sugar dissolved in 1 L of must.

2.4.2. Economic Indicators

Once the production structure of the costs and income of each of the alternatives had been established and analyzed, a series of indicators of an economic nature were calculated in order to deepen the analysis and comparison of the vineyard models. To do this, it was necessary to first calculate the Net Margin (NM) [31,41] as the difference between the Total Income and Total Costs (TC), using the following formula (all parameters expressed in € ha−1):
NM = Income − (Fixed Costs + Variable Costs + Opportunity Costs)
The economic indicators used in this work are
  • NM/investment (NM/K0) (%): profitability in the long term;
  • NM/variable costs (NM/c) (%): short-term return on invested capital;
  • NM/total cost (NM/C) (%): global profitability of the productive activity;
  • Viability threshold (VT) (€ ha−1): minimum price of the grape for the activity to be viable;
  • Break-even point (BP) (kg ha−1): minimum production, under the conditions of the grape’s average market price, for the activity to be viable.

2.5. Socio-Territorial Analysis

To carry out the socio-territorial analysis of the scenarios, three indicators were used.
  • Agricultural Work Unit (AWU ha−1): this indicates the generation of employment for each hectare. To establish the employment generated, the work involved in the agricultural tasks was calculated. In the Region of Murcia, an agricultural work unit (AWU) corresponds to 1800 h.
  • Contribution to the regional economy (CRE): equal to the unit income (€ ha−1). This indicator is of a social nature, since it measures the gross economic productivity of agricultural activity, which has repercussions for the environment and the rural population.
  • Area threshold (AT): this shows the minimum area (ha) for the farm to be viable. It is calculated at the break-even point (Total Income = Total Cost).

2.6. Life Cycle Assessment

Life cycle assessment (LCA) is a standardized method [23,42] that estimates the potential environmental impacts throughout the entire life cycle of a product, from the extraction of raw materials to the final disposal. It consists of four stages: (1) the definition of the objective and scope; (2) inventory; (3) impact analysis; and (4) interpretation.

2.6.1. Objective and Scope

The objective of this LCA was to evaluate and compare, in environmental terms, the four vineyard models established for the three DD.OO of the Region of Murcia. At the same time, the intention was to provide the scientific community with information on the potential impacts due to the cultivation of the Monastrell grape in the semi-arid climate of southeastern Spain and also to provide information to viticulturists and technicians in the sector so that they can reduce the environmental burdens of vine cultivation. The functional unit (FU) is 1 kg of grapes; therefore, the inventory data as well as the results of the potential environmental impacts are relative to this. The scope, in this case, focuses exclusively on the cultivation phase. Since the system only produces grapes, it is treated as a monofunctional system, so environmental load allocation procedures are not applied. The following components of the system were taken into account:
  • Infrastructure. This corresponds to the investment and fixed assets of the LCC. This includes fuel consumed by machinery during land preparation and planting operations and its emissions to the atmosphere. In the case of the irrigated vineyards (CI and OI), the elements related to fertigation are also contemplated: the reservoir, irrigation head, and irrigation network.
  • Machinery. The fuel consumed by the agricultural machinery in the various tasks, as well as its emissions.
  • Fertigation. The electrical energy consumed by the water booster pumps in the localized irrigation.
  • Fertilizers. The production of inorganic and organic fertilizers, their transport and packaging, and emissions into the air due to the application of nitrogenous compounds to the soil.
  • Phytosanitary products. The production of the phytosanitary products and herbicides as well as their transport and packaging.
  • Waste treatment. The treatment of infrastructure (metals and plastics) and plastic containers for fertilizers and phytosanitary products. Currently, both plastic and metal items are recycled at a rate of at least 90%.
In the LCA, the useful life of the distinct types of vineyard and the productive and non-productive years were taken into account. For the infrastructure, the useful life of the different materials was also considered (Table 1). To carry out the LCA, SimaPro 9.4 software (developed by Pré Sustainability) was used [43]. The background data (energy, fuel, materials, products, etc.) were obtained from the Ecoinvent 3.8 database, which is available in the aforementioned software.

2.6.2. Life Cycle Inventory

This is the second phase of the LCA and consists of collecting all the data related to the components of the process that can cause an environmental impact. The foreground data, as indicated in Section 3.1.1, are based on information provided by the companies shown in Table 1 and Table 2. However, Table 3 shows all the inventory inputs relativized to the FU.
For the background data (raw materials, energy, fuel, materials, products, and transportation), the processes of the Ecoinvent 3.8 database were used. Iron chelate and humic and fulvic acids were not taken into account since there are no unitary processes in this database; in any case, the amounts applied are very low in relation to the other organic and inorganic compounds. Bacillus thuringiensis was not taken into account either for the same reason. The emissions resulting from the consumption of diesel by the agricultural machinery were estimated based on the emission factors established by [44]. The emissions into the atmosphere due to the application of nitrogenous fertilizers were estimated based on the following sources: NH3 and NO2 according to [44]; direct and indirect N2O emissions as described by del Hierro et al. [45] and according to IPCC [46]. Nitrate leaching was considered to be zero since the average annual precipitation is much lower than the evapotranspiration [47], as described in Section 2.2; in the irrigated vineyards, water is provided by localized irrigation with very low daily allocations [31].
The waste generated consists of pruning waste, plastic containers of fertilizers and phytosanitary products, and the different materials that make up the infrastructure (polyethylene in the irrigation network, metals in the trellis, etc.). The prunings are generally crushed and incorporated into the soil, so they are not counted. Currently, the rest of the materials are recycled, although in this work it has been considered that 10% ends up in landfill.

2.6.3. Life Cycle Impact: Assessment and Interpretation

For the characterization of the potential environmental impacts, the CML-IA Baseline 4.7 (August 2016) midpoint methodology (available in SimaPro) was used. This has been applied widely in LCA for agri-food products [29,31,48,49,50,51], including aquaculture [32,52,53]. The impact categories used were abiotic depletion (AD), abiotic depletion fossil fuels (ADFF), global warming (GW), ozone layer depletion (OLD), human toxicity (HT), fresh water aquatic ecotoxicity (FWAE), marine aquatic ecotoxicity (MAE), terrestrial ecotoxicity (TE), photochemical oxidation (PO), acidification (A), and eutrophication (E).
To interpret the results, a contribution analysis was carried out to calculate the percentage contribution of each of the different components of the scenario to each impact category. In addition, the overall contribution was used; this shows how each component of the system contributes to all of the impacts [31,32,52,53]. The relative difference (%) between the values of the potential environmental impacts obtained for the different vineyard models was also used.

3. Results and Discussion

3.1. Economic Analysis

3.1.1. Productive Structure of Costs and Income

The FC are shown in Table 4 and are those derived from the amortization of the investment. The VC that are linked to the annual production cycle are also shown. Table 5 shows the income, which was calculated based on the production, Baumé degrees, and the price of the grapes in € kg °Baumé−1. Once the costs and income were obtained, the NM of the scenarios was calculated, which was subsequently necessary to calculate the indicators.
In Table 4, it can be seen that the FC are identical for both rainfed vineyard scenarios with vines having a goblet form, since in CR and OR they coincide, both in general characteristics and in the investment made. The same occurs in the irrigated vineyard scenarios. However, the FC of the latter are approximately five times higher than the FC of the rainfed vineyard scenarios. This is essentially due to the items that make up the irrigation system (irrigation head, irrigation network, and reservoir) and the preparation and planting of the land (trellis). These items represent a total of 19% and 21% of the TC for CI and OI, respectively. The greater FC of the irrigated systems for the aforementioned reasons is in line with other authors [54,55,56]. All this indicates that it is the system (rainfed or irrigated) and not the type of management (conventional or organic) that establishes the differences in the cost structure, with high FC for irrigation.
The VC of the irrigated vineyard scenarios (Table 4) are practically double those of the rainfed vineyard scenarios. This is mainly due to the greater vigor and productivity of irrigated plantations, which causes the costs of items directly related to these aspects to rise (such as insurance, pruning, harvesting, etc.) [4]. Greater vigor and productivity also determine a greater consumption of inputs (fertilizers, phytosanitary products, water, electricity, etc.). In any case, the input consumption of wine grape vineyards in the Region of Murcia (especially fertilizers and phytosanitary products) is very low compared with areas of greater rainfall within Spain [7,37,55]. Likewise, it is important to highlight that the production of the rainfed systems is less than half that of the irrigated ones [54]. If compared within the same type of system—that is, rainfed (CR vs. OR) or irrigated (CI vs. OI)—it is observed that the VC of conventional management are slightly higher than for organic management, due to a slightly higher productivity. Regarding this, it is also important to point out that cultivation in a way that is more respectful of the environment is not more expensive economically. A general aspect to highlight is that the most relevant VC are linked to labor (pruning, machinery, harvesting, and permanent staff), with these representing 73–75% of the TC for rainfed systems and 50–51% of the TC for irrigated systems.
It is the system (rainfed or irrigated) that makes the difference in the productive cost structure, regardless of the type of management (conventional or organic). Irrigation results in higher costs, due to either the necessary infrastructure (FC) or the costs derived from the greater productivity and vigor that it gives the plantation during the productive cycle (VC). The TC of the scenarios are in line with those in nearby areas such as La Mancha [54].
As shown in Table 5, income is higher with higher production, with the CI vineyard having the highest income and the OR the lowest. In addition, the table highlights one of the main existing problems in the region: the payment for the grape mainly in € kg−1 and °Baumé. This form of payment triggers two consequences: (1) The differences in °Baumé do not compensate for the differences in productivity; that is, the kilograms produced are prioritized over the quality of the grape berries obtained [4]. (2) The payment does not take into account the type of management; so, within the systems (rainfed or irrigated), the most productive is the one with the highest income, regardless of whether it is conventional or organic. In this way, those scenarios with management that is more respectful of the environment are penalized. The use of existing mechanisms that prioritize the quality of the grape—based on colorimetry, the polyphenolic index, and other parameters—could favor to a certain extent the most vulnerable scenarios (rainfed and organic management) [6].
Once the productive structure of the costs and income was obtained, the NM was calculated, subtracting the TC from the income. The annual NM was calculated for the CR, OR, CI, and OI scenarios, respectively, to be € 282.74 ha−1, € 244.05 ha−1, € 234.94 ha−1, and € 157.88 ha−1.

3.1.2. Economic Indicators

The NM/investment ratio shows the long-term profitability. As Table 5 indicates, the CR vineyard is the most profitable in the long term, due to its low investment. For this reason and because of its lower productivity compared to CR, OR is the second most profitable scenario in the long term; next, and very close to it, comes CI, with OI in last position. The irrigation scenarios are the least profitable in the long term. They require large investments, and their NM values are the lowest. The limitation of grape production by the Regulatory Council of the DD.OO means that the FC associated with irrigation and trellises cannot be completely compensated. Regarding short-term profitability (NM/VC), the order from highest to lowest is CR, OR, CI, and OI (Table 6); hence, the most profitable scenarios in the short term are the rainfed vineyards CR (21.40%) and OR (19.75%). The final indicator of profitability, NM/TC, indicates the global profitability of the agricultural activity. In this case, it confirms that the rainfed systems are, by far, the most profitable scenarios, due to their higher NM resulting from their reduced costs. Within them, CR is the most favorable due to its higher productivity. The irrigated vineyards, under regulated deficit irrigation strategies, appear as the most unfavorable scenarios; although their productivity is higher, the costs are not compensated by the productive advantages. In this way, two statements can be made: (1) If the majority of the payments in Murcia are made in € kg °Baumé −1, there is no interest in growing irrigated vines for the production of quality wines, since the productive limitations imposed by the DD.OO, together with this form of payment, make it less profitable. Irrigation with greater volumes of water to produce bulk wines, under these payment conditions, would be the scenario with the highest profitability [6,7]. (2) If the form of payment does not differentiate the type of crop management (conventional or organic) and thus does not prioritize production with less environmental impact, in both rainfed and irrigated systems, the most productive is always more advantageous.
The viability threshold indicates the price that one kilogram of grape must have for the activity to be economically viable. As can be seen in Table 6, the threshold prices are € 0.416 kg−1, € 0.422 kg−1, € 0.450 kg−1, and € 0.458 kg−1 for CR, OR, CI, and OI, respectively. The market prices follow the same order: €0.497 kg−1, € 0.497 kg−1, € 0.480 kg−1, and € 0.480 kg−1. This indicates that the prices for all the scenarios are quite close to the threshold, especially for the irrigated vineyard scenarios. In relation to market prices, Manjón [57] pointed out that in Spain the lowest grape prices correspond to the southeastern areas and to the Monastrell, Bobal, and Cencibel varieties, while the highest prices are paid in the North for the Tempranillo variety.
The break-even point shows the kilograms of grapes that a farm has to produce to be economically viable. In this case, 2931 kg ha−1 must be produced in CR, 2759 kg ha−1 in OR, 7510 kg ha−1 in CI, and 6921 kg ha−1 in OI. The corresponding productions of the vineyards are 3500 kg ha−1, 3250 kg ha−1, 8000 kg ha−1, and 7250 kg ha−1. Thus, all the scenarios are close to the break-even point, especially the irrigated vineyards, with OI being the most vulnerable.

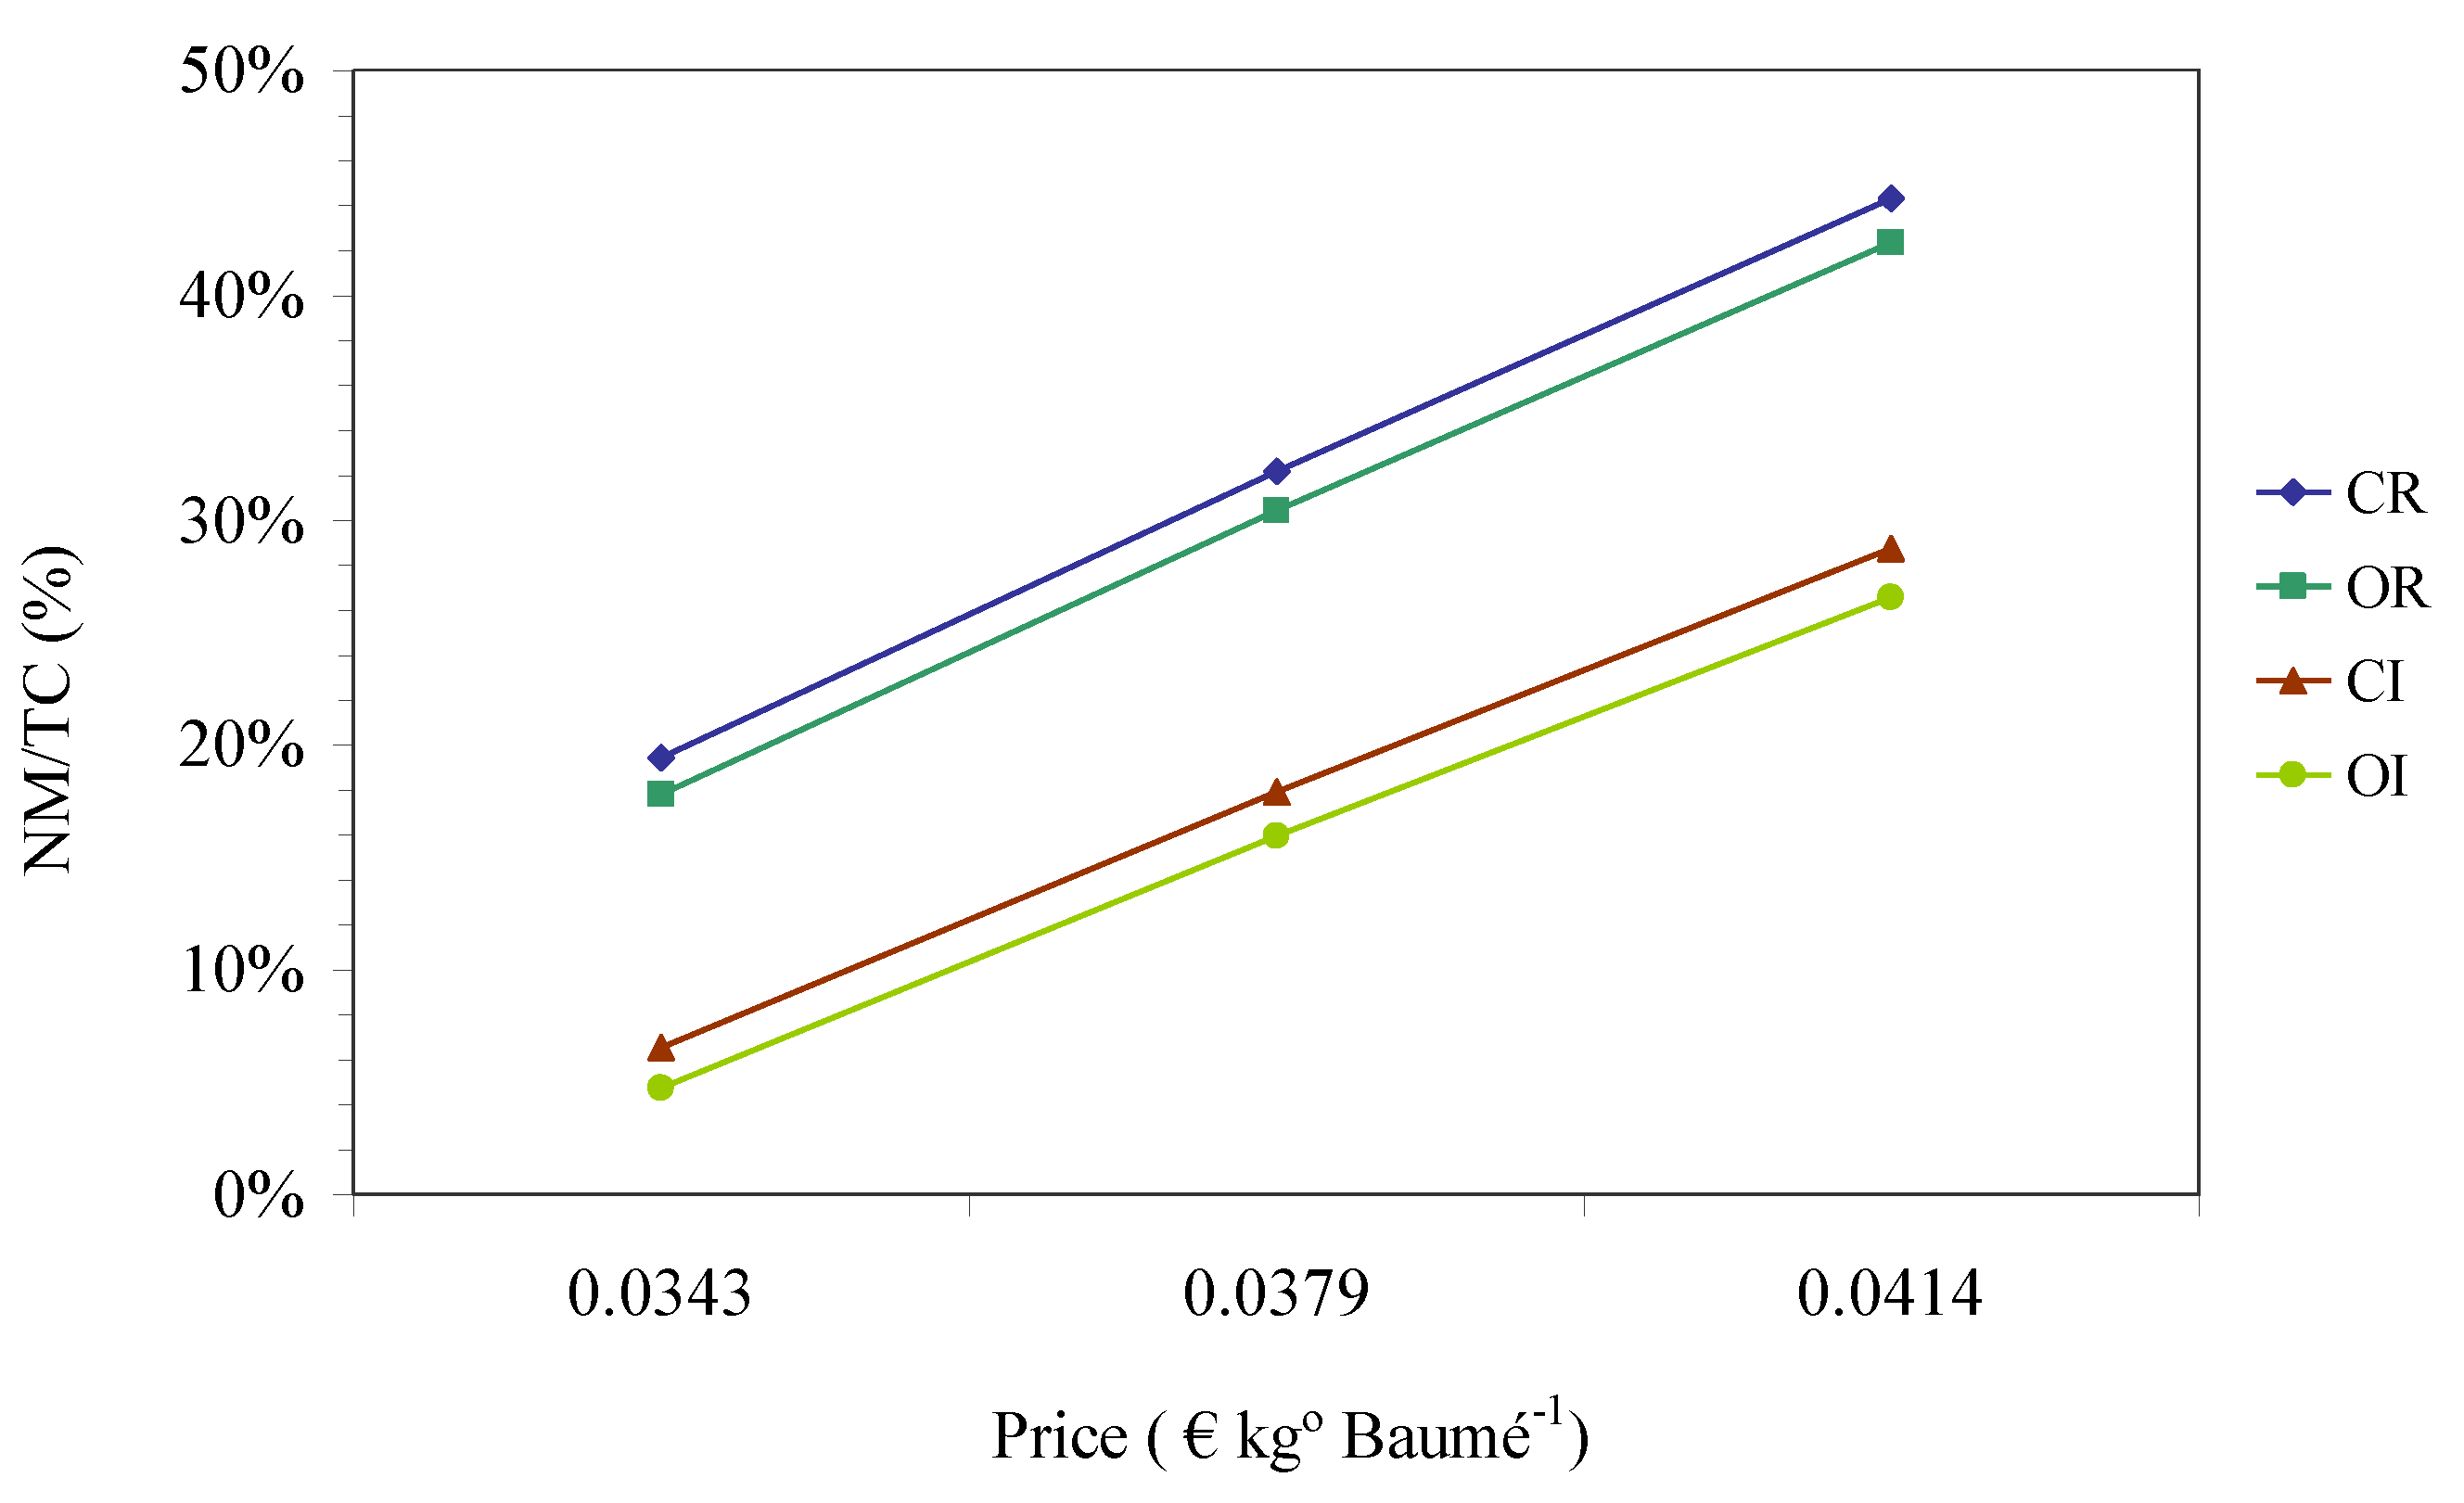
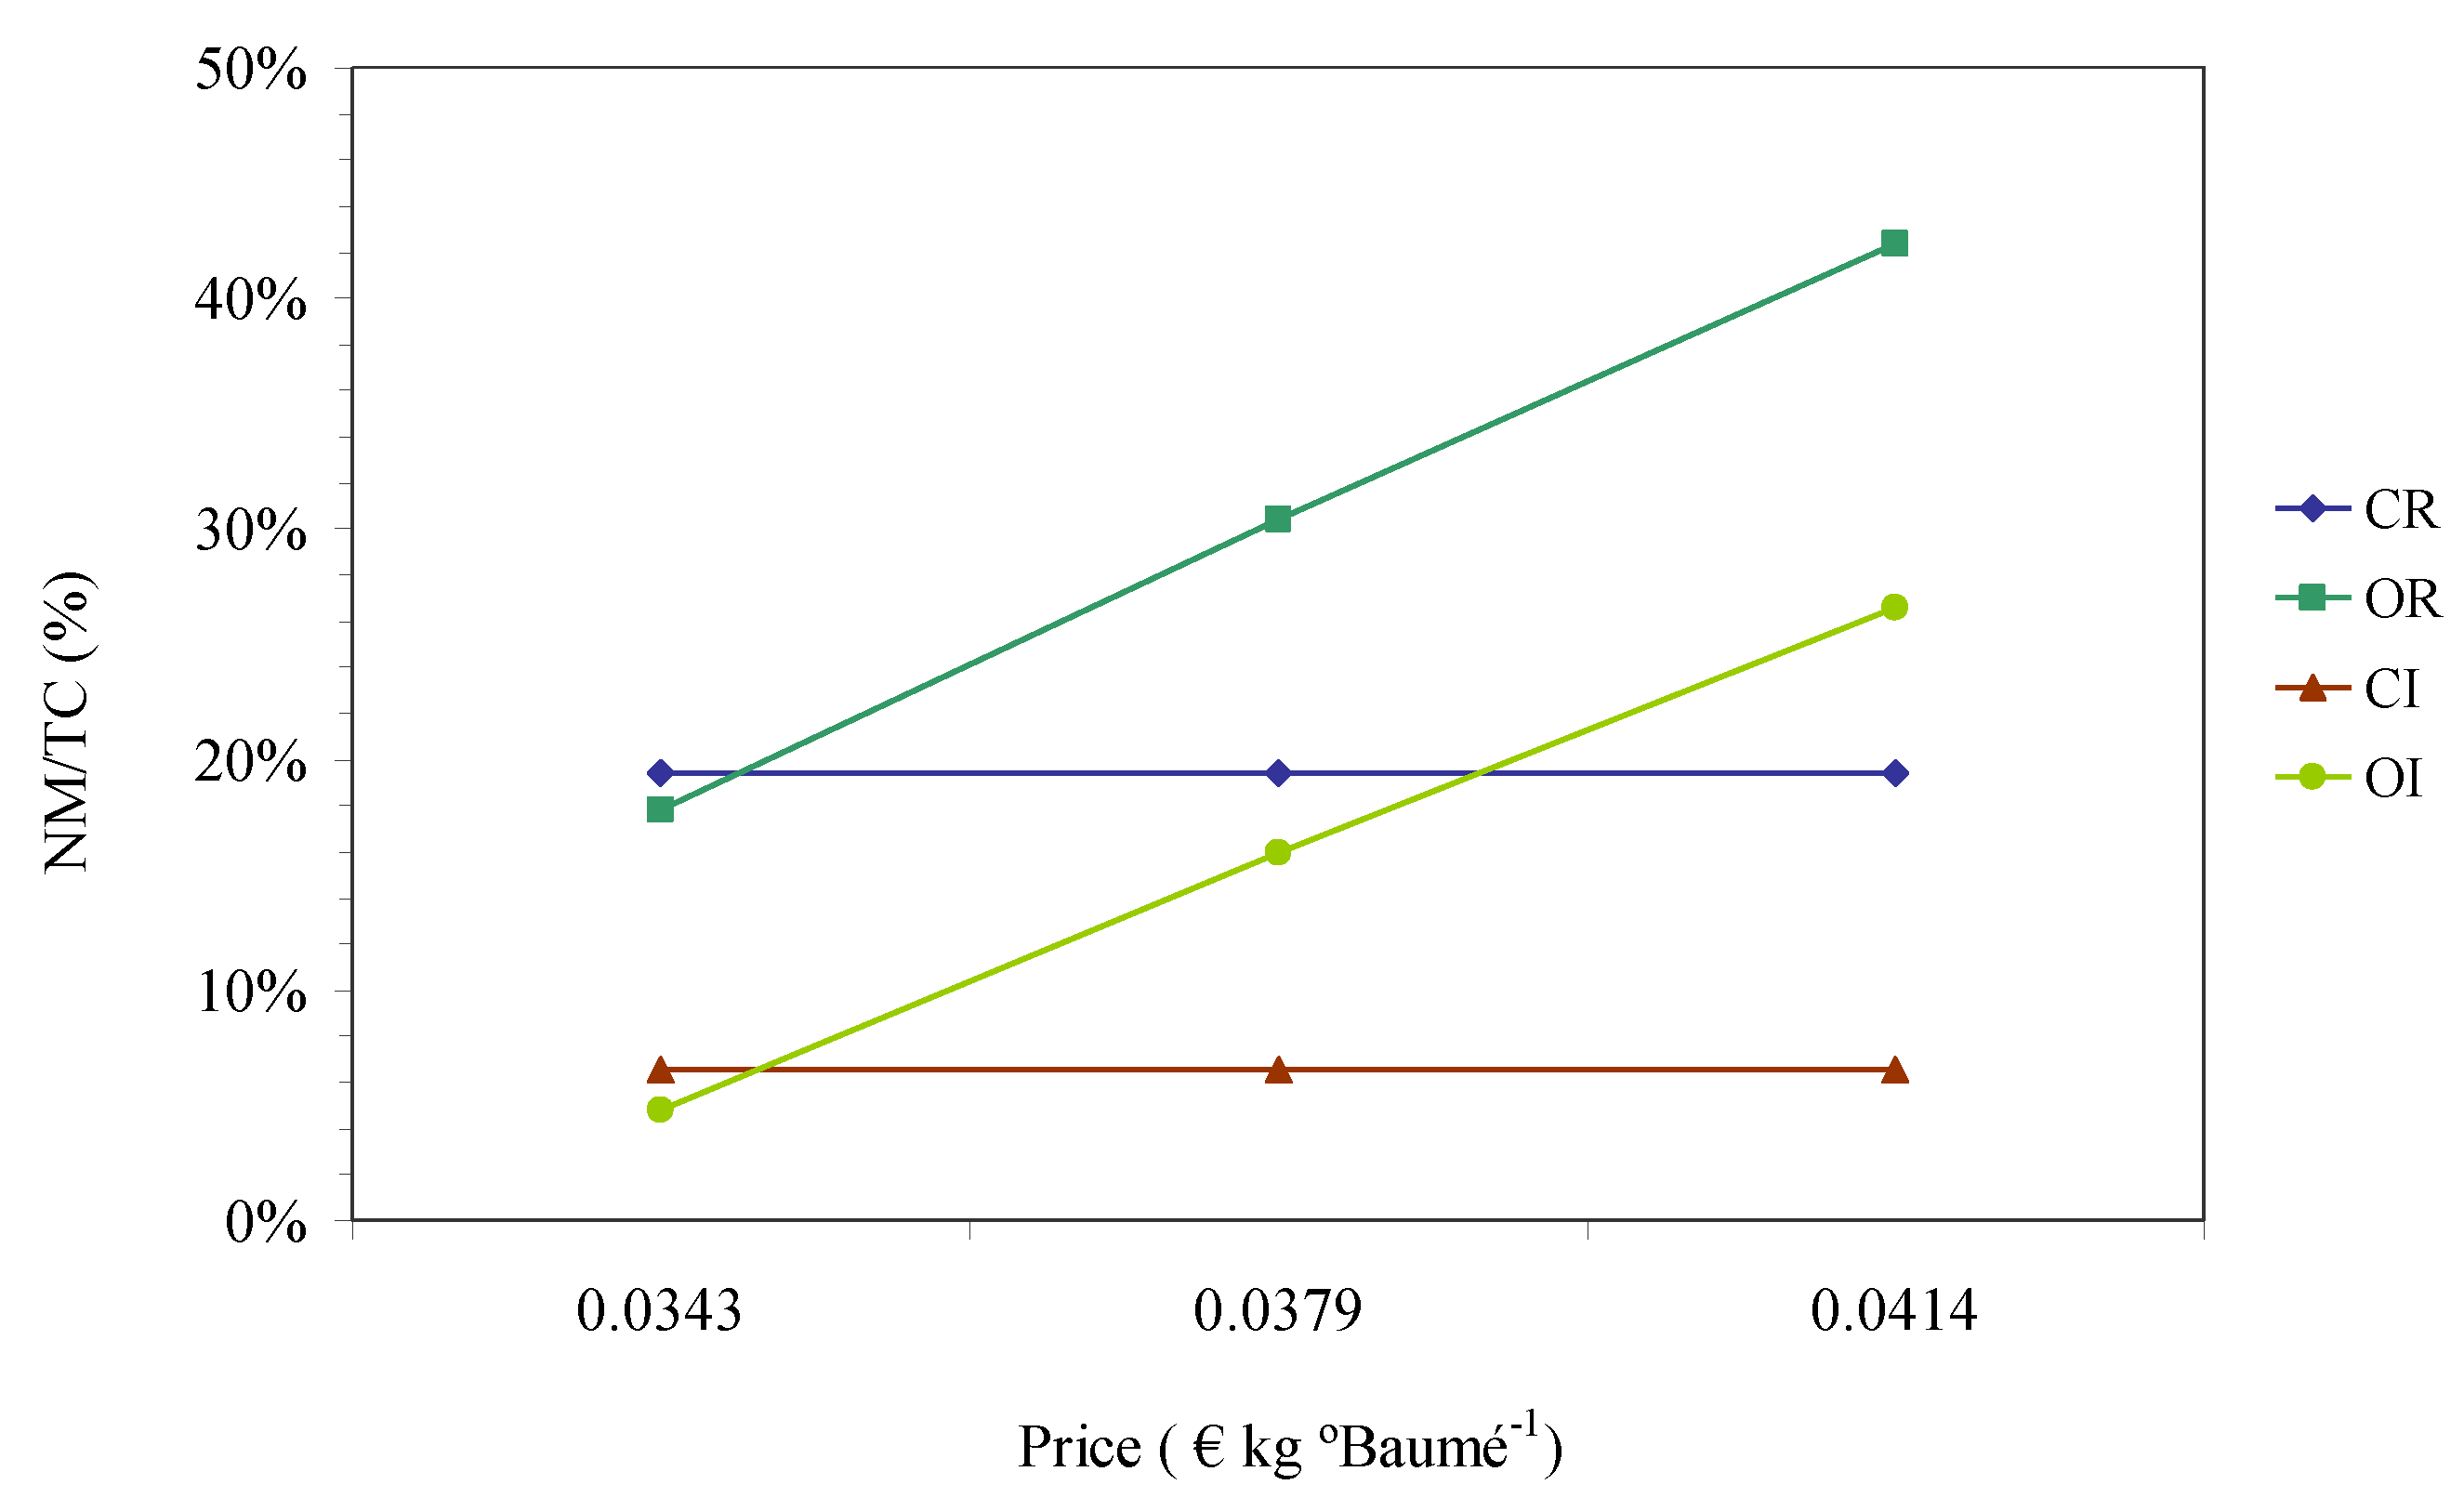
3.1.3. Sensitivity Analysis

To finish the economic analysis section, a sensitivity analysis was carried out in order to verify what would happen to the profitability of the scenarios if there were premiums for quality (Figure 1) and for ecological management (Figure 2).
In Figure 1, it can be seen that if quality premiums equal to 10% of the price in €kg °Baumé−1 were paid (equivalent to an increase of € 0.05 kg−1) the profitability of the most vulnerable scenarios (irrigated vineyards) would be tripled. If the premiums were 20% of the price in € kg ° Baumé−1 (equivalent to an increase of € 0.1 kg−1), the profitability of these scenarios would be five times greater. In the case of the rainfed vineyard scenarios, a premium of 20% would double their profitability.
Figure 2 corroborates that if premiums of 10% and 20% of the price in € kg °Baumé−1 were paid for carrying out organic management, the profitability of OI would be multiplied by five while for OR it would be doubled. It can also be seen that for the organic scenarios to reach the profitability of the conventional ones, a premium of 1.37% of the price in € kg ° Baumé−1 would suffice in rainfed conditions and one of 1.68% would suffice for irrigated land. That is, for OR to reach the profitability of CR, it needs a premium equivalent to € 0.007 kg−1. Likewise, for OI to achieve the profitability of CI, a premium of € 0.008 kg−1 is necessary.

3.2. Socio-Territorial Analysis

Table 7 shows the socio-territorial indicators for each scenario. The first (AWU ha−1) indicates the employment generated per hectare. The systems featuring irrigation generate twice as much employment as rainfed systems, with the CI scenario generating the most employment. The greater the vigor and productivity of the plantation, the more hours of labor are needed for manual tasks, such as pruning and harvesting. The values of the irrigated vineyard scenarios (0.10 and 0.09 AWU ha−1, rounding to two decimal places, for CI and OI, respectively) are similar to those found in other works for trellis cultivation: between 0.10 and 0.16 AWU ha−1, depending on the productivity [4,58].
These values are close to the average of the European Union (0.12 AWU ha−1) and are more than twice the average value of all agricultural holdings considered together (0.05 AWU ha−1) [7]. These indicators confirm the value of vineyards as a socio-economic driver of territories, closely linked to the environment and rural development in arid and semi-arid areas, in which there are no viable cultivation alternatives [4].
Something similar happens with the contribution of the activity to the regional economy (CRE). The higher the productivity of the farm, the more income it generates. Thus, the CI scenario stands out, with a gross income of € 3838 ha−1 (Table 7). Therefore, the irrigation scenarios are the ones that generate the most economic activity in the territory, despite the fact that deficit irrigation provides the lowest economic margins for wine grape cultivation.
For the vineyards to be viable, they need to have an area of at least 25.12 ha (CR), 25.47 ha (OR), 9.39 ha (CI), or 9.55 ha (OI). These values verify that wine grape producing vineyards with large average areas are found in the Region of Murcia [8]; due to climatological and productive vulnerability, wine grape growers have tried to increase the areas of their farms to establish economies of scale that allow them to lower costs and maintain economic viability.

3.3. Life Cycle Analysis

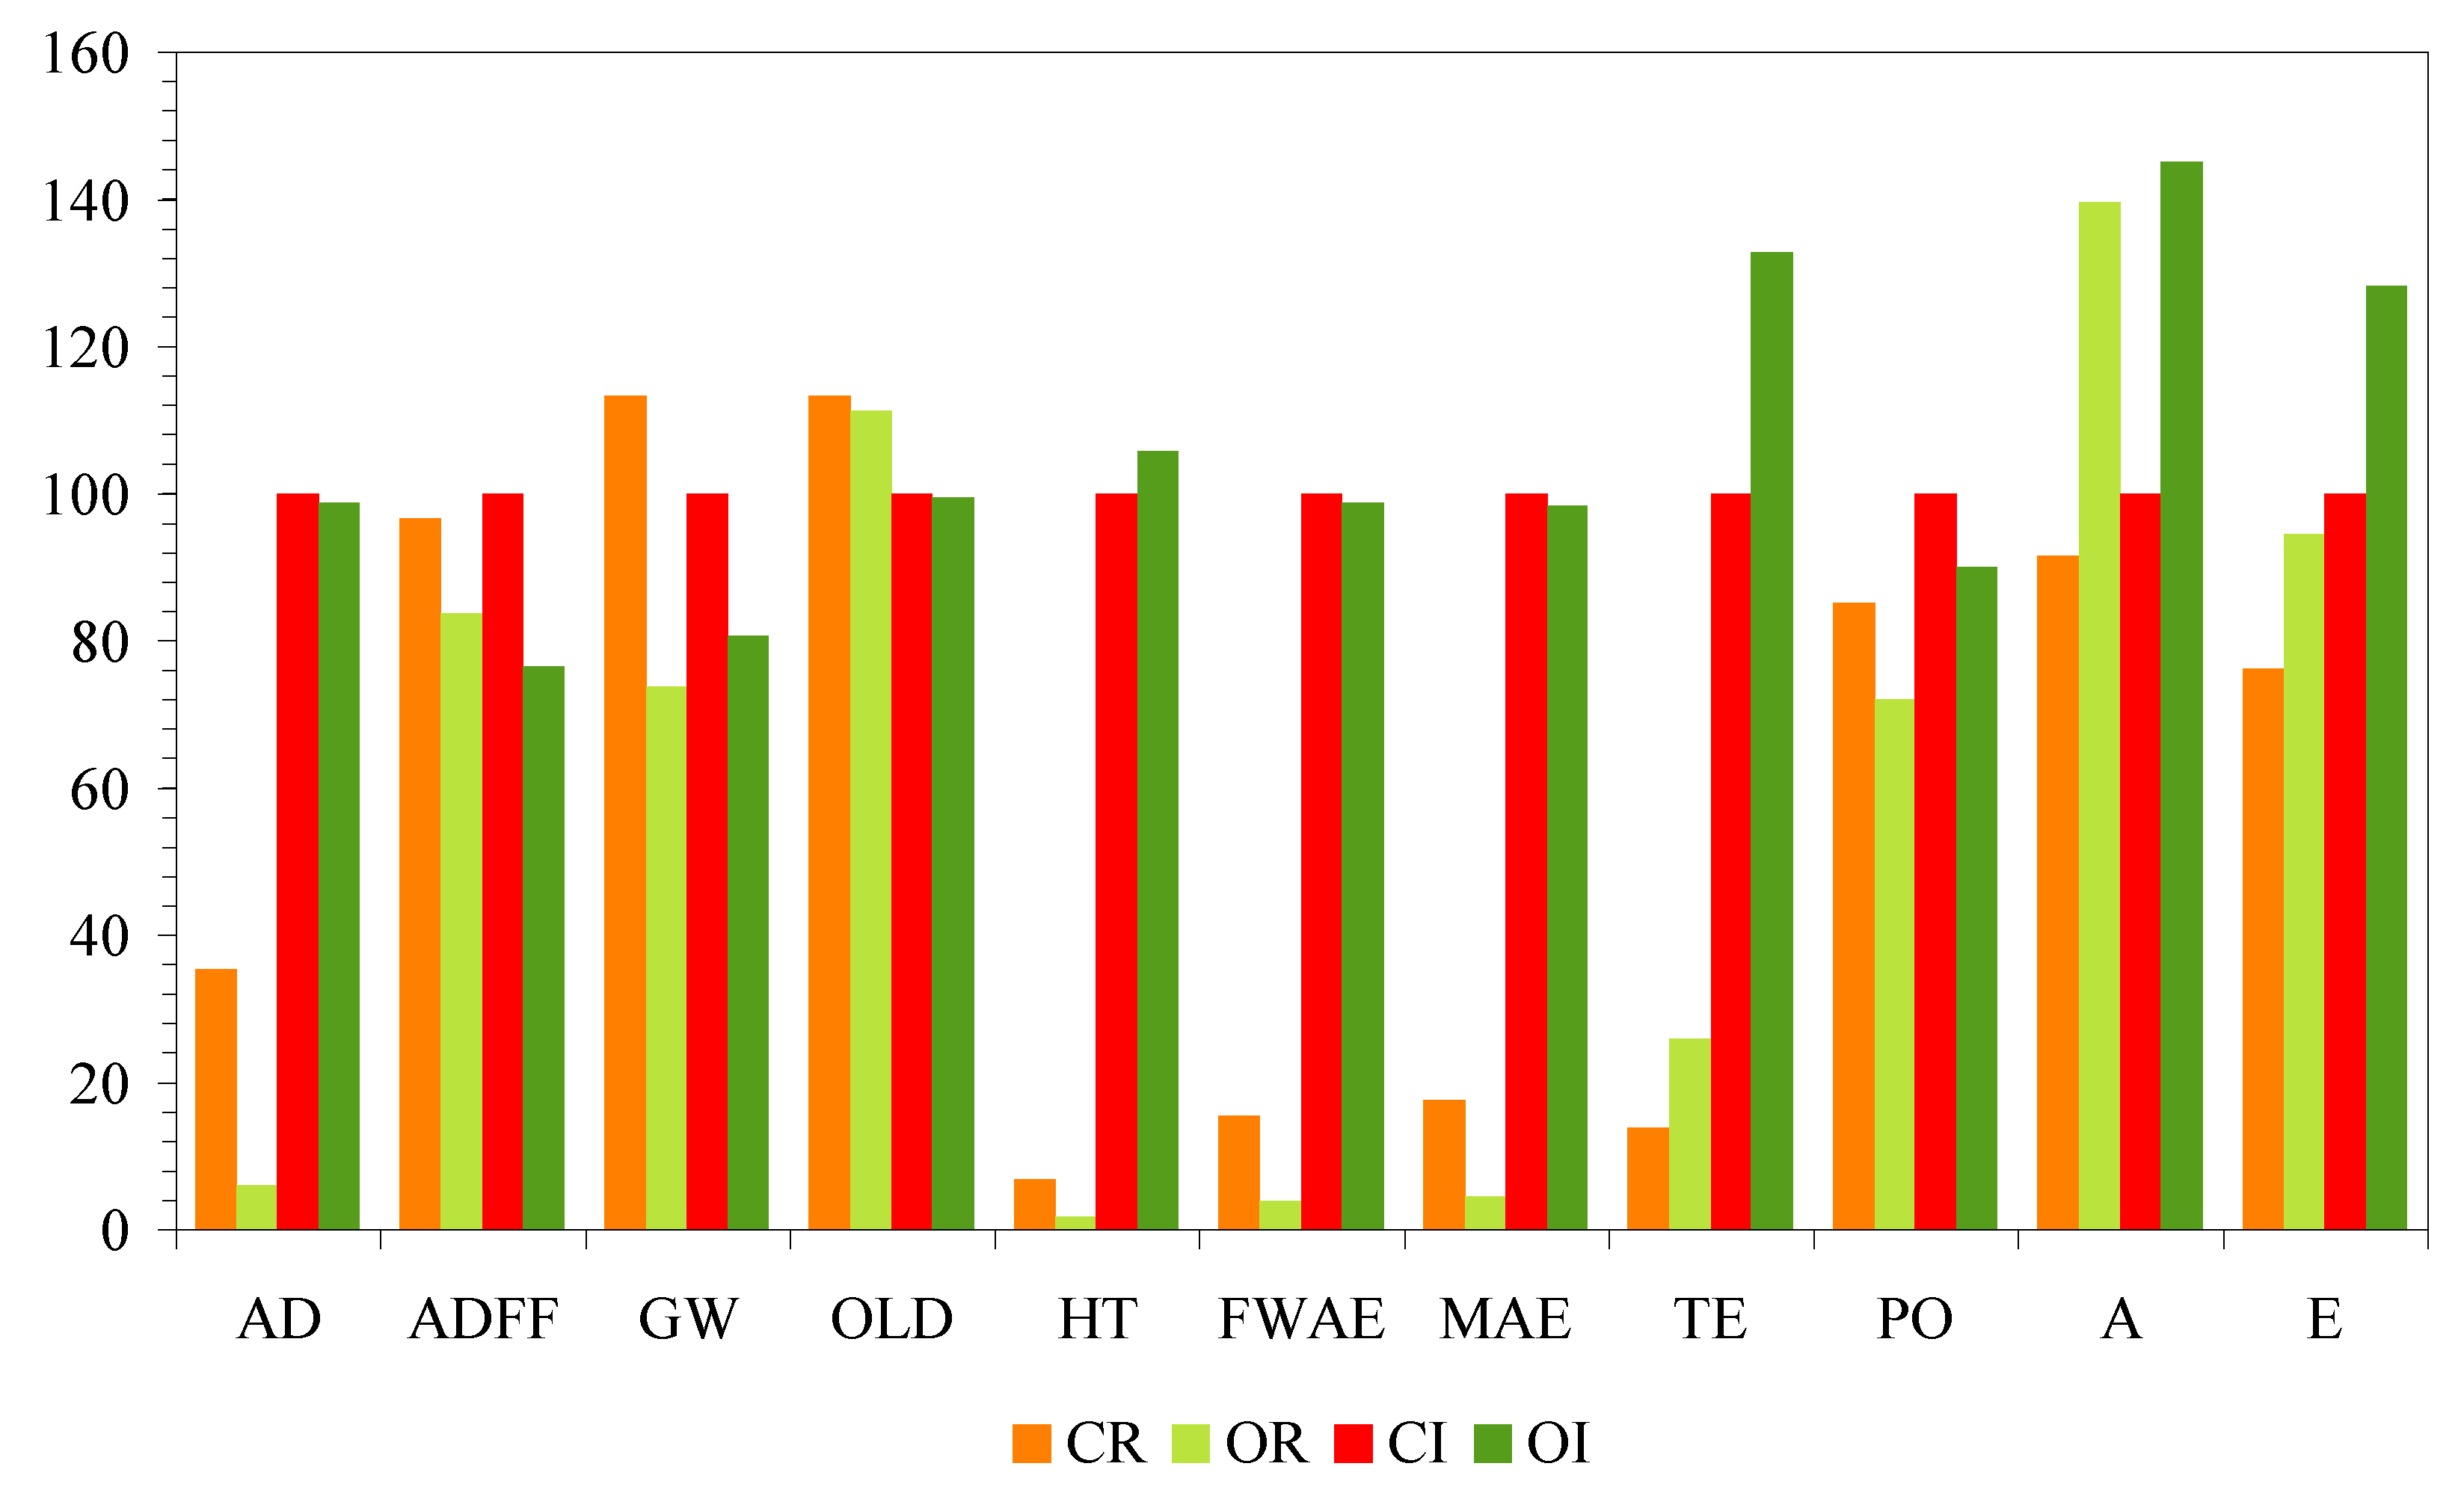
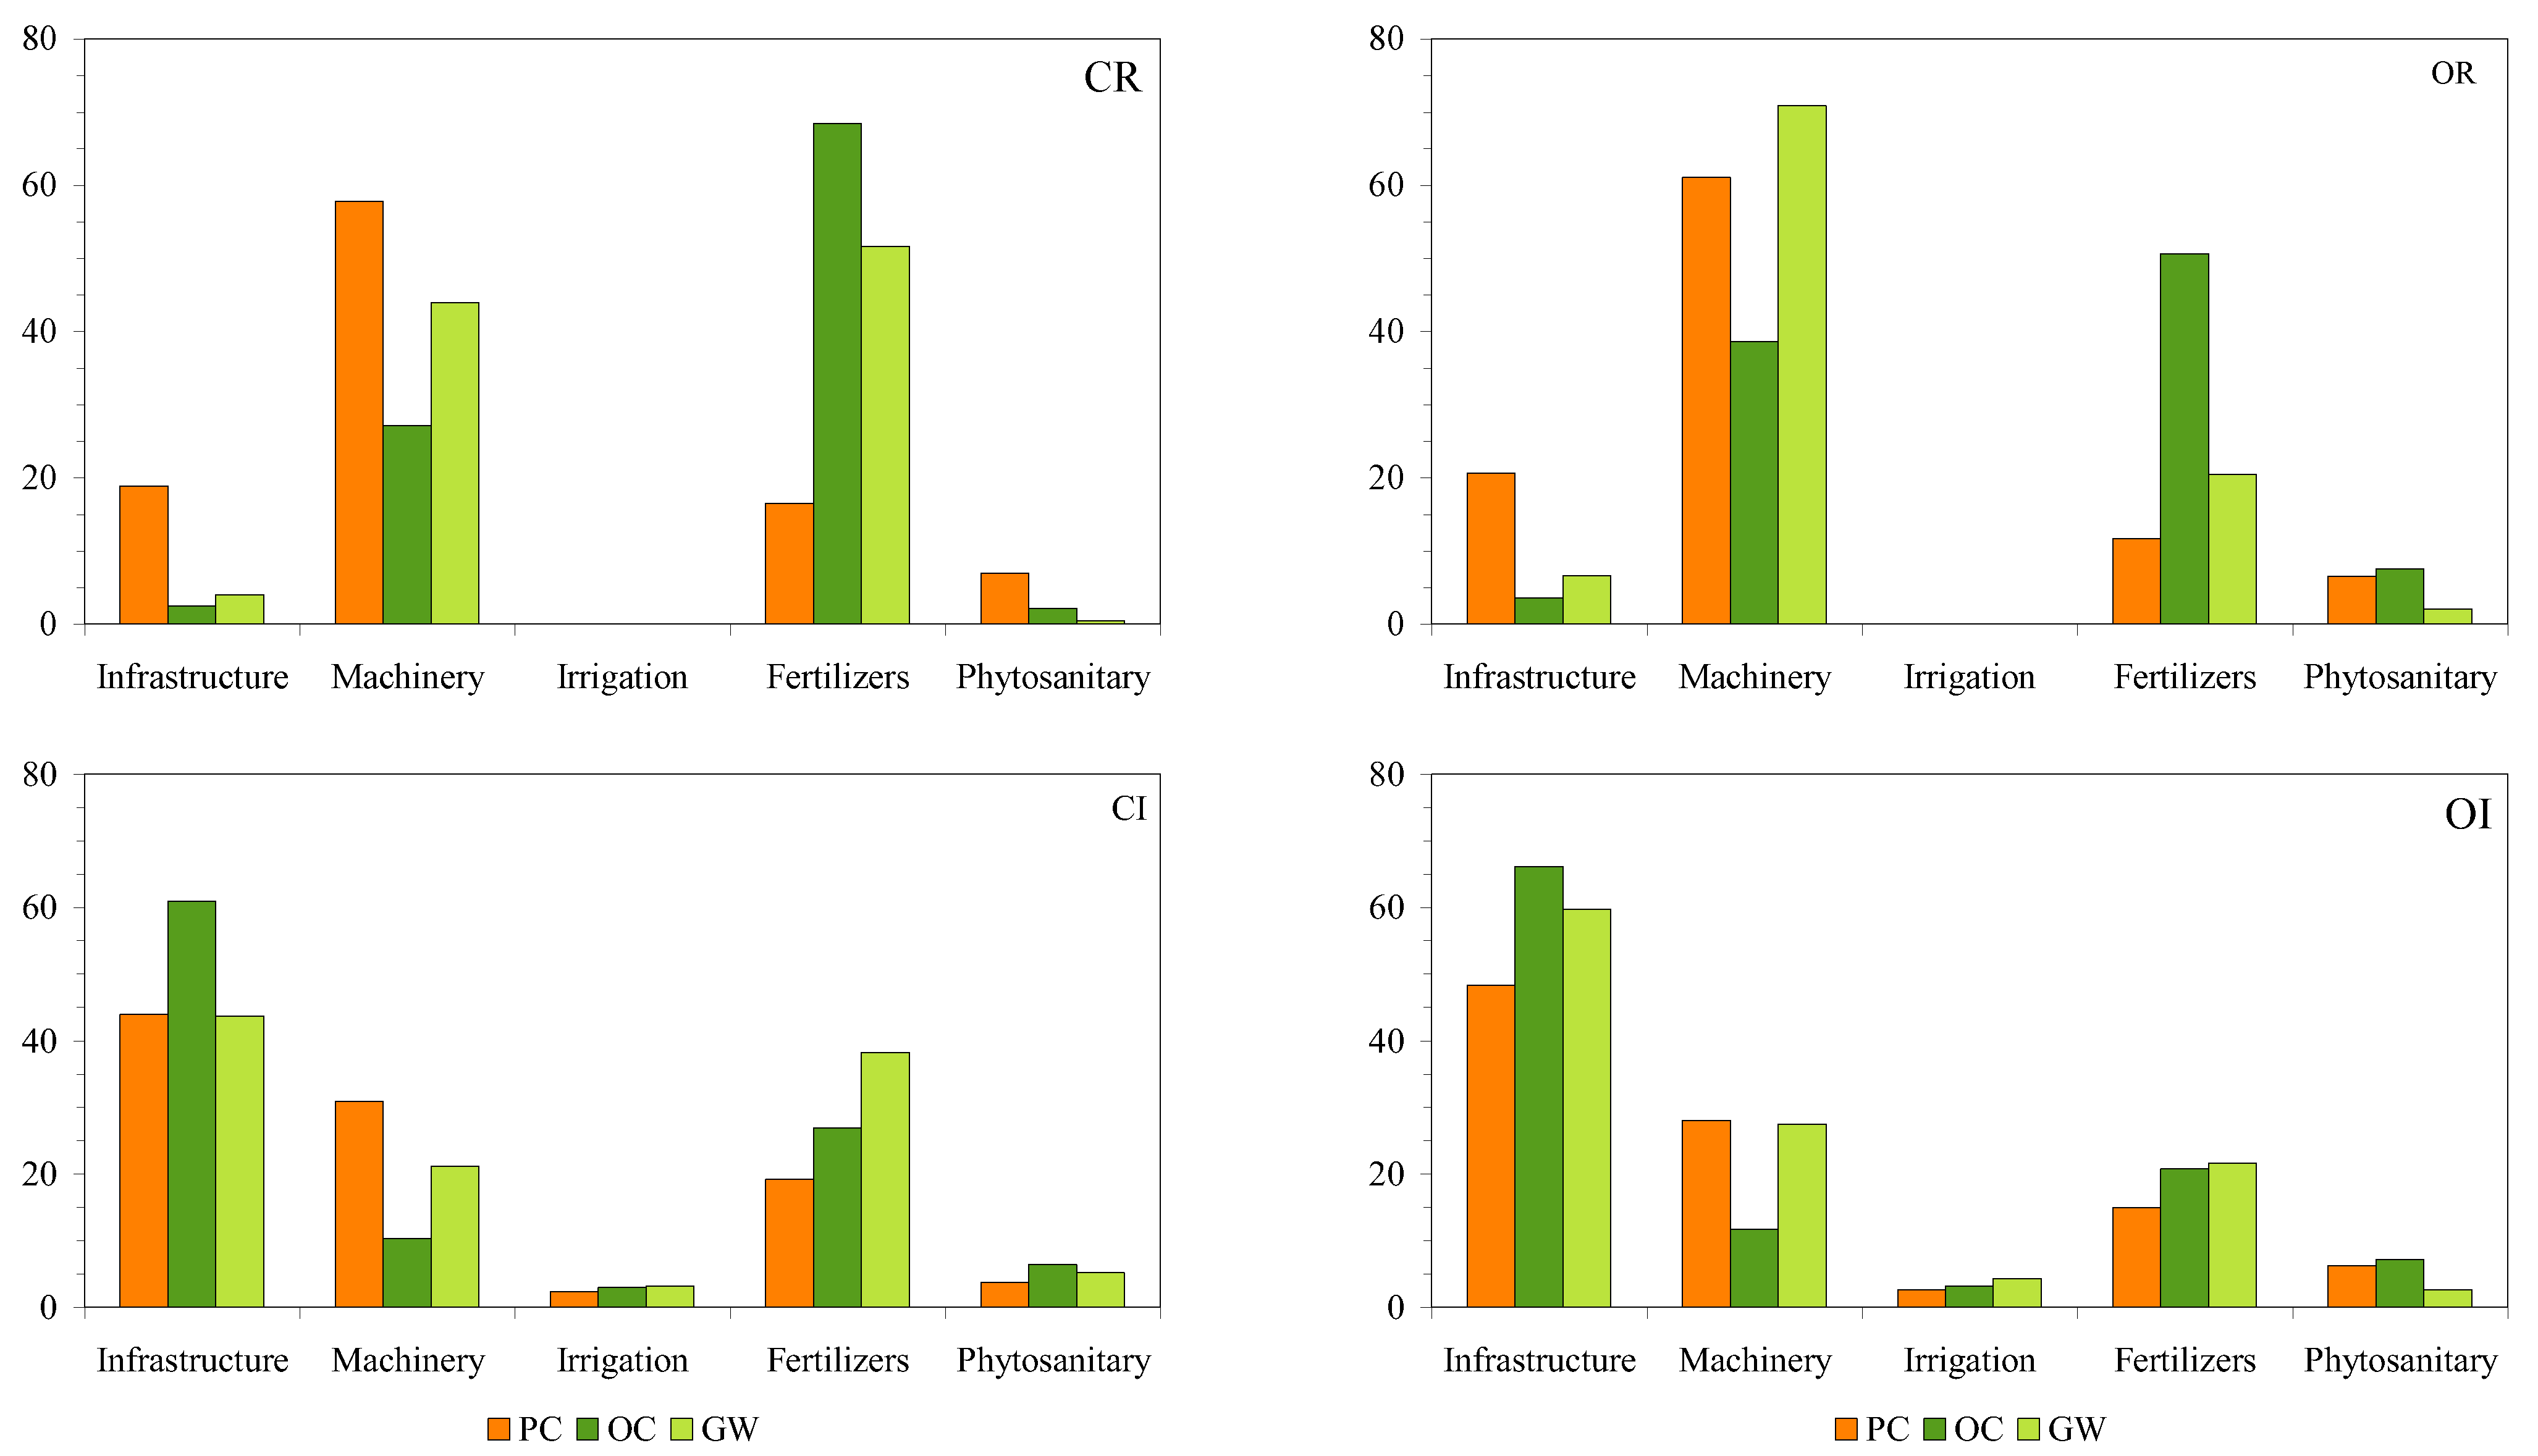
3.3.1. Contribution Analysis

The profile of the global contribution of the components of the system to environmental impacts was found to differ between the rainfed and irrigated vineyards. The main cause is the infrastructure, which in rainfed vineyards is reduced to the fuel for the agricultural machinery needed for land preparation, while in irrigated vineyards it also includes the elements of localized irrigation (reservoir, head, and network) and the trellis. Thus, the components that contribute the most in rainfed vineyards are the fertilizers and agricultural machinery (Table 8), while in irrigated vineyards it is the infrastructure and fertilizers (Table 9). In both types of vineyard, phytosanitary products provide a very low contribution, due to their limited use. The reason is that in the study area, as in other regions with dry climates and low rainfall, the incidence of fungal pests is lower [56], so only very low amounts of pesticides need to be applied. However, phytosanitary products have frequently been included among the components that contribute the most to environmental impacts, especially global warming [26,56].
Contribution in rainfed conditions. In the CR vineyard, fertilizers contribute very prominently to all the toxicity impacts (HT, FWAE, MAE, TE, and AD), fundamentally due to the manufacture of fertilizers, while the emissions due to the application of nitrogenous fertilizers contribute especially to GW, A, and E. In the OR vineyard, the contribution of toxicity impacts is lower, as are the absolute values. However, the absolute values for A and E are higher than in the CR vineyard, and the contribution is high. This is largely due to NH3 emissions from organic fertilizers. In both types of vineyard, the diesel consumed by the agricultural machinery contributes significantly to AD and ADFF due to oil extraction and to OLD and PO due to the production of diesel, while the emissions from diesel combustion have a major impact on GW.
Contribution in irrigated conditions. Although in the two types of irrigated vineyard the infrastructure contributes significantly in all impact categories (Table 9), the toxicity impacts (HT, FWAE, MAE, and TE) stand out, mainly due to the production of metals for the infrastructure. The high contribution of infrastructure, and in some studies the relevant role of metals, has also been described for greenhouse crops [25,31,59]. The impacts for which the infrastructure contributes the least are OLD, A, and E. In the CI vineyard, fertilizers have a significant impact on AD, ADFF, OLD, and PO, especially due to their manufacture, while the contribution to GW, A, and E is mainly due to the emissions following land application of inorganic fertilizers. In the OI vineyard, the application of organic fertilizer has a very significant effect on A and E, with a lesser effect on GW, TE, and PO. In both types of vineyard, the contribution is very low in the toxicity categories (HT, FWAE, and MAE). The contribution of electrical energy is very low (Table 9), since it only supplies the driving pumps in irrigation, which coincides with the findings of Navarro et al. [56]. In addition, the volumes of water supplied are low if we compare them, for example, with the annual values of 800 and 3000 m³ ha−1 in the cultivation of Syrah and Sauvignon Blanc, respectively, in northern Greece [60].
Contribution of waste management. In the four scenarios, plastic and metal waste is mostly recycled (90%), and therefore the contribution of waste management in all of them is negative (Table 8 and Table 9), subtracting from the absolute values of the different categories of environmental impacts [31,61]. The impact is very low in rainfed crops; because it only involves the containers of fertilizers and phytosanitary products, the global contribution is only −0.10 (conventional management) and −0.27% (organic). However, in irrigated crops with trellises, which involve significant amounts of metals and plastics (Table 4), the repercussions are greater, with global contributions of −7.21 and −8.73%, respectively, with the values in ADFF, GW, and PO standing out.

3.3.2. Conventional vs. Organic Vineyard

For each type of crop, differences between conventional and organic management can be seen (Table 10 and Figure 3). In irrigated cultivation (CI and OI), some components of the system are the same for both types of management, specifically infrastructure and irrigation electricity. The total consumption of diesel is very similar, although there are some differences in the tasks between conventional and organic management (Table 3). The differences are especially related to the use of inorganic and organic fertilizers, but also to phytosanitary product use and grape production. In general, the values of the environmental impacts are higher with CI (Table 10), except for HT, which is due to the lower production in the organic vineyard. Also, TE, A, and E are lower, which is mainly the result of the application of organic fertilizers, with their NH3 emissions playing an important role, coinciding with what has been observed by other authors [62]. The differences between the rainfed vineyards (CR and OR) are mainly due to fertilizer use and the difference in grape production. In CR, the values are higher for most of the environmental impacts (Table 10), except TE, A, and E, fundamentally due to the use of organic fertilizers in OR.

3.3.3. Rainfed vs. Irrigated Vineyards

The two factors that fundamentally influence the differences in environmental impacts between the rainfed and irrigated vineyards are infrastructure and grape production. Although the production in irrigated vineyards is higher, somewhat more than double that in rainfed vineyards (Table 1), on irrigated land the inputs are higher because they include the components related to irrigation (reservoir, head, and irrigation network) and the trellis. As a consequence, most of the potential environmental impacts have higher values in irrigated vineyards. However, considering CR vs. CI, the values of GW and OLD are slightly higher in CR, while for OR vs. OI, ADFF and OLD are slightly higher in OR.
The greatest differences between the rainfed and irrigated vineyards are in AD, HT, FWAE, MAE, and TE (Table 10 and Figure 3) and are due to the infrastructure and, especially, the metallic elements of the trellis.

3.3.4. Global Warming

Most LCAs of vines and other crops published in scientific journals use the carbon footprint or global warming potential (GW), as it is the impact category that most worries society in general [25,26]. It is for this reason that we make a special mention of this category of impact.
The values obtained for GW in the four crop models vary between 0.162 (OR) and 0.249 (OC) kg of CO2-eq per kg of grapes (Table 8 and Table 9); therefore, the results are within the range recorded by other authors [26,56]. Ferrara and De Feo [26], in an extensive bibliographic review of vineyards around the world, found values from 0.1 to 2.1 kg CO2-eq per kg of grapes. Navarro et al. [56] analyzed 18 vineyards from Spain and France, and the GW varied from 0.08 to 0.70 kg CO2-eq per kg of grapes, with a mean value of 0.23. Other values reported by different authors for red grape vineyards in the Mediterranean area vary between 0.12 and 0.50 kg CO2-eq [29,49,50,63]. Given these ranges, the values obtained for the four types of vineyard evaluated here can be considered low, especially those of the organic vineyards (OR and OI) (Table 8 and Table 9, Figure 3).
The relative difference in GW between the two types of rainfed vineyard is 34.92% (Table 10), with the absolute value being higher in the conventional vineyard (CR), mainly due to the manufacture of inorganic fertilizers. For the irrigated vineyards, the relative difference in GW between the two management models is less than 19.32%, also being higher in the conventional vineyard (CI) due to the manufacture of inorganic fertilizers. In both cases (rainfed and irrigated), this is so despite the fact that the production in the conventional vineyards is higher than in the organic vineyards. In other studies, the differences in GW are not particularly relevant, and the value for organic farming has even been found to be higher [62,64], or on the contrary, the difference has been shown to be significant and in favor of organic farming [51,65,66,67]. These discrepancies, however, correspond in part to differences in the agronomic factors considered and the databases used, and to the inputs and outputs actually taken into account in each LCA [64].

3.4. Environmental Costs and Production Costs

Figure 4 shows the contributions of the system components to the production costs, the environmental impacts as a whole (overall contribution), and GW. The production costs here were calculated in relation to those components that have environmental impacts. In the rainfed vineyards, it is the machinery that contributes the most to the production costs. However, it is the fertilizers that contribute the most to the environmental impacts, especially for the CR vineyard, although their contribution to the production costs is low.
In the irrigated vineyards, the infrastructure is the component that contributes the most to the production costs, and it is also very significant in relation to the environmental impacts. This finding coincides with what has been described in other crops for which the infrastructure is relevant, such as greenhouse pepper cultivation [31]. Fertilizers make a greater contribution to the environmental impact, especially to GW, but their contribution to production costs is low, as can be seen for the rainfed vineyards. The low contribution of fertilizers to production costs has also been described in other vineyard studies [7,29,30] and in other woody crops such as almond trees or olive trees, for which fertilization was shown to represent 8.93% and 9.20% of the total cost of production, respectively [37].
In all cases, phytosanitary products contribute very little to the production costs and environmental impacts. This is a reflection of their limited use, given the low incidence of vine diseases in semi-arid areas [56].
The GW values recorded in this work can be considered low if we compare them with the range found in other studies [26,56]. This is the result of sustained market conditions, with low prices for grapes, that have led to a severe adjustment of production costs with the use of very low quantities of inputs, especially fertilizers and phytosanitary products. In addition, the low values of GW confirm what has been indicated in several studies in southeastern Spain in relation to the hardiness of the Monastrell variety and its adaptation to limiting edaphoclimatic conditions typical of semi-arid zones together with a low cost of inputs [3,68]. The adaptation of the Monastrell variety, in combination with properly selected rootstocks, to such harsh climatic conditions in a scenario of climate change can and should be a priority strategy on the road to viticulture sustainability in southeastern Spain [4,34].

4. Conclusions

The cost structure verifies that the greatest differences between the systems are determined by the rainfed/irrigated option, due to the amortization of the irrigation installation and the trellis. In parallel, the values of the impact categories are higher for irrigated than for rainfed land, especially the decrease in abiotic resources and toxicity indicators, which is due to the trellis and irrigation infrastructure. For the irrigated vineyards to achieve high economic productivity, via productivity in kilos or with a grape price that prioritizes quality, there is a need to amortize some fixed infrastructure costs.
The differences between conventional and ecological systems for each option (rainfed or irrigated) are very small. Vine cultivation is highly adjusted, in terms of inputs, to lower costs, and this results in low costs and impacts, both in conventional and organic production. Conventional management has higher impacts than organic management, mainly due to the use of inorganic fertilizers. However, TE, A, and E are higher in organic crops due to higher NH3 emissions from organic fertilizers.
Differentiation by quality and by a low environmental impact for grapes cultivated in rainfed vineyards, or using deficit irrigation with RDI, is a path to follow to achieve differentiation in price and, therefore, to attain less vulnerable and more economically viable systems in a territory with a semi-arid climate and that is sensitive to climate change.
All the scenarios studied here make an important economic contribution to the territory under consideration, although that of the most productive (irrigated) scenarios stands out. Something similar happens with employment: the higher the productivity, the greater the generation of employment, since more hours of manual work are necessary. However, it seems necessary to carry out studies in the near future that provide an analytical vision of the sociodemographic profile of winegrowers in relation to the sustainability of viticulture activity in vulnerable territories.

Author Contributions

B.G.C., B.G.G. and J.G.G. conceived and designed the present study. The role of each of the authors was as follows: B.G.C. and J.G.G. collected the data from the collaborating company, made the agronomic calculations, and performed the economic analysis. B.G.C. and B.G.G. performed the life cycle assessment. The three authors wrote the paper and approved the final manuscript. All authors have read and agreed to the published version of the manuscript.

Funding

This research was funded by Consejería de Agua, Agricultura, Ganadería y Pesca de la Región de Murcia, and by Fondo Europeo Agrícola de Desarrollo Rural (FEADER) Qvalitas Operating Group.

Data Availability Statement

Not applicable.

Conflicts of Interest

The authors declare no conflict of interest.

References

  1. AFI. Importancia Económica y Social del Sector Vitivinícola en España; Interprofesional del Vino de España: Madrid, Spain, 2020. [Google Scholar]
  2. García García, J. Actualización de la contabilidad de costes del cultivo de viña en la Región de Murcia. Enoviticultura 2016, 39, 2–9. [Google Scholar]
  3. García García, J.; García García, B. Aspectos socioeconómicos y ambientales del cultivo de la uva Monastrell. In El Libro de la Monastrell; Riquelme, F., Martínez-Cutillas, A., Eds.; Consejería de Agua, Agricultura, Ganadería y Pesca de la Región de Murcia: Murcia, Spain, 2018; pp. 71–88. ISBN 978-84-09-06249-2. [Google Scholar]
  4. Romero Azorín, P.; García García, J. The Productive, Economic, and Social Efficiency of Vineyards Using Combined Drought-Tolerant Rootstocks and Efficient Low Water Volume Deficit Irrigation Techniques under Mediterranean Semiarid Conditions. Sustainability 2020, 12, 1930. [Google Scholar] [CrossRef] [Green Version]
  5. CARM. Estadística Agraria de Murcia 2019/20; Comunidad Autónoma de la Región de Murcia; Consejería de Agua, Agricultura, Ganadería, Pesca, Medio Ambiente y Emergencias: Murcia, Spain, 2021. [Google Scholar]
  6. García García, J.; Martínez-Cutillas, A.; Romero, P. Financial Analysis of Wine Grape Production Using Regulated Deficit Irrigation and Partial-Root Zone Drying Strategies. Irrig. Sci. 2012, 30, 179–188. [Google Scholar] [CrossRef]
  7. García-Castellanos, B.; García-García, B.; García-García, J. Evaluación de la sostenibilidad de tres sistemas de cultivo de viña característicos de la Región de Murcia. ITEA 2021, 118, 137–157. [Google Scholar] [CrossRef]
  8. MAPA. Anuario de Estadística. Avance 2021; Ministerio de Agricultura, Pesca y Alimentación: Madrid, Spain, 2021. [Google Scholar]
  9. Romero, P.; García García, J.; Fernández-Fernández, J.I.; Gil Muñoz, R.; del Amor Saavedra, F.; Martínez-Cutillas, A. Improving Berry and Wine Quality Attributes and Vineyard Economic Efficiency by Long-Term Deficit Irrigation Practices under Semiarid Conditions. Sci. Hortic. 2016, 203, 69–85. [Google Scholar] [CrossRef]
  10. Fraga, H.; García de Cortazar, I.; Malheiro, A.C.; Santos, J.A. Modelling Climate Change Impacts on Viticultural Yield, Phenology and Stress Conditions in Europe. Glob. Chang. Biol. 2016, 22, 3774–3788. [Google Scholar] [CrossRef] [PubMed]
  11. Resco, P.; Iglesias, A.; Bardají, I.; Sotés, V. Exploring Adaptation Choices for Grapevine Regions in Spain. Reg. Environ. Chang. 2016, 16, 979–993. [Google Scholar] [CrossRef]
  12. Alcón, F.; Pedrero, F.; Martín Ortega, J.; Arcas, N.; Alarcon, J.J.; De Miguel, M.D. The Non-Market Value of Reclaimed Wastewater for Use in Agriculture: A Contingent Valuation Approach. Span. J. Agric. Res. 2010, 8, 187–196. [Google Scholar] [CrossRef]
  13. Soto García, M.; Martínez Álvarez, V.; Martín Górriz, B. El Regadío en la Región de Murcia. Caracterización y Análisis Mediante Indicadores de Gestión; Sindicato Central de Regantes del Acueducto Tajo-Segura: Murcia, Spain, 2014; ISBN 978-84-697-0372-4. [Google Scholar]
  14. Maestre Valero, J.F.; Martín Górriz, B.; Alarcón, J.J.; Nicolás, E.; Martínez Álvarez, V. Economic Feasibility of Implementing Regulated Deficit Irrigation with Reclaimed Water in a Grapefruit Orchard. Agric. Water Manag. 2016, 178, 119–125. [Google Scholar] [CrossRef]
  15. Romero, P.; Gil Muñoz, R.; Fernández-Fernández, J.I.; del Amor, F.M.; Martínez-Cutillas, A.; García-García, J. Improvement of Yield and Grape and Wine Composition in Field-Grown Monastrell Grapevines by Partial Root Zone Irrigation, in Comparison with Regulated Deficit Irrigation. Agric. Water Manag. 2015, 149, 55–73. [Google Scholar] [CrossRef]
  16. Benedetto, G. The Environmental Impact of a Sardinian Wine by Partial Life Cycle Assessment. Wine Econ. Policy 2013, 2, 33–41. [Google Scholar] [CrossRef]
  17. EEA. Agricultura-Introducción; European Environment Information and Observation (Eionet): Copenhagen, Denmark, 2020. [Google Scholar]
  18. McEldowney, J. EU Agricultural Policy and Climate Change; EPRS, European Parliament: Luxenbourg, 2020. [Google Scholar]
  19. Barber, N.; Taylor, C.; Strick, S. Wine Consumers’ Environmental Knowledge and Attitudes: Influence on Willingness to Purchase. IJWR 2009, 1, 59–72. [Google Scholar] [CrossRef] [Green Version]
  20. Barry, M.T. Life Cycle Assessment and the New Zealand Wine Industry: A Tool to Support Continuous Environmental Improvement; Massa University: Wellington, New Zealand, 2011. [Google Scholar]
  21. Fusi, A.; Guidetti, R.; Benedetto, G. Delving into the Environmental Aspect of a Sardinian White Wine: From Partial to Total Life Cycle Assessment. Sci. Total Environ. 2014, 472, 989–1000. [Google Scholar] [CrossRef] [PubMed] [Green Version]
  22. European Commission Analysis of Links between CAP Reform and Green Deal; European Commission: Brussels, Belgium, 2020.
  23. ISO. ISO 14040 Environmental Management-Life Cycle Assessment: Principles and Framework; International Organization for Standards (ISO): Geneva, Switzerland, 2006. [Google Scholar]
  24. Notarnicola, B.; Sala, S.; Anton, A.; J McLaren, S.; Saouter, E.; Sonesson, U. The Role of Life Cycle Assessment in Supporting Sustainable Agri-Food Systems: A Review of the Challenges. J. Clean. Prod. 2017, 140, 399–409. [Google Scholar] [CrossRef]
  25. Torres Pineda, I.; Lee, Y.D.; Kim, Y.S.; Lee, S.M.; Park, K.S. Review of Inventory Data in Life Cycle Assessment Applied in Production of Fresh Tomato in Greenhouse. J. Clean. Prod. 2021, 282, 124395. [Google Scholar] [CrossRef]
  26. Ferrara, C.; De Feo, G. Life Cycle Assessment Application to the Wine Sector: A Critical Review. Sustainability 2018, 10, 395. [Google Scholar] [CrossRef] [Green Version]
  27. Strano, A.; De Luca, A.I.; Falcone, G.; Iofrida, N.; Stillitano, T.; Gulisano, G. Economic and Environmental Sustainability Assessment of Wine Grape Production Scenarios in Southern Italy. Agric. Sci. 2013, 04, 12–20. [Google Scholar] [CrossRef] [Green Version]
  28. Tamburini, E.; Pedrini, P.; Marchetti, M.; Fano, E.; Castaldelli, G. Life Cycle Based Evaluation of Environmental and Economic Impacts of Agricultural Productions in the Mediterranean Area. Sustainability 2015, 7, 2915–2935. [Google Scholar] [CrossRef] [Green Version]
  29. Falcone, G.; De Luca, A.I.; Stillitano, T.; Strano, A.; Romeo, G.; Gulisano, G. Assessment of Environmental and Economic Impacts of Vine-Growing Combining Life Cycle Assessment, Life Cycle Costing and Multicriterial Analysis. Sustainability 2016, 8, 793. [Google Scholar] [CrossRef] [Green Version]
  30. Zhang, C.; Rosentrater, K.A. Estimating Economic and Environmental Impacts of Red-Wine-Making Processes in the USA. Fermentation 2019, 5, 77. [Google Scholar] [CrossRef] [Green Version]
  31. García García, J.; García García, B. Sustainability Assessment of Greenhouse Pepper Production Scenarios in Southeastern Spain. Agronomy 2022, 12, 1254. [Google Scholar] [CrossRef]
  32. Noguera-Muñoz, F.A.; García García, B.; Ponce-Palafox, J.T.; Wicab-Gutierrez, O.; Castillo-Vargasmachuca, S.G.; García García, J. Sustainability Assessment of White Shrimp (Penaeus vannamei) Production in Super-Intensive System in the Municipality of San Blas, Nayarit, Mexico. Water 2021, 13, 304. [Google Scholar] [CrossRef]
  33. Sistema de Información Agrario de Murcia. Available online: http://siam.imida.es/apex/f?p=101:1:8751385424600662 (accessed on 16 July 2022).
  34. Romero, P.; Botía, P.; Navarro, J.M. Selecting Rootstocks to Improve Vine Performance and Vineyard Sustainability in Deficit Irrigated Monastrell Grapevines under Semiarid Conditions. Agric. Water Manag. 2018, 209, 73–93. [Google Scholar] [CrossRef]
  35. García García, J.; Contreras López, F.; Usai, D.; Visani, C. Economic Assessment and Socio-Economic Evaluation of Water Use Efficiency in Artichoke Cultivation. Open J. Account. 2013, 02, 45–52. [Google Scholar] [CrossRef] [Green Version]
  36. Contreras, F.; Garrido, I.; Hellín, P.; Flores, P.; García, J.; Navarro Pay, N.; Navarro, S.; Fenoll, J. Financial Assessment of an In-Farm Remediation System for the Reuse of Agro-Wastewater with Pesticides. Agric. Water Manag. 2021, 256, 107087. [Google Scholar] [CrossRef]
  37. García García, J. Estructura de Costes de las Orientaciones Productivas Agrícolas de la Región de Murcia: Frutos Secos, Frutales de Pepita, Vid y Olivo; Técnica; Consejería de Agua, Agricultura, Ganadería y Pesca de la Región de Murcia: Murcia, Spain, 2019. [Google Scholar]
  38. MAPA. Secuestro de Carbono y Mejora de los Suelos en Cultivos Agrícolas Mediterráneos; Guía de Buenas Prácticas Agrarias CARBOCERT; Unión Europea, Ministerio de Agricultura, Pesca y Alimentación: Madrid, Spain, 2020. [Google Scholar]
  39. MAGRAMA. Guía Práctica de la Fertilización Racional de los Cultivos en España; Ministerio de Medio Ambiente y Medio Rural y Marino: Madrid, Spain, 2010; ISBN 978-84-491-0997-3. [Google Scholar]
  40. Giner, J.F.; Arciniega, L. La nutrición de la viña. Agrícola Vergel 2004, 267, 141–146. [Google Scholar]
  41. MAPA Resultados Técnico-Económicos de Frutales 2017; Ministerio de Agricultura, Pesca y Alimentación: Madrid, 2019.
  42. ISO. ISO 14044 Environmental Management—Life Cycle Assessment: Requirements and Guidelines; International Organization for Standards (ISO): Geneva, Switzerland, 2006. [Google Scholar]
  43. PRé. Introduction to LCA with SimaPro; PRé: Amersfoort, The Netherlands, 2016. [Google Scholar]
  44. EEA. EMEP/EEA Air Pollution Emission Inventory Guidebook 2019. Technical Guidance to Prepare National Emission Inventories; EEA Report; Publications Office of the European Union: Luxenbourg, 2019; ISBN 978-92-9213-806-6. [Google Scholar]
  45. Del Hierro, Ó.; Gallejones, P.; Besga, G.; Artetxe, A.; Garbisu, C. A Comparison of IPCC Guidelines and Allocation Methods to Estimate the Environmental Impact of Barley Production in the Basque Country through Life Cycle Assessment (LCA). Agriculture 2021, 11, 1005. [Google Scholar] [CrossRef]
  46. IPCC. Refinement to the 2006 IPCC Guidelines for National Greenhouse Gas Inventories; Calvo Buendia, E., Tanabe, K., Kranjc, A., Baasansuren, J., Fukuda, M., Ngarize, S., Osako, A., Pyrozhenco, Y., Shermanau, P., Federici, S., Eds.; IPCC: Geneva, Switzerland, 2019; ISBN 978-4-88788-232-4. [Google Scholar]
  47. Pergola, M.; D’Amico, M.; Celano, G.; Palese, A.M.; Scuderi, A.; Di Vita, G.; Pappalardo, G.; Inglese, P. Sustainability Evaluation of Sicily’s Lemon and Orange Production: An Energy, Economic and Environmental Analysis. J. Environ. Manag. 2013, 128, 674–682. [Google Scholar] [CrossRef] [Green Version]
  48. Beccali, M.; Cellura, M.; Iudicello, M.; Mistretta, M. Resource Consumption and Environmental Impacts of the Agrofood Sector: Life Cycle Assessment of Italian Citrus-Based Products. Environ. Manag. 2009, 43, 707–724. [Google Scholar] [CrossRef]
  49. Gazulla, C.; Raugei, M.; Fullana-i-Palmer, P. Taking a Life Cycle Look at Crianza Wine Production in Spain: Where Are the Bottlenecks? Int. J. Life Cycle Assess. 2010, 15, 330–337. [Google Scholar] [CrossRef]
  50. Bosco, S.; Di Bene, C.; Galli, M.; Remorini, D.; Massai, R.; Bonari, E. Greenhouse Gas Emissions in the Agricultural Phase of Wine Production in the Maremma Rural District in Tuscany, Italy. Ital. J. Agron. 2011, 6, 15. [Google Scholar] [CrossRef] [Green Version]
  51. Villanueva-Rey, P.; Vázquez-Rowe, I.; Moreira, M.T.; Feijoo, G. Comparative Life Cycle Assessment in the Wine Sector: Biodynamic vs Conventional Viticulture Activities in NW Spain. J. Clean. Prod. 2014, 65, 330–341. [Google Scholar] [CrossRef]
  52. García García, B.; Rosique Jiménez, C.; Aguado-Giménez, F.; García García, J. Life Cycle Assessment of Gilthead Seabream (Sparus Aurata) Production in Offshore Fish Farms. Sustainability 2016, 8, 1228. [Google Scholar] [CrossRef] [Green Version]
  53. García García, B.; Rosique Jiménez, C.; Aguado-Giménez, F.; García García, J. Life Cycle Assessment of Seabass (Dicentrarchus Labrax) Produced in Offshore Fish Farms: Variability and Multiple Regression Analysis. Sustainability 2019, 11, 3523. [Google Scholar] [CrossRef] [Green Version]
  54. Ruiz Sanchez, M.C.; Domingo, R.; Castel, J.R. Review Deficit Irrigation in Fruit Trees and Vines in Spain. Span. J. Agric. Res. 2010, 8, 5–20. [Google Scholar] [CrossRef] [Green Version]
  55. Fernández Alcázar, J.I. Costes de cultivo en viñedo. Cuad. Campo 2011, 46, 4–13. [Google Scholar]
  56. Navarro, A.; Puig, R.; Kılıç, E.; Penavayre, S.; Fullana-i-Palmer, P. Eco-Innovation and Benchmarking of Carbon Footprint Data for Vineyards and Wineries in Spain and France. J. Clean. Prod. 2017, 142, 1661–1671. [Google Scholar] [CrossRef]
  57. Manjón, S. Especial Informe de Vendimias 2018. La Sem. Vitiviníc. 2018, 3529, 1734–1739. [Google Scholar]
  58. Bajusová, Z.; Svoradová, L.; Dovác, D.; Bajus, P. Evaluation of the Impact of Labour Costs Development on Grapevine Production in the Slovak Republic through Algorithms. In International Scientific Days 2016. The Agri-Food Value Chain: Challenges for Natural Resources Management and Society; Horská, E., Kapsdorferová, Z., Hallová, M., Eds.; Slovak University of Agriculture in Nitra: Nitra, Slovakia, 2016; ISBN 978-80-552-1503-7. [Google Scholar]
  59. Torrellas, M.; Antón, A.; López, J.C.; Baeza, E.J.; Pérez Parra, J.; Muñoz, P.; Montero, J.I. LCA of a Tomato Crop in a Multi-Tunnel Greenhouse in Almeria. Int. J. Life Cycle Assess. 2012, 17, 863–875. [Google Scholar] [CrossRef]
  60. Balafoutis, A.T.; Koundouras, S.; Anastasiou, E.; Fountas, S.; Arvanitis, K. Life Cycle Assessment of Two Vineyards after the Application of Precision Viticulture Techniques: A Case Study. Sustainability 2017, 9, 1997. [Google Scholar] [CrossRef] [Green Version]
  61. Boulard, T.; Raeppel, C.; Brun, R.; Lecompte, F.; Hayer, F.; Carmassi, G.; Gaillard, G. Environmental Impact of Greenhouse Tomato Production in France. Agron. Sustain. Dev. 2011, 31, 757–777. [Google Scholar] [CrossRef] [Green Version]
  62. Keyes, S.; Tyedmers, P.; Beazley, K. Evaluating the Environmental Impacts of Conventional and Organic Apple Production in Nova Scotia, Canada, through Life Cycle Assessment. J. Clean. Prod. 2015, 104, 40–51. [Google Scholar] [CrossRef] [Green Version]
  63. Rinaldi, S.; Bonamente, E.; Scrucca, F.; Merico, M.C.; Asdrubali, F.; Cotana, F. Water and Carbon Footprint of Wine: Methodology Review and Application to a Case Study. Sustainability 2016, 8, 621. [Google Scholar] [CrossRef] [Green Version]
  64. Meier, M.S.; Stoessel, F.; Jungbluth, N.; Juraske, R.; Schader, C.; Stolze, M. Environmental Impacts of Organic and Conventional Agricultural Products—Are the Differences Captured by Life Cycle Assessment? J. Environ. Manag. 2015, 149, 193–208. [Google Scholar] [CrossRef] [PubMed]
  65. Meisterling, K.; Samaras, C.; Schweizer, V. Decisions to Reduce Greenhouse Gases from Agriculture and Product Transport: LCA Case Study of Organic and Conventional Wheat. J. Clean. Prod. 2009, 17, 222–230. [Google Scholar] [CrossRef]
  66. Ribal, J.; Ramírez-Sanz, C.; Estruch, V.; Clemente, G.; Sanjuán, N. Organic versus Conventional Citrus. Impact Assessment and Variability Analysis in the Comunitat Valenciana (Spain). Int. J. Life Cycle Assess. 2017, 22, 571–586. [Google Scholar] [CrossRef]
  67. Chatzisymeon, E.; Foteinis, S.; Borthwick, A.G.L. Life Cycle Assessment of the Environmental Performance of Conventional and Organic Methods of Open Field Pepper Cultivation System. Int. J. Life Cycle Assess. 2017, 22, 896–908. [Google Scholar] [CrossRef]
  68. García García, J.; García García, B.; García Castellanos, B. Manual de Buenas Prácticas Para el Cultivo de la Viña en la Región de Murcia; Grupo Operativo QVALITAS: Murcia, Spain, 2021; ISBN 978-84-09-32135-3. [Google Scholar]
Figure 1. Evolution of profitability based on premiums for quality.
Agronomy 12 03213 g001
Figure 2. Evolution of profitability based on premiums for organic management.
Agronomy 12 03213 g002
Figure 3. Differences in the potential environmental impacts for the four vineyard models in relation to CI, whose values represent 100%.
Agronomy 12 03213 g003
Figure 4. Contributions of the system components to the production costs (PC), environmental impacts (overall contribution, OC), and global warming (GW). In the production costs, each contribution was calculated without taking into account those aspects that do not represent an environmental impact (manpower, pruning, etc.). CR: conventional rainfed. OR: organic rainfed. CI: conventional irrigated. OI: organic irrigated.
Agronomy 12 03213 g004
Table 1. General characteristics of the four vineyard models. CR: conventional rainfed; OR: organic rainfed; CI: conventional irrigation; OI: organic irrigation.
CRORCIOI
Useful life of the vineyard (years)30302525
Average area (ha)30301010
Planting scheme (m × m)2.5 × 2.52.5 × 2.53 × 1.23 × 1.2
Yield in productive years
(kg ha−1)
3500325080007250
Non-productive years2222
Partially productive years (%) *1 (50%)1 (50%)
Infrastructure
(Useful life, years)
ATW (30 yrs.)ATW (30 yrs.)ATW (25 yrs.)
WR (25 yrs.)
IE (15 yrs.)
IN (10 yrs.)
ATW (25 yrs.)
WR (25 yrs.)
IE (15 yrs.)
IN (10 yrs.)
Fertilizer balance
(N-P2O5-K2O)
20-12-3520-12-3542-23-7342-23-73
Inorganic fertilizersNitrates
Phosphates
Nitrates
Phosphoric acid
Organic fertilizers Manure,
Organic
Organic
PhytosanitarySulfur
Penconazole
Bacillus thuringiensis
SulfurSulfur
Penconazole
Bacillus thuringiensis
Glyphosate
Sulfur
Carbonate (**)
* Percentage of yield in productive years. ** potassium hydrogen carbonate. ATW: Agricultural tools warehouse. WR: Water reservoir. IE: Irrigation equipment. IN: Irrigation network.
Table 2. Agronomic data of the four vineyard models (quantities per ha and year). CR: conventional rainfed; OR: organic rainfed; CI: conventional irrigation; OI: organic irrigation.
CRIRCIOI
Irrigation
Water (m3) 1230.001230.00
Electricity (kW∙h) 162.80162.80
Agricultural machinery
Diesel (dm3)116.45113.42113.8107.76
Fertilizers
Ammonium nitrate (kg)24.00 26.70
Potassium nitrate (kg)75.00 158.60
Magnesium nitrate (kg) 112.80
Phosphoric acid (dm3) 27.60
Ammonium phosphate (kg)20.00
Iron chelate (kg)1.601.605.005.00
Humic and fulvic acids (kg)3.20 10.0010.00
Manure (kg) 1000.00
Organic fertilizer (kg) 110.00 740.00
Phytosanitary products
Sulfur (kg)30.6076.6037.2064.00
Bacillus thuringiensis (kg)0.45 0.60
Penconazole (dm3)0.16 0.20
Potassium hydrogen carbonate (kg) 3.00
Glyphosate (dm3) 8.00
Table 3. Life cycle inventory of primary data of the four types of vineyard in relation to the functional unit (1 kg of grapes).
ComponentsUnitsCRORCIOI
Planting
Dieselg2.64902.85281.45891.6098
Irrigation reservoir
Dieselg 1.74911.9300
HDPE sheetg 0.75510.8332
Irrigation equipment
Ironmg 45.289949.9750
Steelmg 4.52904.9975
Coppermg 13.587014.9925
Brassmg 0.90580.9995
PVC pipemg 36.231939.9800
LDPE pipemg 1.81161.9990
Polyamidemg 2.71742.9985
HDPE tanksmg 40.760944.9775
Irrigation network
LDPE pipeg 4.41274.8692
Trellising system
Steel pipeg 9.260910.2189
Steel wireg 2.76413.0501
Agricultural machinery
Diesel 29.050230.511012.361512.9466
Irrigation
ElectricitykW∙h 0.02150.0237
Fertilizers
Magnesium nitrategN 2.8957
Potassium nitrategN3.2393 2.9681
Ammonium nitrategN2.6186 1.2699
Phosphoric acidg 3.4500
ManuregN 2.1315
Organic fertilizergN 2.1120 6.3460
Phytosanitary products
Sulfurg7.756321.56904.28138.3353
Penconazoleg0.0085 0.0049
P H carbonate (*)g 0.3412
Glyphosateg 0.9700
Waste treatment
Plastics to landfillg0.00530.00510.53070.5815
Plastic recyclingg0.05260.05094.77675.2331
Metal to landfillg 1.20891.3340
Metal recyclingg 10.880412.0059
* Potassium hydrogen carbonate. The plastic materials (LDPE, HDPE, and PVC) include raw materials and processes (extrusion and plastic film; extrusion and plastic pipes; blow molding).
Table 4. Cost structure of the four vineyard models.
ConceptCRORCIOI
AC
(€ ha−1)
RC
(%)
AC
(€ ha−1)
RC
(%)
Cost
(€ ha−1)
%/TC
(%)
Cost
(€ ha−1)
%/TC
(%)
Fixed costs
Shed for equipment7.610.527.610.5625.580.7125.580.77
Land preparation and planting124.028.52124.029.05360.2510.00360.2510.90
Auxiliary material3.380.233.380.2510.150.2810.150.31
Irrigation equipment 66.151.8466.152.00
Irrigation network 251.156.97251.157.60
Irrigation reservoir 18.710.5218.710.57
Total fixed costs
(€ ha−1)
135.029.27135.029.85731.9920.32731.9922.05
Variable costs
Production insurance85.265.8579.175.78194.885.41176.615.32
Pruning221.6815.22221.6816.17475.0213.18475.0214.31
Machinery413.1128.37399.0229.11514.0014.27422.4912.72
Fertilizers117.818.0976.535.58318.628.84225.846.80
Phytosanitary49.333.3942.833.1262.321.7394.602.85
Herbicides 64.961.80
Harvest283.8519.49266.2819.43544.2415.11496.7414.96
Maintenance4.570.314.570.3366.261.8466.262.00
Permanent staff145.6710.00145.6710.63291.358.09291.358.77
Irrigation water 299.638.32299.639.02
Electricity (irrigation) 39.671.1039.671.19
Total variable costs
(€ ha−1)
1321.2790.731235.7590.152870.9479.682588.2077.95
AC: absolute cost; RC: relative cost; TC: total cost (fixed costs + variable costs). RC (%) = 100 × AC/TC.
Table 5. Annual income of the four vineyard models.
CRORCIOI
Production (kg ha−1)3500325080007250
Baumé degrees (°Baumé)14.5014.5014.0014.00
Price (€kg °Baumé −1)0.03430.03430.03430.0343
Total income (€ ha−1)1739161538383478
Table 6. Values of the economic indicators for each scenario.
CRORCIOI
NM/Investment (%)7.106.131.691.13
NM/Variable costs (%)21.4019.758.186.10
NM/Total costs (%)19.4217.806.524.76
Viability threshold (€ kg−1)0.4160.4220.4500.458
Break-even point (kg ha−1)2931275975106921
Table 7. Values of the socio-territorial indicators for each scenario.
CRORCIOI
AWU ha−10.0500.0480.0990.093
Contribution to the regional economy (€ ha−1)1739161538383478
Area threshold (ha)25.1225.479.399.55
Table 8. Characterization of the potential environmental impacts and contributions of the components of the system in the conventional and organic rainfed vineyards.
Impact CategoryValuesInfrastructure
(%)
Machinery
(%)
Fertilizers
(%)
Phytosanitary
(%)
Waste
Treatment (%)
Conventional Rainfed
AD (kg Sb-eq)1.31 × 10−60.151.5998.270.30−0.31
ADFF (MJ)2.48 × 1005.6762.2329.742.49−0.13
GW (CO2-eq)2.49 × 10−14.0043.9151.610.51−0.03
OLD (kg CFC-11-eq)2.63 × 10−87.0477.2615.430.65−0.38
HT (kg 1,4-DB-eq)8.03 × 10−20.859.2889.190.73−0.05
FWAE (kg 1,4-DB-eq)4.35 × 10−20.606.5492.290.62−0.04
MAE (kg 1,4-DB-eq)8.35 × 10+10.849.1789.150.89−0.04
TE (kg 1,4-DB-eq)1.86 × 10−41.4916.3581.470.71−0.03
PO (kg C2H4-eq)3.79 × 10−52.7830.5057.369.42−0.07
A (kg SO2-eq)1.27 × 10−32.1923.9866.966.90−0.02
E (kg PO4-eq)3.28 × 10−41.5517.0481.140.260.00
Overall Contribution (%)2.4727.0868.422.13−0.10
Organic Rainfed
AD (kg Sb-eq)2.23 × 10−70.929.8387.203.83−1.78
ADFF (MJ)2.15 × 1007.0675.529.717.86−0.15
GW (CO2-eq)1.62 × 10−16.6370.8620.502.06−0.05
OLD (kg CFC-11-eq)2.59 × 10−87.7282.538.481.65−0.37
HT (kg 1,4-DB-eq)1.89 × 10−23.8841.5246.867.95−0.21
FWAE (kg 1,4-DB-eq)1.07 × 10−22.6228.0263.426.11−0.17
MAE (kg 1,4-DB-eq)2.12 × 1013.5437.8750.018.74−0.17
TE (kg 1,4-DB-eq)3.49 × 10−40.859.1389.100.93−0.01
PO (kg C2H4-eq)3.21 × 10−53.5437.8527.9130.78−0.07
A (kg SO2-eq)1.94 × 10−31.5416.5069.4512.52−0.01
E (kg PO4-eq)4.07 × 10−41.3514.4483.710.500.00
Overall Contribution (%)3.6038.5550.587.54−0.27
Table 9. Characterization of the potential environmental impacts and contributions of the components of the system in the conventional and organic irrigated vineyards.
Impact CategoryValuesInfrastructure
(%)
Machinery
(%)
Irrigation
(%)
Fertilizers (%)Phytosanitary (%)Waste
Treatment (%)
Conventional Irrigation
AD (kg Sb-eq)3.70 × 10−665.860.242.0630.283.73−2.18
ADFF (MJ)2.57 × 10050.0725.603.1731.727.01−17.58
GW (CO2-eq)2.20 × 10−143.6621.143.1438.245.20−11.38
OLD (kg CFC-11-eq)2.33 × 10−827.9637.191.6727.2710.07−4.16
HT (kg 1,4-DB-eq)1.19 × 10°94.700.270.444.730.75−0.89
FWAE (kg 1,4-DB-eq)2.83 × 10−184.490.432.5911.212.44−1.16
MAE (kg 1,4-DB-eq)4.74 × 10285.190.692.8111.043.37−3.09
TE (kg 1,4-DB-eq)1.35 × 10−383.990.965.507.882.62−0.95
PO (kg C2H4-eq)4.46 × 10−557.4611.044.4238.8515.64−27.41
A (kg SO2-eq)1.39 × 10−336.569.343.8148.826.91−5.44
E (kg PO4-eq)4.30 × 10−439.825.532.8544.5712.31−5.08
Overall Contribution (%)60.8910.222.9526.786.37−7.21
Organic Irrigation
AD (kg Sb-eq)3.65 × 10−673.560.252.309.1817.06−2.35
ADFF (MJ)1.97 × 10072.0235.004.577.755.86−25.21
GW (CO2-eq)1.77 × 10−159.6327.444.2921.562.61−15.53
OLD (kg CFC-11-eq)2.31 × 10−830.9139.181.855.2127.15−4.31
HT (kg 1,4-DB-eq)1.25 × 10°98.870.270.460.710.62−0.92
FWAE (kg 1,4-DB-eq)2.80 × 10−194.340.452.892.830.78−1.29
MAE (kg 1,4-DB-eq)4.66 × 10295.720.733.162.771.10−3.47
TE (kg 1,4-DB-eq)1.79 × 10−369.830.764.5725.180.45−0.79
PO (kg C2H4-eq)4.01 × 10−570.4812.865.4230.5814.26−33.60
A (kg SO2-eq)2.01 × 10−327.806.742.9060.466.23−4.13
E (kg PO4-eq)5.51 × 10−434.314.522.4561.341.76−4.37
Overall Contribution (%)66.1311.663.1720.697.08−8.73
Table 10. Relative differences between the different types of vineyard.
CR vs. ORCI vs. OICR vs. CIOR vs. OI
AD82.971.17−182.86−1541.20
ADFF13.4623.40−3.448.45
GW34.9219.3211.62−9.57
OLD1.680.5811.6110.62
HT76.52−5.68−1377.01−6547.13
FWAE75.491.18−550.49−2522.26
MAE74.561.80−467.96−2092.38
TE−88.09−32.70−624.43−411.11
PO15.3710.11−17.55−24.85
A−52.65−45.07−9.30−3.87
E−23.96−28.07−31.23−35.58
CR vs. OR = 100 × (CR−OR)/CR; CI vs. CO = 100×(CI−CO)/CI; CR vs. CI = 100×(CR−CI)/CR; OR vs. OI = 100×(OR−OI)/OR.
Publisher’s Note: MDPI stays neutral with regard to jurisdictional claims in published maps and institutional affiliations.

