Article

Changes in Rhizosphere Soil Nutrients, Enzyme Activities, and Microbial Communities at Different Stages of Industrial Hemp Development

1
Daqing Branch of Heilongjiang Academy of Agricultural Sciences, Daqing 163316, China
2
School of Forestry, Northeast Forestry University, Harbin 150040, China
3
Heilongjiang Academy of Agricultural Sciences, Harbin 150086, China
*
Authors to whom correspondence should be addressed.
These authors contributed equally to this work.
Agronomy 2022, 12(12), 3159; https://doi.org/10.3390/agronomy12123159
Submission received: 17 November 2022 / Revised: 9 December 2022 / Accepted: 10 December 2022 / Published: 13 December 2022
(This article belongs to the Special Issue Multifunctionality of Belowground Food Webs)

Abstract

:
Determining the nutrient requirements of industrial hemp to increase the yield requires quantifying variations in soil nutrients and enzyme activities in different growth stages, along with relevant soil microbial response. This study investigated the effects of different growth stages of industrial hemp on rhizosphere soil nutrients, enzyme activities, and microbial communities. The results showed that with the increase in the growth stages, the pH and available phosphorus (AP) decreased, while the soil organic matter (SOM), available nitrogen (AN), and available potassium (AK) increased substantially, indicating that the demand for nutrients of industrial hemp was constantly changing. Proteobacteria, Acidobacteria, Ascomycota, and Basidiomycota were found to be the keystone taxa to adapt to the nutrient requirements of industrial hemp at different growth stages by regulating soil enzyme activity. Furthermore, using the redundancy analysis and Spearman’s correlation analysis, we found that microbial taxonomic composition was related to the variations in AN, AP, and pH. In general, we emphasized that the interaction between industrial hemp and soil is closely related to the growth stage, which increases plant adaptability and growth because of the change of soil microorganisms.

1. Introduction

Industrial hemp (Hemp sativa L.), which has less than 0.3% ∆9-tetrahydrohempnol (THC), is a non-toxic and multipurpose cash crop [1]. In the past decade, with the development and utilization of industrial hemp in agriculture, medicine, construction, and the paper industry [2,3], the economic value of industrial hemp has been paid increasing attention [4]. Oil seeds and cannabidiol (CBD) are considered the largest and most promising markets for hemp production in North America and Europe [2,5]. The world market for industrial hemp cultivation is expanding. Therefore, understanding the growth characteristics of industrial hemp is crucial for increasing production and quality, which is conducive to developing cultivation and management strategies.
Rhizosphere microorganisms are the soil microbes mostly affected by plants. They are involved in regulating plant growth, morphology, and development by promoting the nutrient release of litter and improving the nutrient absorption of the root system [6,7,8,9]. Rhizosphere soil nutrients provide energy for the proliferation, distribution, and development of microorganisms [9,10]. Generally, rhizosphere microorganisms promote the formation of soil organic matter, litter decomposition, and nutrient cycling by improving soil enzyme activity to meet the needs of crops for nutrient absorption at different growth stages [11,12]. Moreover, the structure and function of microbial communities are altered by the constant changes in soil carbon content and pH value and the availability of nutrients, indicating the complexity of the interaction between soil and microorganisms [13]. Rhizosphere microorganisms also use soil as a medium to enhance the stress resistance of plants, which largely determines the yield and quality of crops [14,15]. For instance, the crop roots will produce metabolites (e.g., sugars, organic acids, amino acids) to attract microbial colonization and trigger plant defense mechanisms to withstand environmental stress [16] or inhibit the growth of pathogens by competing for nutrients and occupying niches through rhizosphere probiotics to indirectly promote plant growth [17]. In contrast, the microecological imbalance in the rhizosphere is the primary reason for the increase of pathogenic bacteria, thus reducing crop yield [17,18]. Currently, the research on rhizosphere microorganisms of industrial hemp mainly focuses on how the various tillage measures impact the soil microbial community and its diversity [19,20]. However, rhizosphere nutrients primarily come from soil supply, and rhizosphere microorganisms participate in the nutrient demand of crops in different growth periods, essentially a process of interaction of soil, microorganisms, and yield [21,22]. Therefore, understanding the interaction between soil nutrients and microbial communities in the rhizosphere of industrial hemp at various growth stages is conducive to large-scale cultivation.
Industrial hemp is prone to nutrient imbalance, disease aggravation, and quality deterioration in the growth process [22]. Hence, studying the impacts of various growth phases of industrial hemp on soil properties and microorganisms can reveal the supply and demand relationship between industrial hemp and soil nutrients in the growth process [23]. The current study was designed to examine the rhizosphere soil environment of industrial hemp at various stages, including the seedling, rapid growth, flowering, and maturity stages. Specifically, our purpose was to clarify the characteristics of soil nutrient and enzyme activity changes in industrial hemp in different growth stages, thus revealing the changing characteristics of bacteria and fungi in rhizosphere soil at different growth stages, along with their main influencing factors. Our research results provide a complete perspective on the growth of industrial hemp and offer a valuable reference for future sustainable cultivation.

2. Materials and Methods

2.1. Study Area

The current research was conducted at the Anda industrial hemp cultivation base in Anda city, Heilongjiang Province, China (46°39′ N, 125°37′ E). It is located in the wind-sand saline-alkali semi-arid area of western Heilongjiang Province, with a temperate continental monsoon climate. The mean annual precipitation is 450 mm, the mean annual temperature is 3.2 °C, and the soil type in the study area is chernozem (Haplic Chernozem, FAO). The physical and chemical properties of soil were reported as the following [20]: soil bulk density (SBD) 1.48 g·cm−3; pH 8.5; soil organic matter (SOM) 26.05 g·kg−1; available soil nitrogen (AN) 134.51 mg·kg−1; available phosphorus (AP) 14.26 mg·kg−1; available potassium (AK) 154.91 g·kg−1.

2.2. Field Experiment

In this study, we set up three replicate sample plots, each covering an area of 400 m2, and the distance between the plots was approximately 50 m to avoid mutual interference. Before planting industrial hemp, the sample plots were planted with soybeans for two consecutive years. The industrial hemp seeds were planted in May 2018, and the soil samples were collected separately at seedling, rapid growth, flowering, and maturity stages (Table 1). In particular, we collected the rhizosphere soil of plants with the same growth trend through five points with the “S”-shaped distribution in each sampling period. Subsequently, the loose soil at the roots was removed, and the soil adhering to the fine roots was defined as rhizosphere soil [24]. The soil samples were equally divided into three parts after mixing from five points. The first part was air-dried and passed through 1 and 0.25 mm sieves to determine the pH, SOM, AN, AP, AK, electrical conductivity (EC), and copper (Cu) and zinc (Zn); the second part was stored at 4 °C for the analysis of soil enzyme activity and the number of microorganisms within one week; the third part was stored at −20 °C for DNA high-throughput sequencing within one month.

2.3. Soil Sample Determination

2.3.1. Physical and Chemical Properties of Soil

After grinding the soil sample and passing it through a 2 mm sieve, its physicochemical properties were obtained using the earlier research methods [19]. A calibrated pH meter was used to measure the pH value; the K2Cr2O7 colorimetric method was used to measure SOM; the alkali diffusion method was used to measure AN; a spectrophotometer was used to measure AP after extraction with 0.5 mol/L NaHCO3; the ammonium acetate extraction flame photometric method was utilized to measure AK; the conductivity method was utilized to measure EC. In addition, the soil was digested with mixed acid (nitric acid, perchloric acid, hydrofluoric acid), and an atomic absorption spectrophotometer was used to determine the Cu and Zn content.

2.3.2. Soil Enzyme Activities

Extracellular enzyme activity was measured using a Solarbio soil BG kit (Beijing Solarbio Science & Technology Co., Ltd., Beijing, China) according to the previously described method [25]. Soil catalase activity was assessed by utilizing potassium permanganate titration; soil urease was assessed via the sodium phenol–sodium hypochlorite colorimetric method; soil phosphatase activity was measured using the phenyl disodium phosphate colorimetric method; soil sucrase activity was assessed using the 3,5-dinitrosalicylic acid colorimetry method; soil nitrate reductase activity was assessed utilizing the phenol disulfonic acid colorimetry method; soil protease activity was assessed using the ninhydrin colorimetry method; soil polyphenol oxidase activity was measured using the pyrogallol colorimetry method.

2.3.3. Count of Bacteria, Fungi, and Actinomycetes in Soil

In this study, the plate counting method was followed to measure the number of culturable microorganisms in the soil [26]. A total of 100 μL diluted soil suspension was inoculated into a beef extract peptone agar medium, Thayer-Martin medium, and Gaoshi No. 1 medium to culture and observe the growth of soil bacteria, fungi, and actinomycetes. Experiments on each sample were repeated three times to improve the accuracy of the results. Bacteria were cultured at 28 °C for 24 h, fungi at 25 °C for 4 days, and actinomycetes at 28 °C for 7 days. The plate was examined every day to calculate the total number of microorganisms by counting the number of colony-forming units.

2.3.4. DNA Extraction, PCR, and Sequencing of the 16S and ITS rRNA Gene

The E.Z.N.A.® Soil DNA Kit (MoBio, Carlsbad, CA, USA) was utilized to extract the DNA from 0.5 g fresh soil samples as per the manufacturer’s protocols. The DNA integrity was detected with 1% agarose gel, and DNA sample concentration was quantitatively detected with a NanoDrop ND 200 spectrophotometer (Thermo Scientific, Waltham, MA, USA). Primers were designed for the highly variable regions of soil bacteria and fungi, Polymerase chain reaction (PCR) amplification was carried out, and the sequencing library was prepared. The highly variable region of bacterial 16S rRNA gene V3-V4 was amplified using the primers 341F (5′-ACT CCT ACG GGA GGC AGC A-3′) and 806R (5′-GGA CTA CHV GGG TWT CTA AT-3′); the ITS1-ITS2 variable region of the fungal ITS rRNA gene was amplified using the primers ITS1F (5′-CTT GGT CAT TTA GAG GAA GTA A-3′) and ITS2 (5′-GCT GCG TTC TTC ATC GAT GC-3′). PCR was conducted using the following program: initial denaturation at 94 °C for 3 min, followed by 25 cycles of 30 s at 94 °C; annealing at 45 °C for 20 s; elongation at 65 °C for 30 s; a final extension at 72 °C for 5 min. Each PCR cycle volume contained 15 μL of 2×Hieff® Robust PCR Master Mix (Yeasen, Shanghai, China), 1 μL primer, 20 ng of DNA template, and use of ddH2O to make up to 30 μL. During the DNA extraction procedure, 2% agarose gel electrophoresis was used to confirm PCR products. Ultrapure water was utilized as a negative control in place of a sample solution to prevent the probability of generating false-positive PCR results. The purification of PCR products was done using AMPure XT beads (Beckman Coulter Genomics, Danvers, MA, USA), quantification using Qubit (Invitrogen, San Diego, CA, USA), and sequencing was carried out at Sangon Biotech Co., Ltd., Shanghai, China. Taxonomic Units (OTUs) at a similarity level of 97% were clustered in USEARCH (version 10.0) to taxonomic identify and classify 16S rRNA and ITS genes, respectively, using the Silva reference database (Release 132, http://www.arb-silva.de, accessed on 5 August 2022) and the Unite reference database (Release 7.2, http://unite.ut.ee/index.php, accessed on 5 August 2022). The raw sequence data generated were imported into the National Center for Biotechnology Information (NCBI) under BioProject number PRJNA891135 (bacteria and fungi).

2.4. Statistical Analyses

R version 4.2.1 was used to conduct statistical analyses. We used a one-way analysis of variance (ANOVA) to test for differences in soil properties, enzyme activities, and microbial diversity index. Duncan’s multiple comparison method was employed to test for between-groups pairwise comparison at p < 0.05. The samples at the genus level were classified by the system clustering method with the R Stats package. The principal component analysis (PCA) was performed to identify the differences (variations) between bacteria and fungi in the soil samples. Furthermore, the redundancy analysis (RDA) and Spearman’s correlation analysis were employed to examine the impact of soil physicochemical properties on the microbial community.

3. Results

3.1. Soil Properties at Different Growth Stages of Industrial Hemp

The outcomes revealed remarkable differences in pH, EC, SOM, AN, AP, AK, and Cu and Zn content in different growth phases (p < 0.01). With the increase in growth time of industrial hemp, the pH and AP decreased, whereas the EC, SOM, AN, AK, Cu, and Zn content increased significantly (Table 2). Compared with the seedling stage, pH and AP decreased by 1.64% and 34.89%, respectively, in the maturity stage; the EC, SOM, AN, AK, and Cu and Zn content increased by 2.42%, 14.66%, 39.52%, 34.89%, 102.65%, 139.87%, and 114.88%, respectively.

3.2. Soil Enzyme Activities at Different Growth Stages of Industrial Hemp

The variations in soil enzyme activities in various growth phases of industrial hemp were remarkably different (Table 3). The activities of soil urease and nitrate reductase decreased from the seedling stage to the flowering stage; their maximum values were observed in the rapid growth stage (1.85 mg/g·d) and seedling stage (0.34 mg/g·d), respectively. The activities of polyphenol oxidase were lowest in the maturity stage (20.41 mg/g·d) and were the maximum in the seedling stage (25.69 mg/g·d). Furthermore, the activities of protease, phosphatase, catalase, and sucrase increased with the developmental stages of industrial hemp, reaching the maximum at the maturity stage.

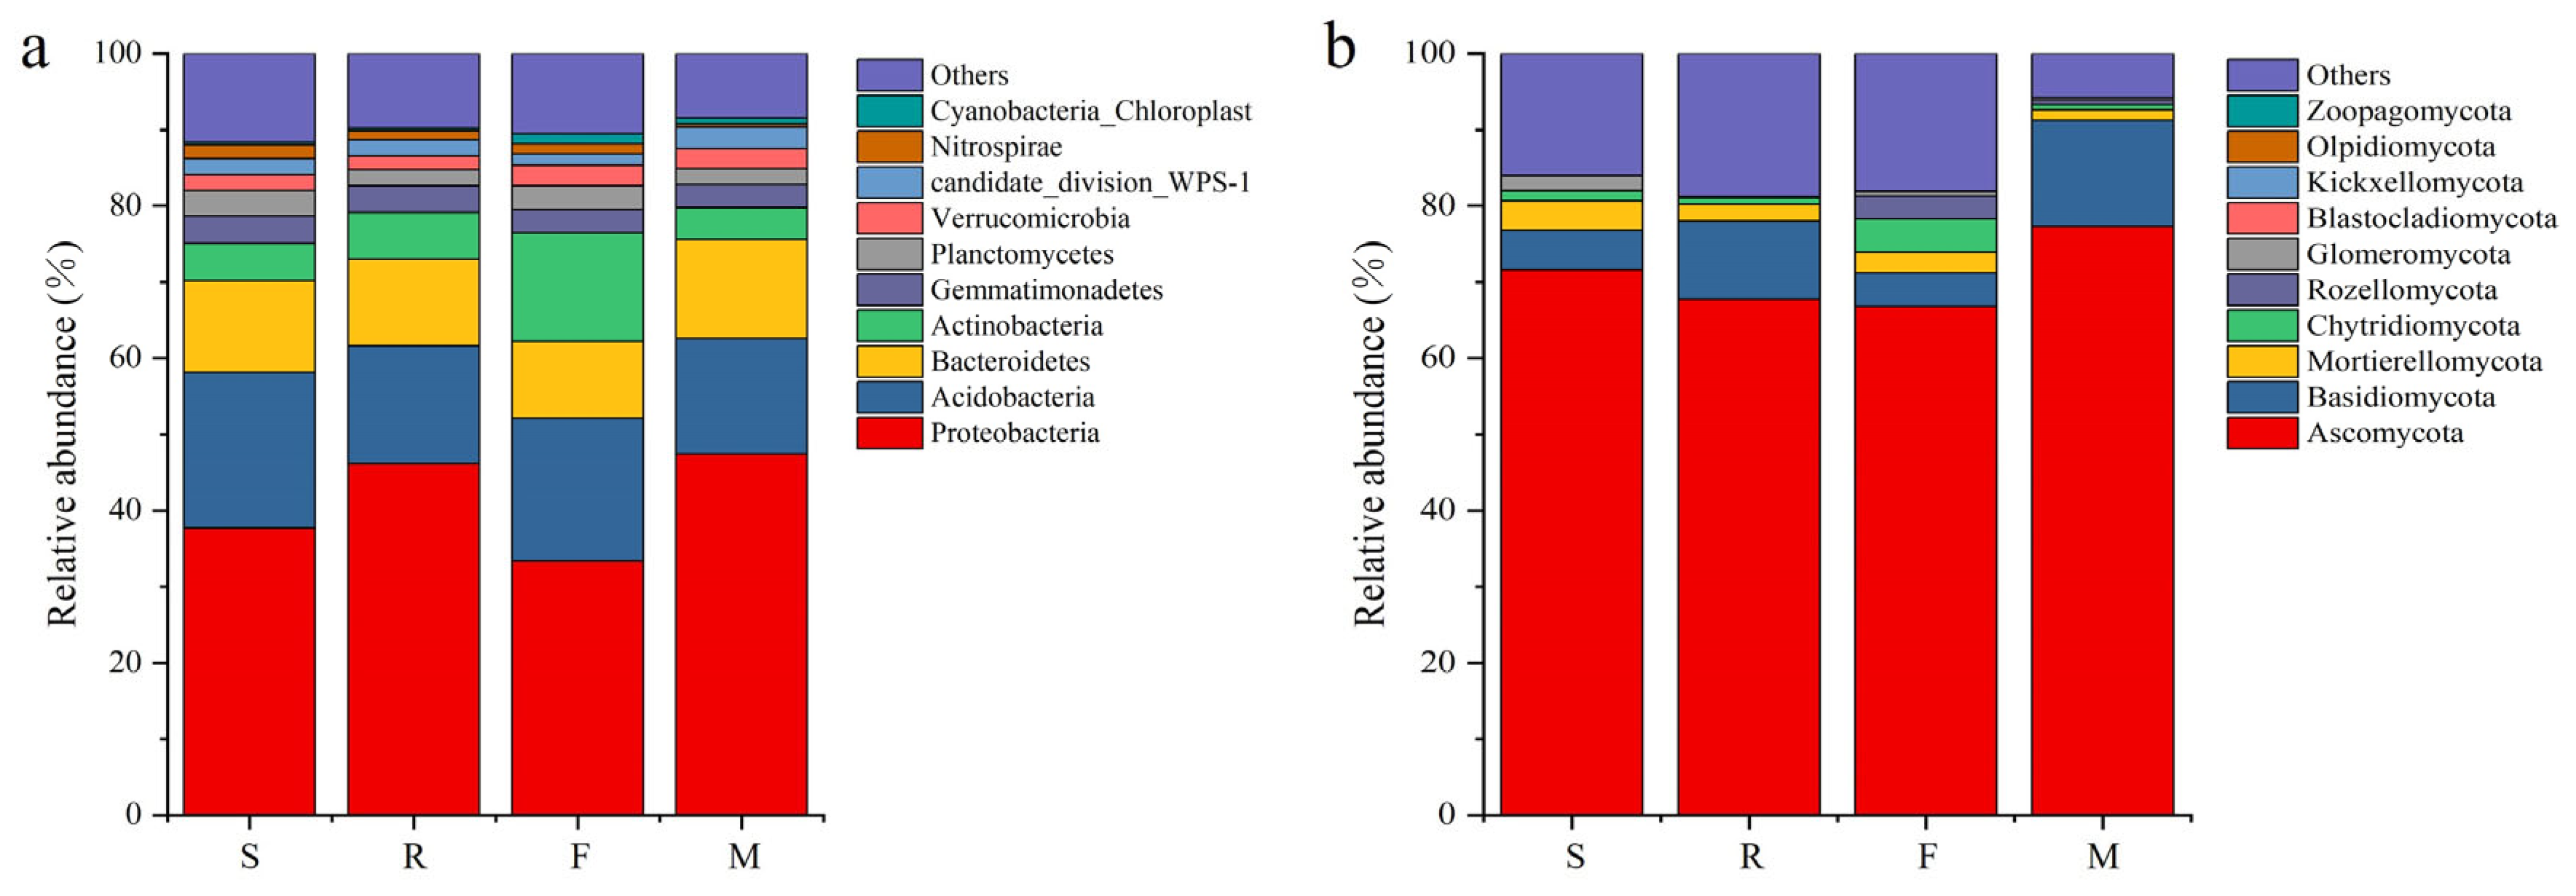
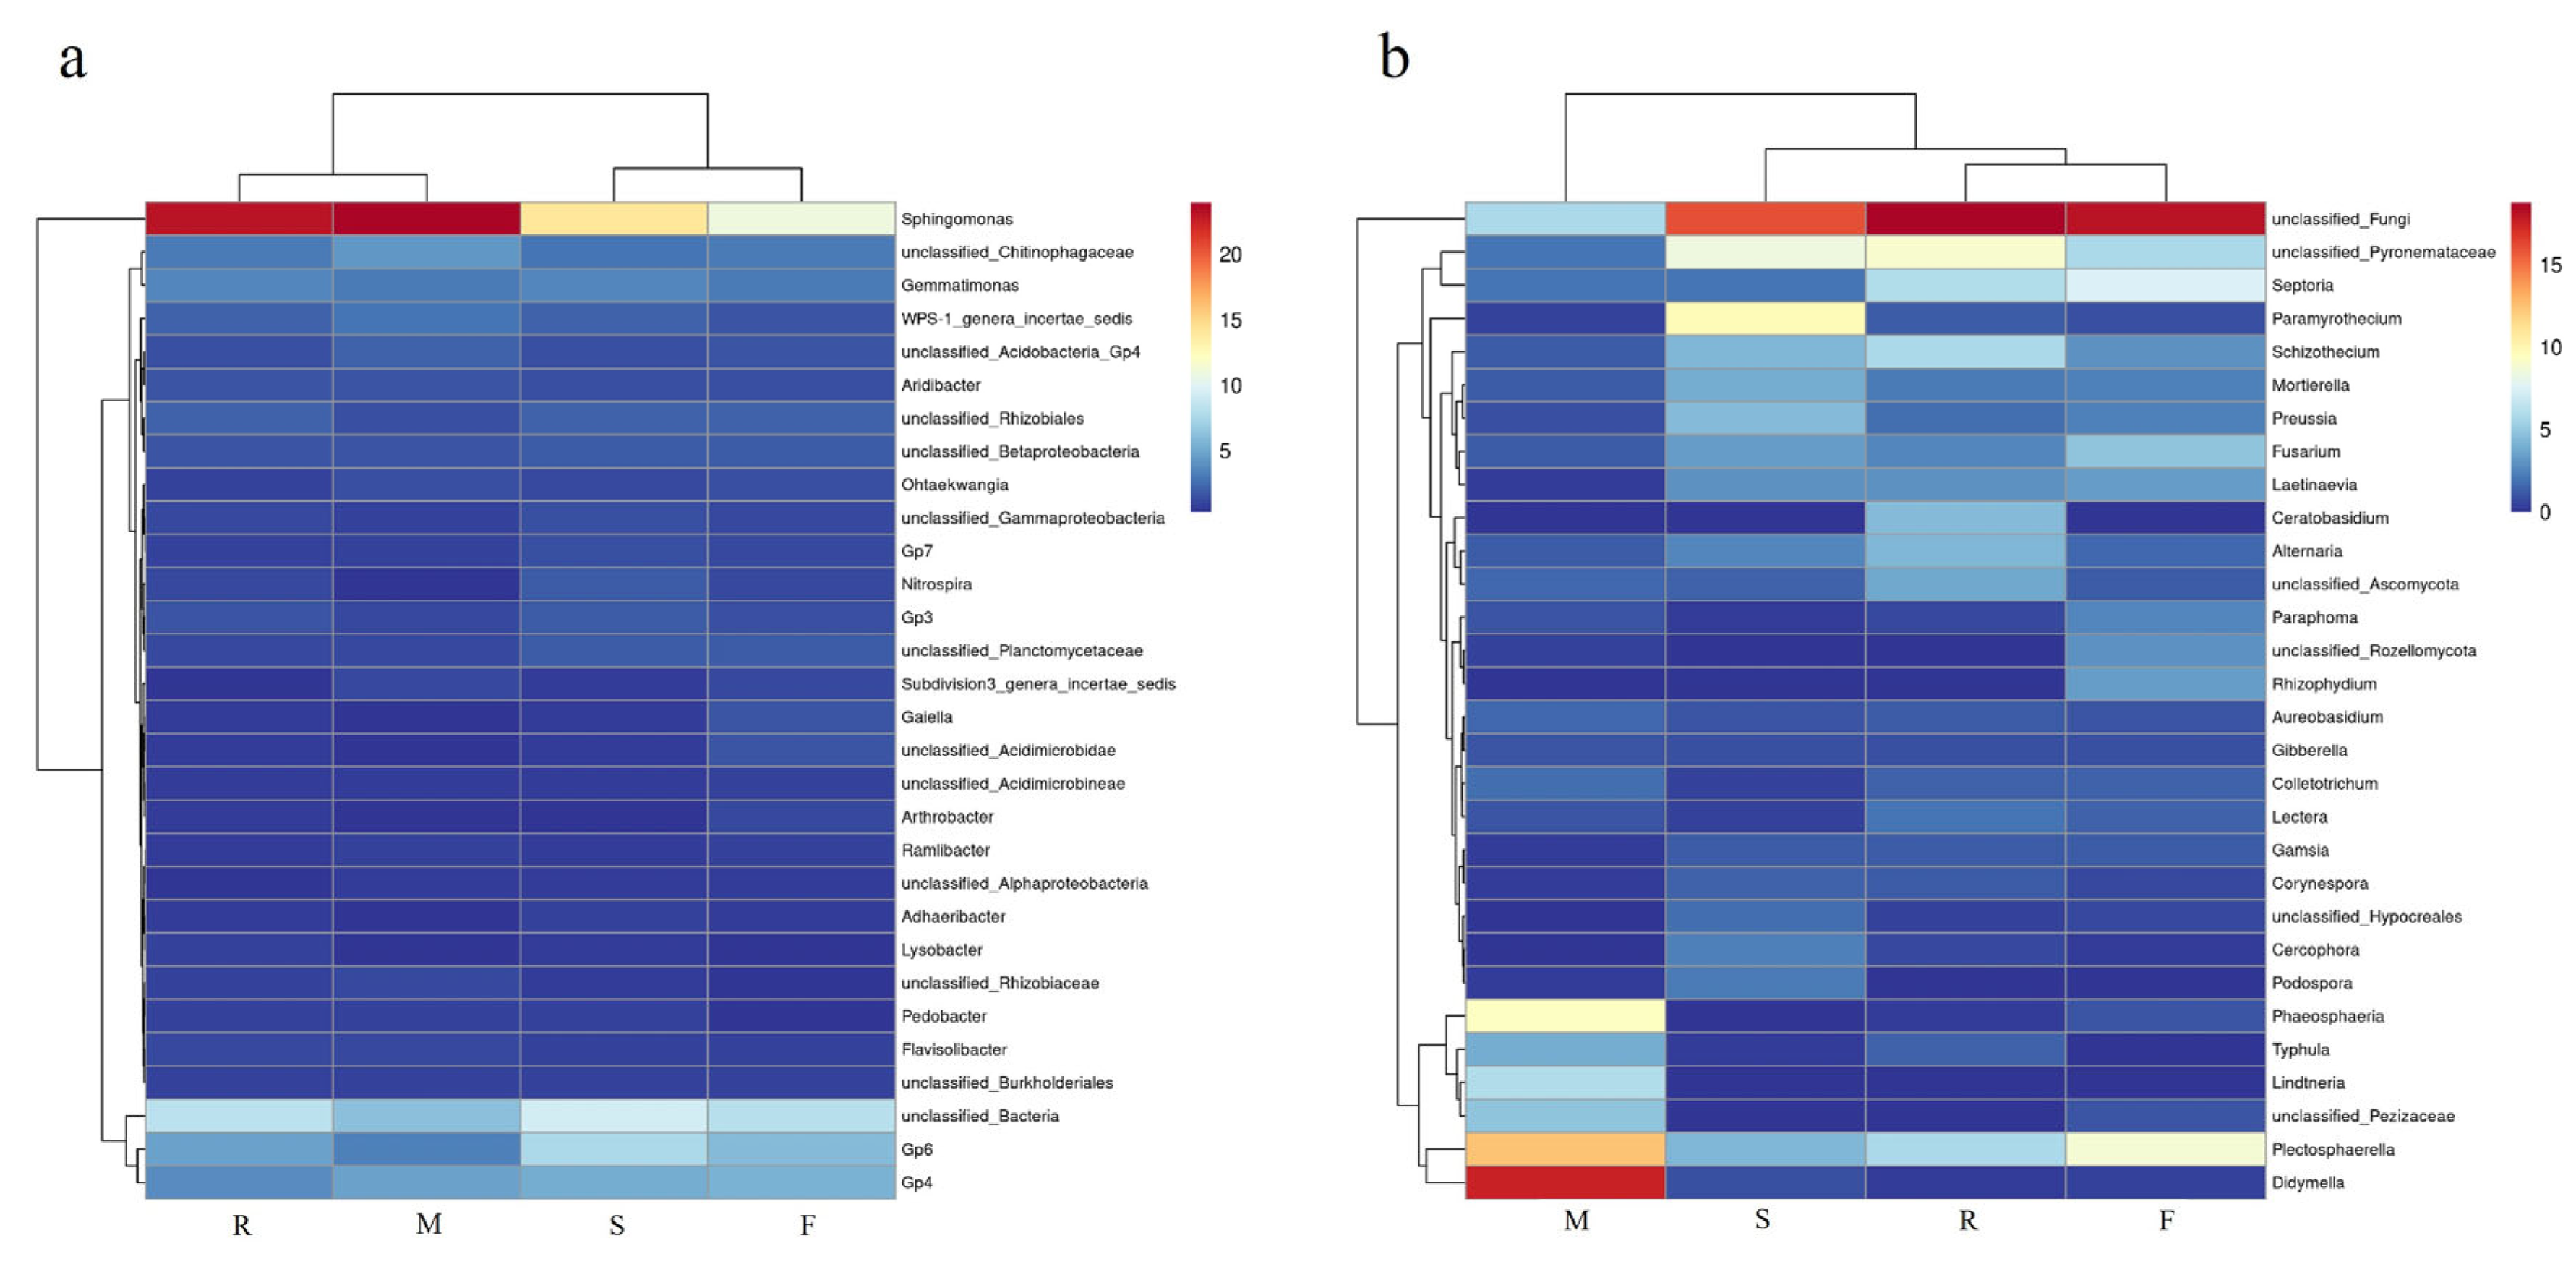
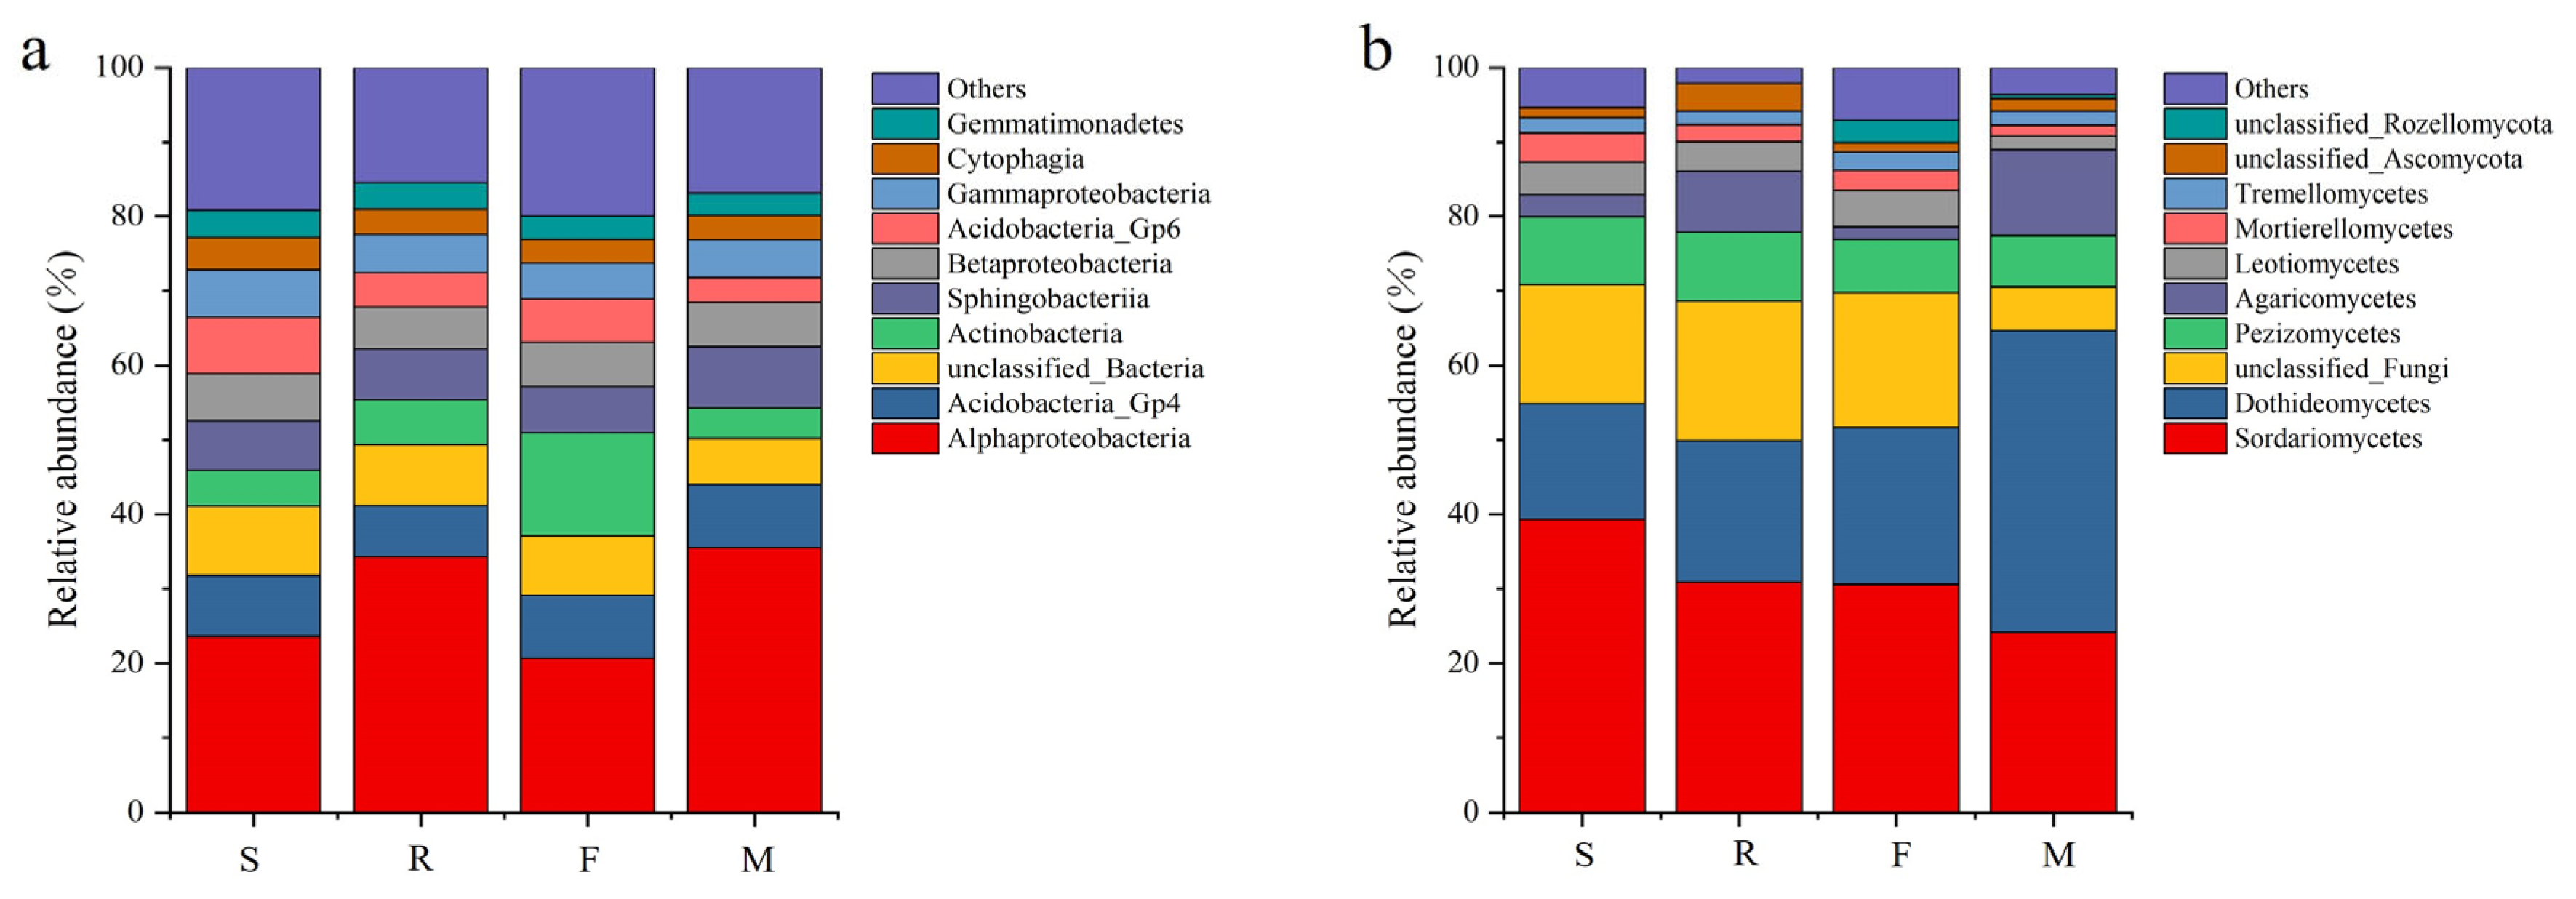
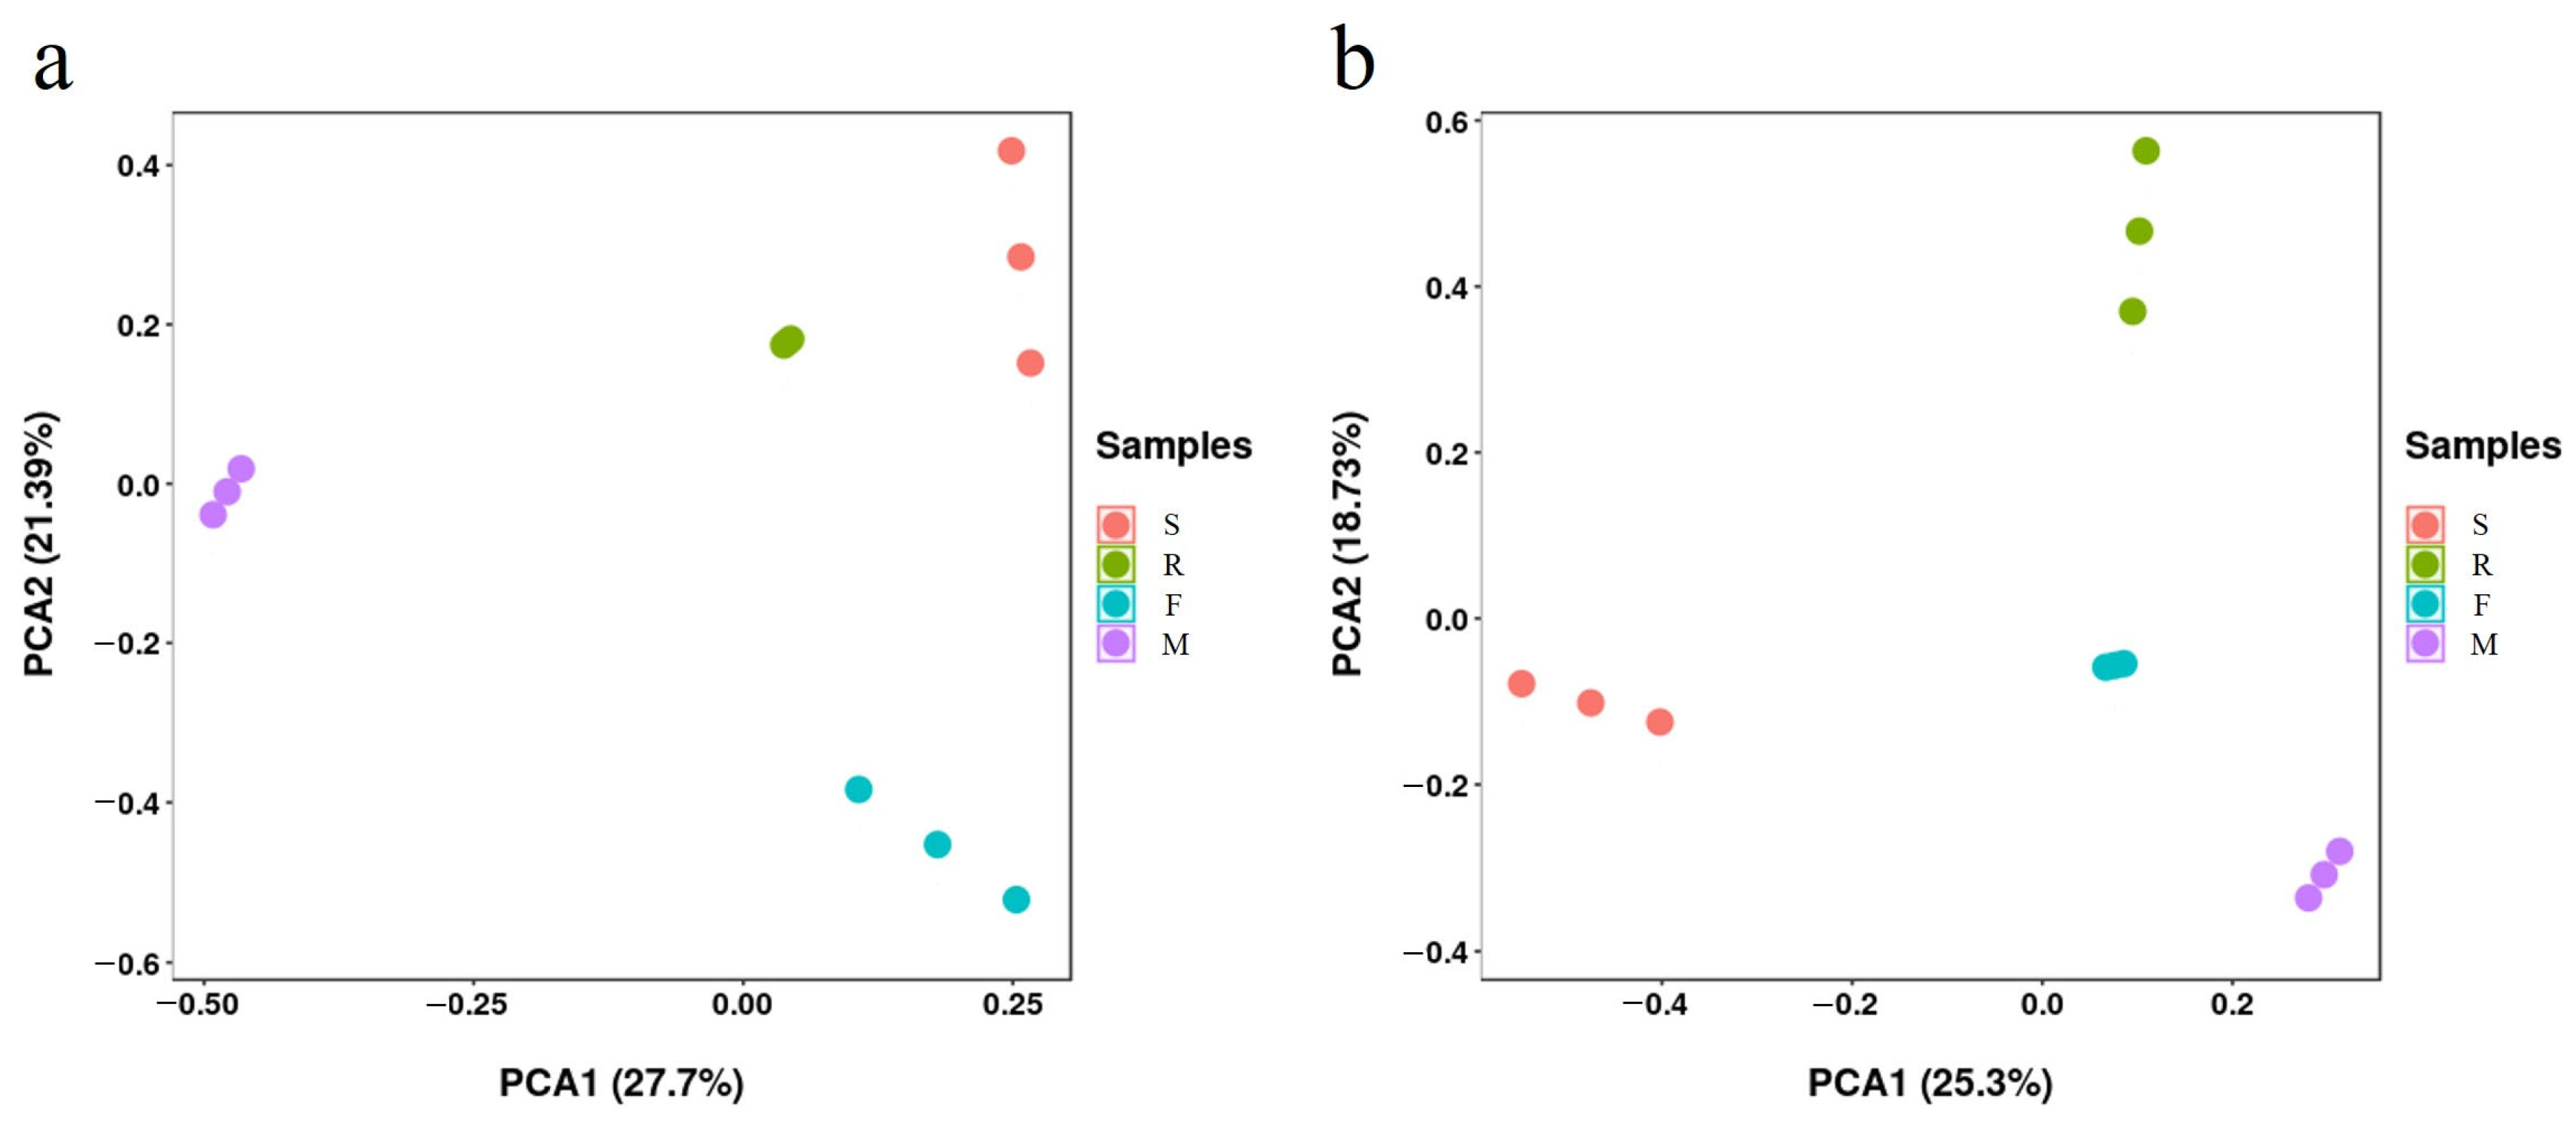
3.3. Soil Microbial Quantity and Community at Different Growth Stages of Industrial Hemp

The number of soil bacteria, fungi, and actinomycetes decreased from the seedling to the rapid growth and flowering stage and then started to increase to the maturity stage (Table 4). Their maximum values appeared in the seedling stage as 1.97 × 10⁶ cfu/(g·soil), 0.46 × 10³ cfu/(g·soil), and 2.25 × 10⁶ cfu/(g·soil), respectively.
The soil microbial richness and diversity index differed significantly (Table 5). The Chao1, ACE, Shannon, and Simpson indexes in bacteria decreased first and then increased with the growth time. The Chao1 and ACE indexes in fungus increased with the growth time, while the Shannon and Simpson indexes decreased with the growth time. In addition, no remarkable difference in the coverage index of soil bacteria and fungi was observed.
In the rhizosphere of industrial hemp in four different development phases, Proteobacteria, Acidobacteria, Bacteroidetes, Actinobacteria, Gemmatimonadetes, Planctomycetes, Verrucomobia, candidate_ division_ WPS-1, Nitrospirae, and Cyanobacterium_ Chloroplast were the top 10 dominant bacterial species at the phyla level (Figure 1a), accounting for 88.33–91.58% of all bacterial taxa. Proteobacteria was much richer than other phyla taxa, accounting for 33.38–47.45% of the total bacterial taxa in different rhizosphere soil samples. Acinetobacter and Bacteroides accounted for 15.09–20.42% and 10.08–13.00% of the bacterial groups, respectively. Contrary to Acidobacteria, the relative abundance of Proteobacteria at the rapid growth and seed maturity stages was more significant than in the seedling and flowering stages. A decrease in the relative abundance of Bacteroides was initially observed, which later rose during the entire growth stage. In addition, Ascomycota and Basidiomycota, which accounted for 66.80–77.26% and 4.40–13.94% of the fungal taxa (Figure 1b), respectively, were the dominant fungi species at the phyla level. Initially, a decrease in the relative abundance of Ascomycota was observed, which increased during the maturity stage. Furthermore, the relative abundance of Basidiomycota increased in the rapid growth and seed maturity stages but decreased in the seedling and flowering stages.
At the class level (Figure 2a), the main bacteria were Alphaproteobacteria (20.64–35.44%), Acidobacteria_ Gp4 (6.81–8.57%), Actinobacteria (4.14–13.89%), Sphingobasteria (6.67–8.22%), Betaproteobartia (5.62–6.32%), Gammaproteobartia (4.80–6.37%), Cyclophagia (3.18–4.38%), and Gemmatimonadetes (3.07–3.61%). At the same level (Figure 2b), the dominant fungi were Sordariomycetes (24.10–39.30%), Dothideomycoetes (15.47–40.61%), Pezizomycoetes (6.90–9.23%), Agaricamycoetes (1.68–11.89%), Leotiomycetes (1.89–4.92%), Mortierellomycetes (1.37–3.85%), and Tremellomycetes (1.88–2.45%).
At the genus level (Figure 3a), Sphingomonas (14.07–23.99%), Gp6 (3.37–7.59%), and Gp4 (3.78–5.31%) were the top 3 bacterial genera in all rhizosphere soils. Other major bacterial genera included Gemmatimonas (3.07–3.61%), WPS-1_genera_incertae_sedis (1.50–2.83%), Aridibactor (1.32–1.70%), Gp3 (1.10–1.76%), Ohtaekwangia (1.01–1.40%), and Nitrospira (0.43–1.80%). The relative abundance of Sphingomonas was 23.18% and 23.99% in the rapid growth and maturity stages, respectively. The relative abundance of Gp6, Gp4, and Gemmatimonas gradually decreased with the growth stage, while WPS-1_genera_incertae_sedis and Aridibacter increased gradually. In addition, Plectosphaerella (4.19–12.43%), Didymella (0.80–17.54%), and Septoria (2.07–7.55%) were the three major genera with a high relative abundance of fungi in the rhizosphere soil (Figure 3b). Other major fungal genera were Schizothecium (4.27–1.31%), Paramyrothecium (0.57–9.85%), Fusarium (1.24–4.82%), Phaeosphaeria (0.13–9.39%), and Mortierella (1.29–3.83%). Among those, with an increase in the growth stage, Plectosphaerella, Didymella, and Phaeosphaeria gradually increased, while Schizothecium, Paramyrothecium, Fusarium, and Mortierella gradually decreased.
In this study, PCA analysis was conducted on bacterial and fungal OTU in rhizosphere soil at different growth stages (Figure 4). The first two components explained 49.09% of the bacterial variation and 44.03% of the fungal variation, respectively. With the increased growth time, both microbial communities in soil samples at different times tended to separate.

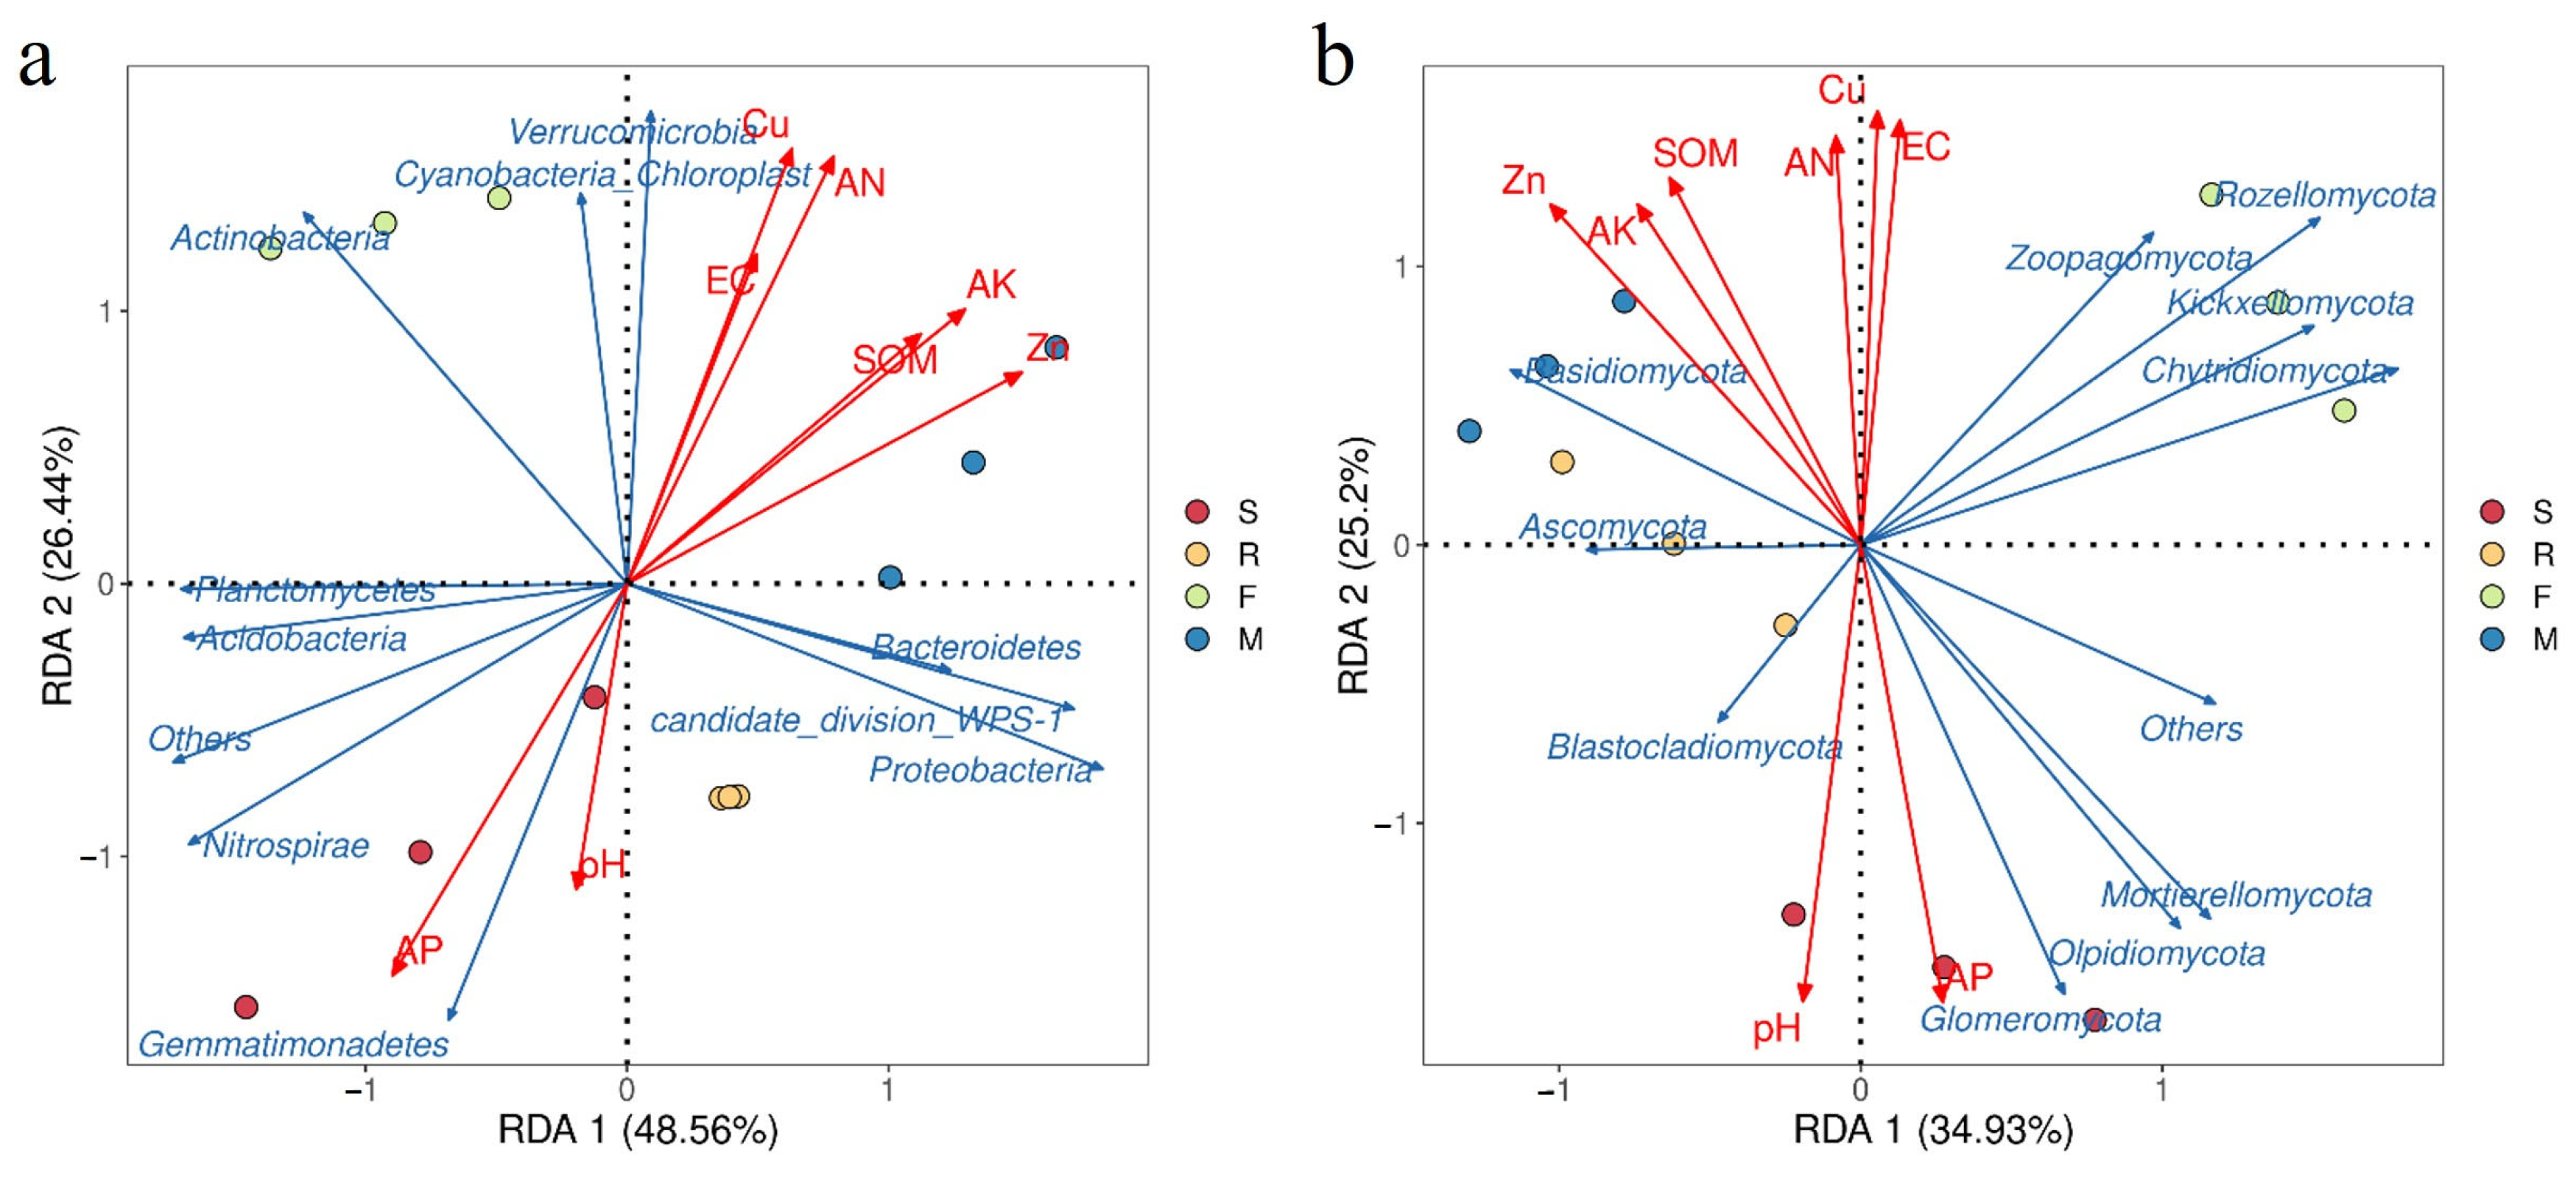
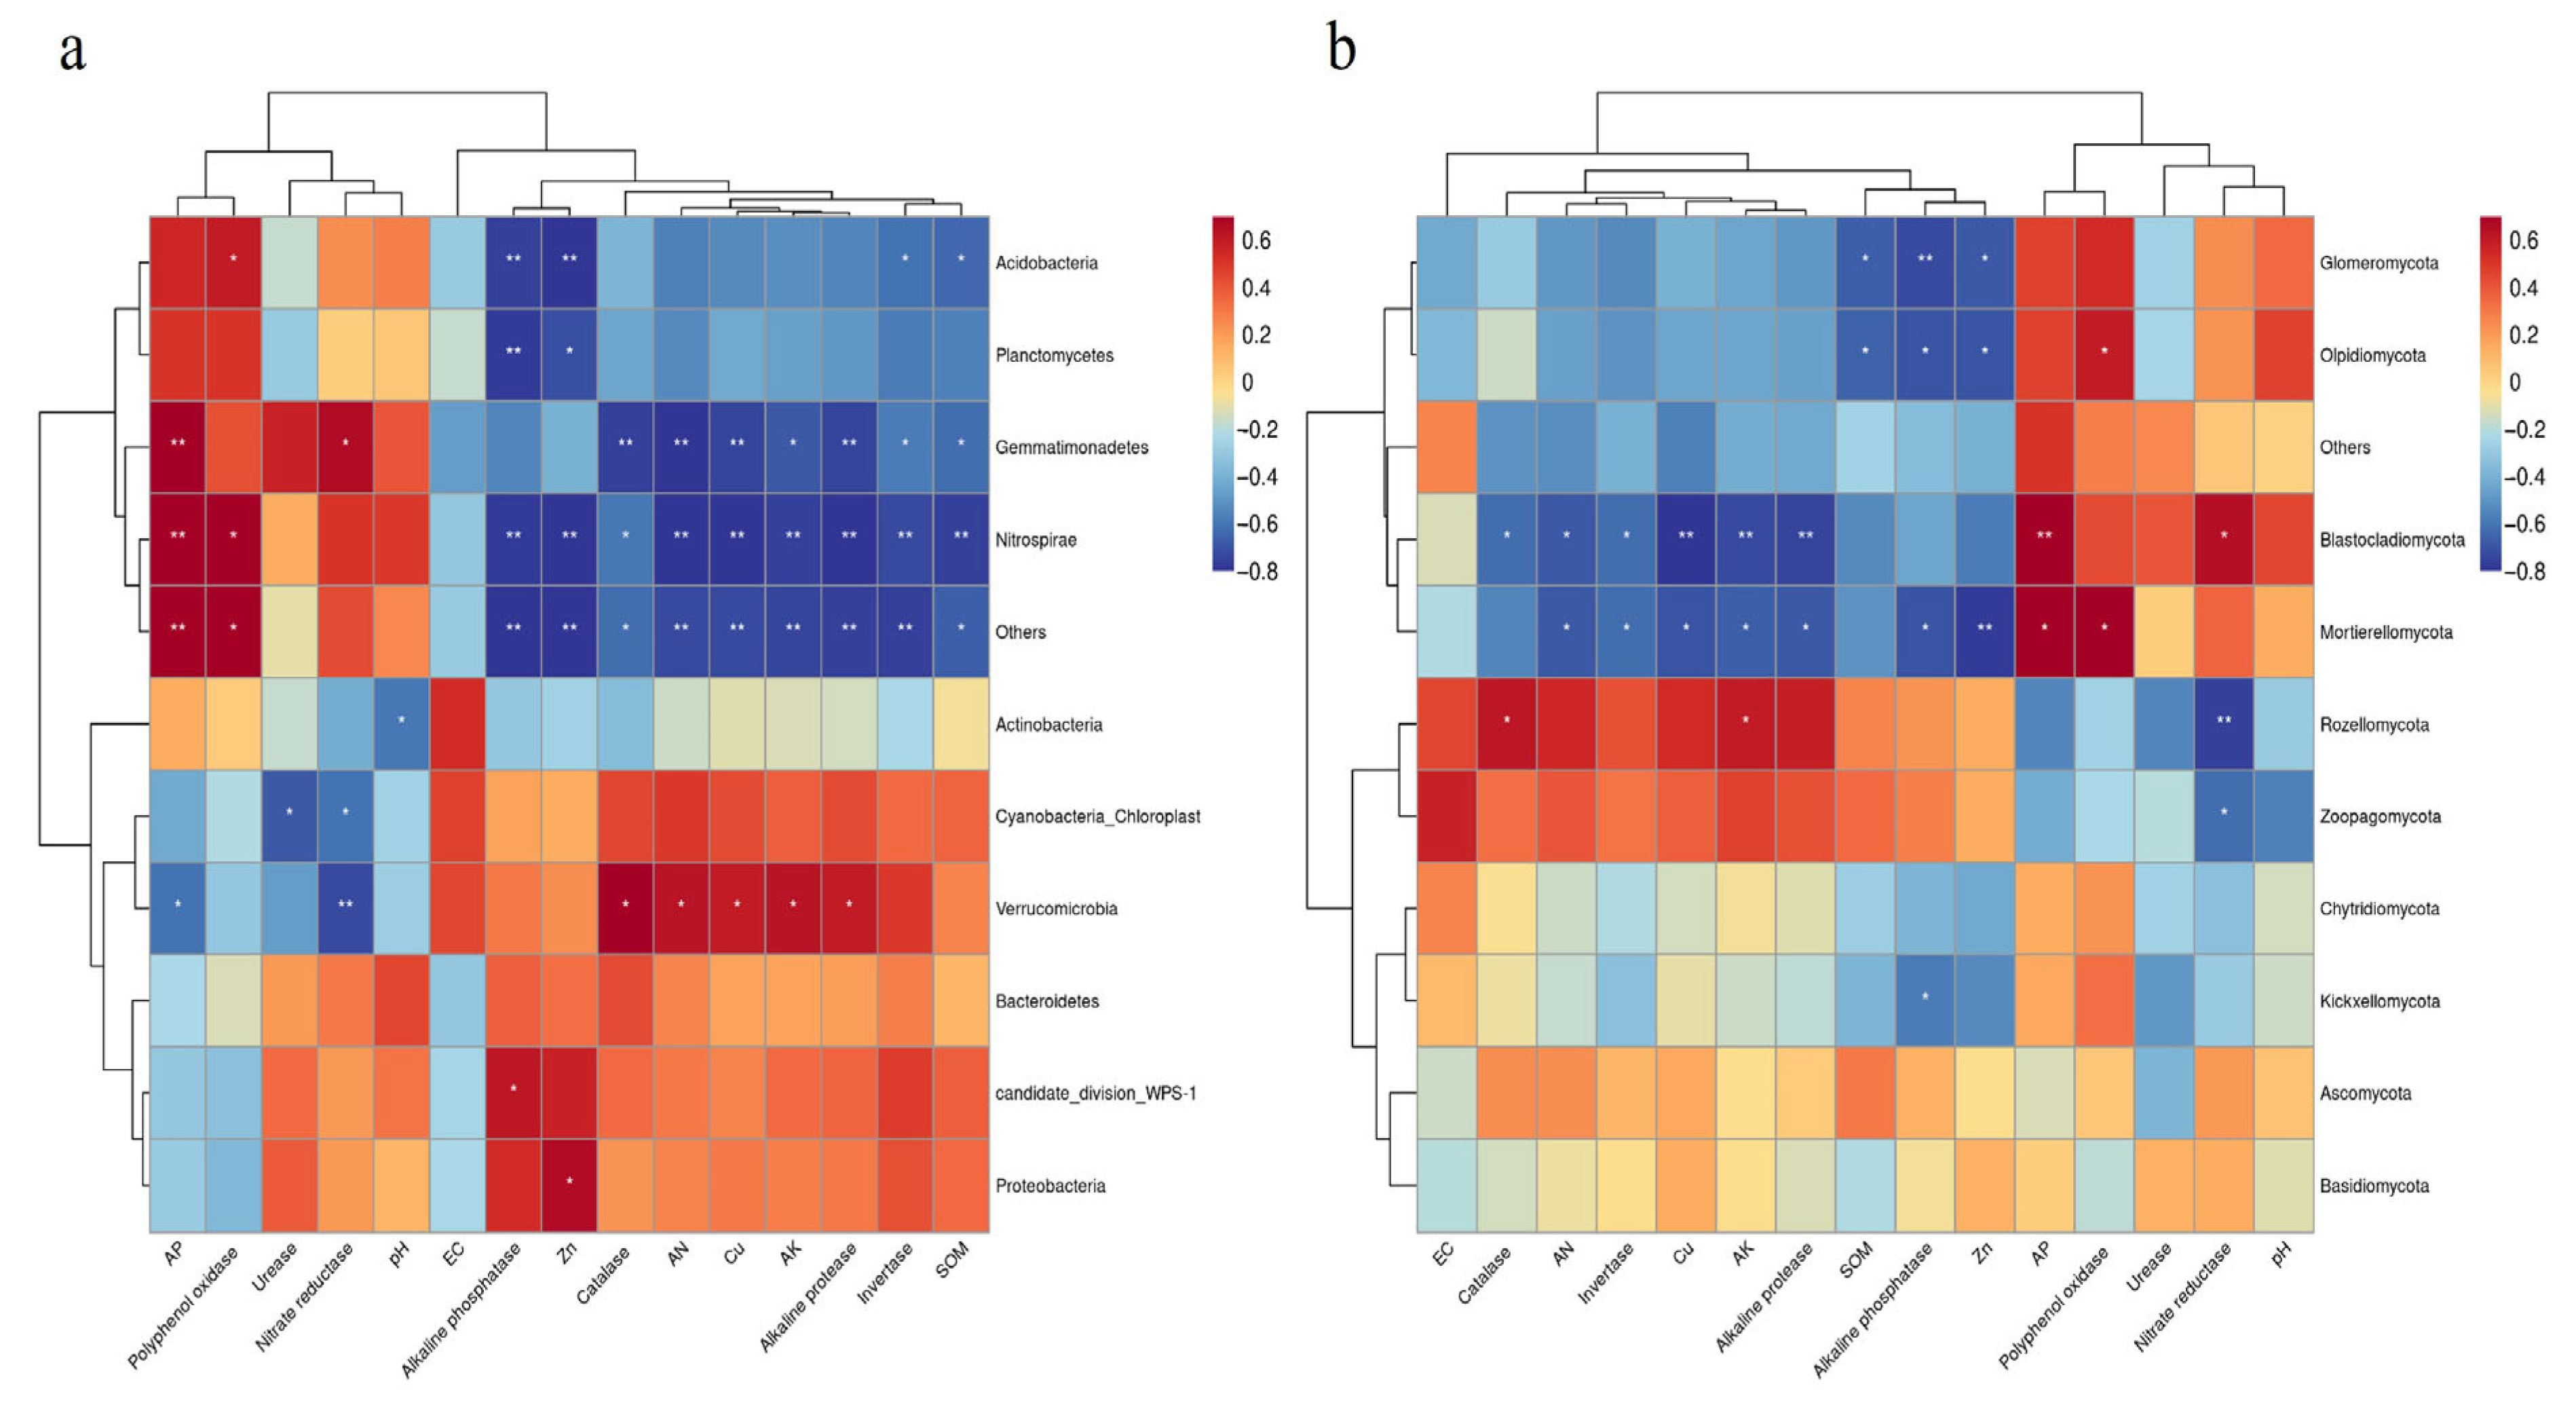
3.4. Impact of Soil Factors on Bacterial and Fungal Communities

RDA1 and RDA2 described 48.56% and 26.44% of the total variation of the bacterial community (Figure 5a), respectively. Changes in AP, AK, and SOM had a remarkable impact on the structure of the bacterial community. In addition, RDA1 and RDA2 described 34.93% and 25.20% of the total variation of the fungal community (Figure 5b), respectively; changes in AP, pH, and Zn had a significant impact on the fungal community structure. Overall, AN and AP are the key driving factors determining the composition of both microbial communities at various growth phases.
For bacterial communities (Figure 6a), Zn had a positive link to Proteobacteria and a negative link to Acidobacteria, Planctomycetes, and Nitrospirae. SOM, phosphatase, and sucrase had a negative link with Acidobacter, while polyphenol oxidase exhibited a positive link to Acidobacter and Nitrospirae. For fungal communities (Figure 6b), AN, AP, AK, and Cu were negatively correlated with Mortierellomycota and Blastocladiomycota; Alkaline protease, phosphatase, and sucrase were negatively correlated with Mortierellomycota, while polyphenol oxidase exhibited a positive relationship with Mortierellomycota.

4. Discussion

4.1. Responses of Soil Nutrients and Enzyme Activities to Different Growth Stages of Industrial Hemp

Soil is the key site for material circulation, energy flow, and transformation of agricultural and forestry ecosystems. It directly provides water and mineral element nutrients for plant growth and affects the plant’s survival [27]. As an important factor affecting soil fertility, soil microorganisms participate in the soil material and the energy cycle to support plant life. In turn, plant species, growth status, and growth period also affect the soil nutrient content, enzyme activity, and rhizosphere microorganisms [21,28]. We found that the pH of rhizosphere soil decreased significantly with growth time (Table 2), caused by the decomposition of organic matter due to rhizosphere microorganisms and the secretion of organic acids by roots [29]. In addition, during the entire growth period, the opposite trend of pH and available N in rhizosphere soil was consistent with previous studies (Table 2) [30]; this difference may be because the root system improved the utilization efficiency of N by changing the acid and alkali environment in the rhizosphere [30]. Phosphorus (P) transformation in the soil is a complex process because it involves several steps, such as complexation, dissolution, and adsorption [31]. Moreover, AP serves as an indicator of the nutrient supply level of soil P, and its content reflects the storage and supply capacities of the soil for P. Our study demonstrated that the content of AP decreased with the increase in growth time (Table 2), which indicates that industrial hemp absorbs P from rhizosphere soil for growth and development, thus consuming AP. Generally, litter decomposition is an effective method for phosphorus to return to the soil; therefore, in future field management, the return of plant residues or the proper use of phosphorus fertilizer should be considered to increase economic benefits [32]. Furthermore, the increase of phosphatase also proves that microorganisms promote the dissolution of inorganic phosphorus in the soil to meet the phosphorus demand of crops (Table 3) [33].
In addition, soil enzymes are also crucial in maintaining soil fertility, a key indicator of ecosystem sustainability and health. The outcome of this study revealed that the contents of alkaline protease, alkaline phosphatase, catalase, and sucrase increased with the increase in the growth stages (Table 3). This further indicated that industrial hemp could degrade macromolecules into small molecules through soil enzymes in a rhizosphere environment to support its own growth, thus regulating the cycle of soil carbon, nitrogen, and phosphorus [34]. Earlier research has demonstrated a positive association of the activities of soil sucrase and soil alkaline phosphatase with SOC and microbial biomass, indicating that these components contain substrates that induce the synthesis of these enzymes [35]. Soil sucrase is a crucial indicator of soil fertility; it participates in the decomposition and transformation of rhizosphere soil organic matter and is positively related to soil organic matter and bacterial diversity [36]. Our research results showed that soil enzyme activity and soil nutrient content have a similar change (Table 2 and Table 3), which indicates that higher enzyme activity in the soil shows a positive response to soil nutrient accumulation and also serves as an indicator for evaluating soil fertility. This is primarily because the rich SOC contains enough substrate to induce enzyme synthesis, which leads to the change of soil enzyme activity during the growth of industrial hemp.

4.2. Different Growth Stages Altered the Rhizosphere Soil Microbial Community Composition of Industrial Hemp

Rhizosphere soil is considered a highly complex and dynamic ecosystem [12]. Our results showed that the number of soil bacteria, fungi, and actinomycetes reached the maximum at the seedling stage (Table 4), which indicated that industrial hemp was in the annual growth boom. At this stage, rhizosphere nutrients may be temporarily deficient (Table 2), but with the colonization of rhizosphere microorganisms, the ability to decompose and mineralize soil organic matter is enhanced to alleviate the nutrient shortage [37]. The quantity and species of soil rhizosphere microorganisms are affected not only by the soil environment but also by the root exudates, which will lead to changes in the rhizosphere microflora [38]. However, the relationship between them needs further investigation. In this study, Sphingomonas, a nitrobacteria promoting plant growth, had a high relative abundance in the rapid growth and maturity periods (Figure 1a), which reflects that the rhizosphere environment of industrial hemp has a high demand for nitrogen in these two periods [39]. In addition, Actinobacteria is a significant producer of extracellular enzymes and secondary metabolites in soil ecosystems, playing an essential role in the carbon cycle, inhibiting plant diseases, and promoting plant growth [40]. The increase in the relative abundance of Actinobacteria during the flowering stage (Figure 1a) showed that Actinobacteria is important for the rhizosphere microenvironment of industrial hemp during the flowering stage. The relative abundance of the two major bacterial genera, Gp4 and GP6, decreased with the increase in growth time (Figure 3a); their growth is usually closely related to the change in pH value in the rhizosphere environment [41]. Gemmatimonas remained relatively consistent during the industrial hemp growing period (Figure 3a). It can increase the tolerance of plants to heavy metals to promote plant growth and participate in the element circulation and decomposition of dead plant tissues [42,43].
The seedling and the seed maturity stages were mainly dominated by fast-growing Ascomycota (Figure 1b), which efficiently degrades plant residues to help plants obtain nutrients [44]. The relative abundance of the major microbial groups also changed with the growth period. For example, Plectosphaerella, Didymella, and Phaeosphaeria, the main fungal genera, increased with the growth stage (Figure 3b). Previous studies show that Plectosphaerella, Didymella, and Phaeosphaeria may be the pathogens causing plant root rot, stem rot, and leaf spot, respectively. In addition, the relative abundance of industrial hemp root pathogens increased significantly during the growth period, such as Plectosphaerella, Fusarium, and Didymella (Figure 3b), indicating that the pathogenic microorganisms, nonpathogenic microorganisms, and symbiotic microorganisms interact with plant roots at the same time [14,45,46]. Hence, it is imperative to focus more on preventing and managing pests and diseases in the long-term production of industrial hemp.

5. Conclusions

Our results highlight that soil nutrients and enzyme activities change with the growth stage of industrial hemp. In particular, the decrease of AP and the increase of phosphatase indicate the increasing demand of plants for phosphorus and the positive feedback of soil microorganisms. The bacterial and fungal community structure in the rhizosphere soil of industrial hemp varied greatly in the different growth stages by high-throughput sequencing technology and dilution plate method. Proteobacteria, Acidobacteria, Ascomycota, and Basidiomycota were the dominant bacteria in the different growth stages of industrial hemp. The microbial groups were crucial in supporting industrial hemp growth and were significantly affected by AN, AP, and pH. This study reflects the changes in the rhizosphere microenvironment during the growth of industrial hemp in the field. It also provides a case for understanding the association of soil nutrients with microbial communities and improving the yield of industrial hemp during actual production.

Author Contributions

Conceptualization, L.G., G.W. and X.C.; Methodology, L.G., G.W. and X.C.; Writing—original draft, L.G., G.W. and X.C.; formal analysis, Z.L., M.W. and Y.C.; Investigation, Z.L., M.W. and Y.C.; Writing—review and editing, L.G., G.W. and X.C.; Supervision, L.Z., S.J., Z.J. and L.M.; Project administration, L.G., G.W. and X.C.; Funding acquisition, L.G. and G.W. All authors have read and agreed to the published version of the manuscript.

Funding

This work was supported by the Heilongjiang Province Agricultural Science and Technology Innovation Spanning Project (MLCX20-2), the College level project of Heilongjiang Academy of Agricultural Sciences (2020FJZX021), and the National Key Basic Research Development Program (2021YFD1500705).

Data Availability Statement

All data are available on request from the corresponding author.

Acknowledgments

The authors would like to thank the Heilongjiang Province Agricultural Science and Technology Innovation Spanning Project (MLCX20-2) and the College level project of Heilongjiang Academy of Agricultural Sciences (2020FJZX021).

Conflicts of Interest

The authors declare no conflict of interest.

References

  1. Yang, R.; Berthold, E.C.; McCurdy, C.R.; da Silva Benevenute, S.; Brym, Z.T.; Freeman, J.H. Development of Cannabinoids in Flowers of Industrial Hemp (Cannabis sativa L.): A Pilot Study. J. Agric. Food Chem. 2020, 68, 6058–6064. [Google Scholar] [CrossRef] [PubMed]
  2. Cherney, J.H.; Small, E. Industrial Hemp in North America: Production, Politics and Potential. Agronomy 2016, 6, 58. [Google Scholar] [CrossRef] [Green Version]
  3. Adhikary, D.; Kulkarni, M.; El-Mezawy, A.; Mobini, S.; Elhiti, M.; Gjuric, R.; Ray, A.; Polowick, P.; Slaski, J.J.; Jones, M.P.; et al. Medical Cannabis and Industrial Hemp Tissue Culture: Present Status and Future Potential. Front. Plant Sci. 2021, 12, 627240. [Google Scholar] [CrossRef] [PubMed]
  4. Su, K.; Maghirang, E.; Tan, J.W.; Yoon, J.Y.; Armstrong, P.; Kachroo, P.; Hildebrand, D. NIR Spectroscopy for Rapid Measurement of Moisture and Cannabinoid Contents of Industrial Hemp (Cannabis sativa). Ind. Crops Prod. 2022, 184, 115007. [Google Scholar] [CrossRef]
  5. Wylie, S.E.; Ristvey, A.G.; Fiorellino, N.M. Fertility Management for Industrial Hemp Production: Current Knowledge and Future Research Needs. GCB Bioenergy 2021, 13, 517–524. [Google Scholar] [CrossRef]
  6. Emmett, B.D.; Buckley, D.H.; Drinkwater, L.E. Plant Growth Rate and Nitrogen Uptake Shape Rhizosphere Bacterial Community Composition and Activity in an Agricultural Field. New Phytol. 2020, 225, 960–973. [Google Scholar] [CrossRef]
  7. Gan, D.; Feng, J.; Han, M.; Zeng, H.; Zhu, B. Rhizosphere Effects of Woody Plants on Soil Biogeochemical Processes: A Meta-Analysis. Soil Biol. Biochem. 2021, 160, 108310. [Google Scholar] [CrossRef]
  8. Yu, X.; Zhang, Y.; Shen, M.; Dong, S.; Zhang, F.; Gao, Q.; He, P.; Shen, G.; Yang, J.; Wang, Z.; et al. Soil Conditioner Affects Tobacco Rhizosphere Soil Microecology. Microb. Ecol. 2022, 1–14. [Google Scholar] [CrossRef]
  9. Herre, M.; Heitkötter, J.; Heinze, S.; Rethemeyer, J.; Preusser, S.; Kandeler, E.; Marschner, B. Differences in Organic Matter Properties and Microbial Activity between Bulk and Rhizosphere Soil from the Top- and Subsoils of Three Forest Stands. Geoderma 2022, 409, 115589. [Google Scholar] [CrossRef]
  10. Feng, H.; Fu, R.; Hou, X.; Lv, Y.; Zhang, N.; Liu, Y.; Xu, Z.; Miao, Y.; Krell, T.; Shen, Q.; et al. Chemotaxis of Beneficial Rhizobacteria to Root Exudates: The First Step towards Root–Microbe Rhizosphere Interactions. Int. J. Mol. Sci. 2021, 22, 6655. [Google Scholar] [CrossRef]
  11. Li, C.; Jia, Z.; Zhai, L.; Zhang, B.; Peng, X.; Liu, X.; Zhang, J. Effects of Mineral-Solubilizing Microorganisms on Root Growth, Soil Nutrient Content, and Enzyme Activities in the Rhizosphere Soil of Robinia Pseudoacacia. Forests 2021, 12, 60. [Google Scholar] [CrossRef]
  12. Vives-Peris, V.; de Ollas, C.; Gómez-Cadenas, A.; Pérez-Clemente, R.M. Root Exudates: From Plant to Rhizosphere and Beyond. Plant Cell Rep. 2020, 39, 3–17. [Google Scholar] [CrossRef]
  13. Jiang, S.; Xing, Y.; Liu, G.; Hu, C.; Wang, X.; Yan, G.; Wang, Q. Changes in Soil Bacterial and Fungal Community Composition and Functional Groups during the Succession of Boreal Forests. Soil Biol. Biochem. 2021, 161, 108393. [Google Scholar] [CrossRef]
  14. Tian, P.; Razavi, B.S.; Zhang, X.; Wang, Q.; Blagodatskaya, E. Microbial Growth and Enzyme Kinetics in Rhizosphere Hotspots Are Modulated by Soil Organics and Nutrient Availability. Soil Biol. Biochem. 2020, 141, 107662. [Google Scholar] [CrossRef]
  15. Zhang, Y.; Gao, X.; Shen, Z.; Zhu, C.; Jiao, Z.; Li, R.; Shen, Q. Pre-Colonization of PGPR Triggers Rhizosphere Microbiota Succession Associated with Crop Yield Enhancement. Plant Soil 2019, 439, 553–567. [Google Scholar] [CrossRef]
  16. Sun, H.; Jiang, S.; Jiang, C.; Wu, C.; Gao, M.; Wang, Q. A Review of Root Exudates and Rhizosphere Microbiome for Crop Production. Environ. Sci. Pollut. Res. 2021, 28, 54497–54510. [Google Scholar] [CrossRef] [PubMed]
  17. Gu, Y.; Banerjee, S.; Dini-Andreote, F.; Xu, Y.; Shen, Q.; Jousset, A.; Wei, Z. Small Changes in Rhizosphere Microbiome Composition Predict Disease Outcomes Earlier than Pathogen Density Variations. ISME J. 2022, 16, 2448–2456. [Google Scholar] [CrossRef]
  18. Gu, S.; Wei, Z.; Shao, Z.; Friman, V.-P.; Cao, K.; Yang, T.; Kramer, J.; Wang, X.; Li, M.; Mei, X.; et al. Competition for Iron Drives Phytopathogen Control by Natural Rhizosphere Microbiomes. Nat. Microbiol. 2020, 5, 1002–1010. [Google Scholar] [CrossRef]
  19. Tang, L.; Fan, C.; Yuan, H.; Wu, G.; Sun, J.; Zhang, S. The Effect of Rotational Cropping of Industrial Hemp (Cannabis sativa L.) on Rhizosphere Soil Microbial Communities. Agronomy 2022, 12, 2293. [Google Scholar] [CrossRef]
  20. Guo, L.; Chen, X.; Li, Z.; Wang, M.; Che, Y.; Zhang, L.; Jiang, Z.; Jie, S. Effects of Continuous Cropping on Bacterial Community and Diversity in Rhizosphere Soil of Industrial Hemp: A Five-Year Experiment. Diversity 2022, 14, 250. [Google Scholar] [CrossRef]
  21. Bai, Y.; Zhou, Y.; An, Z.; Du, J.; Zhang, X.; Chang, S.X. Tree Species Identity and Mixing Ratio Affected the Release of Several Metallic Elements from Mixed Litter in Coniferous-Broadleaf Plantations in Subtropical China. Sci. Total Environ. 2022, 838, 156143. [Google Scholar] [CrossRef] [PubMed]
  22. Taye, Z.M.; Helgason, B.L.; Bell, J.K.; Norris, C.E.; Vail, S.; Robinson, S.J.; Parkin, I.A.P.; Arcand, M.; Mamet, S.; Links, M.G.; et al. Core and Differentially Abundant Bacterial Taxa in the Rhizosphere of Field Grown Brassica Napus Genotypes: Implications for Canola Breeding. Front. Microbiol. 2020, 10, 3007. [Google Scholar] [CrossRef] [PubMed] [Green Version]
  23. Shen, Y.; Natalia Umaña, M.; Li, W.; Fang, M.; Chen, Y.; Lu, H.; Yu, S. Linking Soil Nutrients and Traits to Seedling Growth: A Test of the Plant Economics Spectrum. For. Ecol. Manag. 2022, 505, 119941. [Google Scholar] [CrossRef]
  24. Huo, C.; Lu, J.; Yin, L.; Wang, P.; Cheng, W. Coupled of Carbon and Nitrogen Mineralization in Rhizosphere Soils along a Temperate Forest Altitudinal Gradient. Plant Soil 2022, 1–15. [Google Scholar] [CrossRef]
  25. Bao, S.D. Soil and Agricultural Chemistry Analysis; China Agricultural Press: Beijing, China, 2000; pp. 355–356. [Google Scholar]
  26. Jiang, J.; Yang, Y.; Wang, L.; Cao, S.; Long, T.; Liu, R. Effects of Chlorothalonil Application on the Physio-Biochemical Properties and Microbial Community of a Yellow–Brown Loam Soil. Agriculture 2022, 12, 608. [Google Scholar] [CrossRef]
  27. Hou, W.; Wang, J.; Nan, Z.; Christensen, M.J.; Xia, C.; Chen, T.; Zhang, Z.; Niu, X. Epichloë Gansuensis Endophyte-Infection Alters Soil Enzymes Activity and Soil Nutrients at Different Growth Stages of Achnatherum Inebrians. Plant Soil 2020, 455, 227–240. [Google Scholar] [CrossRef]
  28. Zhao, M.; Zhao, J.; Yuan, J.; Hale, L.; Wen, T.; Huang, Q.; Vivanco, J.M.; Zhou, J.; Kowalchuk, G.A.; Shen, Q. Root Exudates Drive Soil-Microbe-Nutrient Feedbacks in Response to Plant Growth. Plant Cell Environ. 2021, 44, 613–628. [Google Scholar] [CrossRef]
  29. Li, H.; Xu, C.; Han, L.; Li, C.; Xiao, B.; Wang, H.; Yang, C. Extensive Secretion of Phenolic Acids and Fatty Acids Facilitates Rhizosphere PH Regulation in Halophyte Puccinellia Tenuiflora under Alkali Stress. Physiol. Plant. 2022, 174, e13678. [Google Scholar] [CrossRef]
  30. Deng, L.; Shangguan, Z. Afforestation Drives Soil Carbon and Nitrogen Changes in China. Land Degrad. Dev. 2017, 28, 151–165. [Google Scholar] [CrossRef] [Green Version]
  31. Han, F.; Ren, L.; Zhang, X.-C. Effect of Biochar on the Soil Nutrients about Different Grasslands in the Loess Plateau. Catena 2016, 137, 554–562. [Google Scholar] [CrossRef]
  32. Xu, Y.; Ge, X.; Zhou, B.; Lei, L.; Xiao, W. Variations in Rhizosphere Soil Total Phosphorus and Bioavailable Phosphorus with Respect to the Stand Age in Pinus Massoniana Lamb. Front. Plant Sci. 2022, 13, 939683. [Google Scholar] [CrossRef] [PubMed]
  33. Wang, G.; Jin, Z.; Wang, X.; George, T.S.; Feng, G.; Zhang, L. Simulated Root Exudates Stimulate the Abundance of Saccharimonadales to Improve the Alkaline Phosphatase Activity in Maize Rhizosphere. Appl. Soil Ecol. 2022, 170, 104274. [Google Scholar] [CrossRef]
  34. Gomola, C.E.; McKay, J.K.; Wallenstein, M.D.; Wagg, C.; O’Brien, M.J. Within-Species Trade-Offs in Plant-Stimulated Soil Enzyme Activity and Growth, Flowering, and Seed Size. Ecol. Evol. 2018, 8, 11717–11724. [Google Scholar] [CrossRef] [Green Version]
  35. Zhang, C.; Liu, G.; Xue, S.; Song, Z. Rhizosphere Soil Microbial Activity under Different Vegetation Types on the Loess Plateau, China. Geoderma 2011, 161, 115–125. [Google Scholar] [CrossRef]
  36. Bai, Y.; Zhou, Y.; He, H. Effects of Rehabilitation through Afforestation on Soil Aggregate Stability and Aggregate-Associated Carbon after Forest Fires in Subtropical China. Geoderma 2020, 376, 114548. [Google Scholar] [CrossRef]
  37. Hanaka, A.; Plak, A.; Zagórski, P.; Ozimek, E.; Rysiak, A.; Majewska, M.; Jaroszuk-Ściseł, J. Relationships between the Properties of Spitsbergen Soil, Number and Biodiversity of Rhizosphere Microorganisms, and Heavy Metal Concentration in Selected Plant Species. Plant Soil 2019, 436, 49–69. [Google Scholar] [CrossRef] [Green Version]
  38. Yuan, Y.; Zuo, J.; Zhang, H.; Zu, M.; Liu, S. The Chinese Medicinal Plants Rhizosphere: Metabolites, Microorganisms, and Interaction. Rhizosphere 2022, 22, 100540. [Google Scholar] [CrossRef]
  39. Luo, Y.; Zhou, M.; Zhao, Q.; Wang, F.; Gao, J.; Sheng, H.; An, L. Complete Genome Sequence of Sphingomonas Sp. Cra20, a Drought Resistant and Plant Growth Promoting Rhizobacteria. Genomics 2020, 112, 3648–3657. [Google Scholar] [CrossRef]
  40. Delgado-Baquerizo, M.; Oliverio, A.M.; Brewer, T.E.; Benavent-González, A.; Eldridge, D.J.; Bardgett, R.D.; Maestre, F.T.; Singh, B.K.; Fierer, N. A Global Atlas of the Dominant Bacteria Found in Soil. Science 2018, 359, 320–325. [Google Scholar] [CrossRef] [Green Version]
  41. Kim, H.-S.; Lee, S.-H.; Jo, H.Y.; Finneran, K.T.; Kwon, M.J. Diversity and Composition of Soil Acidobacteria and Proteobacteria Communities as a Bacterial Indicator of Past Land-Use Change from Forest to Farmland. Sci. Total Environ. 2021, 797, 148944. [Google Scholar] [CrossRef] [PubMed]
  42. Ferreira, M.J.; Cunha, A.; Figueiredo, S.; Faustino, P.; Patinha, C.; Silva, H.; Sierra-Garcia, I.N. The Root Microbiome of Salicornia Ramosissima as a Seedbank for Plant-Growth Promoting Halotolerant Bacteria. Appl. Sci. 2021, 11, 2233. [Google Scholar] [CrossRef]
  43. Górska, E.B.; Stępien, W.; Cunha, A.; Sierra-Garcia, I.N.; Szyszkowska, K.; Gozdowski, D.; Gworek, B.; Sas-Paszt, L.; Lisek, A.; Hewelke, E.; et al. Microbial Diversity as an Indicator of a Diversified Cropping System for Luvisoils in a Moderate Climate. Case Study—Long Term Experiments from Poland. Ecol. Indic. 2022, 141, 109133. [Google Scholar] [CrossRef]
  44. You, Y.; Aho, K.; Lohse, K.A.; Schwabedissen, S.G.; Ledbetter, R.N.; Magnuson, T.S. Biological Soil Crust Bacterial Communities Vary Along Climatic and Shrub Cover Gradients Within a Sagebrush Steppe Ecosystem. Front. Microbiol. 2021, 12, 569791. [Google Scholar] [CrossRef] [PubMed]
  45. Huang, S.L.; Wang, L.; Wang, T.; Jiao, Z.J.; Pang, F.H.; Tao, A.L.; Niu, X.R.; Lu, W.H. First Report of Didymella Leaf Blight on Cornus Officinalis Caused by Didymella Glomerata in China. Plant Dis. 2017, 102, 1031. [Google Scholar] [CrossRef]
  46. Carson, M.L.; Stuber, C.W.; Senior, M.L. Quantitative Trait Loci Conditioning Resistance to Phaeosphaeria Leaf Spot of Maize Caused by Phaeosphaeria Maydis. Plant Dis. 2005, 89, 571–574. [Google Scholar] [CrossRef]
Figure 1. The relative abundance of bacterial (a) and fungal (b) community composition at the phyla level. S, R, F, and M represent the seedling stage, rapid growth stage, flowering stage, and maturity stage, respectively.
Agronomy 12 03159 g001
Figure 2. The relative abundance of bacterial (a) and fungal (b) community composition at the class level. S, R, F, and M represent the seedling stage, rapid growth stage, flowering stage, and maturity stage, respectively.
Agronomy 12 03159 g002
Figure 3. Microbial community-related heatmap and cluster analysis of the bacterial (a) and fungal (b) community composition at the genus level. S, R, F, and M represent the seedling stage, rapid growth stage, flowering stage, and maturity stage, respectively.
Agronomy 12 03159 g003
Figure 4. Principal component analysis of soil bacterial (a) and fungal (b) community. S, R, F, and M represent the seedling stage, rapid growth stage, flowering stage, and maturity stage, respectively.
Agronomy 12 03159 g004
Figure 5. Redundancy analysis of the ten dominant bacterial (a) and fungal (b) phyla and soil physicochemical properties. S, R, F, and M represent the seedling stage, rapid growth stage, flowering stage, and maturity stage, respectively. SOM, soil organic matter; Cu, copper; Zn, zinc; EC, electrical conductivity; AN, available nitrogen; AP, available phosphorus; AK, available potassium.
Agronomy 12 03159 g005
Figure 6. Heat map analysis of the correlation of bacterial (a) and fungal (b) communities with soil physicochemical enzyme activity. SOM, soil organic matter; Cu, copper; Zn, zinc; EC, electrical conductivity; AN, available nitrogen; AP, available phosphorus; AK, available potassium. * p < 0.05; ** p < 0.01.
Agronomy 12 03159 g006
Table 1. Sampling period selection for physical, chemical, enzymatic, and microbiologic analysis.
Growing StageSampling TimeGrowth Status
SES7 JuneAll seeds sprouted with an average height of 10 cm.
RGS12 JulyThe seedling production speed is fast, and the average plant height is 100 cm.
FLS8 AugustMore than 50% of male plants in the plots are in full bloom.
MAS28 SeptemberMore than 50% of the seeds in the plots are mature.
Note: SES, seedling stage; RGS, rapid growth stage; FLS: flowering stage; MAS: maturity stage; Cu, copper; Zn, zinc; EC, electrical conductivity; AN, available nitrogen; AP, available phosphorus; AK, available potassium. For each variable, different lowercase letters in the same column represent remarkable differences among the four growth stages (p < 0.05).
Table 2. Variations of soil physicochemical properties with different growth stages.
Growing StageSOM (g/kg)Cu (mg/kg)Zn (mg/kg)pHEC (ms/cm)AN (mg/kg)AP (mg/kg)AK (mg/kg)
SES23.95 ± 0.35 b9.13 ± 0.29 a21.24 ± 0.39 c8.55 ± 0.01 a198.20 ± 0.7 b132.80 ± 1.28 d16.51 ± 0.67 a183.11 ± 2.80 d
RGS26.13 ± 0.3 a11.7 ± 0.53 b30.70 ± 0.49 b8.40 ± 0.03 b203.33 ± 0.73 a142.65 ± 2.52 c13.92 ± 0.29 b224.57 ± 4.74 c
FLS26.14 ± 0.25 a20.46 ± 0.21 c29.73 ± 0.78 b8.35 ± 0.03 b204.50 ± 0.29 a174.51 ± 1.59 b11.78 ± 0.41 c259.98 ± 14.88 b
MAS27.46 ± 0.75 a21.90 ± 0.14 d45.64 ± 0.74 a8.41 ± 0.02 b203.00 ± 0.58 a185.28 ± 3.83 a10.75 ± 0.30 c371.07 ± 7.22 a
Note: SES, seedling stage; RGS, rapid growth stage; FLS: flowering stage; MAS: maturity stage; SOM, soil organic matter; Cu, copper; Zn, zinc; EC, electrical conductivity; AN, available nitrogen; AP, available phosphorus; AK, available potassium. For each variable, different lowercase letters in the same column represent remarkable differences among the four growth stages (p < 0.05).
Table 3. Effect of different growth stages on rhizosphere soil enzyme activity in industrial hemp.
Growing StageUrease (mg/g·d)Protease (mg/g·d)Phosphatase (mg/g·d)Catalase (mg/g·d)Sucrase (mg/g·d)Polyphenol Oxidase (mg/g·d)Nitrate Reductase (mg/g·d)
SES 1.82 ± 0.03 ab3.19 ± 0.02 d1.72 ± 0.03 c182.14 ± 0.49 d24.03 ± 0.32 c45.58 ± 0.64 a0.34 ± 0.01 a
RGS 1.85 ± 0.03 a3.32 ± 0.02 c2.18 ± 0.03 b182.85 ± 0.48 c25.59 ± 0.61 bc25.35 ± 10.81 b0.28 ± 0.01 b
FLS 1.69 ± 0.04 b3.72 ± 0.03 b2.15 ± 0.05 b191.65 ± 0.35 b26.42 ± 0.73 b25.69 ± 1.25 b0.16 ± 0.01 d
MAS 1.77 ± 0.05 ab3.94 ± 0.04 a2.60 ± 0.03 a206.54 ± 0.30 a30.52 ± 0.67 a20.41 ± 0.76 c0.19 ± 0.01 c
Note: SES, seedling stage; RGS, rapid growth stage; FLS: flowering stage; MAS: maturity stage; For each variable, various lowercase letters in the same column represent remarkable differences among the four growth stages (p < 0.05).
Table 4. Effect of different growth stages on rhizosphere soil microbial quantity.
Growing StageBacteria (106cfu/g·soil)Fungus (103cfu/g·soil)Actinomyces (106cfu/g·soil)
SES 1.97 ± 0.01 a0.46 ± 0.01 a2.25 ± 0.02 a
RGS 1.47 ± 0.02 c0.34 ± 0.01 c0.87 ± 0.02 c
FLS 0.87 ± 0.08 d0.20 ± 0.02 d0.64 ± 0.01 d
MAS 1.63 ± 0.02 b0.38 ± 0.01 b1.04 ± 0.02 b
Note: SES, seedling stage; RGS, rapid growth stage; FLS: flowering stage; MAS: maturity stage; For each variable, different lowercase letters in the same column represent remarkable variations among the four growth stages (p < 0.05).
Table 5. Variations of microbial diversity index with different growth stages.
TypeGrowing StageAce IndexChao1 IndexShannon IndexSimpson IndexCoverage Index
Bacteria SES 2594.77 ± 39.51 bc2602.79 ± 54.06 ab0.81 ± 0.01 b0.99 ± 0.01 a0.99 ± 0.01 a
RGS 2539.19 ± 5.25 c2557.94 ± 7.61 b0.76 ± 0.01 c0.97 ± 0.01 c0.99 ± 0.01 a
FLS 2691.50 ± 22.68 a2697.49 ± 34.15 a0.82 ± 0.01 a0.99 ± 0.01 a0.99 ± 0.01 a
MAS 2641.11 ± 24.47 ab2674.97 ± 13.37 a0.75 ± 0.01 c0.98 ± 0.01 b0.99 ± 0.01 a
fungus SES 471.51 ± 2.67 b474.54 ± 2.60 c0.64 ± 0.01 a0.94 ± 0.01 a0.99 ± 0.01 a
RGS 523.65 ± 14.51 a519.45 ± 12.26 b0.61 ± 0.01 ab0.94 ± 0.01 a0.99 ± 0.01 a
FLS 528.67 ± 6.72 a525.06 ± 6.57 ab0.64 ± 0.01 a0.94 ± 0.01 a0.99 ± 0.01 a
MAS 534.77 ± 3.70 a549.02 ± 10.02 a0.55 ± 0.04 b0.90 ± 0.03 a0.99 ± 0.01 a
Note: SES, seedling stage; RGS, rapid growth stage; FLS: flowering stage; MAS: maturity stage; For each variable, different lowercase letters in the same column indicate significant differences among the four growth stages (p < 0.05).
Publisher’s Note: MDPI stays neutral with regard to jurisdictional claims in published maps and institutional affiliations.

