Article

Biochar and Nitrification Inhibitor (Dicyandiamide) Combination Had a Double-Win Effect on Saline-Alkali Soil Improvement and Soybean Production in the Yellow River Delta, China

1
CAS Key Laboratory of Coastal Environmental Processes and Ecological Remediation, Yantai Institute of Coastal Zone Research, Chinese Academy of Sciences, Yantai 264003, China
2
Shandong Key Laboratory of Coastal Environmental Processes, Yantai 264003, China
3
University of Chinese Academy of Sciences, Beijing 100049, China
*
Author to whom correspondence should be addressed.
Agronomy 2022, 12(12), 3154; https://doi.org/10.3390/agronomy12123154
Submission received: 10 November 2022 / Revised: 7 December 2022 / Accepted: 10 December 2022 / Published: 12 December 2022

Abstract

:
Salt stress and nutrient deficiency strongly limited the productivity of coastal saline-alkali land in the Yellow River Delta. Biochar has been widely used to improve soil health and promote crop yield, and the positive effects of nitrification inhibitors on fertilizer use efficiency, especially nitrogen, were also verified. However, there were few types of research on the combined application of biochar and nitrification inhibitor dicyandiamide (DCD) on saline-alkali soil of the Yellow River Delta, China. In this study, five treatments, including no nitrogen (CK), normal NPK (N), NPK + 1%biochar (B), NPK + 2%DCD (D), and NPK + 1%biochar + 2%DCD (BD) were set to investigate the single and combined effect of biochar and DCD on nitrogen transform, soil properties, bacterial community structure, and soybean production. Results showed that BD application inhibited nitrification and increased the soil’s nitrate supply at the flowering stage, which reduced nitrogen waste and met the nitrogen demand for soybean growth. Biochar addition increased the soil’s pH and decreased the soil’s electrical conductivities and accelerated the soil’s macroaggregates formation, with the soil’s average mass diameter and geometric average diameter increasing by 78.69% and 30% in B, and 71.29% and 29.34% in BD relative to CK. Positive effects of inhibitors on soybean production were found in increasing soybean yield, hundred-grain weight, aboveground biomass, etc. Proteobacteria was the dominant phylum in the bacterial communities detected, and bacterial community diversity was significantly explained by nitrate content and soil aggregates (p < 0.05). Soil pH and DCD addition mainly influenced the abundance of the bacterial community, especially Actinobacteria. Biochar with DCD could be a feasible fertilization scheme for the coastal saline-alkali land in the Yellow River Delta, China.

1. Introduction

Soil salinization is a fundamental threat to our food security, and the salinization area is approximately 11.28 × 10⁹ hectares worldwide [1,2]. Coastal saline-alkali land is easy to harden due to high groundwater levels, intense water evaporation, and strong concentration of salt on the surface, which affects the soil’s nutrient balance [3]. The Yellow River Delta (YRD) is one of the three estuarine deltas in China. The saline-alkali land in the YRD is characterized by heavy saline-alkali, large quantities, and wide distribution [4]. The exploitation and utilization of medium and mild salinized soil are of great significance to the development of agricultural production and the ecological environment [5]. Soil fertility improvement plays an important role in the development of agricultural production in saline-alkali land. Current measures including the application of biochar to improve soil structure and nitrification inhibitors to improve fertilizer utilization are widely used. Improving nitrogen use efficiency by nitrification inhibitors (NIs) has been proven to be an effective option to decrease gas (N2O, NH3) emissions and increase crop absorption [6]. A remarkable effect of biochar has been proven on saline-alkali land improvement [2,7,8,9]. However, the combined effect and mechanisms of biochar and nitrification inhibitors on saline-alkali areas need to be further investigated.
Nitrogen is a vital dominant nutrient for crop growth that undergoes a series of transformations in soil, including ammonia volatilization, nitrification, denitrification, and immobilization [6,10,11,12]. It is one of the key steps to increase crop yield, especially in saline-alkali soil, by improving the availability of the soil’s nitrogen on the surface and the ability to capture and regulate nitrogen nutrient, especially in low soil nitrogen level areas [13]. In saline-alkali land, nitrogen increased crop yield and alleviated the damage caused by soil salt damage to crops [14]. Soil saline and alkalinity influenced urea hydrolyzed, ammonia volatilization, and nitrogen fixation [15,16,17]. Meanwhile, N is the limiting factor for soil microorganisms, the increase of N fertilizer was assumed to facilitate soil microbes [18]. Are urea and nitrification inhibitors restricted by salt and alkali, and, thus, do they affect fertilizer utilization efficiency? This needs to be discussed further.
Biochar (BC), a carbon-rich residue produced under oxygen-limited conditions at temperatures ranging from 300 to 1000 °C, has attracted great attention as a salt-affected soil amendment. Biochar had a giant perspective for repairing damages in the soil-plant system [19,20,21], the application of which increased soil pH, CEC, and organic carbon with greater effects in a controlled environment [22]. Biochar application increased NH3 volatilization in saline soil, for salt ions constrained the NH3/NH4+ adsorption capacity of biochar, and the inhibition of nitrification by biochar was aggravated in saline soil. Biochar applied with appropriate rates can reduce N leaching, suppress N2O production from denitrification, keep N retention, improve nutrient availability, and improve the aeration of the soil in coastal saline soil [8,23]. Biochar and effective microorganisms promote Sesbania cannabina growth and soil quality in the coastal saline-alkali soil of the YRD, China [24]. The effect of biochar is affected by the soil’s pH, but how to improve the coastal saline-alkali soil and the effect on fertilizer utilization should be further explored.
Soil microorganisms are widely distributed, and the activity of soil microorganisms determines the potential productivity of soil to a large extent and the types and quantities of functional groups of bacteria. The distribution can directly reflect the characteristics of the habitat, the level of certain nutrients, and their transformation rules [25,26], and fertilization and management practices can affect specific microbial groups and enzyme activities [27,28]. After 6 years of long-term fertilizer application, soil phosphor lipid fatty acid (PLFA) content was affected, which reduced microbial biomass, with 18–23% of Gram-positive bacteria and 43–48% of Gram-negative bacteria, respectively [29]. According to improving soil physicochemical properties (increased soil pH, EC, decreased microbial biomass, and shifted bacterial community composition), the relative abundance of Acidobacteria, Chloroflexi, and Gemmatimonadetes decreased under biochar treatments, while Proteobacteria, Bacteroidetes, and Actinobacteria increased [30]. The short-term effect of the mixture of biochar and nitrification inhibitors on soil microorganisms needs further study.
It is of great significance to improve the medium and mild saline-alkali land in the Yellow River Delta and carry out agricultural production to ensure national food security. Improving soil quality and productivity from the perspective of soil improvement and efficient fertilization can achieve dual effects [31]. We hypothesized that: (1) the addition of biochar would have a good improvement effect on soil structure and soil microorganisms; (2) the addition of nitrification inhibitors would have a positive effect on soil nitrogen conversion and fertilizer utilization in saline-alkali soil; (3) the addition of both would have a double effect on the improvement of saline-alkali soil and nitrogen fertilizer utilization. The conceptual model diagram of this paper is shown below (Figure 1).

2. Materials and Methods

2.1. Site

The experiment was conducted in the YRD Saline-alkali Farmland Ecosystem Observation and Research Station, Yantai Institute of Coastal Zone, Chinese Academy of Sciences, Dongying City, Shandong Province (37°32′ N, 118°65′ E). The mean annual temperature is 13.5 °C and the mean annual precipitation is 700–750 mm, 80% is concentrated in May–September, which defines the area as a temperate continental monsoon climate. The effective accumulated temperature is 4633.72 °C·d above 10 °C. The soil texture of the experimental site is salic fluvisols with 66.31% silt, 8.45% clay, and 25.24% sand. The soil’s basial physical and chemical properties are as follows: electrical conductivity 694.33 μs/cm, soil pH 8.14, organic matter 1.25 g kg−1, total N 0.68 g kg−1, total P (P2O5) was 0.66 g kg−1, available N 26.8 mg kg−1, available K (K2O) 12.46 mg kg−1, CEC 52.35 cmol kg−1. Biochar was made with maize crop which is widely planted in the YRD area. The biochar was purchased from Jilin Hongyuan Jialian Grass Material Energy Co., Ltd. (Jilin, China). Biochar was made using maize straw through the limiting oxygen-heating carbonization at a maximum temperature of 350–500 °C under an N2 environment, the temperature had more nutrients than other temperatures [32]. The biochar basial properties: pH 8.80, organic C 450g kg−1, total N 14.01 g kg−1, and total P 2.25 g kg−1.

2.2. Experiment Design

From May to November 2021, a Latin square design was applied to the site. Five treatments were established: no nitrogen applied (CK), formulary nitrogen-urea (N), urea with 2% nitrification inhibitor dicyandiamide DCD (D), urea with 1% biochar (B, biochar: 15 t ha−1), urea with 2% DCD, and 1% biochar (BD). Each treatment was replicated five times. The base fertilizer (urea, superphosphate (P2O5) and potassium sulfate (K2O): 160, 100 and 70 kg ha−1) was incorporated before planting, respectively. The nitrogen was equally added, and DCD addition was a 2% percentage of urea nitrogen. The fertilizer was evenly mixed and turned to the bottom (0–20 cm) soil layer. Moreover, each experimental plot was 28 m2 (4 m × 7 m), with 1m apart. Salt-alkali tolerant soybean variety (Qihuang 34) was seeded on 3 May 2021. For the Soybean plantation, the inter-row space was 40cm and for the intra-row of 12 cm, 4 kg of soybean seed was sown per 667 m2.

2.3. Soil Sampling and Chemical Analysis

Soil samples (0–20 cm) were five, randomly collected, in each plot during the four soybean growing stages (i.e., seedling (23 July), flowering (12 August), pod setting (3 September), and maturity stages (13 October)) in 2021. The fresh soil samples were transported to the laboratory and we picked out the stone, plant, and animal residues, all samples were sieved through a 2 mm sieve and mixed thoroughly (stored at 4 °C and −60 °C). The soil samples were divided into 3 parts. The first part was air-dried at room temperature for the soil’s pH, EC, and the soil’s aggregate analysis; part of the fresh samples was used for the soil’s NH4+-N and NO3-N analysis; and the remaining soil was stored at −60 °C for 16S DNA analysis. Soybean air-dried plants, yield, and nitrogen utilization were measured at maturity.

2.4. Soil Basial Properties and Soybean Yield

Soil pH and EC were measured in 1:5 (w/v) soil-water solution with a conductivity meter (DDS-307A, LEICI, Shanghai, China) and pH meter (PHS-25, LEICI, Shanghai, China) after shaking for 1 h in an end-over-end shaker [24]. The soil’s ammonium nitrogen and nitrate nitrogen content determination: 3 g fresh soil samples were extracted with 30 mL 2 mol/L potassium chloride solution (soil:liquid = 1:10) and shaken in a 160 r/min oscillator for 1 h. The extracted solution was filtered and the content of the soil’s ammonium nitrogen and nitrate nitrogen was determined by an AA3 continuous flow injection analyzer (SEAL Analytical, Norderstedt, Germany) at a wavelength of 660 nm and 540 nm. The soil’s aggregate composition was determined by the wet sieving method for aggregates of 1–2 mm, 0.5–1 mm, 0.25–0.5 mm, 0.053–0.25 mm, and <0.053 mm (TPF-100, Topu, Hangzhou, China). The aboveground biomass and yield of soybean were measured by 1.2 m × 1.2 m square at the soybean maturity stage. The soybean grains were then dried and ground into powder using a tin boat to pack the sample and to measure the nitrogen content of the soybean with an elemental analyzer (Vario Macro elementar, Hanau, Germany).

2.5. 16S RNA Analysis

Bacterial abundance in rhizosphere soil was determined by Guangzhou Gidio Biotechnology Co., Ltd. (Guangzhou, China). For financial reasons, 4 replicates were selected for each treatment for bacterial abundance analysis. Microbial DNA was extracted using the Hi Pure Soil DNA Kits (Magen, Guangzhou, China) according to the manufacturer’s protocols. The 16S rDNA target region of the ribosomal RNA gene was amplified by PCR (95 °C for 5 min, followed by 30 cycles at 95 °C for 1 min, 60 °C for 1 min, and 72 °C for 1 min, and a final extension at 72 °C for 7 min) using primers 341F (CCTACGGGNGGCWGCAG) and 806R (GGACTACHVGGGTATCTAAT) to target the V3–V4 domain of bacterial 16S rRNA. PCR reactions were performed in a triplicate 50 μL mixture containing 10 μL reaction buffer, 10 μL high GC enhancer, 1.5 μL dNTPs, 1.5 μL primer, 0.2 μL high-fidelity DNA polymerase, and 50 ng of template DNA. Related PCR reagents were sourced from New England Biolabs USA (New England, USA). Thereafter, the amplicons were normalized, pooled, and sequenced on the Illumina platform.

2.6. Calculations and Statistical Analysis

Statistical analyses were performed with SPSS 16.0, and a one-way ANOVA analysis of variance was used to identify differences in the effects of biochar and nitrification inhibitors on soil and plant growth characteristics. Person analysis and general linear model fitting were used to analyze the relationship between the soil’s apparent nitrification rates and the soil’s basic physicochemical indexes. The redundancy analysis (RDA) was conducted by Canoco 5 with a constrained method for the relationship between the soil and plant’s properties and the soil’s bacteria abundance. The analysis of bacterial community structure was carried out using the Gidio cloud platform. All the above tests were based on a significance level of p < 0.05. Origin 2021 and Microsoft Powerpoint 2010 were used for picture drawing. The main calculation process is as follows [33,34]:
Apparent nitrification rate (%) = NO3-N/(NH4+-N + NO3-N) × 100
Mean   mass   diameter   ( MWD ) = i = 1 n X i × W i
Geometric   mean   diameter   ( GMD ) = E X P W i × L N X i W i
where, Xi is the average diameter (mm) of the aggregate at any level; Wi is the percentage of aggregate corresponding to Xi.
Economic coefficient (EC) = Economic yield/Biological yield × 100%
Fertilizer production contribution rate (FPC, %) = (Yield of fertilizer area − Yield of
control)/Yield of fertilizer area × 100%

3. Results

3.1. Effects of Biochar and Inhibitor Addition on Ammonium and Nitrate Nitrogen Contents in the Soil

The soil’s inorganic nitrogen and the apparent nitrification rate were affected by biochar and the addition of the inhibitors, and the combination (BD) behaved the best, which significantly increased the soil’s ammonium nitrogen content and decreased the apparent nitrification rate at the seedling stage compared with the N treatment (Figure 2a,d, p < 0.05). Ammonium nitrogen of B, D, and BD treatments was 8.87%, 13.34%, and 53.65% higher than the N treatment in the seedling stage, respectively, and BD treatment reached the significance level, while DCD did not (Figure 2a, p < 0.05). The soil’s ammonium nitrogen content decreased gradually with the growth period, and the content in the seedling stage was significantly higher than in the other growth stages (Figure 2a, p < 0.05). The soil’s nitrate content was greatly affected by biochar/inhibitor addition and the soybean growth period (Figure 2b). Nitrification inhibitor DCD (D and BD treatment) significantly decreased the soil’s NO3-N content by 43.07% and 41.39% in the seedling stage, and 146.82% and 224.52% in the flowering stage compared with the B treatment, which indicated that nitrification inhibitors were effective in inhibiting nitrification in alkaline soil, especially when combined with biochar. Biochar with nitrogen was not beneficial to the soil’s nitrate supply except in the podding and maturation stage. The soil’s nitrate content in BD increased by 1.83, 5.6, and 1.77 times compared with CK and increased by 30.17%, 63.36%, and 211.91% at the maturation stage compared with N, respectively. Therefore, BD treatment had the highest nitrate content during the whole growth period except in the seedling stage and reached a significant level compared with N and D treatment, thus, it had the highest inorganic nitrogen content and apparent nitrification ratio (Figure 2b–d), which was beneficial in terms of nitrogen supply.

3.2. Effects of Biochar and Inhibitor Addition on the Soil’s pH and the Soil’s Electrical Conductivity

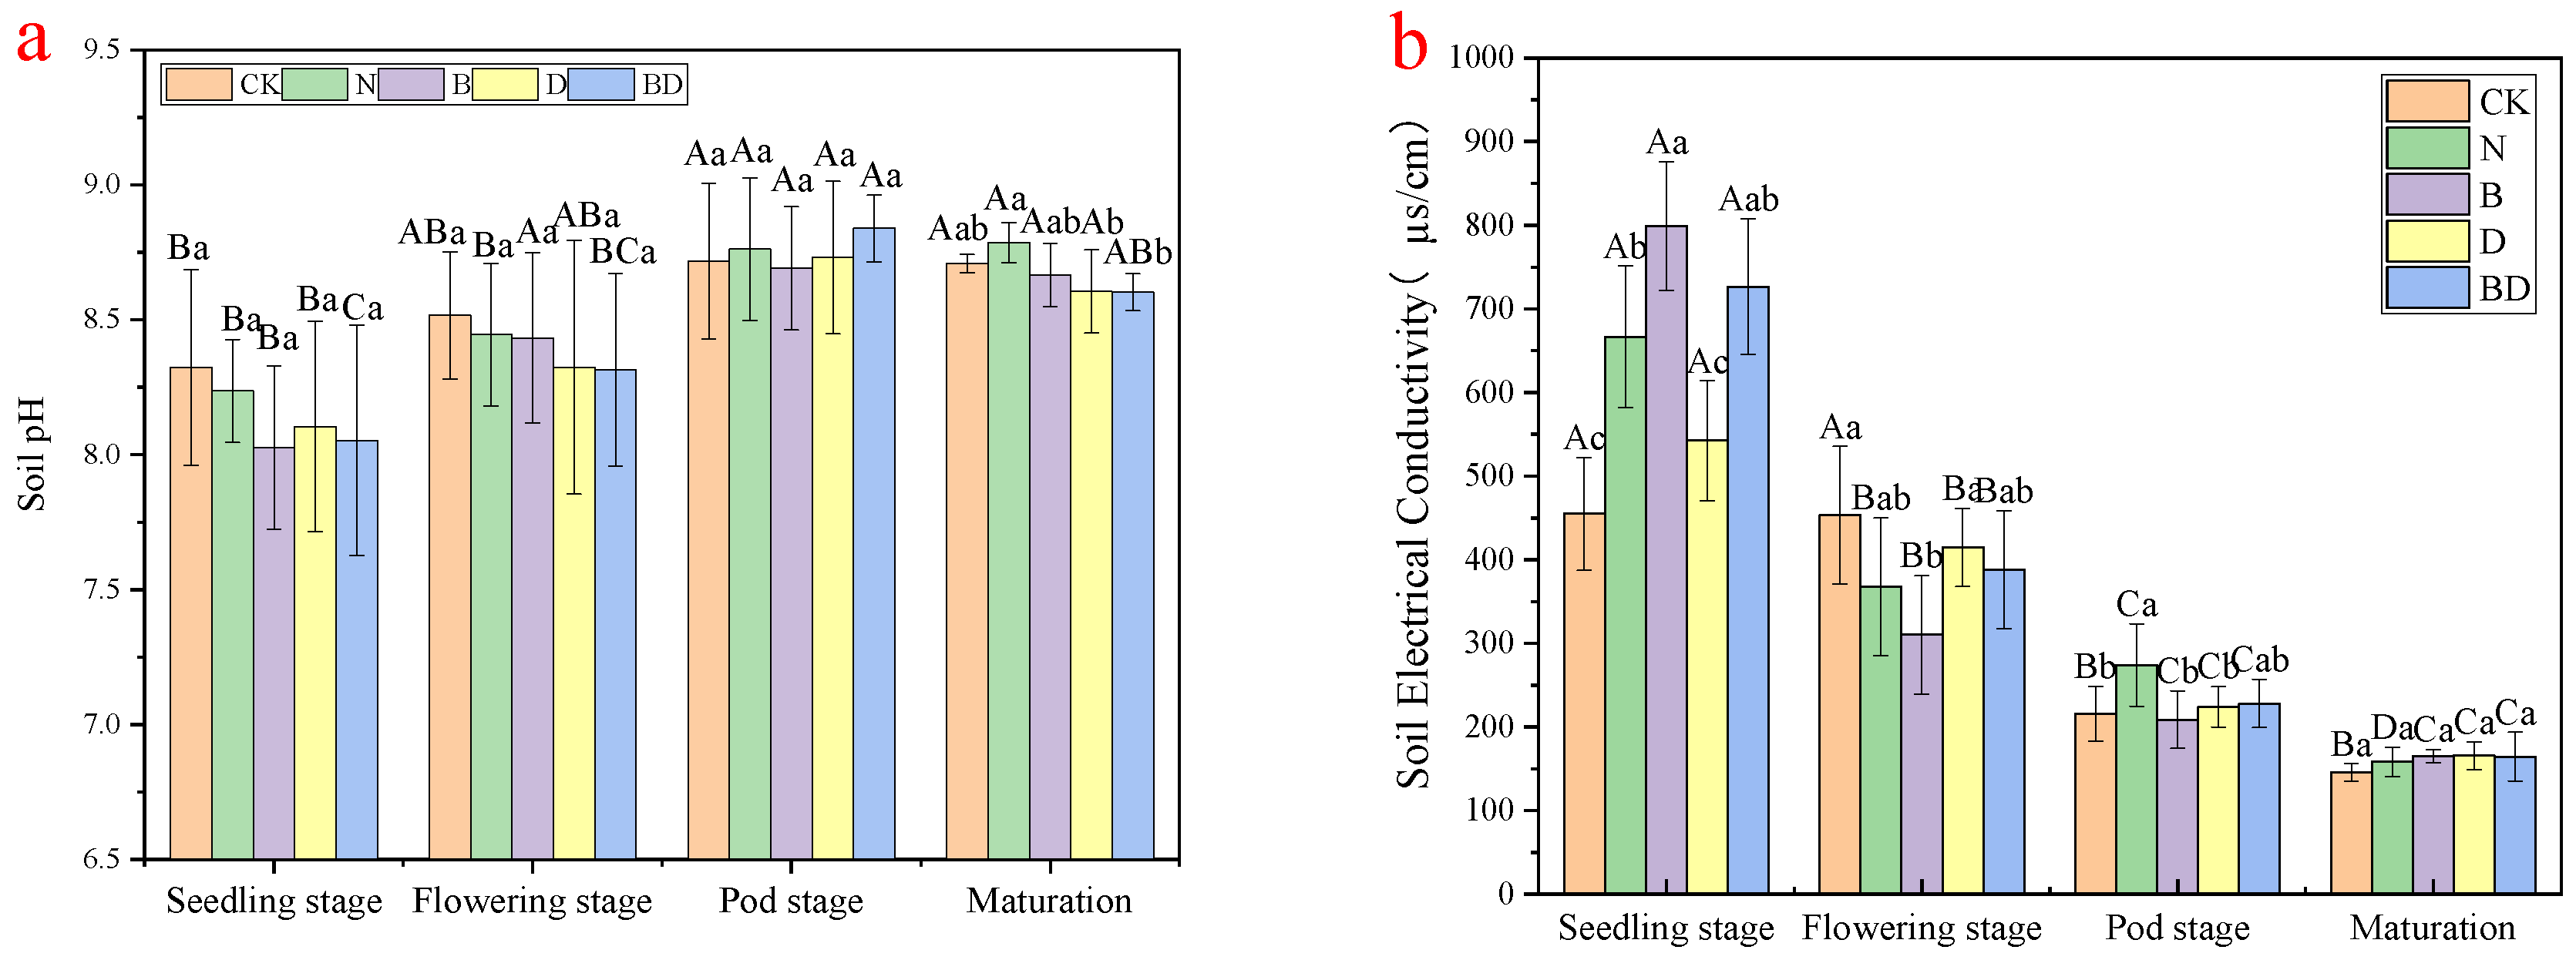
The soil’s pH and the soil’s electrical conductivity were not significantly influenced by the addition of exogenous substances, while mainly reflected by the growing stage, especially the seedling and maturation stage (Figure 3, p < 0.05). The soil’s pH was increased with soybean growth, especially, and the podding and maturation stage was significantly higher than the seedling stage (Figure 3a, p < 0.05). Compared with the seedling stage, the soil pH of CK, N, B, D, and BD treatments increased by 2.18%, 6.68%, 7.95%, 6.17%, and 4.24% at the maturation stage, respectively (Figure 3a). The soil’s pH was significantly lower in D and BD treatments than in N treatment and decreased by 2.07% and 2.09% (Figure 3a, p < 0.05), which means DCD had a certain effect on reducing the soil’s pH.
The soil’s electrical conductivity was decreased with soybean growth and showed an obvious effect related to the soil’s pH at the seedling stage, biochar addition treatments were higher than that without biochar (Figure 3b). Moreover, biochar addition significantly increased the soil’s electrical conductivity compared with N (p < 0.05), and when combined with an inhibitor, the regulatory effect on electrical conductivity was weakened, causing no significant difference (Figure 3b). Compared with the seedling stage, the soil’s electrical conductivity of CK, N, B, D, and BD decreased by 68.01%, 76.27%, 79.37%, 69.45%, and 77.37% in the maturation stage, respectively (Figure 3b). The soil’s electrical conductivity reached 145–154 µs/cm at the maturation stage.

3.3. Effects of the Soil’s Apparent Nitrification Rate on the Soil’s pH, Electrical Conductivity, Ammonia Content, and Nitrite

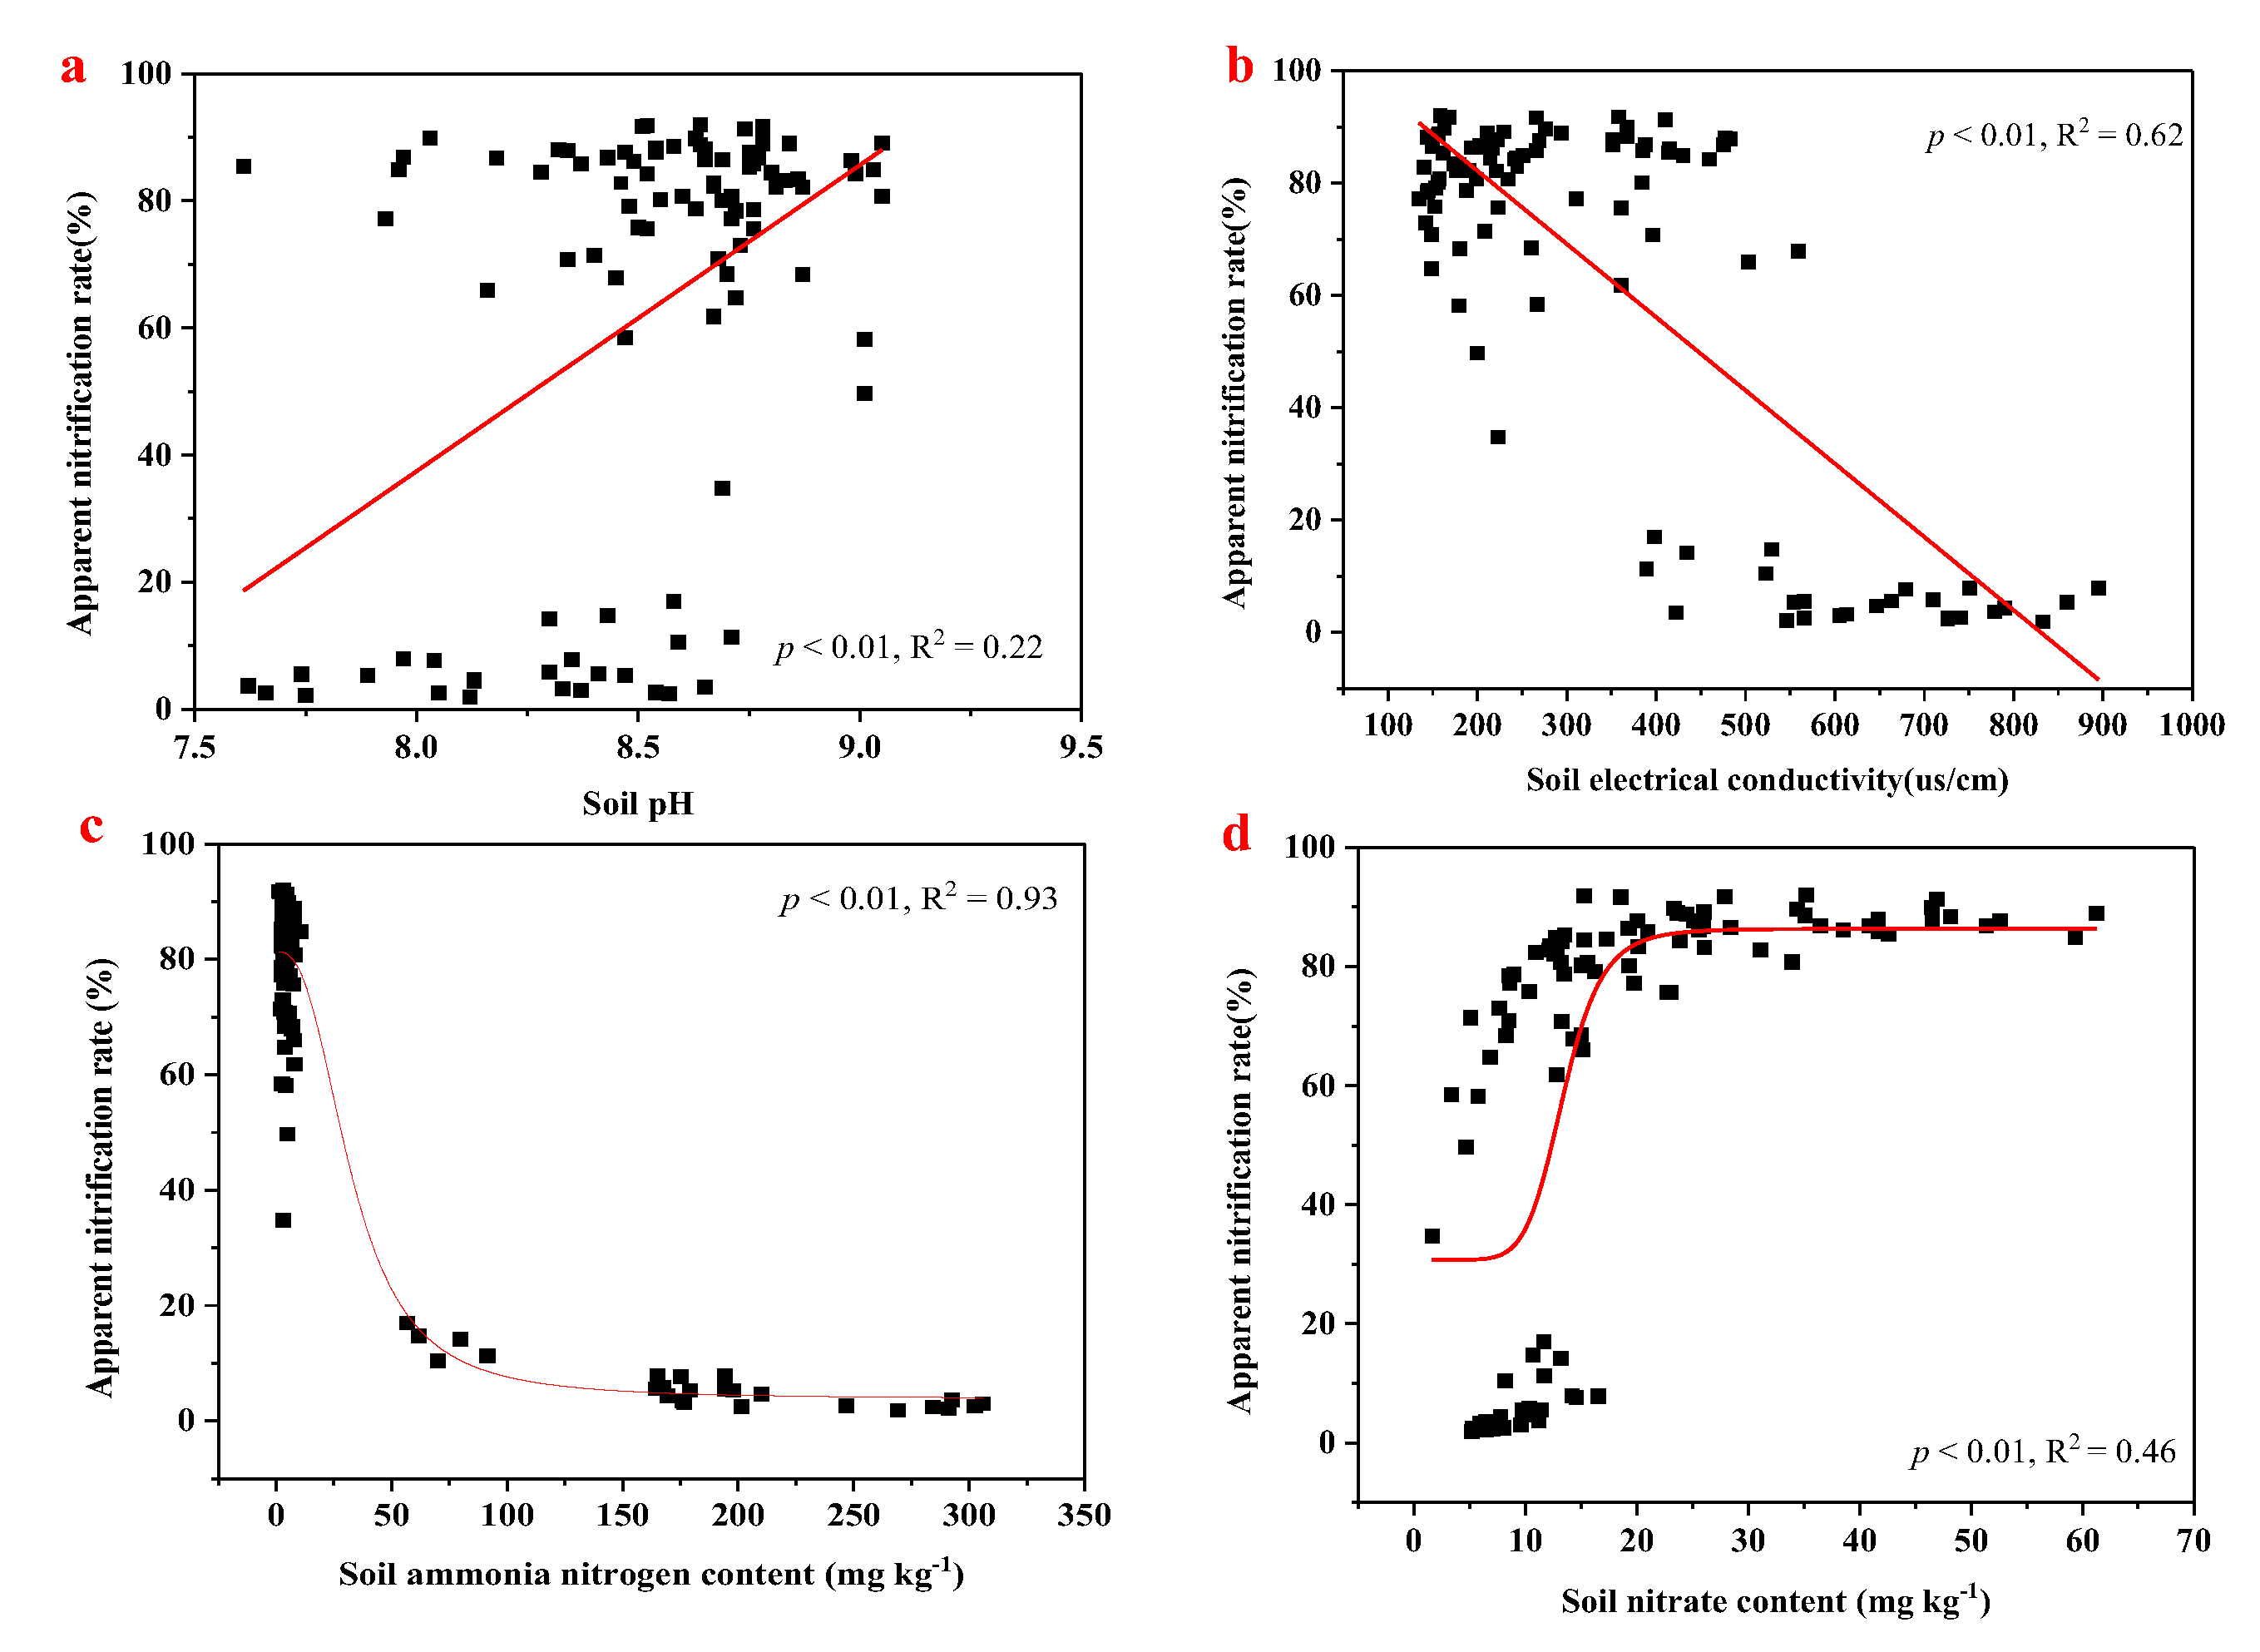
In order to further explore the influenced factors (the soil’s pH, the soil’s electrical conductivity, the soil’s ammonia nitrogen, and the soil’s nitrate nitrogen) on the soil’s nitrification rate in saline-alkali soil to fit the model, a significant relationship was detected among them (Figure 4). The soil’s apparent nitrification rate was significantly and positively correlated with the soil’s pH and nitrate (Figure 4a,d), and significantly and negatively correlated with the soil’s electrical conductivity and ammonia nitrogen (Figure 4b,c). There was a direct linear relationship between the soil’s pH and the soil’s electrical conductivity with the soil’s apparent nitrification rate, while the soil’s ammonium nitrogen and nitrate with the soil’s apparent nitrification rate accord with the logistics model (Figure 4).

3.4. Effects of Biochar and Inhibitor Addition on the Soil’s Aggregates and Structural Stability

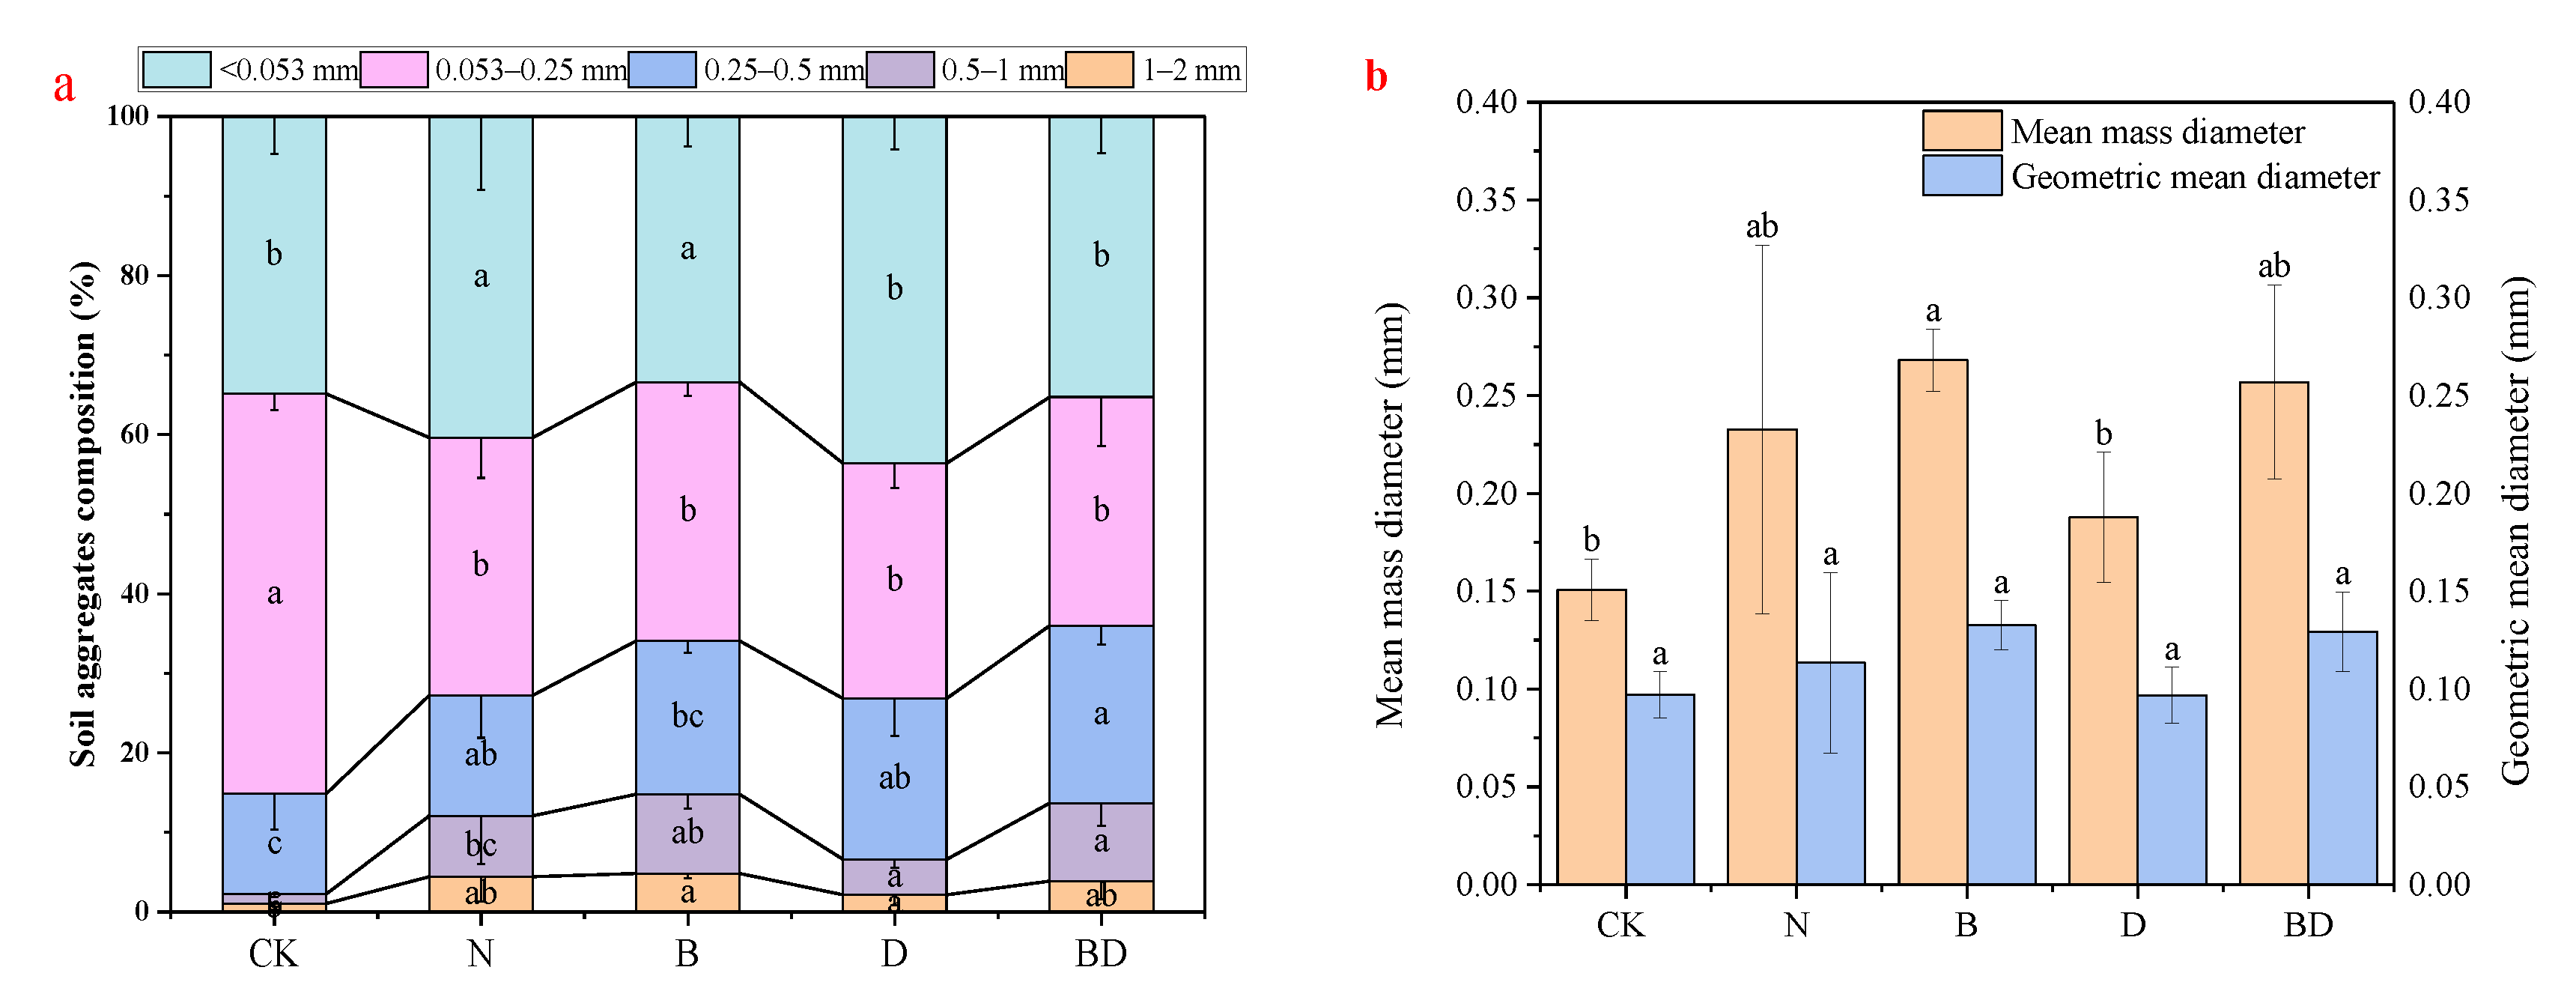
Biochar and inhibitor changed the composition of the soil’s aggregates and structural stability (Figure 5). Overall, the silt fraction (<0.053) was the dominant aggregate, accounting for 85%, while 66% and 64% under B and BD amendments, the addition of biochar promoted the formation of microaggregates and increased the mean mass diameter. Biochar addition (B and BD) increased the soil’s average mass diameter by 78.69% and 71.29%, and geometric average diameter by 30% and 29.34% relative to CK (Figure 5a,b), suggesting that the macroaggregates were increased with the biochar addition. Biochar had the highest improvement effect on the soil’s aggregates of 1–2 mm, 0.5–1 mm, and 0.25–0.5 mm (Figure 5a,b). Compared with N, 0.25–0.5 mm aggregate increased by 27.32% and 47.47%, and <0.053 mm aggregate decreased by 17.31% and 12.63% in B and BD, respectively. A single application of nitrogen fertilizer and inhibitor had no significant effect on the improvement of the soil’s particle size. These data indicated that fertilization changed the formation of the soil’s aggregates, and the combined application of biochar and inhibitor had a synergistic effect on increasing the soil’s macroaggregates by sand proportion (Figure 5a,b, p < 0.05).

3.5. Effects of Biochar and Inhibitors on Soybean Yield and Economic Indicators

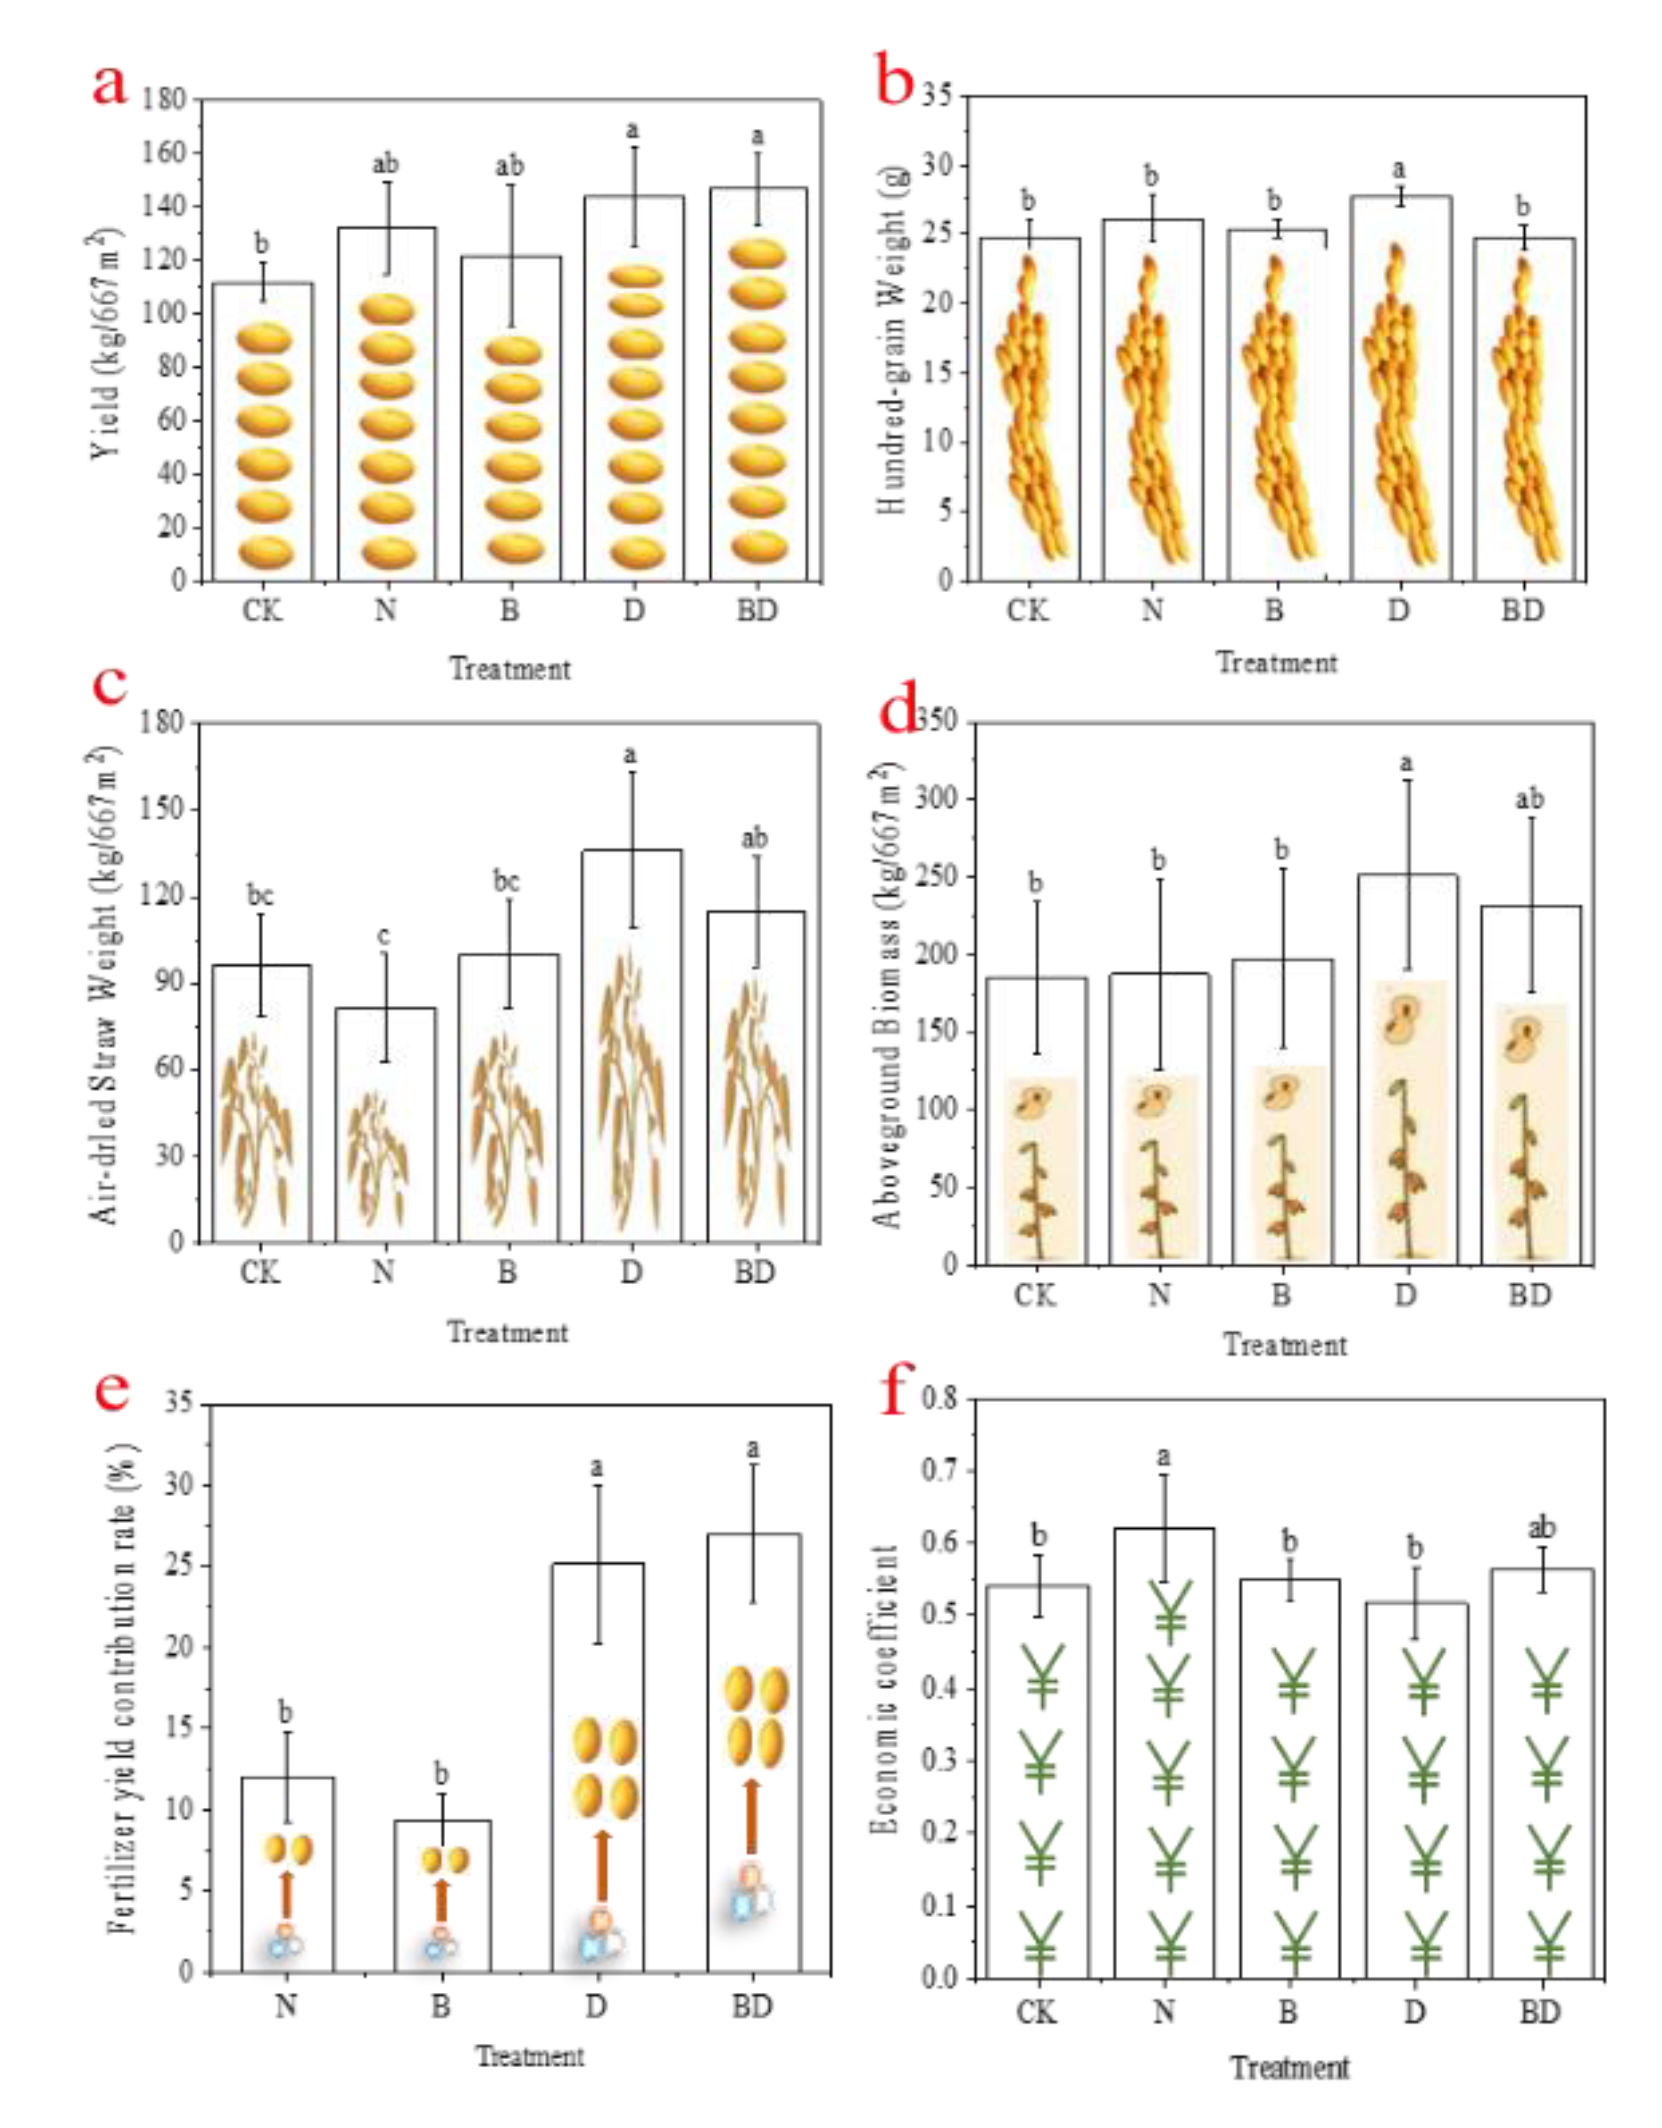
The positive effect of the inhibitor was found in increasing soybean yield, hundred-grain weight, aboveground biomass, and fertilizer yield contribution rate in seaside saline-alkaline soil (Figure 6). Exogenous materials (inhibitor and biochar) increased soybean yield, and the combination of inhibitor with/without biochar had the best yield-promoting effect, which reached a significant level compared with CK (Figure 6a, p < 0.05). The yield and fertilizer yield contribution rates of D and BD increased by 9.08%, 11.08% and 109%, 189%, respectively, compared with N. The inhibitor application (D and BD) increased the air-dried straw weight, the above-ground biomass, and the fertilizer yield contribution rate, which increased by 67.21% and 40.98%, 34.36% and 24.08%, and 109% and 189%, respectively, compared with N. Inhibitor added alone significantly increased one hundred weights of soybean by 12.15% compared with CK (Figure 6b, p < 0.05), but there was no significant difference compared with other treatments (Figure 6b, p > 0.05). Meanwhile, the addition of inhibitors also significantly increased the straw weight and biomass of the aboveground part (Figure 6d, p < 0.05).

3.6. 16S rRNA for Bacteria Community in Soybean Root and Rhizosphere Soil

3.6.1. Bacterial Diversity (OTU, ACE, Chao1, and Shannon Index)

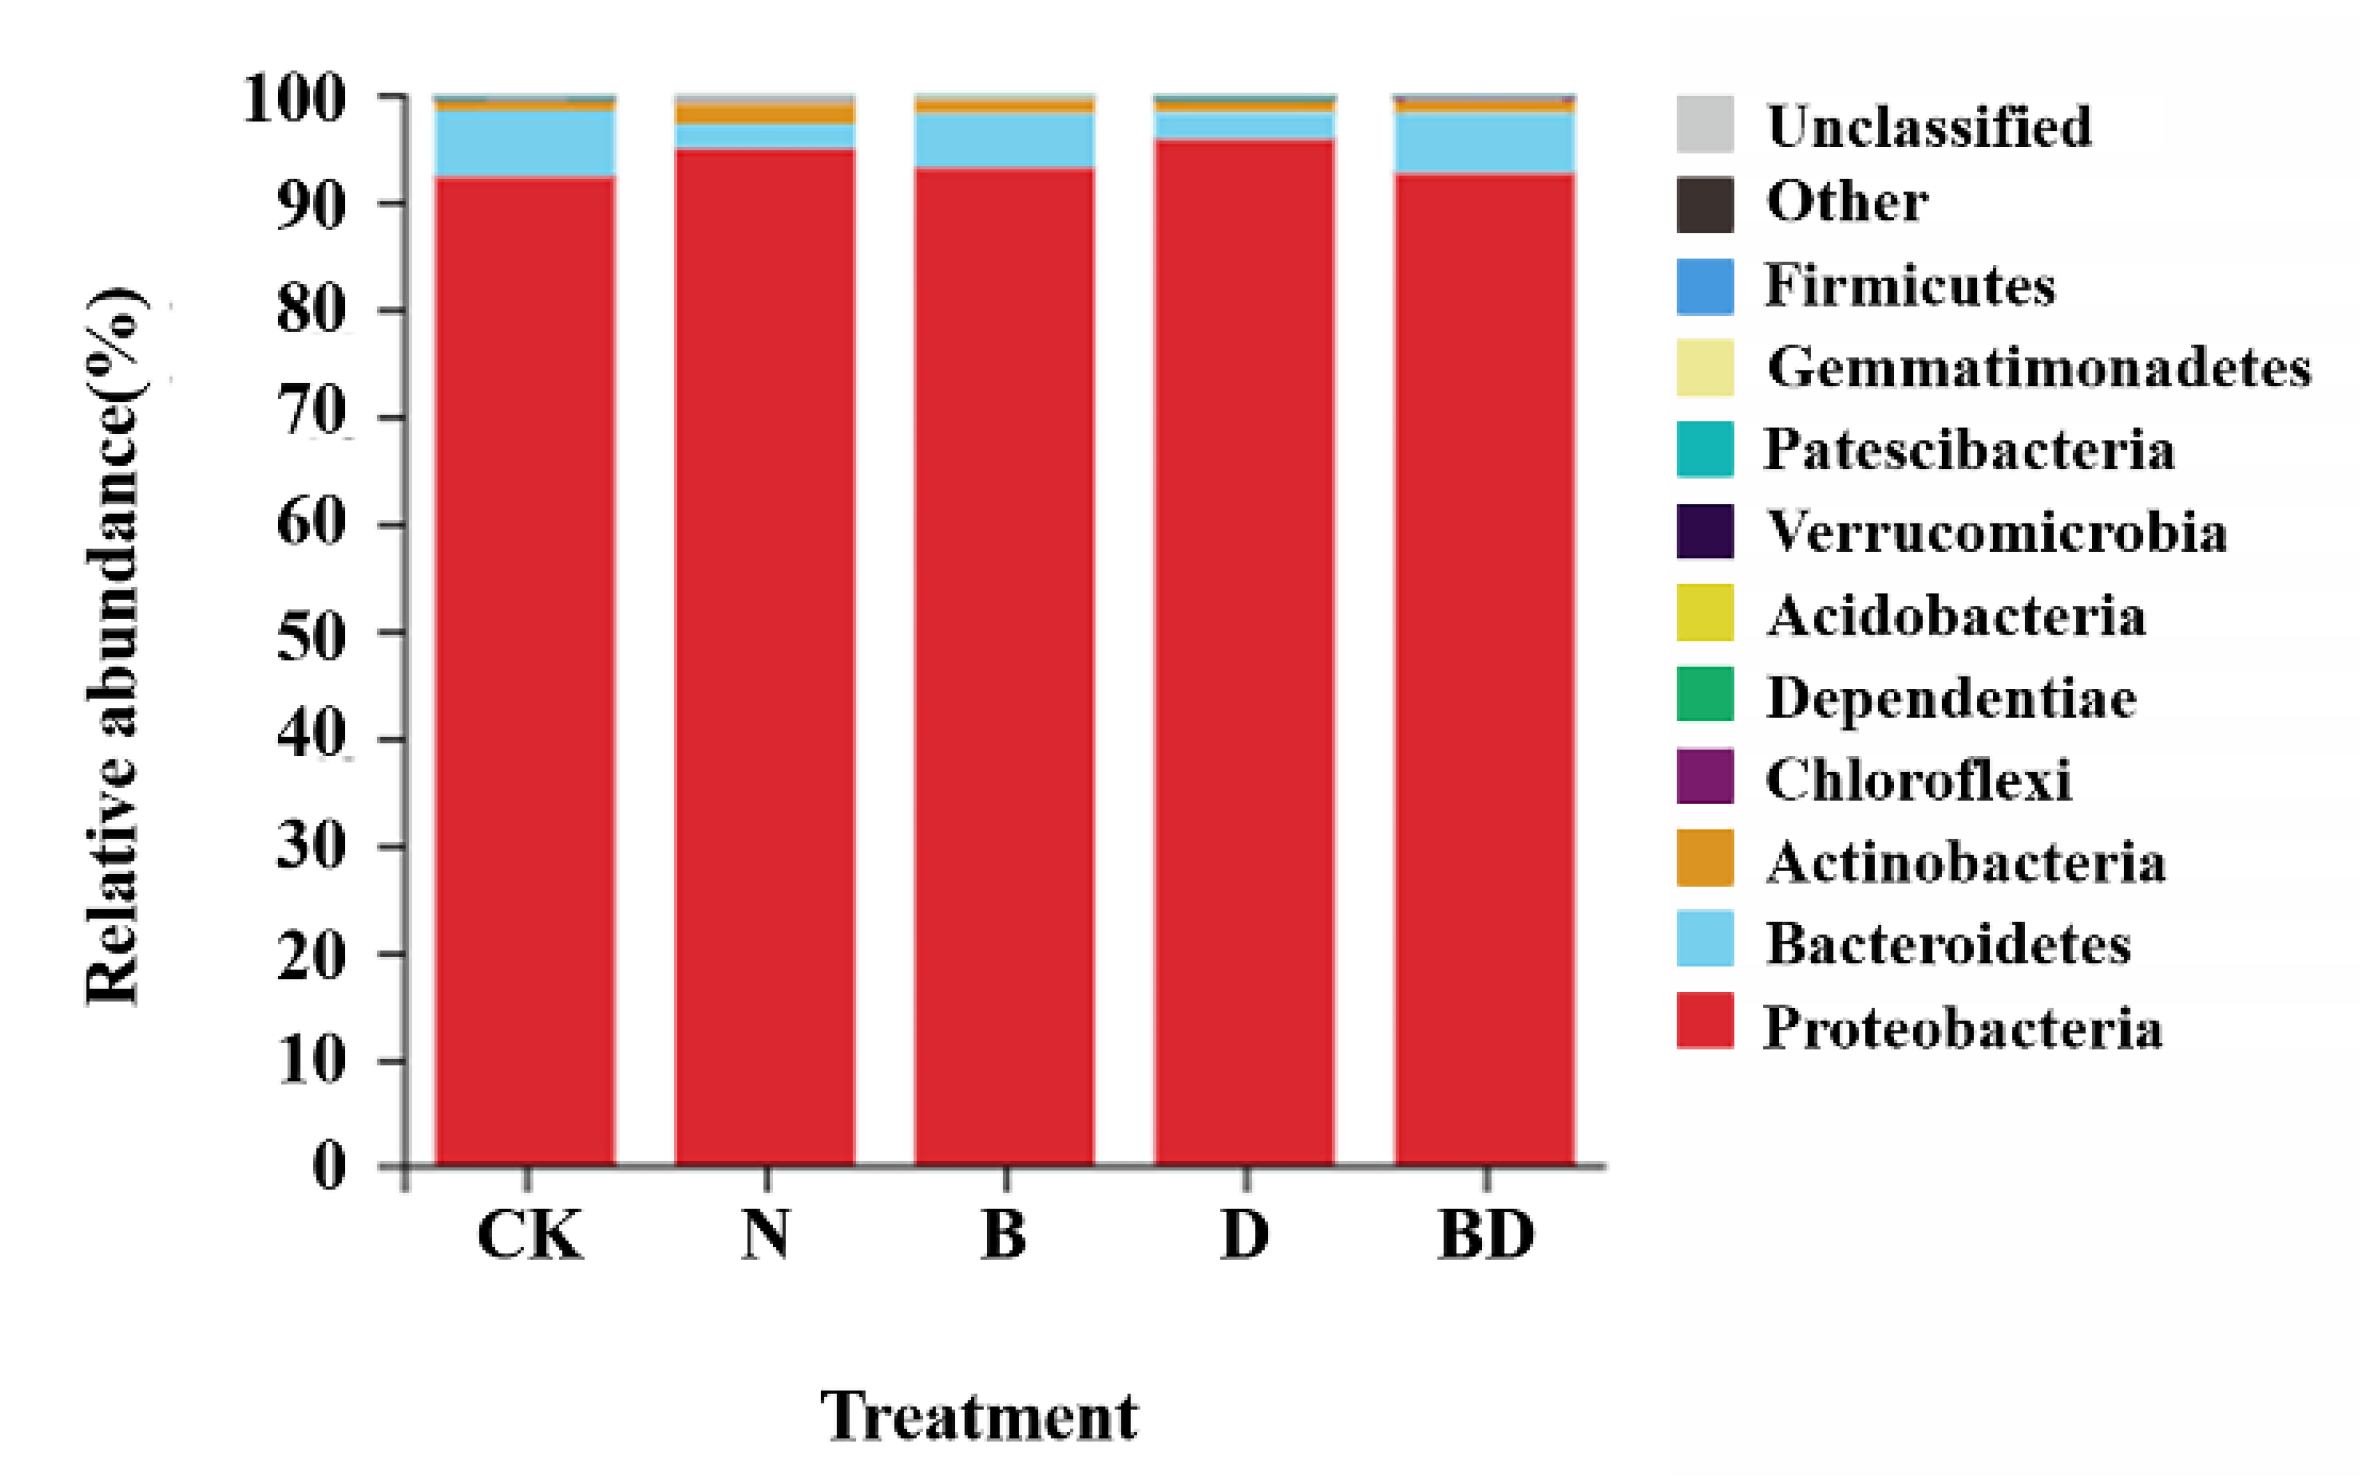
Bacterial communities play a key role in soil nutrient cycling, which were used to investigate the effects of different carbon sources and nitrogen supply levels on soybean rhizosphere nitrogen fixation. The α-diversity was not influenced significantly by biochar and inhibitor addition (Table 1, p > 0.05). Exogenous additives increased the relative abundance of Proteobacteria in soil (Figure 7). Spatial asynchrony between communities provides greater stability over a larger range and was not affected by N and biochar addition.

3.6.2. Bacterial Composition

The relative abundances of different bacterial phyla are shown in Figure 7. Bacteria in all treatments were similar at the phylum level, and Proteobacteria was the dominant soil bacterial community in saline-alkaline soils and accounted for 92.2–95.7% of the total OTUs found. Bacteroidetes were the second soil bacterial community accounting for 2.3–6.2%. All fertilization treatments did not reach the significance level in statistics (p > 0.05). Compared with CK, the fertilizer treatments had little effect on Proteobacteria, but decreased the abundance of Bacteroidetes, Acidobacteria, and Gemmatimonadetes, and increased the abundance of Actinomycetes. Compared with CK, the N treatment mainly increased Actinobacteria and Chloroflexi abundance for 141.5% and 106.3%, biochar addition mainly stimulated Actinobacteria and Dependentiae for 62.7% and 74.2%; DCD addition mainly increased Actinobacteria and Acidobacteria for 24.5% and 76.3%, biochar and DCD coupling had the least effect on the abundance of the bacterial community.
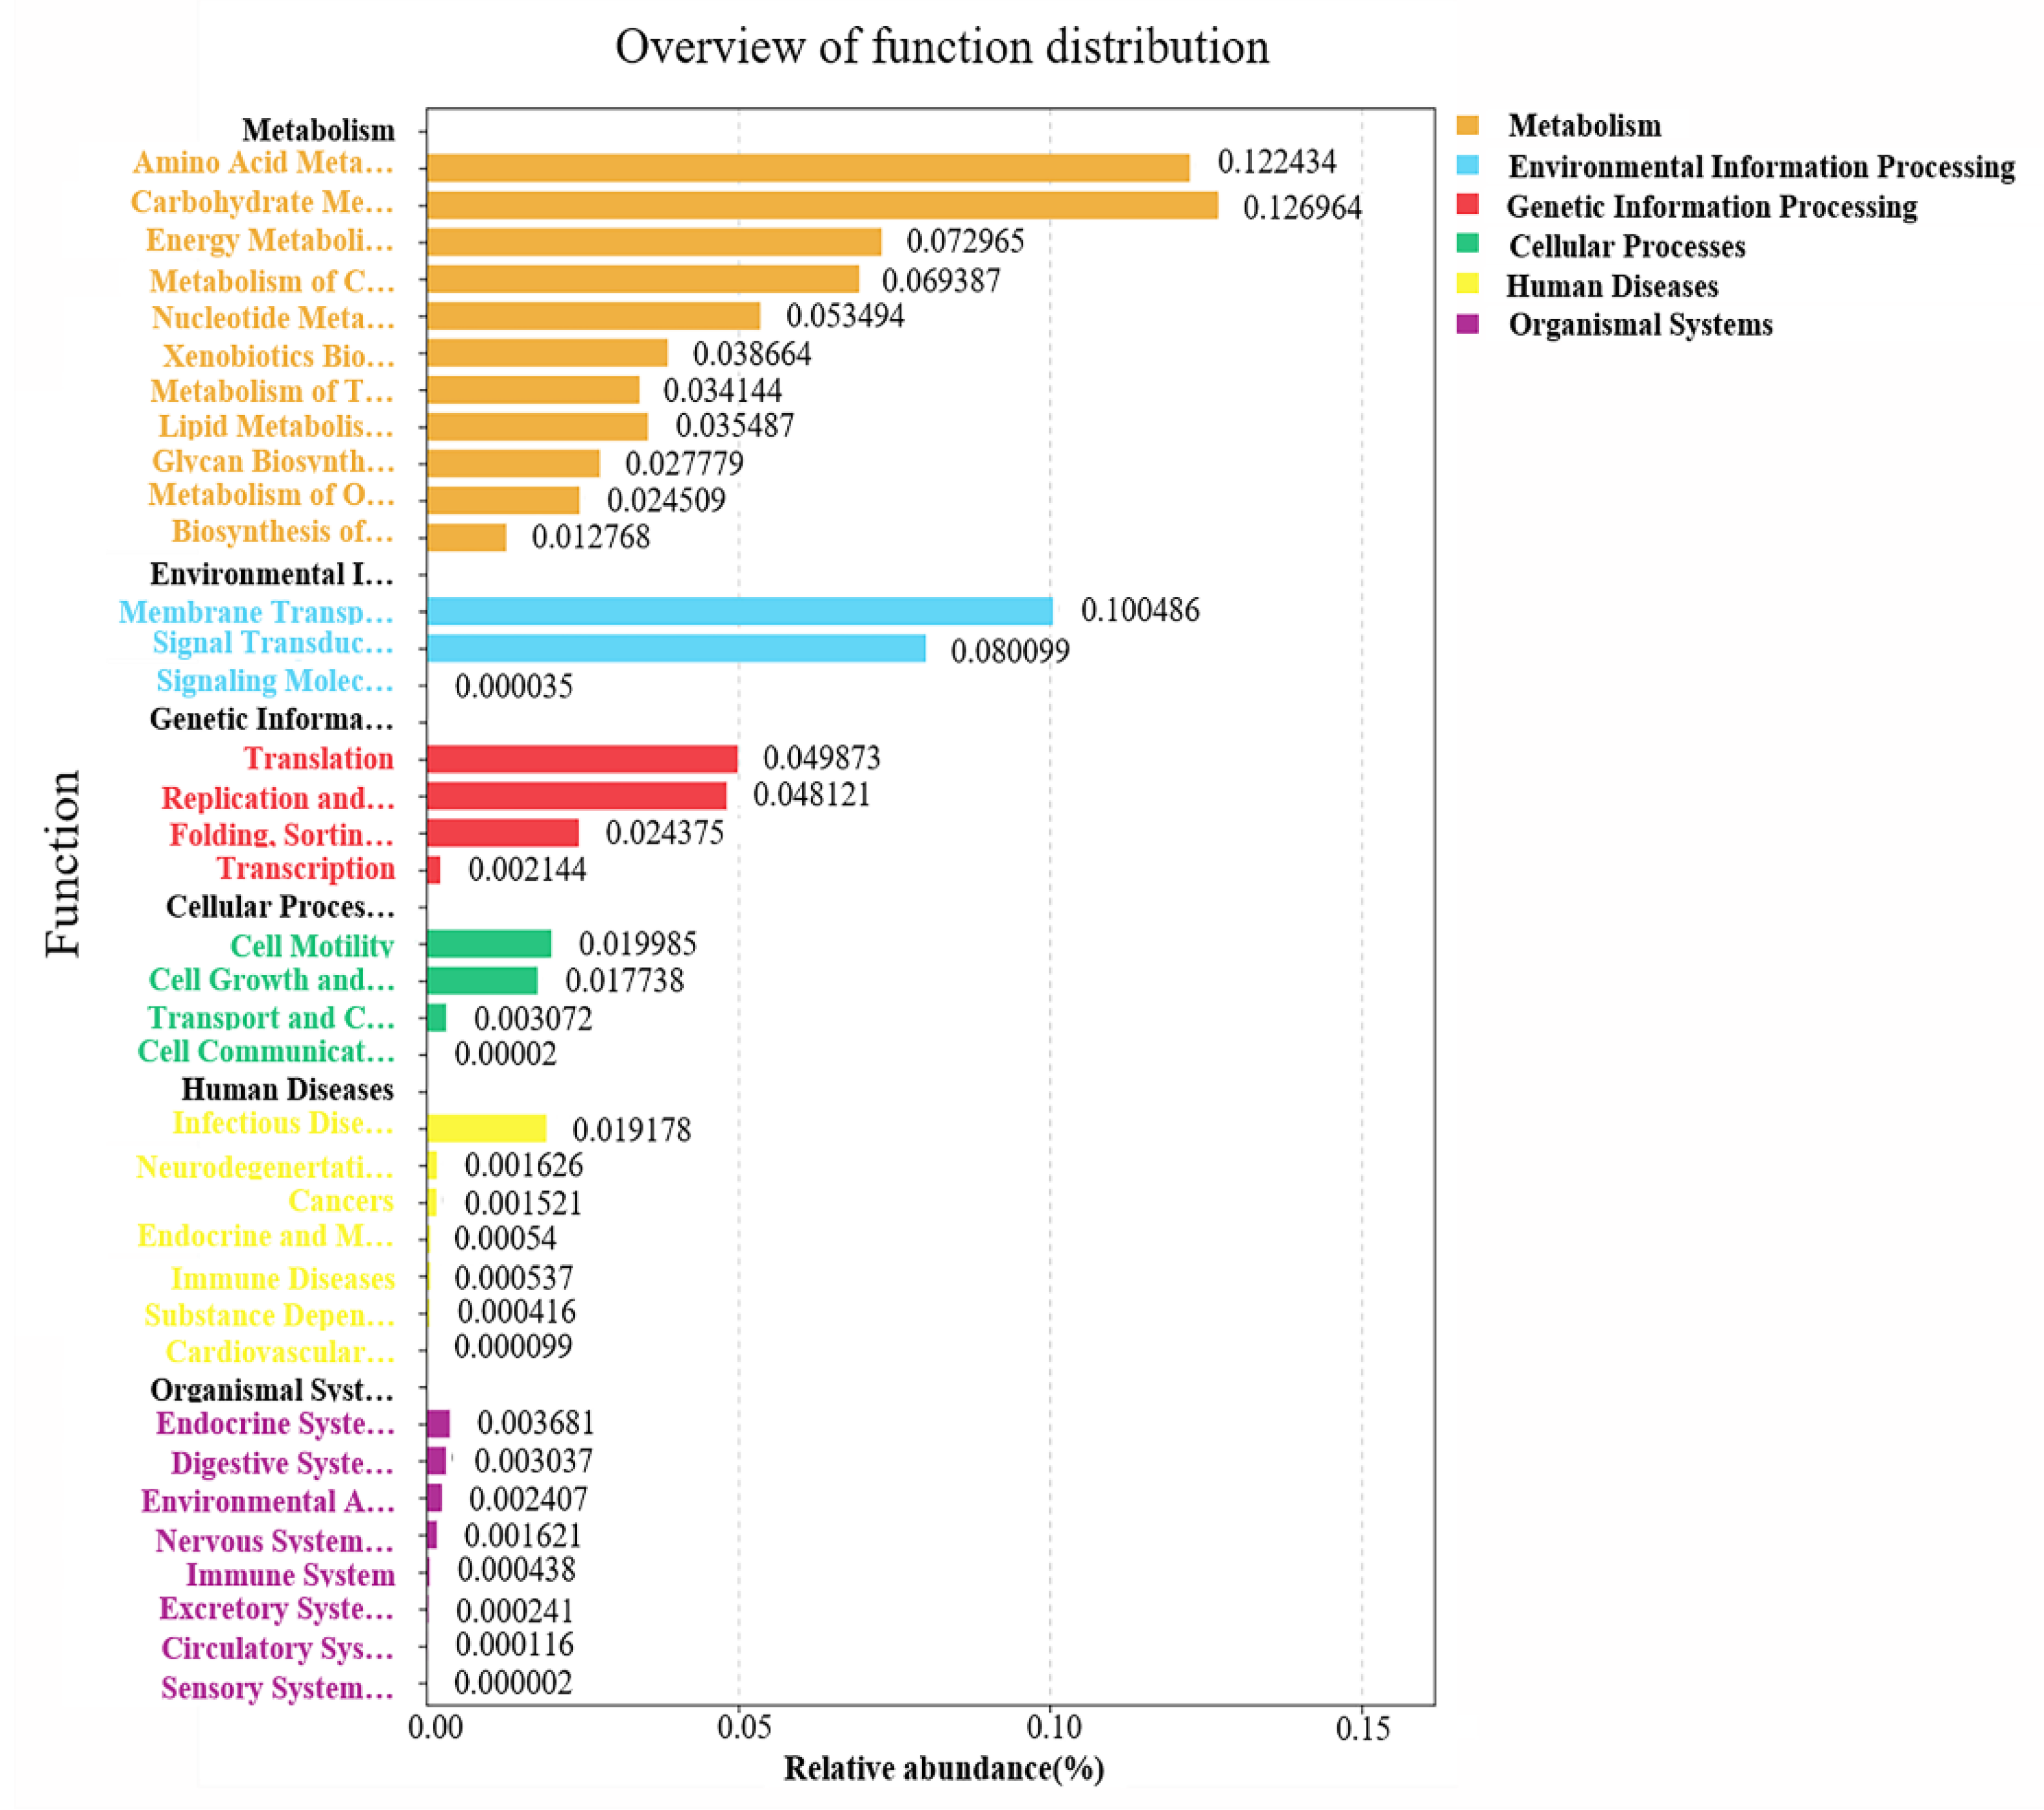
Genes related to amino acid metabolism and carbon metabolism were dominant in metabolism-related bacteria due to biochar and nitrogen application. The membrane transport genes were the main part of the environmental information processing. The other else was low including genetic, human diseases, and organismal systems (Figure 8).

4. Discussion

4.1. Effect of Biochar and Nitrification Inhibitor on Valid Nitrogen

Soil valid N (NH4+-N and NO3-N) is an important element for assessing a soil’s N supply capacity and the assimilation of crops [35]. Soil nitrogen conversion was strongly influenced by the soil’s properties and the exogenous organic materials addition. Nitrification inhibitor DCD had a good effect on inhibiting nitrification in the seedling stage of soybean when combined with biochar, where the nitrate content was more obvious than ammonia content, and prolonged NO3-N peak and higher inorganic supply capacity and apparent nitration rate (Figure 2). As a nitrification inhibitor, dicyandiamide has been proven to have a good effect on inhibiting nitrification in alkaline soil by reducing NH3 and N2O emissions [6,36]. In this experiment, biochar reduced nitrite content among soybean growth stages except in the maturation stage (Figure 2b). The mean reason can be interpreted for three reasons: (1) biochar has a porous structure and can directly adsorb ammonium and nitrate nitrogen, and can reduce nitrogen leaching [35,37]. (2) Due to the high C/N ratio of biochar, this stimulated the priming effect and increased the soil’s microorganisms including both free-living and symbiotic soil bacteria, which increased the nitrogen immobilization and mineralization of the soil’s microorganisms, those processes were proven to occur at least 10 days after application. (3) the fixation of nitrogen from atmospheric N2 to ammonia (NH3), biological N, and nodulation of rhizobia [37,38,39,40,41]. The addition of a nitrification inhibitor affected the dynamics of nitrification, inhibited nitrification function, prolonged the release time and amount of nitrate nitrogen, and increased the available nitrogen source [42,43].

4.2. Effect of Biochar and Nitrification Inhibitor on the Soil’s Basial Properties

Research showed that principal component analysis showed that CEC, pH, salinity, and organic matter could be used as indicators to evaluate the improvement effect of biochar on saline-alkali soil [44]. The effect of biochar and fertilizer on the soil’s pH and electrical conductivity was most obvious at the seedling stage and decreased with the seasonal change of soybean growth and precipitation, and the effect of each treatment gradually decreased (Figure 3). The hydroxyl, carboxyl, and phenolic groups on the surface, carbonates, bicarbonates, and silicates in biochar can bind with the hydrogen ion in soil–water, which reduced the H+ concentration, thus biochar addition increased the soil’s pH [45]. The results showed that the addition of biochar promoted the growth of leguminous crops mainly by affecting the roots of sesbania [46].

4.3. Effect of Biochar and Nitrification Inhibitor on Bacteria Abundance

The bacterial community and the functional roles have been reported to be severely limited by soil salinity, and it is strongly influenced by exogenous organic and inorganic additives [24,26,27,47]. Studies have shown that biochar addition can increase the diversity of a soil’s bacterial communities [45,48], and the addition of both carbon and nitrogen sources changed the community structure of ammonia-oxidizing bacteria [49]. The microbes adjusted themselves to soil alkalinity to offset the adverse effects, and the Proteobacteria were the dominant marine samples, whether a different class [50]. The result was instant with our study, the Proteobacteria was the dominant phylum in the bacterial communities detected (Figure 7), which was mainly affected by seawater intrusion and sediment deposition in coastal saline-alkali areas.
Research showed that microbial diversity and abundance are negatively affected in soils with a pH > 7 and high Na+ levels [51]. The application of nitrogen fertilizer and inhibitor DCD increased the proportion of the dominant species Proteobacteria, while decreasing the proportion of Bacteroidetes, compared with CK, which means a single application of nitrogen fertilizer may increase the process of soil ammonia oxidation and promote the loss of ammonia, because Proteobacteria contains the main bacteria responsible for ammonia oxidation, such as ammonia-oxidizing bacteria (AOA) and ammonia-oxidizing archaea (AOB), but the specific functional bacteria need to be further determined. However, it was found that DCD addition could inhibit the growth of AOB in alkaline soil [11]. Microbial diversity was increased with biochar application but was negatively affected at higher rates [22]. In this experiment, biochar addition was conducive to the stability of bacterial flora and function. Compared with the control, The structure and abundance of bacterial communities in B and BD treatment were not significantly changed (Figure 7, Table 1, p > 0.05).

4.4. Relationships between Bacterial Community and Soil Properties

To explore the relationship among bacterial communities and soil factors’ responses to inhibitor and biochar addition. The redundancy analysis with supplementary variables was analyzed and constrained in Figure 9. The total variation was 13.38, and explanatory variables account for 54.6%. The first two principal components accounted for 38.52% of the total variability, in which the PC1 and PC2 explained 23.16% and 15.36% of the total variation, respectively. Results showed that the changes in bacterial community diversity can be explained by factors of nitrate nitrogen, inorganic nitrogen, and MMD, which reached a significant level at 0.05 (Figure 9b), reflecting the changes in bacterial community structure in saline-alkali soil were mainly affected by nitrate content and the soil’s aggregates. Moreover, the abundance of the bacterial community, especially Actinobacteria, was mainly affected by soil pH and DCD addition (Figure 7 and Figure 9a), the results were consistent with Zhao (2018) [44], soil pH is equally important as salinity in shaping bacterial communities in saline soils under halophytic vegetation [52]. Members of the class Alphaproteobacteria were positively correlated with the soil’s environmental factors in Figure 9, which reflects that it is more adaptive and dominates in high-salinity soils. Gram-positive bacteria (G+) Gemmatim were closely related to the soil’s ammonium nitrogen content. Research showed that Acidobacteria was significantly and positively correlated with crop yield and soil fertility, and Actinobacteria had a contrasting pattern [18], which was in contrast with our results. Moreover, research showed that biochar application greatly increased N2-fixing bacteria abundance by 45.7% [53], which verified that carbon addition promoted fertilizer utilization rate in this experiment, and the combined application effect of both was the best.

5. Conclusions

Single or combined application of biochar and nitrification inhibitor dicyandiamide (DCD) with soybean planting influenced the nitrogen transform, soil properties, and bacterial community structure. Biochar addition increased the soil’s pH, decreased the soil’s electrical conductivity, and promoted the formation of 0.25–0.5 mm of soil aggregation. The yield of D and BD increased by 9.08% and 11.08% compared with N. Nitrification inhibitor DCD promoted the soybean yield, one hundred-grain weight, and aboveground biomass. The combined application of biochar and dicyandiamide had a higher supplying-supplying ability and did not significantly change the abundance and diversity of the soil’s bacterial community. Biochar combined with DCD or carbon-based fertilizer is a feasible fertilization scheme for mild to moderate coastal saline soils in the Yellow River Delta. The long-term effect needs to be further verified in the field.

Author Contributions

Conceptualization, C.Y. and G.W.; Data curation, C.Y.; Formal analysis, C.Y.; Funding acquisition, G.W.; Investigation, H.C., H.Z. and Q.M.; Methodology, C.Y. and G.W.; Resources, Supervision, Writing—Original draft, C.Y.; Writing—Review and Editing, C.Y. and G.W. All authors have read and agreed to the published version of the manuscript.

Funding

This research was funded by the National Key Research & Development Program of China (2019YFD1002702), and the Key Research & Development Program of Shandong Province (2021SFGC0301).

Data Availability Statement

All relevant data is contained within the article.

Acknowledgments

We would like to thank the Yellow River Delta Saline-alkali Farmland Ecosystem Observation and Research Station of Yantai Institute of Coastal Zone Research, Chinese Academy of Sciences for providing the experimental site.

Conflicts of Interest

The authors declare no conflict of interest.

References

  1. Setia, R.; Marschner, P. Carbon mineralization in saline soils as affected by residue composition and water potential. Biol. Fert. Soils 2013, 49, 71–77. [Google Scholar] [CrossRef]
  2. Gunarathne, V.; Senadeera, A.; Gunarathne, U.; Biswas, J.K.; Almaroai, Y.A.; Vithanage, M. Potential of biochar and organic amendments for reclamation of coastal acidic-salt affected soil. Biochar 2020, 2, 107–120. [Google Scholar] [CrossRef] [Green Version]
  3. You, X.; Yin, S.; Suo, F.; Xu, Z.; Chu, D.; Kong, Q.; Zhang, C.; Li, Y.; Liu, L. Biochar and fertilizer improved the growth and quality of the ice plant (Mesembryanthemum crystallinum L.) shoots in a coastal soil of Yellow River Delta, China. Sci. Total Environ. 2021, 775, 144893. [Google Scholar] [CrossRef] [PubMed]
  4. Yang, C.; Sun, J. Soil Salinity Drives the Distribution Patterns and Ecological Functions of Fungi in Saline-Alkali Land in the Yellow River Delta, China. Front. Microbiol. 2020, 11, 594284. [Google Scholar] [CrossRef] [PubMed]
  5. Zaman, M.; Shahid, S.A.; Heng, L. Guideline for Salinity Assessment, Mitigation and Adaptation Using Nuclear and Related Techniques; Springer: Berlin/Heidelberg, Germany, 2018; pp. 45–50. [Google Scholar]
  6. Cui, L.; Li, D.; Wu, Z.; Xue, Y.; Xiao, F.; Zhang, L.; Song, Y.; Li, Y.; Zheng, Y.; Zhang, J.; et al. Effects of Nitrification Inhibitors on Soil Nitrification and Ammonia Volatilization in Three Soils with Different pH. Agronomy 2021, 11, 1674. [Google Scholar] [CrossRef]
  7. Luo, X.; Wang, L.; Liu, G.; Wang, X.; Wang, Z.; Zheng, H. Effects of biochar on carbon mineralization of coastal wetland soils in the Yellow River Delta, China. Ecol. Eng. 2016, 94, 329–336. [Google Scholar] [CrossRef]
  8. Sun, H.; Lu, H.; Chu, L.; Shao, H.; Shi, W. Biochar applied with appropriate rates can reduce N leaching, keep N retention and not increase NH3 volatilization in a coastal saline soil. Sci. Total Environ. 2017, 575, 820–825. [Google Scholar] [CrossRef]
  9. He, K.; He, G.; Wang, C.; Zhang, H.; Xu, Y.; Wang, S.; Kong, Y.; Zhou, G.; Hu, R. Biochar amendment ameliorates soil properties and promotes Miscanthus growth in a coastal saline-alkali soil. Appl. Soil Ecol. 2020, 155, 103674. [Google Scholar] [CrossRef]
  10. Wu, D.; Zhang, Y.; Dong, G.; Du, Z.; Wu, W.; Chadwick, D.; Bol, R. The importance of ammonia volatilization in estimating the efficacy of nitrification inhibitors to reduce N2O emissions: A global meta-analysis. Environ. Pollut. 2021, 271, 116365. [Google Scholar] [CrossRef]
  11. Robinson, A.; Di, H.J.; Cameron, K.C.; Podolyan, A.; He, J. The effect of soil pH and dicyandiamide (DCD) on N2O emissions and ammonia oxidiser abundance in a stimulated grazed pasture soil. J. Soil Sediment 2014, 14, 1434–1444. [Google Scholar] [CrossRef]
  12. Yuan, L.; Chen, X.; Jia, J.; Chen, H.; Shi, Y.; Ma, J.; Liang, C.; Liu, Y.; Xie, H.; He, H.; et al. Stover mulching and inhibitor application maintain crop yield and decrease fertilizer N input and losses in no-till cropping systems in Northeast China. Agric. Ecosyst. Environ. 2021, 312, 107360. [Google Scholar] [CrossRef]
  13. Zhang, J.; Wang, J.; Müller, C.; Cai, Z. Ecological and practical significances of crop species preferential N uptake matching with soil N dynamics. Soil Boil. Biochem. 2016, 103, 63–70. [Google Scholar] [CrossRef]
  14. Xie, W.; Wu, L.; Zhang, Y.; Wu, T.; Li, X.; Ouyang, Z. Effects of straw application on coastal saline topsoil salinity and wheat yield trend. Soil Tillage Res. 2017, 169, 1–6. [Google Scholar] [CrossRef]
  15. Kumar, V.; Wagenet, R.J. Salt effects on urea hydrolysis and nitrification during leaching through laboratory soil columns. Plant Soil 1985, 85, 219–227. [Google Scholar] [CrossRef]
  16. Rao, D.L.N.; Batra, L. Ammonia volatilization from applied nitrogen in alkali soils. Plant Soil 1983, 70, 219–228. [Google Scholar] [CrossRef]
  17. Van Hoorna, J.W.; Katerji, N.; Hamdy, A.; Mastrorilli, M. Effect of salinity on yield and nitrogen uptake of four grain legumes and on biological nitrogen contribution from the soil. Agric. Water Manag. 2001, 51, 87–98. [Google Scholar] [CrossRef]
  18. Nan, M.; Xiuzhi, Z.; Xinqi, W.; Chang, P.; Hongjun, G.; Ping, Z.; Yan, G. Effects of 40 years applications of inorganic and organic fertilization on soil bacterial community in a maize agroecosystem in northeast China. Eur. J. Agron. 2021, 130, 126332. [Google Scholar]
  19. Kumar, A.; Bhattacharya, T.; Mukherjee, S.; Sarkar, B. A perspective on biochar for repairing damages in the soil–plant system caused by climate change-driven extreme weather events. Biochar 2022, 4, 22. [Google Scholar] [CrossRef]
  20. Tauqeer, H.M.; Basharat, Z.; Adnan Ramzani, P.M.; Farhad, M.; Lewinska, K.; Turan, V.; Karczewska, A.; Khan, S.A.; Faran, G.E.; Iqbal, M. Aspergillus niger-mediated release of phosphates from fish bone char reduces Pb phytoavailability in Pb-acid batteries polluted soil, and accumulation in fenugreek. Environ. Pollut. 2022, 313, 120064. [Google Scholar] [CrossRef]
  21. Rasool, B.; Mahmood-ur, R.; Zubair, M.; Khan, M.A.; Ramzani, P.M.A.; Dradrach, A.; Turan, V.; Iqbal, M.; Khan, S.A.; Tauqeer, H.M.; et al. Synergetic Efficacy of Amending Pb-Polluted Soil with P-Loaded Jujube (Ziziphus mauritiana) Twigs Biochar and Foliar Chitosan Application for Reducing Pb Distribution in Moringa Leaf Extract and Improving Its Anti-cancer Potential. Water Air Soil Pollut. 2022, 233, 344. [Google Scholar] [CrossRef]
  22. Beusch, C.; Melzer, D.; Cierjacks, A.; Kaupenjohann, M. Amending a tropical Arenosol: Increasing shares of biochar and clay improve the nutrient sorption capacity. Biochar 2022, 4, 16. [Google Scholar] [CrossRef]
  23. Cayuela, M.L.; van Zwieten, L.; Singh, B.P.; Jeffery, S.; Roig, A.; Sánchez-Monedero, M.A. Biochar’s role in mitigating soil nitrous oxide emissions: A review and meta-analysis. Agric. Ecosyst. Environ. 2014, 191, 5–16. [Google Scholar] [CrossRef]
  24. Cui, Q.; Xia, J.B.; Yang, H.J.; Liu, J.T.; Shao, P.S. Biochar and effective microorganisms promote Sesbania cannabina growth and soil quality in the coastal saline-alkali soil of the Yellow River Delta, China. Sci. Total Environ. 2021, 756, 143801. [Google Scholar] [CrossRef]
  25. Yang, L.; Zhang, L.; Geisseler, D.; Wu, Z.; Gong, P.; Xue, Y.; Yu, C.; Juan, Y.; Horwath, W.R. Available C and N affect the utilization of glycine by soil microorganisms. Geoderma 2016, 283, 32–38. [Google Scholar] [CrossRef]
  26. Bilen, S.; Turan, V. Enzymatic Analyses in Soils. In Practical Handbook on Agricultural Microbiology; Amaresan, N., Patel, P., Amin, D., Eds.; Humana: New York, NY, USA, 2022; pp. 377–385. [Google Scholar]
  27. Shrivastava, P.; Kumar, R. Soil salinity: A serious environmental issue and plant growth promoting bacteria as one of the tools for its alleviation. Saudi J. Biol. Sci. 2015, 22, 123–131. [Google Scholar] [CrossRef] [Green Version]
  28. Geisseler, D.; Scow, K.M. Long-term effects of mineral fertilizers on soil microorganisms—A review. Soil Boil. Biochem. 2014, 75, 54–63. [Google Scholar] [CrossRef]
  29. Turan, V.; Aydın, S.; Sönmez, O. Production, Cost Analysis, and Marketing of Bioorganic Liquid Fertilizers and Plant Nutrition Enhancers. In Industrial Microbiology Based Entrepreneurship. Microorganisms for Sustainability; Amaresan, N., Dharumadurai, D., Cundell, D.R., Eds.; Springer: Singapore, 2022; Volume 42, pp. 193–198. [Google Scholar]
  30. Ma, Q.; Wu, L.; Wang, J.; Ma, J.; Zheng, N.; Hill, P.W.; Chadwick, D.R.; Jones, D.L. Fertilizer regime changes the competitive uptake of organic nitrogen by wheat and soil microorganisms: An in-situ uptake test using 13C, 15N labelling, and 13C-PLFA analysis. Soil Boil. Biochem. 2018, 125, 319–327. [Google Scholar] [CrossRef]
  31. Xu, N.; Tan, G.; Wang, H.; Gai, X. Effect of biochar additions to soil on nitrogen leaching, microbial biomass and bacterial community structure. Eur. J. Soil Biol. 2016, 74, 1–8. [Google Scholar] [CrossRef]
  32. Zhang, Y.; Xie, H.; Wang, F.; Sun, C.; Zhang, X. Effects of biochar incorporation on soil viable and necromass carbon in the luvisol soil. Soil Use Manag. 2021, 38, 318–330. [Google Scholar] [CrossRef]
  33. Cui, L.; Li, D.; Wu, Z.; Zhang, L.; Xue, Y.; Gong, P.; Song, Y.; Li, X.; Xiao, F.; Yang, L.; et al. Effects of Combined Nitrification Inhibitors on Nitrogen Transformation, Maize Yield and Nitrogen Uptake in Two Different Soils. Commun. Soil Sci. Plant Anal. 2022, 53, 1039–1049. [Google Scholar] [CrossRef]
  34. Du, Z.-L.; Zhao, J.-K.; Wang, Y.-D.; Zhang, Q.-Z. Biochar addition drives soil aggregation and carbon sequestration in aggregate fractions from an intensive agricultural system. J. Soil Sediment 2016, 17, 581–589. [Google Scholar] [CrossRef]
  35. Hossain, M.Z.; Bahar, M.M.; Sarkar, B.; Donne, S.W.; Ok, Y.S.; Palansooriya, K.N.; Kirkham, M.B.; Chowdhury, S.; Bolan, N. Biochar and its importance on nutrient dynamics in soil and plant. Biochar 2020, 2, 379–420. [Google Scholar] [CrossRef]
  36. Li, J.; Shi, Y.; Luo, J.; Zaman, M.; Houlbrooke, D.; Ding, W.; Ledgard, S.; Ghani, A. Use of nitrogen process inhibitors for reducing gaseous nitrogen losses from land-applied farm effluents. Biol. Fert. Soils 2013, 50, 133–145. [Google Scholar] [CrossRef]
  37. Laird, D.; Fleming, P.; Wang, B.; Horton, R.; Karlen, D. Biochar impact on nutrient leaching from a Midwestern agricultural soil. Geoderma 2010, 158, 436–442. [Google Scholar] [CrossRef] [Green Version]
  38. Rondon, M.A.; Lehmann, J.; Ramírez, J.; Hurtado, M. Biological nitrogen fixation by common beans (Phaseolus vulgaris L.) increases with bio-char additions. Biol. Fert. Soils 2006, 43, 699–708. [Google Scholar] [CrossRef]
  39. Lehmann, J.; Rillig, M.C.; Thies, J.; Masiello, C.A.; Hockaday, W.C.; Crowley, D. Biochar effects on soil biota—A review. Soil Boil. Biochem. 2011, 43, 1812–1836. [Google Scholar] [CrossRef]
  40. Zhang, A.; Liu, Y.; Pan, G.; Hussain, Q.; Li, L.; Zheng, J.; Zhang, X. Effect of biochar amendment on maize yield and greenhouse gas emissions from a soil organic carbon poor calcareous loamy soil from Central China Plain. Plant Soil 2011, 351, 263–275. [Google Scholar] [CrossRef]
  41. Rasul, M.; Cho, J.; Shin, H.S.; Hur, J. Biochar-induced priming effects in soil via modifying the status of soil organic matter and microflora: A review. Sci. Total Environ. 2022, 805, 150304. [Google Scholar] [CrossRef]
  42. Song, Y.; Zhang, X.; Ma, B.; Chang, S.X.; Gong, J. Biochar addition affected the dynamics of ammonia oxidizers and nitrification in microcosms of a coastal alkaline soil. Biol. Fert. Soils 2013, 50, 321–332. [Google Scholar] [CrossRef]
  43. Nguyen, T.T.N.; Xu, C.-Y.; Tahmasbian, I.; Che, R.; Xu, Z.; Zhou, X.; Wallace, H.M.; Bai, S.H. Effects of biochar on soil available inorganic nitrogen: A review and meta-analysis. Geoderma 2017, 288, 79–96. [Google Scholar] [CrossRef] [Green Version]
  44. Zhao, W.; Zhou, Q.; Tian, Z.; Cui, Y.; Liang, Y.; Wang, H. Apply biochar to ameliorate soda saline-alkali land, improve soil function and increase corn nutrient availability in the Songnen Plain. Sci. Total Environ. 2020, 722, 137428. [Google Scholar] [CrossRef]
  45. Palansooriya, K.N.; Wong, J.T.F.; Hashimoto, Y.; Huang, L.; Rinklebe, J.; Chang, S.X.; Bolan, N.; Wang, H.; Ok, Y.S. Response of microbial communities to biochar-amended soils: A critical review. Biochar 2019, 1, 3–22. [Google Scholar] [CrossRef] [Green Version]
  46. Luo, X.; Liu, G.; Xia, Y.; Chen, L.; Jiang, Z.; Zheng, H.; Wang, Z. Use of biochar-compost to improve properties and productivity of the degraded coastal soil in the Yellow River Delta, China. J. Soil Sediments 2016, 17, 780–789. [Google Scholar] [CrossRef]
  47. Liu, G.M.; Zhang, X.C.; Wang, X.P.; Shao, H.B.; Yang, J.S.; Wang, X.P. Soil enzymes as indicators of saline soil fertility under various soil amendments. Agric. Ecosyst. Environ. 2017, 237, 274–279. [Google Scholar]
  48. Kim, J.S.; Sparovek, G.; Longo, R.M.; De Melo, W.J.; Crowley, D. Bacterial diversity of terra preta and pristine forest soil from the Western Amazon. Soil Boil. Biochem. 2007, 39, 684–690. [Google Scholar] [CrossRef]
  49. Dempster, D.N.; Gleeson, D.B.; Solaiman, Z.M.; Jones, D.L.; Murphy, D.V. Decreased soil microbial biomass and nitrogen mineralisation with Eucalyptus biochar addition to a coarse textured soil. Plant Soil 2011, 354, 311–324. [Google Scholar] [CrossRef]
  50. Zhao, Q.; Bai, J.; Gao, Y.; Zhao, H.; Zhang, G.; Cui, B. Shifts in the soil bacterial community along a salinity gradient in the Yellow River Delta. Land Degrad. Dev. 2020, 31, 2255–2267. [Google Scholar] [CrossRef]
  51. Rath, K.M.; Maheshwari, A.; Rousk, J. Linking Microbial Community Structure to Trait Distributions and Functions Using Salinity as an Environmental Filter. mBio 2019, 10, e01607-19. [Google Scholar] [CrossRef] [Green Version]
  52. Zhao, S.; Liu, J.J.; Banerjee, S.; Zhou, N.; Zhao, Z.Y.; Zhang, K.; Tian, C.Y. Soil pH is equally important as salinity in shaping bacterial communities in saline soils under halophytic vegetation. Sci. Rep. 2018, 8, 4550. [Google Scholar] [CrossRef]
  53. Zhang, L.; Jing, Y.; Chen, C.; Xiang, Y.; Rezaei Rashti, M.; Li, Y.; Deng, Q.; Zhang, R. Effects of biochar application on soil nitrogen transformation, microbial functional genes, enzyme activity, and plant nitrogen uptake: A meta-analysis of field studies. GCB Bioenergy 2021, 13, 1859–1873. [Google Scholar] [CrossRef]
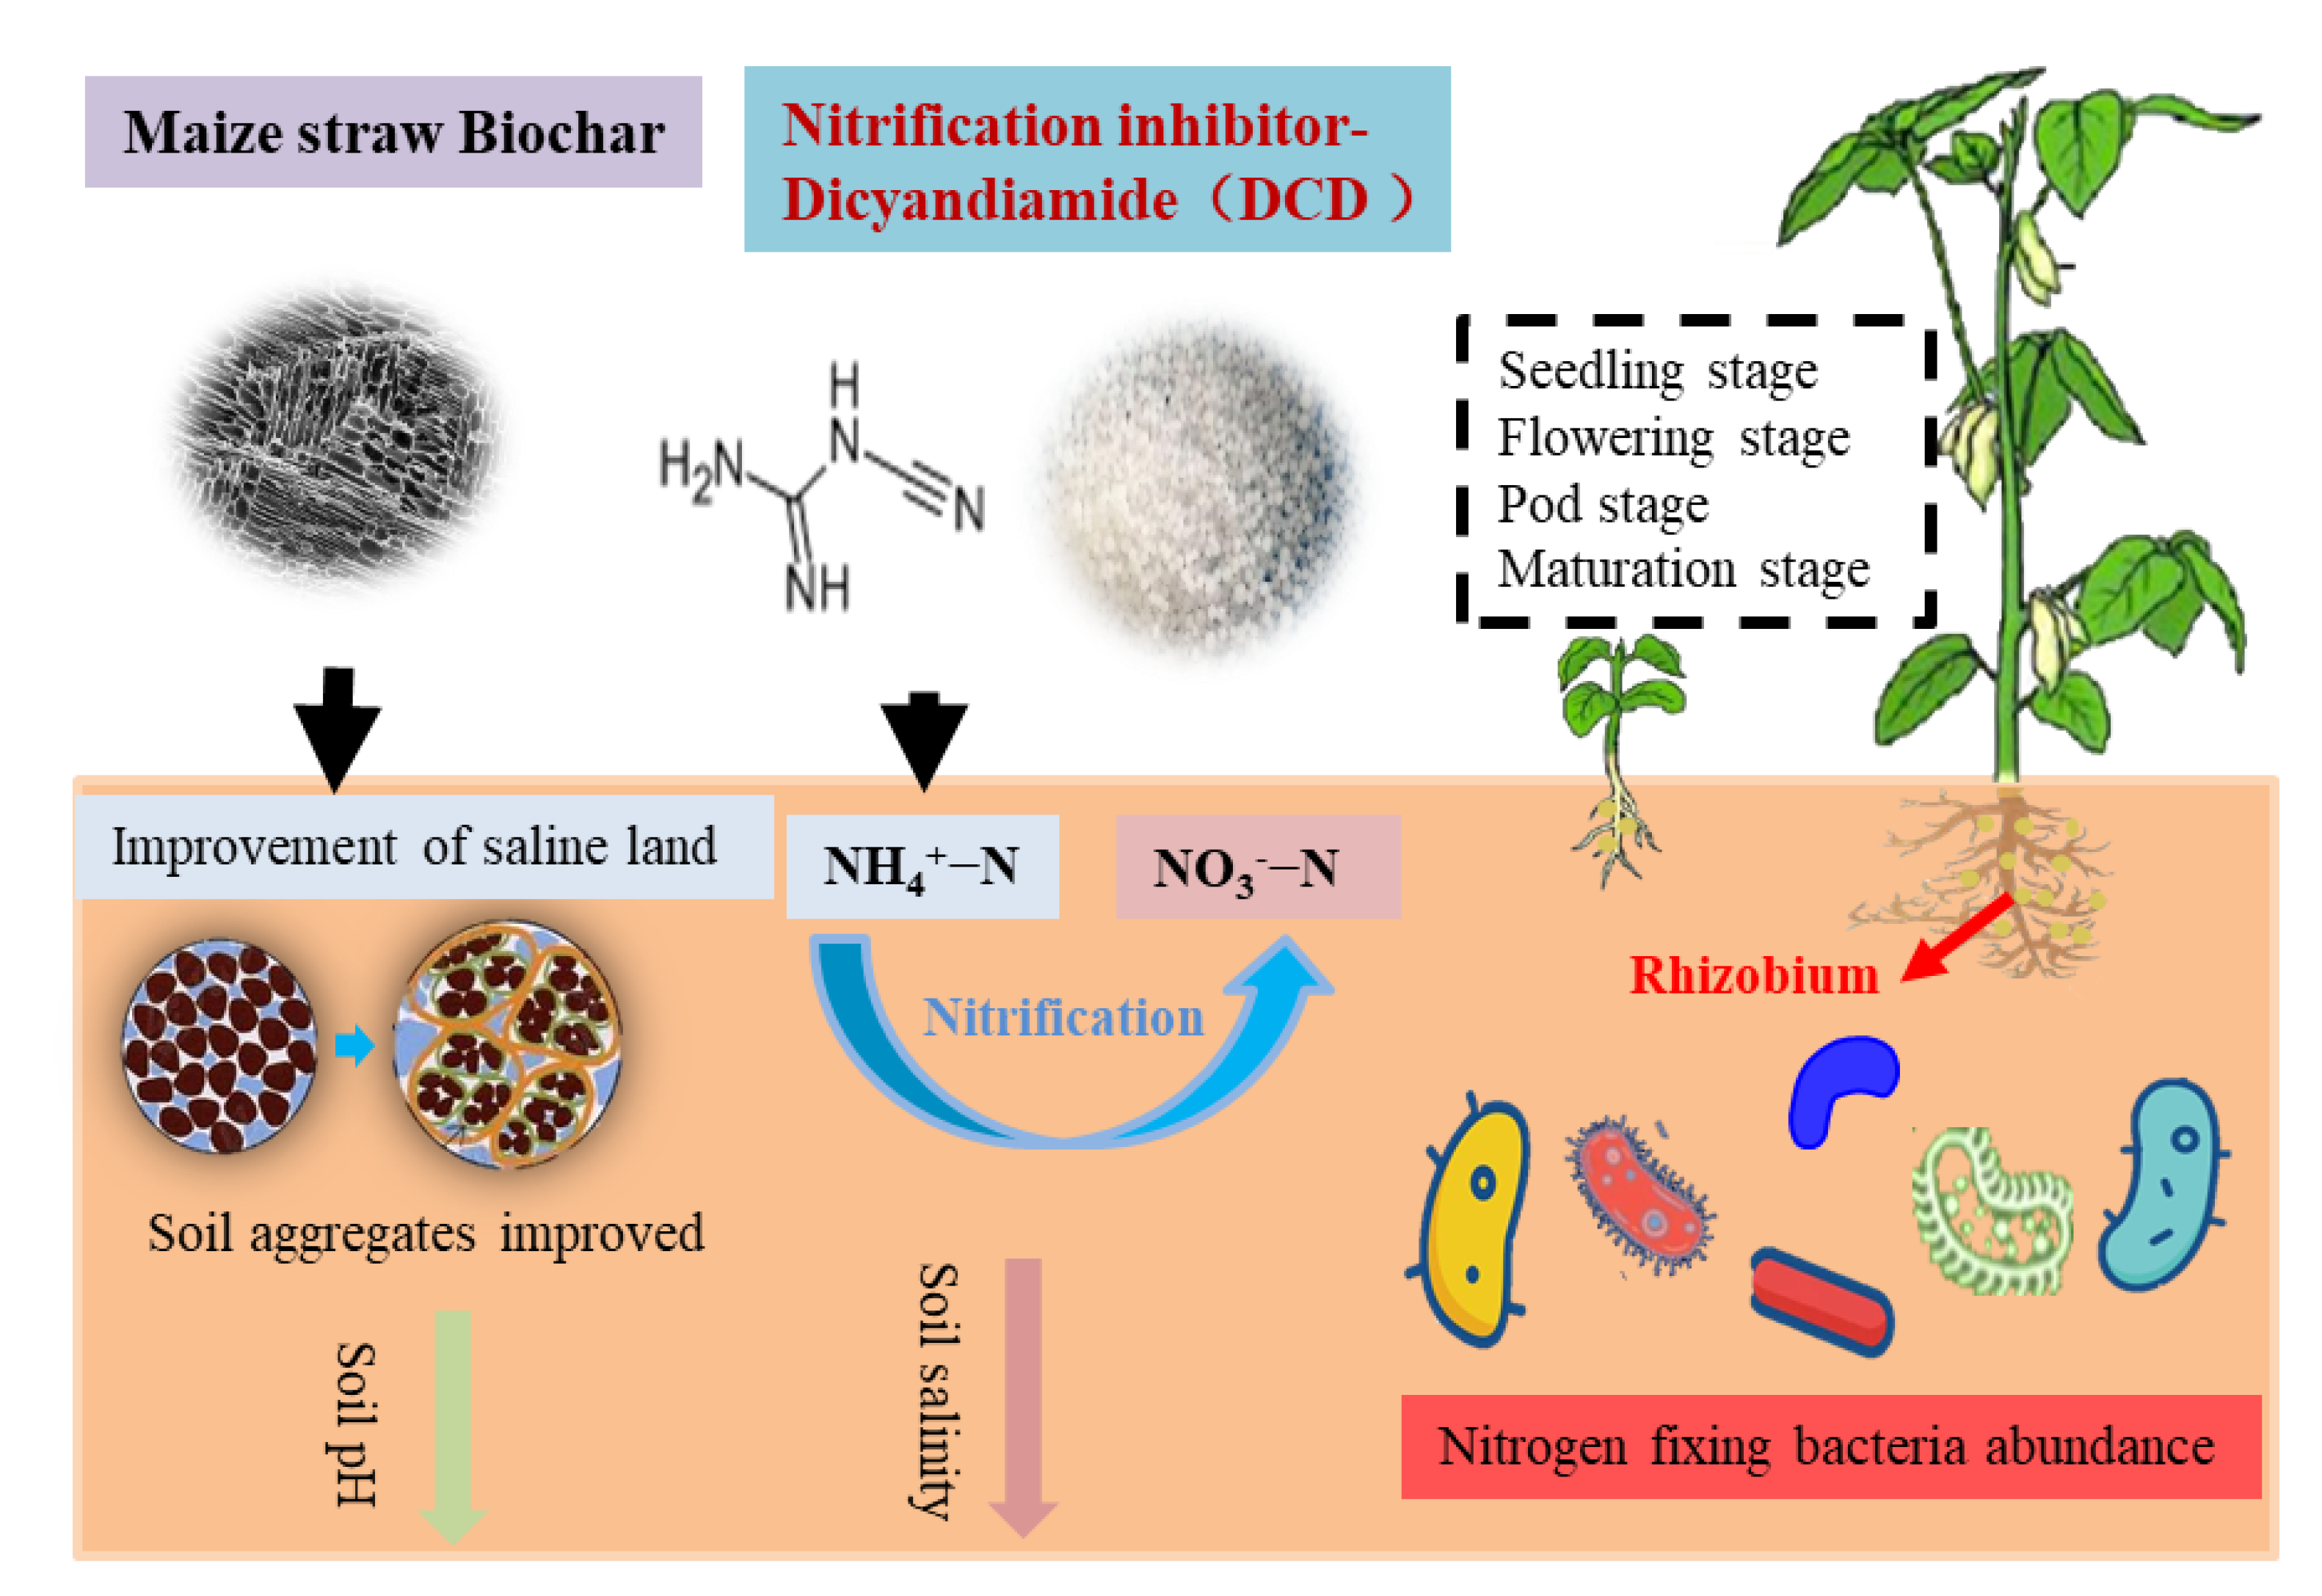
Figure 1. The conceptual model diagram of the effect of biochar and DCD on the soil.
Agronomy 12 03154 g001
Figure 2. Effects of biochar and inhibitor addition on the soil’s ammonium nitrogen, nitrate nitrogen inorganic nitrogen, and apparent nitrification rate. (a) Soil ammonia content; (b) Soil nitrate content; (c) Soil inorganic nitrogen content; (d) Apparent nitrification rate. Small letters in the figure represent the significant difference among treatments in the same period (n = 5, p < 0.05), while uppercase letters represent the significant difference among treatments in different growth periods (n = 5, p < 0.05), the labels in the figure are arranged according to the significant difference at the same time. The same below.
Agronomy 12 03154 g002
Figure 3. Effects of biochar and inhibitor addition on the soil’s pH (a) and the soil’s electrical conductivity (b). Small letters in the figure represent the significant difference among treatments in the same period (n = 5, p < 0.05), while uppercase letters represent the significant difference among treatments in different growth periods (n = 5, p < 0.05).
Agronomy 12 03154 g003
Figure 4. Person correlation analyses between the soil’s basial characters and apparent nitrification rate. (a) The correlation of apparent nitrification rate with soil pH; (b) The correlation of apparent nitrification rate with soil electrical conductivity; (c) The correlation of apparent nitrification rate with soil ammonia nitrogen; (d) The correlation of apparent nitrification rate with soil nitrate nitrogen.
Agronomy 12 03154 g004
Figure 5. Effects of biochar and inhibitor addition on the soil’s aggregates (a) and structural stability (b). Small letters in the figure represent the significant difference among treatments (n = 5, p < 0.05).
Agronomy 12 03154 g005
Figure 6. Effects of biochar and inhibitor addition on yield, biomass, and economic indicators. (a) The soybean yield; (b) Hundred-grain weight of soybean; (c) Air-dried straw weight; (d) Above-ground biomass; (e) Fertilizer yield contribution rate; (f) Economic coefficient. Small letters of a-c in the figure represent the significant difference among treatments at the maturation stage (n = 5, p < 0.05).
Agronomy 12 03154 g006
Figure 7. The relative abundance of phylum-level in soil bacteria.
Agronomy 12 03154 g007
Figure 8. The Lefse diagram indicates and the VEEN diagram of species distribution.
Agronomy 12 03154 g008
Figure 9. Redundancy analysis (RDA) among the soil’s properties and bacterial community (a) and explanatory factor analysis (b). The red line in figure a represents environmental factors and the blue one represents bacterial species. GMD: Geometric mean diameter; MMD: Mean mass diameter. The * in Figure 9b represents the significant influence at p < 0.05.
Agronomy 12 03154 g009
Table 1. Comparison of α-diversity indices and read numbers under different treatments at a genetic distance of 3%.
TreatmentRead Numbers (×104)OTUShannonSimpsonChaoAce
CK8.56 ± 0.78a501.5 ± 157.83a2.78 ± 0.32a0.66 ± 0.04a507.02 ± 102.89a514.12 ± 87.56a
N8.46 ± 0.15a528 ± 87.9a2.4 ± 0.56a0.57 ± 0.07a578.43 ± 83.03a592.58 ± 79.17a
B9.03 ± 0.76a449.25 ± 68.78a2.45 ± 0.31a0.61 ± 0.04a505.71 ± 71.43a513.63 ± 70.54a
D8.56 ± 0.45a491.5 ± 72.8a2.38 ± 0.36a0.57 ± 0.04a557.3 ± 80.06a563.77 ± 81.64a
BD8.45 ± 0.35a451.25 ± 69.07a2.5 ± 0.25a0.6 ± 0.07a521.16 ± 53.21a525.09 ± 61.65a
Note: CK: no nitrogen and biochar; N: formula NPK; D: urea with DCD; B: urea with biochar; BD: urea with DCD and biochar, respectively. Duncan’s method was used to analyze the difference in significance between treatments (n = 4). Small letters in the table represent the significant difference among treatments (n = 4, p < 0.05).
Publisher’s Note: MDPI stays neutral with regard to jurisdictional claims in published maps and institutional affiliations.