Article

Seasonal and Soil Use Dependent Variability of Physical and Hydraulic Properties: An Assessment under Minimum Tillage and No-Tillage in a Long-Term Experiment in Southern Italy

1
Department of Soil, Plant and Food Sciences, University of Bari Aldo Moro, Via Amendola 165/A, 70126 Bari, Italy
2
Council for Agricultural Research and Economics-Research Center for Agriculture and Environment (CREA-AA), Via C. Ulpiani 5, 70125 Bari, Italy
3
Water Research Institute (IRSA)—National Research Council (CNR), Viale Francesco de Blasio 5, 70132 Bari, Italy
*
Authors to whom correspondence should be addressed.
Agronomy 2022, 12(12), 3142; https://doi.org/10.3390/agronomy12123142
Submission received: 28 October 2022 / Revised: 1 December 2022 / Accepted: 8 December 2022 / Published: 10 December 2022

Abstract

:
Defining the optimal sampling time across the growing season is crucial to standardize sampling protocols for soil physical status monitoring and to achieve comparable results under different experimental conditions and on different sites. In this study, the seasonal variability of soil physical and hydraulic properties under two conservative soil management strategies, minimum tillage and no-tillage, was evaluated in a long-term field experiment. On two sampling dates, autumn 2021 and summer 2022, soil bulk density (BD) and volumetric soil water content at the time of the experiments (θi) were measured in each experimental unit and Beerkan infiltration experiments were performed. The soil water retention curve and the hydraulic conductivity function were then estimated using the Beerkan estimation of soil transfer parameters (BEST) methodology. In this way, the saturated hydraulic conductivity (Ks) and a set of capacitive indicators—plant available water capacity (PAWC), soil macroporosity (PMAC), air capacity (AC) and relative field capacity (RFC)—were obtained. Results underlined the role of soil moisture conditions as a main factor affecting variability in soil physical properties. Different soil moisture under autumn and summer samplings significantly affected BD (1.0093 and 1.1905 g cm−3, respectively, in autumn and summer) and Ks (0.0431 and 0.0492 mm s−1). Relationships observed between BEST-derived variables, such as PMAC (or AC) and RFC, and measured variables, such as BD, showed consistent results, with increases in PMAC to BD decreases. However, a comparison of capacity-based indicators obtained by BEST with those obtained from measured soil water retention curves, in a previous year but under comparable soil conditions, highlighted some discrepancies. This finding drives the focus towards the need to use more robust datasets deriving from experimental measurements or from coupling information obtained from measured and estimated data. Finally, this study provided further evidence that, in the long-term field experiment investigated, the two soil management systems allowed keeping the values of key soil physical quality indicators, such as bulk density and saturated hydraulic conductivity, within the optimal or near- optimal reference ranges.

1. Introduction

In 2020, the Food and Agriculture Organization of the United Nations (FAO) published the first version of its “Protocol for the Assessment of Sustainable Soil Management” (FAO, 2020). In practice, the protocol lists several key indicators and a set of tools to assess soil functions based on its physical, chemical and biological properties [1]. The protocol is defined as “a fundamental tool to assess if any intervention implemented in the field, such as improvement of productive systems, innovation and new technologies, ecosystem restoration and carbon sequestration, is carried out in a sustainable manner according to the definition of sustainable soil management” [1]. Therefore, it could be taken into due account for agro-environmental investigations. Among the “physical” indicators for sustainable soil management, the bulk density of the soil was primarily mentioned, as it can account for the changes in soil structure, porosity and compaction, and indicate how readily water, air and plant roots can move through the soil. However, when soil degradation is caused by specific and identified threats, additional indicators are needed to more specifically assess the impact of the implemented management practices, including the plant-available water capacity, infiltration rate and penetration resistance of the soil. Overall, measurements collected directly in the field were mentioned as suitable to reflect the real physical conditions of the soil. In this view, it is important to identify the time of the year in which evaluations, or comparisons, are made, because the seasonal variability in the soil’s physical and hydraulic properties is a key factor for a reliable assessment of sustainable soil management.
Knowledge of the seasonal variability in the soil’s physical and hydraulic properties is important (or even essential) for crop modelling or to evaluate the sustainability of cropping systems. However, it is relatively expensive both in terms of costs and experimental efforts. The main reason lies in the fact that, for a given sampling date, several measurements are required to consider the spatial variability of the field [2,3]. Consequently, such reasons have stimulated the scientific community to propose new measurement techniques, or substantially improve those that are already well known, to share relatively accurate, quick and inexpensive tools for soil hydraulic characterization [4].
In general, several researchers (including agronomists, hydrologists, etc.) could be interested in establishing the presence of seasonal variability in soil properties to adequately simulate the growth cycle of crops, or for soil water optimization [5]. For this purpose, multiple measurement dates should be planned at specific growth stages of the crops [6,7,8,9]. A further interest could be linked to the evaluation of the temporal stability of soil properties. In particular, for a given stage of a crop cycle (or for a given month of the year when crops are not in place), soil properties can change over time due to the different soil status, and soil moisture can be counted as one of the main factors in soil properties variability over time [10]. Therefore, insights into this topic can assume relevance when aimed at evaluating the soil property modifications as the boundary conditions change.
The Beerkan estimation of soil transfer parameters (BEST) procedure pioneered by Lassabatère et al. [11] allows the estimation of the hydraulic functions of the soil, i.e., water retention curve (WRC) and hydraulic conductivity function (HCF) with a simple Beerkan-infiltration experiment under saturated soil conditions (i.e., cumulative infiltration), and the determination of soil particle-size distribution (PSD), soil bulk density (BD), as well as the volumetric water content of the soil at the time of infiltration (θi). The BEST-procedure was found to be quite accurate for estimating the main properties of the soil (WRC-HCF) [12] and, overall, to be suitable for applications aimed at investigating the impact of soil management on WRC-HCF changes, or to evaluate the spatial-temporal variability of several agricultural systems [13]. Therefore, it can be usefully applied with the aim of performing multiple samplings in space and time. For instance, Castellini et al. [2] first applied BEST for the spatialization of soil hydraulic properties, and then to investigate the relationships between soil properties and wheat yield at the field scale. This allows us to improve agricultural resources allocation (water, fertilizers, etc.) to optimize crop yield.
No-tillage and minimum tillage (NT and MT, respectively) are soil management systems currently valued as low-impact agro-environmental alternatives (by, among others, Rinaldi et al. [14], Veresoglou et al. [15], Wardak et al. [16], and Ferrara et al. [17]). However, although soil tillage represents the major source of soil structure modification [18], the physical and hydraulic changes in soil properties also depend on variations between the precipitation regimes (variability in soil moisture), temperature, agricultural management (i.e., post-tillage structural evolution, plant root growth, microbial activity, organic input), timing of sampling, etc. Therefore, measurement of the physical and hydraulic properties of the soil should be repeated over time to consider soil structural changes, environmental influences [19] and biophysical feedbacks [20].
The main objective of this investigation was to develop a robust field data set across two seasons to investigate the spatial and temporal variability of some main physical and hydraulic soil properties in a typical Mediterranean agro-environment. Specific goals of this study were: (i) to detect possible summer–autumn temporal variability in physical and hydraulic soil properties, and (ii) to quantify the impact of different soil managements, i.e. minimum tillage and no-tillage, that were repeatedly applied over time under a long-term field experiment.

2. Materials and Methods

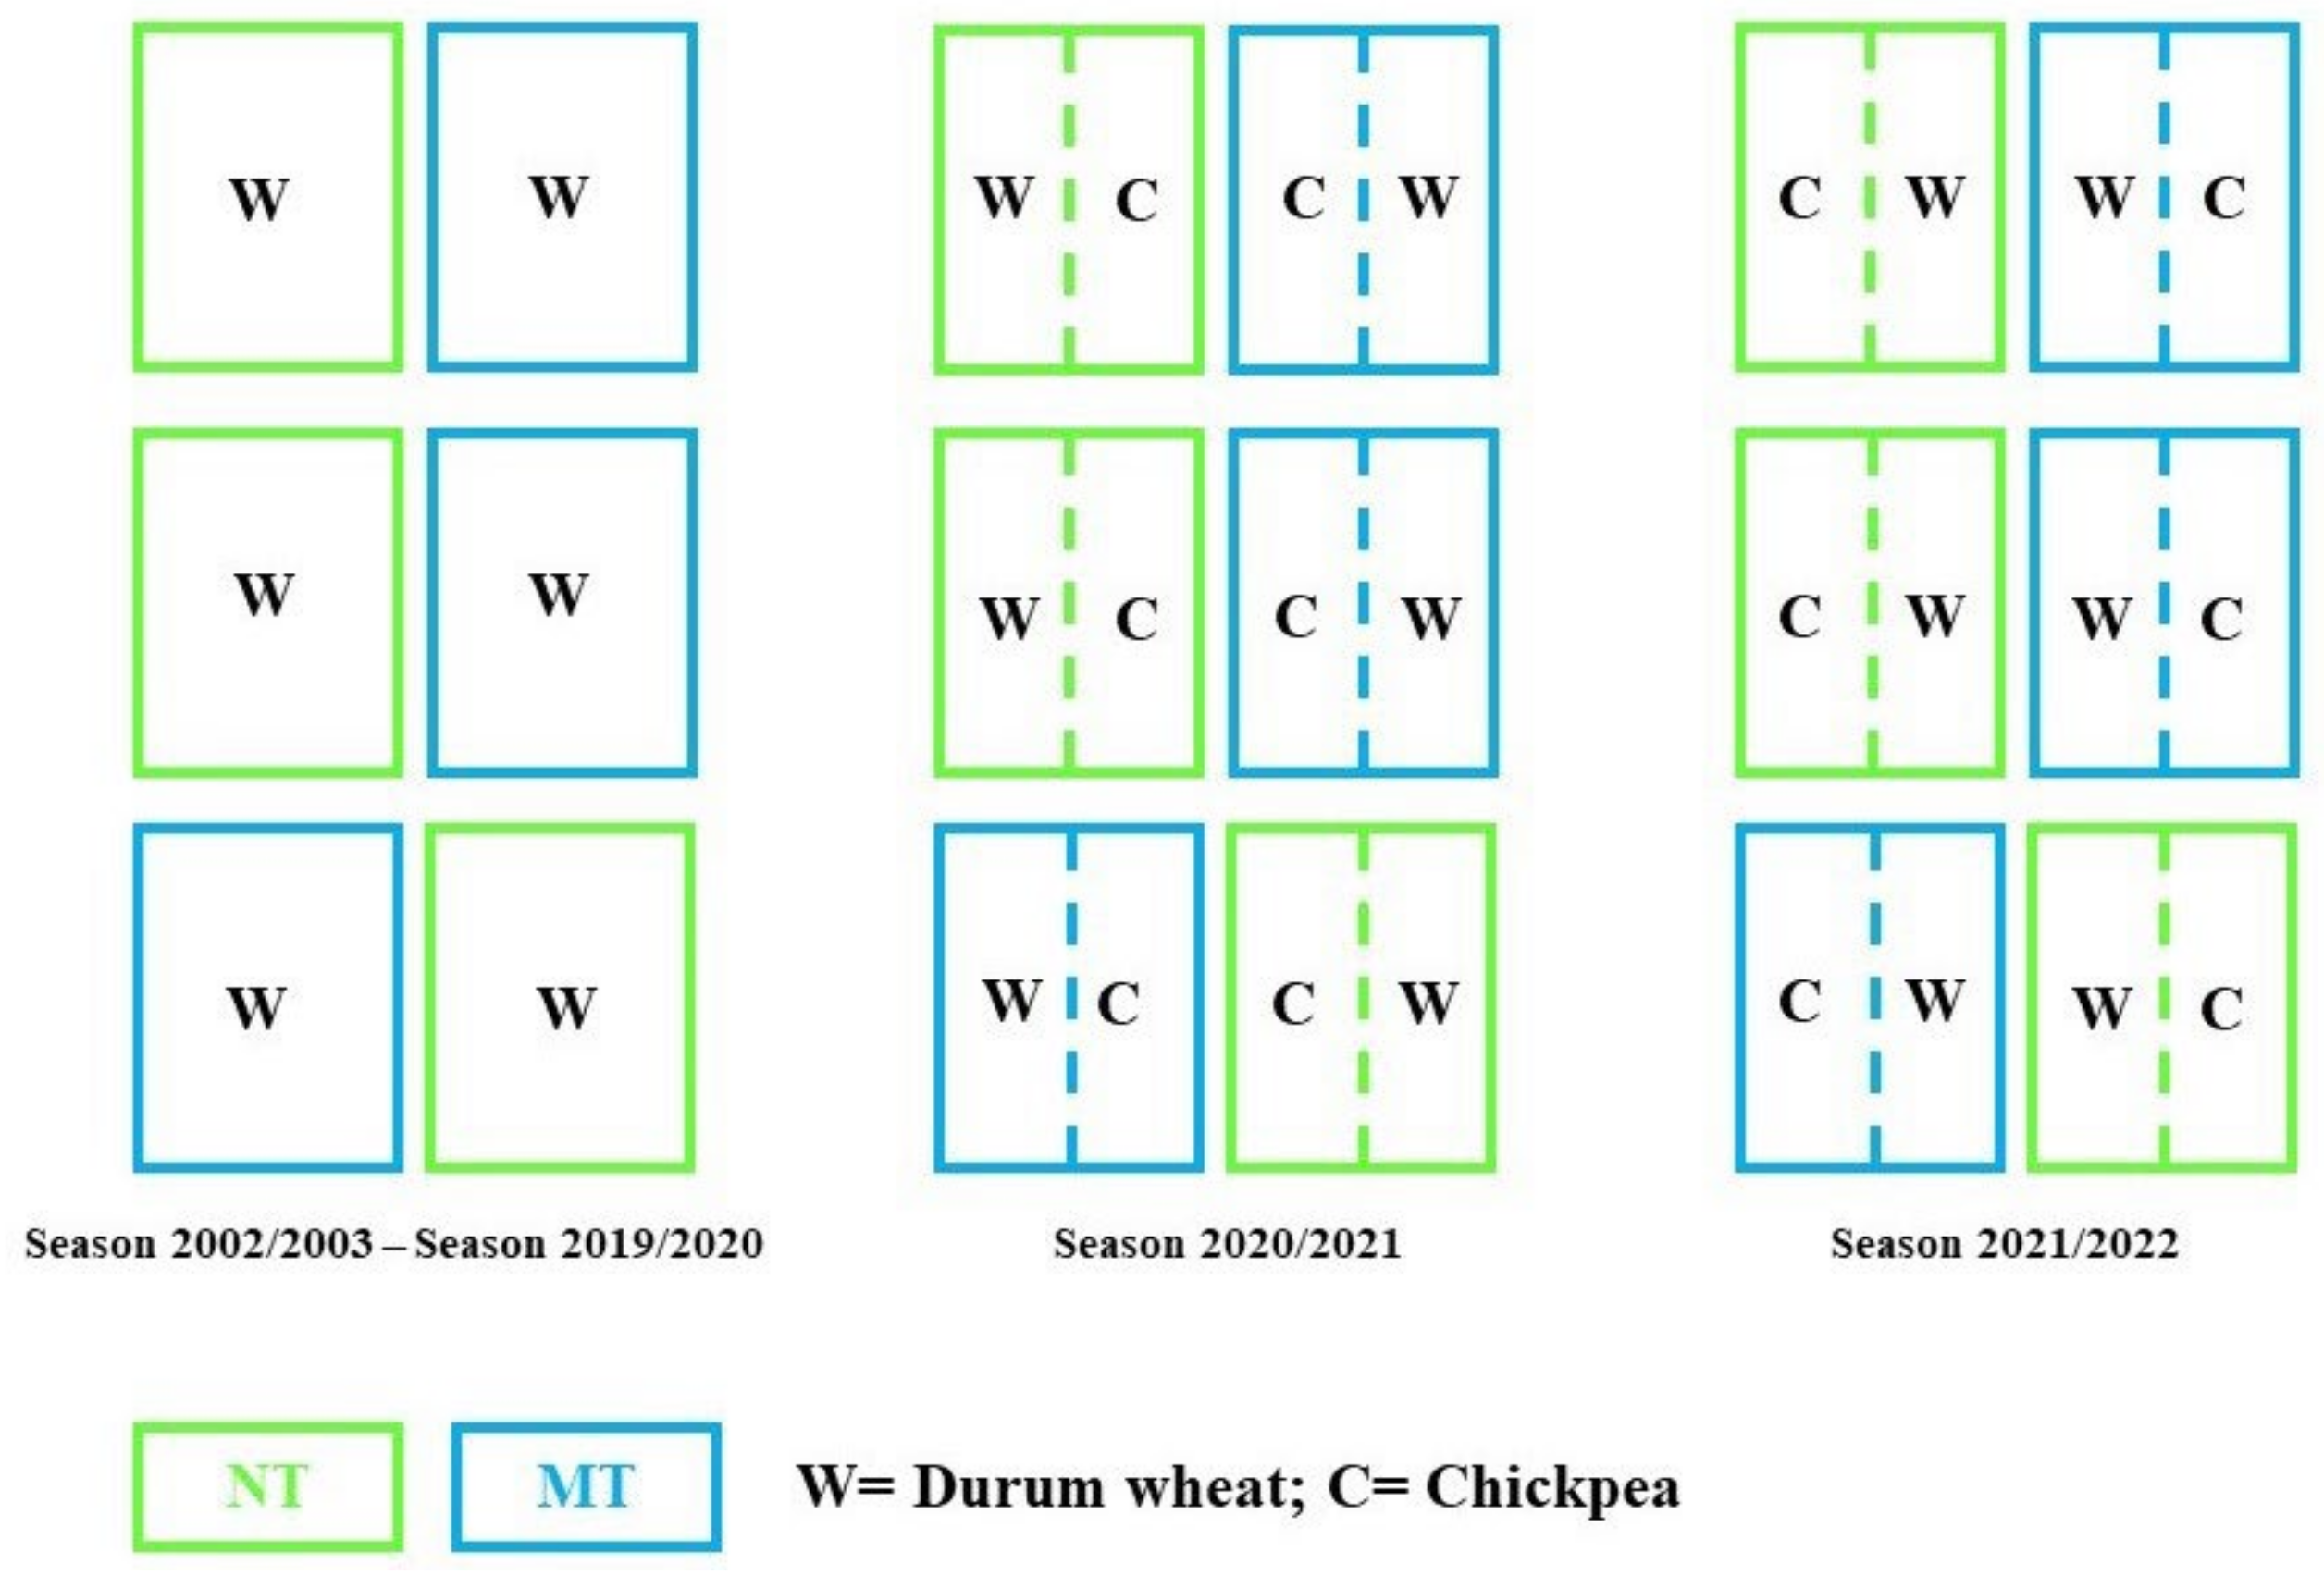
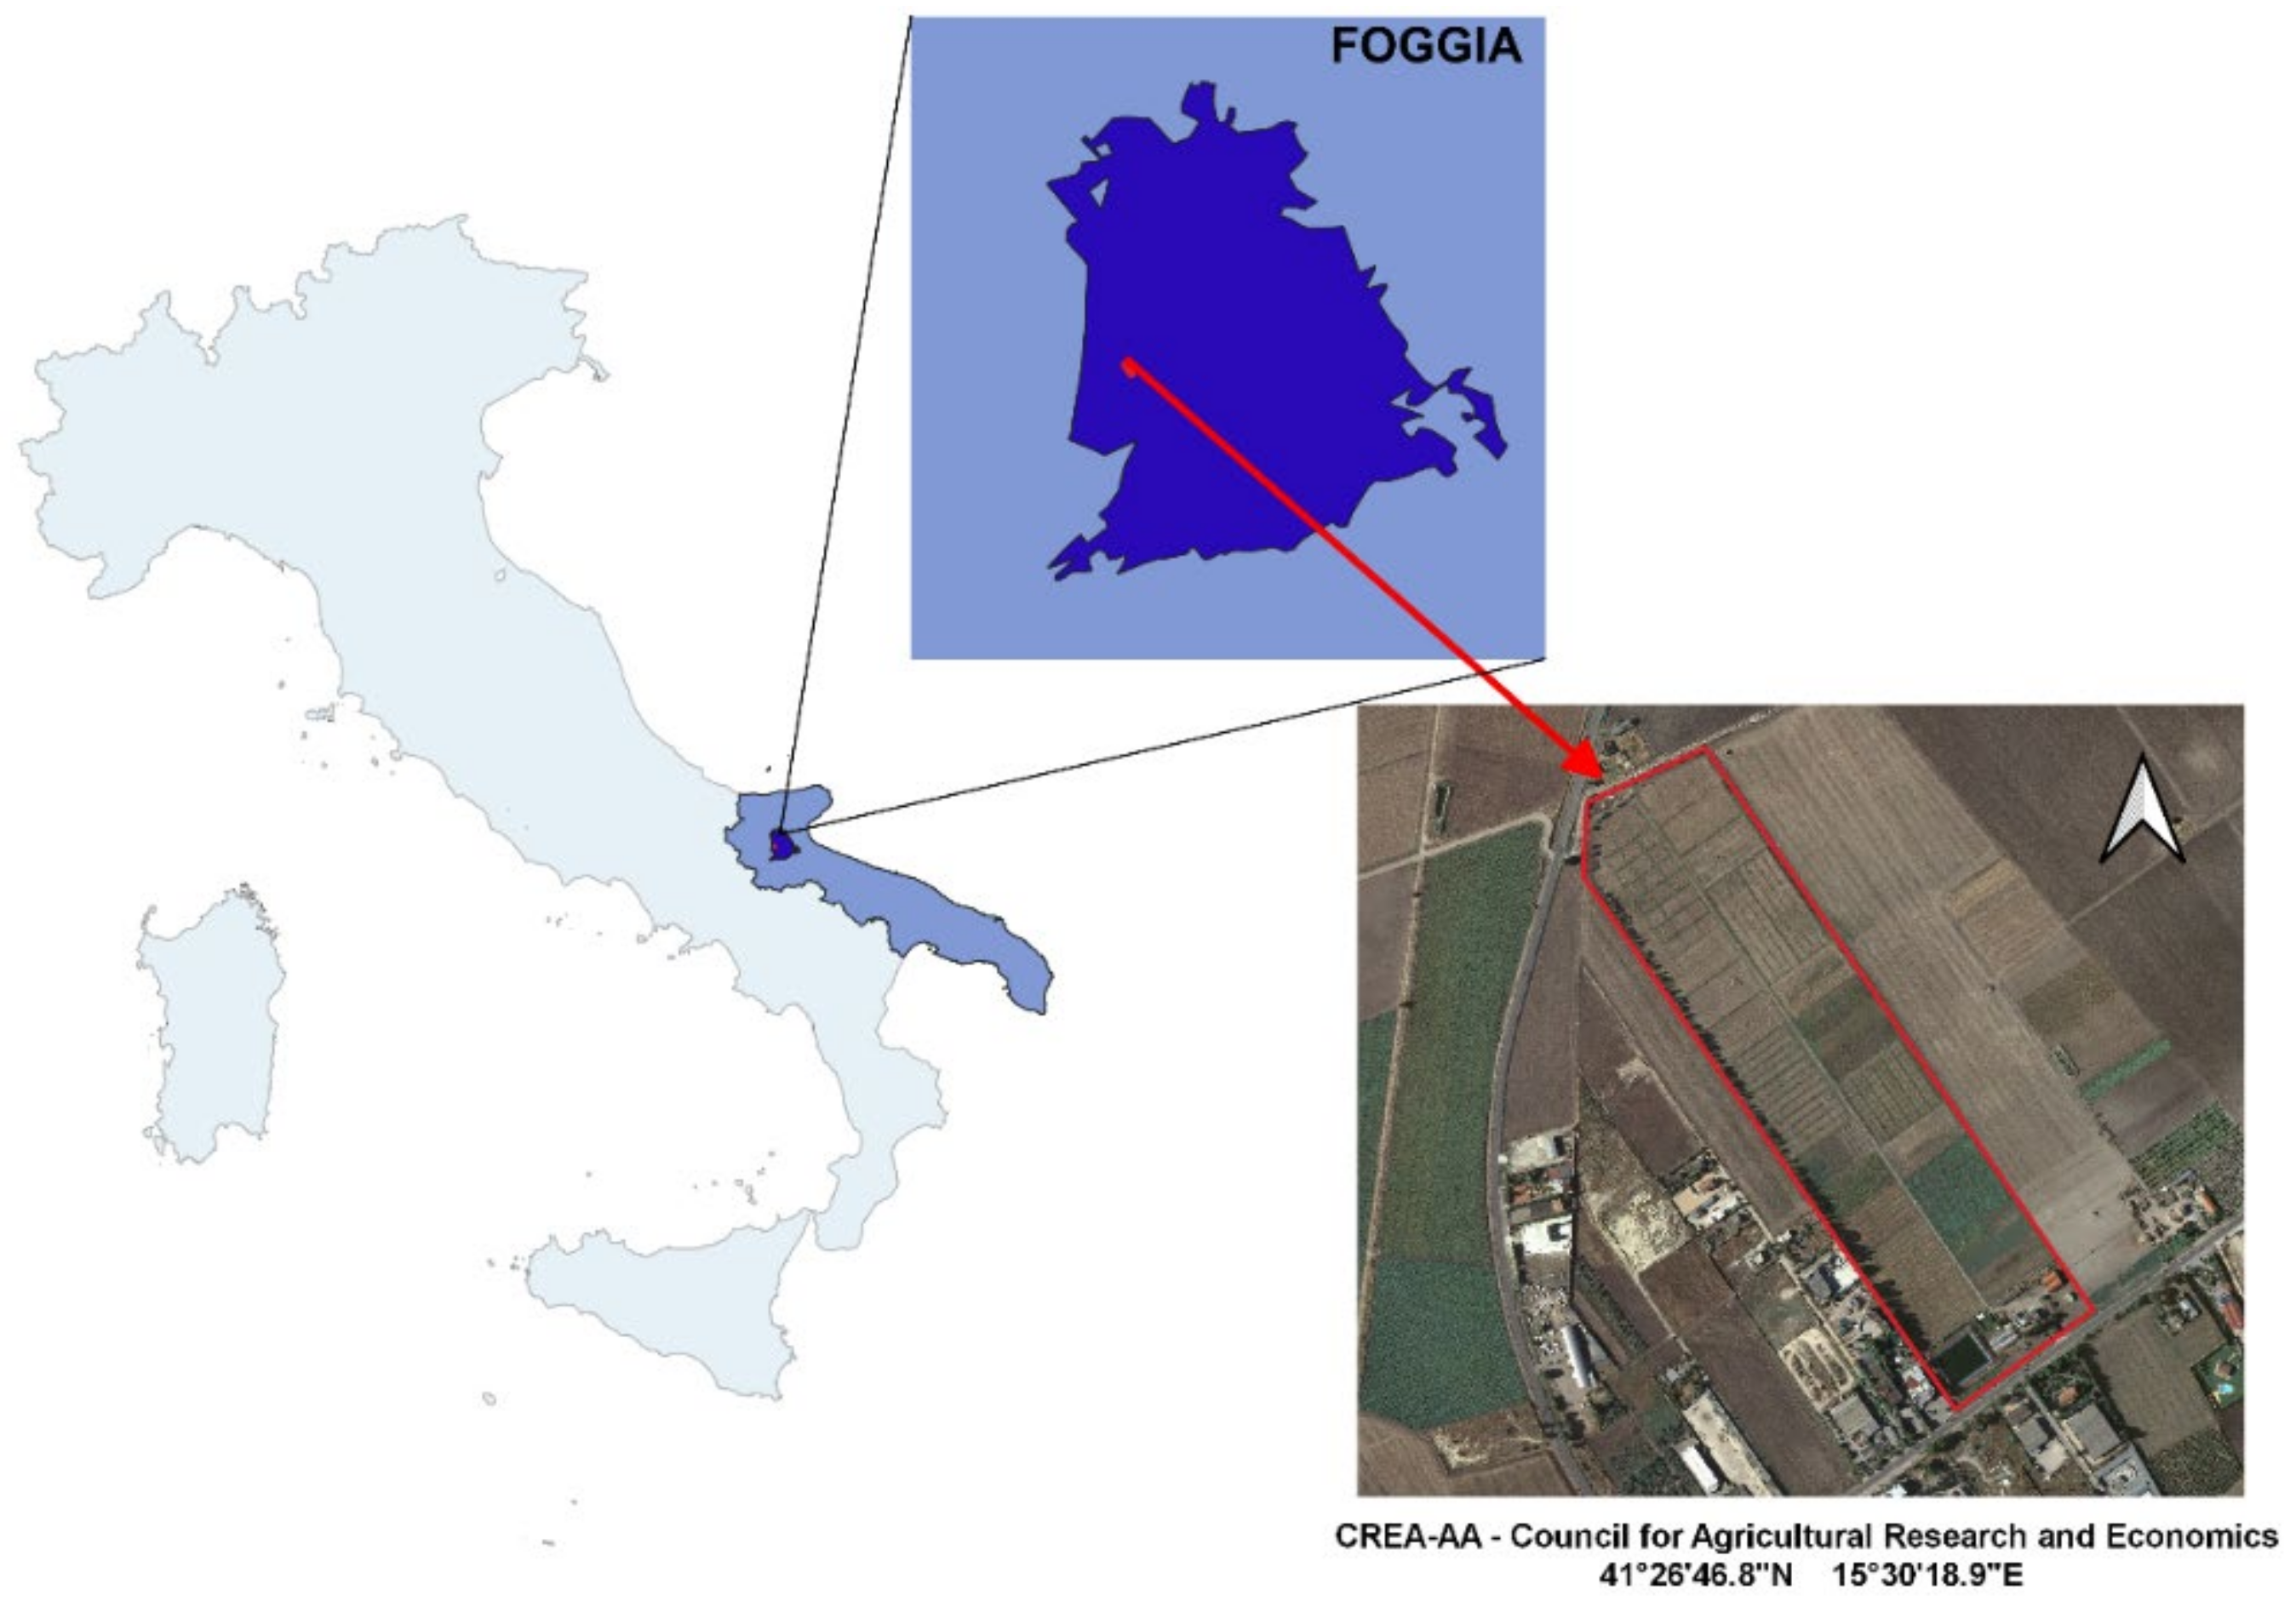
2.1. Experimental Site

The study was carried out at the experimental farm of the Council for Agricultural Research and Economics (CREA-AA), Foggia (Figure 1), in a long-term field experiment performed on a monoculture of durum wheat (Triticum turgidum subsp. durum Desf.) and on a rotation with leguminous. According to USDA classification, the soil texture is clay, with 42.7% and 27.7% of clay and silt, respectively. The climate of the area is “accentuated thermo-Mediterranean” [21], with annual rainfall mostly concentrated during the autumn–winter months (mean 550 mm over a 50-year period 1965–2015) [22].
From the 2002–2003 to the 2019–2020 growing season, a monoculture of durum wheat (namely, 18 consecutive growing seasons) was performed to compare the effects of two different soil management practices, minimum tillage (MT) and no-tillage (NT). The treatments were compared in a randomized complete block design (RCBD) with three replicates and unit plots of 500 m2. Subsequently, from 2020–2021, each plot of the RCBD was split into two subplots (250 m2 size), where wheat was cropped in rotation with chickpea. In this new experimental design, soil management (MT and NT) was considered as the main-plot factor, while the crop was the subplot factor. Durum wheat and chickpea were sown during December 2020 and March 2021, respectively. In the following year (the 2021–2022 growing season), crop rotation was managed by replacing wheat with legumes (chickpea) and vice versa. The experimental design used over the years is schematized in Figure 2.
MT consists of a two-layer soil tillage at a 35–40 cm depth through a chisel and at 10–15 cm through a rotary tiller combination (without the inversion of layers along the soil profile), before the sowing of the crops; in the 2021–2022 growing season, soil tillage was performed in December. Apart from this, NT consists of direct sowing with a special no-till seeder, after a chemical weeding treatment. At the end of each growing season, crop residues remained on the soil surface. All other agronomic techniques (fertilization, pest control and weed management during crop growth) were carried out uniformly for the two soil managements compared. Further information on plot management can be found in Castellini et al. [23].

2.2. Soil Sampling, BEST Procedure Application and Soil Properties Determination

Soil sampling and measurements were carried out on two sampling dates: autumn 2021, before preparing the soil and sowing, and summer 2022; therefore, respectively at the beginning and at the end of the 2021–2022 growing season. Six Beerkan infiltration experiments were performed to apply the BEST-procedure for each of the 12 experimental units and for each sampling date at spatialized points. Consequently, a total of 144 Beerkan runs were carried out in this investigation. Beerkan infiltrations were performed using a 15-cm inner diameter cylinder with a cutting edge that was inserted into the soil to a depth of about 1 cm, to avoid lateral loss of ponded water. Fifteen volumes of water (200 mL each) were repeatedly poured into the ring from a height of about 2–3 cm and the time needed for the complete infiltration of each pouring was recorded with a stopwatch. For each infiltration point, BEST requires the sampling of undisturbed soil samples. Specifically, a soil core of 5 cm in diameter and 5 cm in height (V = 98 cm3) was collected at the 0 to 5 cm and 5 to 10 cm depths, to determine the soil water content at the time of the infiltration (θi) as well as the soil bulk density (BD). As is common for the application of the method, θS was estimated from the BD, assuming a soil particle density of 2.65 g cm−3. The soil particle size distribution, measured in other studies conducted on the same experimental site and consisting in frequency of a 14-particle size fraction [2,24], was used to run BEST.
Data deriving from each infiltration experiment and from soil sampling were processed with BEST-steady to estimate the water retention curve (WRC) and hydraulic conductivity function (HCF). Therefore, some physical and hydraulic soil properties were collected in this investigation to evaluate the impact of soil management and the temporal changes, including θi, BD and saturated hydraulic conductivity (Ks).
Additionally, for each WRC estimated, four capacity-based indicators were determined using soil water retention values corresponding to a specific soil pressure head: the macroporosity (PMAC), air capacity (AC), plant-available water capacity (PAWC) and relative field capacity (RFC) [25]. They were determined with the following equations:
P M A C = θ S θ 10
A C = θ S θ 100
P A W C = θ 100 θ 15 , 300
R C F = θ 100 θ S
where θS, θ10, θ100 and θ15,300 are soil water contents corresponding to pressure head h = 0, 10, 100 and 15,300 cm.

2.3. Statistical Analysis

In this study, the Beerkan infiltration runs were considered randomized within each plot. In addition, only the effect of soil management over the two seasons was investigated. Data on the physical and hydraulic soil properties (Ks, θi, θ10, θ100, θ15,300) and soil quality indicators (BD, PMAC, AC, PAWC, RFC) were tested for normality using the Shapiro–Wilk test. Subsequently, a nested analysis of variance (ANOVA) was separately conducted for each season considering the replicates within plots as pseudo-replicates. The homogeneity of the variances across the sampling seasons, a condition for valid analysis of variance for combining the data from a series of experiments, was verified through the F test [26]. When the variances were homogeneous, a combined analysis of variance (combined ANOVA) of data was used. Conversely, when dependent variables indicated that there was a significant difference in variance obtained from experiments repeated over two seasons (the variance was heterogeneous), a weighted least square (WLS) analysis was run. The weights are reciprocals of the root mean square errors [26]. These new variables were used to run a combined ANOVA. The combined ANOVA corresponded to a nested design with two factors nested within one another [26], where the main-plot factor was soil management, while the sub-plot factor was the sampling season. The means of BEST parameters and capacity-based soil indicators, measured for different times of sampling and soil management, were separated by an LSD test. The ANOVA was conducted using R Studio software (Version 3.6.3) [27]; the F test for homogeneity of variances was conducted using Microsoft Excel software (Microsoft Company, Redmond, WA, USA). For the combined ANOVA and LSD test, MSTAT-C software (Version 2.10) [28] was used. The coefficient of variation (CV%), computed as a relative measure of the experimental error, was calculated for the measurements collected both across the soil management (CVA) and across the different seasons and their interaction with the soil management (CVB).

3. Results

Non-homogeneous variances were recorded for BD, Ks, θ100, and PAWC. Therefore, these data were transformed. Results of the combined ANOVA showed that the soil management had significant effects on BD, Ks, and PAWC. The sampling season significantly affected θ10 and θ15,300; highly significant effects were recorded for θi and Ks, BD, θ100 and PAWC (see Table 1). The interaction between the soil management and the sampling season was not significant for all physical and hydraulic soil properties and capacity-based indicators investigated in this study.
Minimum-tilled soil showed on average a significantly higher saturated hydraulic conductivity (0.0497 mm s−1) than no-tilled soil (0.0427 mm s−1) and a lower bulk density (1.0794 vs. 1.1204 g cm−3, respectively; Table 2). Greater PAWC values were also recorded in MT soil (Table 3).
θi was greater in autumn than in summer (0.3471 and 0.2912 cm3 cm−3, respectively). Conversely, BD recorded greater mean values in summer (1.1905 g cm−3) than in autumn (1.0093 g cm−3). Ks was significantly lower in autumn than in summer. The mean Ks values ranged from 0.0345 mm s−1 (recorded for NT in summer) to 0.0640 mm s−1 (recorded for MT in summer) (Table 2).
θ10, θ100 and θ15,300 showed the greatest values in autumn. Macroporosity (PMAC), air capacity (AC) and relative field capacity (RFC) were not significantly affected by the sampling season. Mean values were 0.0216 and 0.0174 cm3 cm−3 for PMAC, 0.1943 and 0.1784 cm3 cm−3 for AC and 0.6856 and 0.6751 for RFC in autumn and summer, respectively. On the other hand, significantly higher values of the plant-available water capacity indicator (PAWC) were recorded in autumn (0.2780 cm3 cm−3) than in summer (0.2491 cm3 cm−3) (Table 3).
Figure 3 shows the differences in terms of WRC and HCF for each season of sampling and soil management. The sampling season showed relatively greater differences than soil management. BEST returned WRCs having lower soil water contents for the summer season and no-tillage management, especially for 0 < |h| < 100 mm (h > −100 mm). On the other hand, for |h| > 100 mm (h < −100 mm), more evident differences were observed only by comparing the sampling seasons, with the soil water content values higher in autumn than in summer. Likewise, higher discrepancies for HCFs were detected only by comparing the sampling seasons, despite the fact that significant differences between MT and NT were also recorded in terms of saturated hydraulic conductivity (Ks). Specifically, HCF estimated in summer was higher than that estimated in autumn.
WRCs and HCFs relating to the interaction between the sampling season and soil management are shown in Figure 3. Relatively lower soil water contents were shown in summer close to water saturation for MT and NT, while BEST returned insubstantial differences for h < −100 mm. Although low discrepancies were observed in summer between minimum tillage and no-tillage, soil managed with MT was more conductive in summer and less conductive in autumn than with NT.

4. Discussion

The aim of measures repetition in large-scale experiments is to investigate the susceptibility of treatment effects to space and time variation. In our study, we mainly evaluated the seasonal variability in the physical and hydraulic properties of a soil, where minimum tillage and no-tillage were used repeatedly over time in a long-term experiment. Combined analysis of variance of data (combined ANOVA) was used to estimate the average response to treatments and to test the consistency of the responses in two different sampling times as well as the interaction of the treatment effects with the seasons.
In general, measurement campaigns were selected to account for a similar time elapsed from the last main soil tillage, so as to be relatively confident of having overtaken the phase of rapid consolidation of the soil and, consequently, of studying relatively comparable soil conditions. However, the different sampling seasons, summer and autumn, represented the prerequisite for investigating different soil moisture conditions that are known as a main factor affecting the variability in soil physical properties. Consequently, the effect induced by soil management (NT and MT) on the soil structure (summarized by BD and Ks) was simultaneously evaluated.
With specific reference to the variables directly determined during the investigation (θi, BD and Ks) and regardless of soil management, the effects of seasonality (autumn vs. summer) were consistent with expectations. It was confirmed that the significantly higher soil moisture contents, typical for the autumnal season, were associated with significantly lower soil bulk density values, and with corresponding significantly lower saturated hydraulic conductivities. One of the main factors hypothesized for the significant differences in BD values could be linked to the general expandability of the clay soil because, although it was considered to be generally negligible based on several water retention laboratory measurements, θi values differed by a factor of 1.12 between seasons. However, the relationship between soil compaction and soil water content is well established in the literature, as a negative (inverse) correlation between θi and BD is reported [29,30]. On the other hand, the significant differences in saturated hydraulic conductivity between seasons agreed with the literature (among others, Kreiselmeier et al. [8], Kool et al. [31], Kargas et al. [32]), as well as specifically consistent with previous results obtained for the same soil, with Ks that decreased as soil water content increased [33]. Conversely, although the direct relationship between Ks and BD could not be self-explanatory or considered to be inconsistent with the results discussed, the significantly higher soil water content in autumn than summer could have reduced the soil pores space (i.e., the volume reduction in macropores or cracks, pores occlusion, or a reduction in hydraulic continuity within porosity). Overall, rigid soils (coarse-textured soils such as sandy soils) show the same soil volume regardless of the soil water content, while finer-texture soils tend to swell (or contract), depending on the degree of wetness [34]. The soil under study did not show evident swelling characteristics in past investigations, and infiltration measurements were made on soil surfaces without evident surface cracks. However, swelling phenomena affecting the pore system cannot be excluded, and our findings seem to move in this direction. In general, this plausible soil behaviour is not uncommon in the literature [35]. For instance, Hu et al. [35], while investigating the seasonal changes in surface BD and Ks in natural landscapes, concluded that the temporal pattern of Ks followed the temporal changes in BD but that the opposite was not always true, because temporal changes in BD cannot fully explain the temporal changes in Ks [35]. In other words, because BD provides a measure of the oven-dry soil mass in relation to its volume, it does not provide any information on the pores network, i.e., volume and continuity, that characterizes the corresponding soil volume [25]. Therefore, although bulk density-based experimental information is widely used or was implemented in the Protocol for the Assessment of Sustainable Soil Management [1], it should be treated with caution because it does not always represent a strong indicator for summarizing the dynamics of water in the soil.
Although the interaction between soil management and the sampling season was not significant (p-Value = 0.2084), the reduction in saturated hydraulic conductivity observed in autumn under greater soil water content appeared to be on average more pronounced under minimum tilled soil (0.0640 mm s−1 vs. 0.354 mm s−1, respectively in summer and autumn) (Table 2).
In general, relationships between BEST-derived variables and other measured variables met expectations because, for example, PMAC (or AC) increased as BD decreased [36]; in the same way, similar relationships were detected when relative field capacity was considered, as relatively higher RFC values highlight a reduced availability of soil air (and vice versa) [37]. However, regarding the accuracy of capacity-based soil indicators obtained by BEST, a further evaluation was carried out by comparing the summer data from this investigation (BD, PMAC, AC, RFC) with the corresponding measurements (i.e., from measured soil water retention curves) carried out in the same plots in spring 2015 (see data reported in Table 2 by Stellacci et al. [37]). Starting from very similar BD values (differences within a factor 1.2 or 1.3 under NT or MT), the three remaining indicators showed, on average, relatively higher discrepancies under NT (a factor of 2.3) than MT (1.7), with the highest difference (overestimation by a factor of 4) for the air capacity under no-tillage.
The effects of soil management, NT and MT, on the main physical (BD) and hydraulic (Ks) soil properties were quite interesting because, starting from similar (not different) soil moisture conditions, no-tilled soil was significantly more dense and less conductive, as compared to MT. This is not in itself a novel result, even considering findings obtained in the past in the same plots, applying different methods, and measures that span almost the entire cropping season [38]. However, it provided further evidence that, in the long-term field experiment investigated, the two soil management systems did not show substantial differences in their physical and hydraulic behaviour, as summarized by hydraulic functions (Figure 3). Furthermore, the comparison between measurements and reference values in the literature has emphasized that BD and Ks fall within the suggested optimal thresholds to avoid risks to crops: (i) bulk density was practically always within the optimal range 0.9–1.2 g cm−3 [25], and (ii) saturated hydraulic conductivity was not very dissimilar from reference values suggested by Reynolds et al. [39] for a wide range of agricultural soils (i.e., 0.05−0.005 mm s−1), for promoting the rapid infiltration and redistribution of crop-available water, reduced surface runoff and soil erosion, and rapid drainage of excess soil water [39].
Many soil properties exhibit a two-stage response to soil management [17,40] and thus a complete understanding of the processes investigated requires that almost stable conditions are obtained. In this respect, the key role of long-term field experiments is well known and recognized [23,37,41]. In this study, as previously reported, the time elapsed from the last main soil tillage allowed for the study of relatively comparable soil conditions. Although a shift from a wheat monoculture to a wheat–legume rotation was recently introduced in the experiment, the effect of the crop grown on soil hydraulic properties was not investigated in this study. A further deepening of this issue will be carried out considering additionally the information brought by the measures repeated in each experimental unit in order to take into account the spatial autocorrelation of the studied variables.

5. Conclusions

Knowledge of the interaction between the seasonal and the soil use dependent variability in physical and hydraulic properties assumes a remarkable interest in crop-growth modelling studies and in the optimization of the management of agronomic practices. In addition, defining the optimal sampling time across the growing season is crucial to standardize sampling protocols for soil physical status monitoring and to achieve comparable results under different experimental conditions and at different sites.
In this study, the seasonal variability in soil physical and hydraulic properties under minimum tillage and no-tillage, repeated over time in a long-term field experiment, was evaluated. Results underlined the role of soil moisture conditions as a main factor affecting variability in soil physical properties. Specifically, different soil moisture in autumn and summer samplings significantly affected the bulk density and saturated hydraulic conductivity.
Relationships observed between BEST-derived variables, such as PMAC (or AC) and RFC, and measured variables, such as BD, showed consistent results, with increases in macroporosity to BD decreases. However, a comparison of capacity-based indicators obtained by BEST with those obtained from measured soil water retention curves, in previous investigation but under comparable soil conditions (e.g., bulk density) and soil management (both MT and NT in durum wheat), highlighted some discrepancies. This finding drives the focus towards the need to use more robust datasets deriving from experimental measurements or from coupling information derived from measured and estimated data.
Finally, this study provided further evidence that the two soil management systems, in the long-term experiment investigated, did not show substantial differences in their physical and hydraulic behaviour and allowed us to keep the values of key soil physical quality indicators, such as bulk density and saturated hydraulic conductivity, within optimal or near-optimal ranges.

Author Contributions

Conceptualization, A.M.S. and M.C.; methodology, A.M.S., E.B., M.S. and M.C.; formal analysis, S.P.; investigation, S.P. and L.G.; resources, M.C.; data curation, S.P. and L.G.; writing—original draft preparation, S.P.; writing—review and editing, A.M.S., E.B., M.S. and M.C.; supervision, A.M.S. and M.C. All authors have read and agreed to the published version of the manuscript.

Funding

This research received no external funding.

Data Availability Statement

Not applicable.

Acknowledgments

The work was also supported by the PRIMA Foundation, call 2019-Section 1–GA n.1912 “Research-based participatory approaches for adopting Conservation Agriculture in the Mediterranean Area—CAMA” project. The authors would like to thank Alessandro Vittorio Vonella for valuable technical support in the field. S. Popolizio developed this research for his PhD activity.

Conflicts of Interest

The authors declare no conflict of interest.

References

  1. FAO-ITPS Protocol for the Assessment of Sustainable Soil Management. 2020. Available online: https://www.fao.org/globalsoil-partnership/resources/highlights/detail/en/c/1370578/ (accessed on 27 October 2022).
  2. Castellini, M.; Stellacci, A.M.; Tomaiuolo, M.; Barca, E. Spatial variability of soil physical and hydraulic properties in a durum wheat field: An assessment by the BEST-Procedure. Water 2019, 11, 1434. [Google Scholar] [CrossRef] [Green Version]
  3. Bagarello, V.; Barca, E.; Castellini, M.; Iovino, M.; Morbidelli, R.; Saltalippi, C.; Flammini, A. A plot-scale uncertainty analysis of saturated hydraulic conductivity of a clay soil. J. Hydrol. 2020, 596, 125694. [Google Scholar] [CrossRef]
  4. Di Prima, S.; Stewart, R.D.; Abou Najm, M.R.; Roder, R.; Giadrossich, F.; Campus, S.; Angulo-Jaramillo, R.; Yilmaz, D.; Rogerro, P.P.; Pirastru, M.; et al. BEST-WR: An adapted algorithm for the hydraulic characterization of hydrophilic and water-repellent soils. J. Hydrol. 2021, 603, 126936. [Google Scholar] [CrossRef]
  5. Timm, L.C.; Dourado-Neto, D.; Bacchi, O.O.S.; Hu, W.; Bortolotto, R.P.; Silva, A.L.; Bruno, I.P.; Reichardt, K. Temporal variability of soil water storage evaluated for a coffee field. Soil Res. 2011, 49, 77–86. [Google Scholar] [CrossRef]
  6. Alletto, L.; Coquet, Y. Temporal and spatial variability of soil bulk density and near-saturated hydraulic conductivity under two contrasted tillage management systems. Geoderma 2009, 152, 85–94. [Google Scholar] [CrossRef]
  7. Villarreal, R.; Lozano, L.A.; Salazar, M.P.; Bellora, G.L.; Melani, E.M.; Polich, N.; Soracco, C.G. Pore system configuration and hydraulic properties. Temporal variation during the crop cycle in different soil types of Argentinean Pampas Region. Soil Tillage Res. 2020, 198, 104528. [Google Scholar] [CrossRef]
  8. Kreiselmeier, J.; Chandrasekhar, P.; Weninger, T.; Schwen, A.; Julich, S.; Feger, K.-H.; Schwärzel, K. Temporal variations of the hydraulic conductivity characteristic under conventional and conservation tillage. Geoderma 2020, 362, 114127. [Google Scholar] [CrossRef]
  9. Drewry, J.J.; McNeill, S.J.; Carrick, S.; Lynn, I.H.; Eger, A.; Payne, J.; Rogers, G.; Thomas, S.M. Temporal trends in soil physical properties under cropping with intensive till and no-till management. N. Z. J. Agric. Res. 2019, 64, 223–244. [Google Scholar] [CrossRef]
  10. Castellini, M.; Diacono, M.; Preite, A.; Montemurro, F. Short- and Medium-Term Effects of On-Farm Compost Addition on the Physical and Hydraulic Properties of a Clay Soil. Agronomy 2022, 12, 1446. [Google Scholar] [CrossRef]
  11. Lassabatère, L.; Angulo-Jaramillo, R.; Soria Ugalde, J.M.; Cuenca, R.; Braud, I.; Haverkamp, R. Beerkan estimation of soil transfer parameters through infiltration experiments-BEST. Soil Sci. Soc. Am. J. 2006, 70, 521–532. [Google Scholar] [CrossRef]
  12. Angulo-Jaramillo, R.; Bagarello, V.; Di Prima, S.; Gosset, A.; Iovino, M.; Lassabatère, L. Beerkan Estimation of Soil Transfer parameters (BEST) across soils and scales. J. Hydrol. 2019, 576, 239–261. [Google Scholar] [CrossRef]
  13. Castellini, M.; Di Prima, S.; Moret-Fernández, D.; Lassabatère, L. Rapid and accurate measurement methods for determining soil hydraulic properties: A review. J. Hydrol. Hydromech. 2021, 69, 121–139. [Google Scholar] [CrossRef]
  14. Rinaldi, M.; Almeida, A.S.; Álvaro Fuentes, J.; Annabi, M.; Annicchiarico, P.; Castellini, M.; Cantero Martinez, C.; Cruz, M.G.; D’Alessandro, G.; Gitsopoulos, T.; et al. Open Questions and Research Needs in the Adoption of Conservation Agriculture in the Mediterranean Area. Agronomy 2022, 12, 1112. [Google Scholar] [CrossRef]
  15. Veresoglou, S.D.; Chen, J.; Du, X.; Fu, Q.; Geng, Q.; Huang, C.; Huang, X.; Hu, N.; Hun, Y.; Li, G.C.; et al. No tillage outperforms conventional tillage under arid conditions and following fertilization. Soil Ecol. Lett. 2022, 5, 137–141. [Google Scholar] [CrossRef]
  16. Wardak, D.L.; Padia, F.N.; de Heer, M.I.; Sturrock, C.J.; Mooney, S.J. Zero tillage has important consequences for soil pore architecture and hydraulic transport: A review. Geoderma 2022, 422, 115927. [Google Scholar] [CrossRef]
  17. Ferrara, R.M.; Mazza, G.; Muschitiello, C.; Castellini, M.; Stellacci, A.M.; Navarro, A.; Lagomarsino, A.; Vitti, C.; Rossi, R.; Rana, G. Short-term effects of conversion to no-tillage on respiration and chemical-physical properties of the soil: A case study in a wheat cropping system in semi-dry environment. Ital. J. Agrometeorol. 2017, 1, 47–58. [Google Scholar] [CrossRef]
  18. Strudley, M.; Green, T.; Ascoughii, J. Tillage effects on soil hydraulic properties in space and time: State of the science. Soil Tillage Res. 2008, 99, 4–48. [Google Scholar] [CrossRef]
  19. Chandrasekhar, P.; Kreiselmeier, J.; Schwen, A.; Weninger, T.; Julich, S.; Feger, K.H.; Schwärzel, K. Why we should include soil structural dynamics of agricultural soils in hydrological models. Water 2018, 10, 1862. [Google Scholar] [CrossRef] [Green Version]
  20. Robinson, D.A.; Hopmans, J.W.; Filipovic, V.; van der Ploeg, M.; Lebron, I.; Jones, S.B.; Reinsch, S.; Jarvis, N.; Tuller, M. Global environmental changes impact soil hydraulic functions through biophysical feedbacks. Glob. Chang. Biol. 2019, 25, 1895–1904. [Google Scholar] [CrossRef] [Green Version]
  21. UNESCO FAO. Bioclimatic Map of the Mediterranean Zone; (NS162/III, 22A); UNESCO: Paris, France; FAO: Rome, Italy, 1963; p. 60. [Google Scholar]
  22. Garofalo, P.; Ventrella, D.; Karsebaum, K.C.; Gobin, A.; Trnk, M.; Giglio, L.; Dubrovský, M.; Castellini, M. Water footprint of winter wheat under climate change: Trends and uncertainties associated to the ensemble of crop models. Sci. Total Environ. 2019, 658, 1186–1208. [Google Scholar] [CrossRef]
  23. Castellini, M.; Stellacci, A.M.; Barca, E.; Iovino, M. Application of multivariate analysis techniques for selecting soil physical quality indicators: A case study in long-term field experiments in Apulia (Southern Italy). Soil Sci. Soc. Am. J. 2019, 83, 707–720. [Google Scholar] [CrossRef] [Green Version]
  24. Castellini, M.; Niedda, M.; Pirastru, M.; Ventrella, D. Temporal changes of soil physical quality under two residue management systems. Soil Use Manag. 2014, 30, 423–434. [Google Scholar] [CrossRef]
  25. Reynolds, W.D.; Drury, C.F.; Tan, C.S.; Fox, C.A.; Yang, X.M. Use of indicators and pore volume function characteristics to quantify soil physical quality. Geoderma 2009, 152, 252–263. [Google Scholar] [CrossRef]
  26. Gupta, V.K.; Rajender, P. Fundamentals of Design of Experiments; I.A.S.R.I. Library Avenue: New Delhi, India, 2012; pp. 1–44. [Google Scholar]
  27. RStudio Team, 2015. RStudio: Integrated Development Environment for R, Boston, MA. Available online: http://www.rstudio.com/ (accessed on 27 October 2022).
  28. Bricker, B. MSTAT-C: A Micro Computer Program from the Design Management and Analysis of Agronomic Research Experiments; Michigan State University: East Lansing, MI, USA, 1991. [Google Scholar]
  29. Zhao, H.; Qin, J.; Gao, T.; Zhang, M.; Sun, H.; Zhu, S.; Xu, C.; Ning, T. Immediate and long-term effects of tillage practices with crop residue on soil water and organic carbon storage changes under a wheat-maize cropping system. Soil Tillage Res. 2022, 218, 105309. [Google Scholar] [CrossRef]
  30. Vaz, C.M.P.; Manieri, J.M.; de Maria, I.C.; Tuller, M. Modeling and correction of soil penetration resistance for varying soil water content. Geoderma 2011, 166, 92–101. [Google Scholar] [CrossRef]
  31. Kool, D.; Tong, B.; Tian, Z.; Heitman, J.L.; Sauer, T.J.; Horton, R. Soil water retention and hydraulic conductivity dynamics following tillage. Soil Tillage Res. 2019, 193, 95–100. [Google Scholar] [CrossRef] [Green Version]
  32. Kargas, G.; Kerkides, P.; Sotirakoglou, K.; Poulovassilis, A. Temporal variability of surface soil hydraulic properties under various tillage systems. Soil Tillage Res. 2016, 158, 22–31. [Google Scholar] [CrossRef]
  33. Castellini, M.; Giglio, L.; Niedda, M.; Palumbo, A.D.; Ventrella, D. Impact of biochar addition on the physical and hydraulic properties of a clay soil. Soil Tillage Res. 2015, 154, 1–13. [Google Scholar] [CrossRef]
  34. Hillel, D. Environmental Soil Physics; Academic Press: San Diego, CA, USA, 1998; p. 771. [Google Scholar]
  35. Hu, W.; Shao, M.A.; Si, B.C. Seasonal changes in surface bulk density and saturated hydraulic conductivity of natural landscapes. Eur. J. Soil Sci. 2012, 63, 820–830. [Google Scholar] [CrossRef]
  36. Manici, L.M.; Castellini, M.; Caputo, F. Soil-inhabiting fungi can integrate soil physical indicators in multivariate analysis of Mediterranean agroecosystem dominated by old olive groves. Ecol. Indic. 2019, 106, 105490. [Google Scholar] [CrossRef]
  37. Stellacci, A.M.; Castellini, M.; Diacono, M.; Rossi, R.; Gattullo, C. Assessment of Soil Quality under Different Soil Management Strategies: Combined Use of Statistical Approaches to Select the Most Informative Soil Physico-Chemical Indicators. Appl. Sci. 2021, 11, 5099. [Google Scholar] [CrossRef]
  38. Castellini, M.; Vonella, A.V.; Ventrella, D.; Rinaldi, M.; Baiamonte, G. Determining Soil Hydraulic Properties Using Infiltrometer Techniques: An Assessment of Temporal Variability in a Long-Term Experiment under Minimum- and No-Tillage Soil Management. Sustainability 2020, 12, 5019. [Google Scholar] [CrossRef]
  39. Reynolds, W.D.; Drury, C.F.; Yang, X.M.; Fox, C.A.; Tan, C.S.; Zhang, T.Q. Land management effects on the near-surface physical quality of a clay loam soil. Soil Tillage Res. 2007, 96, 316–330. [Google Scholar] [CrossRef]
  40. Reynolds, W.D.; Schoenau, J.J.; Drury, C.F. Scientific and practical benefits of long-term field studies. Can. J. Soil Sci. 2014, 94, 253–254. [Google Scholar] [CrossRef]
  41. Pranagal, J.; Wozniak, A. 30 years of wheat monoculture and reduced tillage and physical condition of Rendzic Phaeozem. Agric. Water Manag. 2021, 243, 106408. [Google Scholar] [CrossRef]
Figure 1. Location of experimental farm of the Council for Agricultural Research and Economics in Foggia, Apulian region, southern Italy.
Agronomy 12 03142 g001
Figure 2. Experimental design of long-term field experiment located in the farm of CREA-AA, Foggia.
Agronomy 12 03142 g002
Figure 3. Water retention curves (a) and hydraulic conductivity functions (b) obtained with BEST-steady for minimum tillage (MT) and no-tillage (NT) in autumn and summer.
Agronomy 12 03142 g003
Table 1. Combined ANOVA carried out on soil management and sampling season for physical and hydraulic soil properties and capacity-based indicators.
ParametersSoil ManagementSampling SeasonSoil Management
× Sampling Season
θins**ns
Ks***ns
BD****ns
θ10ns*ns
θ100ns***ns
θ15,300ns*ns
PMACnsnsns
ACnsnsns
PAWC****ns
RFCnsnsns
* significant at p-Value ≤ 0.05, ** p-Value ≤ 0.01, *** p-Value ≤ 0.001; ns = not significant. Soil management (df) = 1; Sampling season (df) = 1; Soil management × Sampling season (df) = 1.
Table 2. Mean separation and coefficients of variation of variables measured in field (θi, BD) and estimated with BEST procedure (Ks).
Source of Variationθi
cm3 cm−3
BD
(g cm−3)
Ks
(mm s−1)
MT0.32161.0794 b0.0497 a
NT0.31661.1204 a0.0427 b
CV(A) (%)11.00.98.8
Autumn0.3471 a1.0093 b0.0431 b
Summer0.2912 b1.1905 a0.0492 a
Autumn MT0.35980.99130.0354
Autumn NT0.33431.02730.0509
Summer MT0.28341.16740.0640
Summer NT0.29891.21350.0345
CV(B) (%)5.02.850.7
within each column, data followed by different letters are significantly different at a p-Value of 0.05 (LSD test). CV(A) and CV(B) represent, respectively, coefficients of variation calculated on the experimental errors both across the soil management (CV(A)) and across the different seasons and their interaction with the soil management (CV(B)).
Table 3. Mean separation and coefficients of variations of volumetric soil water contents (θ10, θ100, θ15,300) and capacity-based indicators.
Source of Variationθ10
(cm3 cm−3)
θ100
(cm3 cm−3)
θ15,300
(cm3 cm−3)
PMAC
(cm3 cm−3)
AC
(cm3 cm−3)
PAWC
(cm3 cm−3)
RFC
(-)
MT0.57340.40170.13620.01940.19110.2650 a0.6774
NT0.55850.39470.13140.01970.18160.2620 b0.6833
CV(A) (%)1.80.74.748.412.00.65.7
Autumn0.5986 a0.4249 a0.1469 a0.02160.19430.2780 a0.6856
Summer0.5333 b0.3716 b0.1207 b0.01740.17840.2491 b0.6751
Autumn MT0.60840.43590.15170.01760.19010.28420.6957
Autumn NT0.58870.41380.14210.02560.19850.27170.6755
Summer MT0.53830.36760.12070.02110.19200.24580.6591
Summer NT0.52830.37560.12060.01380.16470.25230.6910
CV(B) (%)4.74.87.632.28.33.23.4
within each column, data followed by different letters are significantly different at a p-value of 0.05 (LSD test). CV(A) and CV(B) represent, respectively, coefficients of variation calculated on the experimental errors both across the soil management (CV(A)) and across the different seasons and their interaction with the soil management (CV(B)).
Publisher’s Note: MDPI stays neutral with regard to jurisdictional claims in published maps and institutional affiliations.

