Article

Data-Driven Artificial Intelligence (AI) Algorithms for Modelling Potential Maize Yield under Maize–Legume Farming Systems in East Africa

by
Komi Mensah Agboka
1,2,*,
Henri E. Z. Tonnang
1,*,
Elfatih M. Abdel-Rahman
1,
John Odindi
2,
Onisimo Mutanga
2 and
Saliou Niassy
1
1
International Centre of Insect Physiology and Ecology (icipe), Nairobi P.O. Box 30772-00100, Kenya
2
School of Agricultural, Earth, and Environmental Sciences, University of KwaZulu-Natal, Pietermaritzburg 3209, South Africa
*
Authors to whom correspondence should be addressed.
Agronomy 2022, 12(12), 3085; https://doi.org/10.3390/agronomy12123085
Submission received: 19 September 2022 / Revised: 8 November 2022 / Accepted: 9 November 2022 / Published: 6 December 2022

Abstract

:
Agroecological farming systems such as maize–legume intercropping (MLI) and push-pull technology (PPT) have been introduced to mitigate losses from pests. Nevertheless, the regionwide maize yield gained from practicing such farming systems remains largely unknown. This study compares the performance of two uncomplex and interpretable models, namely the hybrid fuzzy-logic combined with the genetic algorithm and symbolic regression, to predict maize yield. Specifically, the study adopted the best-fitting model to map the potential maize yield under MLI and PPT compared to the monocropping system in East Africa using climatic and edaphic variables. The best model, i.e., the symbolic regression model, accurately fitted the maize yield data as indicated by the low root mean square error (RMSE < 0.09) and the higher R2 (>0.9). The study estimated that East African farmers would increase their annual maize yield by about 1.01 and 1.96 rates under MLI and PPT, respectively. Furthermore, the results showed a fairly good modelling performance as indicated by low standard deviations (range of 0.70–1.1) and skewness (absolute range of 0.03–0.09) values. The study guides the upscaling of MLI and PPT systems through awareness creation and public-private partnerships to ensure increased adoption of these sustainable farming practices.

1. Introduction

Maize is the most important staple crop for over 300 million people in Sub-Saharan Africa (SSA), accounting for 70% of cereal production and 40% of calorie intake in many households [1,2]. However, various biotic and abiotic stressors threaten maize production, such as insect pests [3] and unfavourable climatic events [4]. Specifically, climate change, which has altered rainfall patterns and increased temperature in SSA, exacerbates both stressors, leaving staple food crops like maize vulnerable [5], [6]. Moreover, extreme climatic conditions can be conducive to indigenous and invasive insect pests such as stemborers and fall armyworm by accelerating their growth and development [7,8,9]. Hence, due to climate change, crop insect pests have become more damaging, negatively impacting food and nutrition security [10]. For instance, cereal stemborers like the Busseola fusca Fuller and Chilo partellus Swinhoe cause up to 80% grain yield loss [11]. Besides, the relatively recent invasion by the fall armyworm (FAW), Spodoptera frugiperda (J. E. Smith) in Africa can cause a maize yield loss of 8.3–20.6 million tons, valued at US$ 2,481 to US$ 6,187 million [12]. The FAW invasion in Africa has been facilitated by the similarity in climate between SSA and the pest’s native region in South America [13].
On the other hand, injudicious farming practices, including misuse of synthetic pesticides, can be ineffective in mitigating and controlling these insect pests, as they could develop resistance against these agrochemicals [14]. Hence, there is a need to develop resilient and climate-smart cropping systems and improved integrated pest management (IPM) solutions for smallholder farmers in Africa to reduce crop yield losses from insect pests. For instance, agroecological strategies are recommended to improve food and nutrition security through improving crop (e.g., maize) productivity and mitigating large-scale losses of natural systems. Studies have shown that intercropping patterns can considerably increase crop production compared to monocropping patterns, particularly in low-input systems [15,16,17]. Crops chosen for intercropping typically have different abilities to use the available resources for growth and development, resulting in increased productivity and reduced risk that can lead to a complete crop failure [18,19]. A typical example of successful agroecological practices against crop insect pests is the maize–legume intercropping (MLI) system and push-pull technology (PPT). The PPT is a climate-smart cropping system that uses perennial legume (Desmodium ssp.) and grass (Brachiaria ssp.) crops as companion fodder crops in a maize production system to manage cereal stemborers, and the parasitic Striga weed [20,21]. Recently, the technology has proved very efficient in managing FAW [16,22]. The MLI system entails simultaneously planting maize and an edible legume crop like beans in the same or alternating rows [15]. Generally, both practices are effective against maize insect pests and weeds; however, studies have shown that MLI is less effective than PPT. For instance, Midega et al. [16] and Hailu et al. [22] reported an approximately 80% reduction in pest infestation due to PPT compared with 60% due to the MLI system.
Improved crop yield due to the MLI and PPT systems is mainly due to a relatively lower pest infestation rate [16] and more efficient use of natural input resources [15]. It has been demonstrated that MLI and PPT restore soil fertility and enhance ecosystem services (e.g., biodiversity, nutrient fixation, and soil organic matter) [23]. Despite these known benefits, these cropping systems are still underutilized. Thus, there is a need to assess the potential gain in crop yield from adopting the MLI and PPT systems. At the policy level, information on potential gains in yield resulting from adopting these farming systems will serve as an evidence-based asset for scaling these technologies to enhance food and nutrition security. This can provide informed decision-making for scaling such climate-smart cropping systems to improve small-scale farmers’ livelihoods, particularly in SSA.
As previously mentioned, crop yield is not only a function of insect pests and weeds. Climatic conditions and soil fertility that affect crop physiological processes also substantially influence crops to attain optimum yield. Generally, two complementary modelling approaches to estimate crop yield are physiological process-based and data-driven empirical models. Physiological models are typically based on experimental understanding of several crop parameters and factors related to the crop’s physiological processes and, ultimately, the crop productivity. In contrast, data-driven empirical models are citizen science approaches that utilise secondary data to explore empirical relationships among these dependent datasets and some independent predictor variables [24,25]. In SSA, experimental data, such as crop growth and development parameters and genetic factors necessary for the process-based models for estimating crop yield, are barely available. Therefore, data-driven empirical models seem ideal in such a situation because crop yield data are usually made readily available by various stakeholders and hence can be utilised in empirical modelling approaches and related to freely available satellite-based predictor variables like climate and soil factors [26].
Most of the existing data-driven empirical approaches that could explain the relationships between crop yield and predictor variables employ conventional statistical modelling methods [27]. However, these methods are largely unsuitable for accurately mimicking the relationship between crop yield and the relevant predictor variables, particularly in complex agroecosystems. This is because such conventional methods cannot handle the expected random and systematic noise in both the dependent response (e.g., yield) and independent predictor (e.g., climate) datasets [28]. Moreover, the conventional methods are parametric approaches that require response variables of normal distributions and large sample sizes to prevent model overfitting (the Hughes problem). Hence, advanced and cutting-edge machine learning and artificial intelligence methods are known parametric data science algorithms that can efficiently handle the abovementioned constraints [29,30].
A study by Lughopher et al. [31] demonstrated that fuzzy logic and symbolic regression (SR) provide reliable results in data-based methods for building regression models. The SR is an artificial intelligence algorithm that can be employed as an empirical crop yield data-driven model to effectively explain the relationship between target and predictor variables. The algorithm is a breakthrough approach that unravels the intrinsic relationships among response and predictor datasets using mathematical functions [32]. Specifically, the SR algorithm uses optimization methods such as genetic programming (GP) [33], Bayesian methods [34], and physics-inspired methods [35]. The most recently used optimization method for SR is simulated annealing (SA), which is more suitable for approximating the optimum setting values of a given function, hence yielding superior performances [32]. It is reported that the SA performs more accurately than the GP [31] and is one of the most preferred heuristic methods [36].
On the other hand, the fuzzy set theory holds great potential in dealing with uncertainties in data. Fuzzy sets represent the inherent uncertainty in the data and a linguistic description of the pattern under study, allowing for more accurate conclusions [37,38]. In addition, fuzzy logic offers flexibility and simplicity, which reduce the model’s vulnerability to uncertainty as no exact information about the system is needed [39]. Furthermore, the fuzzy logic model provides a methodology for describing complex systems and performs better than conventional (parametric) methods for time-varying, nonlinear, adaptive systems, such as those found in biological and agricultural processes [40]. Besides, the fuzzy model is flexible and can be combined with optimisation algorithms such as the genetic algorithm or the neural network, among many other nature-inspired algorithms. As mentioned earlier, yield prediction depends on many factors that are hard to capture in a mathematical model based solely on physical principles. Relevant influence factors include edaphic variables and the climate [41]. The overall objective of this study was twofold: to compare the performance of two uncomplex and interpretable models, hybrid fuzzy-logic and genetic algorithms (fuzzy genetic FG) and SR, in predicting maize yield; and to use the best-fitted model to map the potential maize yield under MLI and PPT compared to the monocropping system in East Africa using climatic and edaphic variables. We believe farmers and decision-makers need to be aware of the added value in food and nutrition security that each technology provides.

2. Materials and Methods

This study used a robust stepwise data-driven empirical approach by comparing two algorithms, FG and SR, to predict the potential maize yield under MLI and PPT compared to the maize monocropping system using edaphic and climatic variables. The model that best explained the relationship between the predictor variables and maize yield under monocropping, the MLI and PPT with the highest accuracy, was used to extrapolate the potential maize yield under the two treatments and the control at scale. Specifically, we estimated the gain in maize yield (t ha−1) due to the MLI and PPT compared to the maize under the monocropping system as a control.

2.1. Area of Interest

The study area includes three maize-producing countries in East Africa: Kenya, Uganda, and Tanzania (Figure 1). The monocropping system is the cropping pattern most commonly used by smallholder farmers in the region because of the minimal investment required. However, the intercropping (i.e., MLI) strategy of planting common beans in the same hole as maize is also practised in the region. Whereas PPT, recently introduced to farmers, is still barely used in the region.

2.2. Maize Yield Data and Predictor Variables

The maize yield (t ha−1) data were collected in 2020 from farms under PPT, MLI and the control areas located in Bungoma, Busia, Siaya, and Homabay (Kenya), Iganga, Bugiri, Tororo, and Bukedea (Uganda), and Tarime (Tanzania). Specifically, the maize data were collected in nine experimental farms at the sub-county level in western Kenya, eastern Uganda, and northern Tanzania, where PPT and MLI were tested against the monocropping system (i.e., the control in this study). We further collated the mean maize yield reported for each study country (Kenya, Uganda, and Tanzania) for the period 2017–2020 from [42]. We assumed that the FAOSTAT data records were for the maize monocropping system, as it is the main cropping system in the study countries. Moreover, we used these FAO yield data to assess our developed models’ performance.
Coupled with the experimental maize data, we used key climate predictor variables, i.e., temperature, rainfall, and soil fertility parameters (zinc, manganese, nitrogen, magnesium, sodium, iron, copper, boron, potassium, and phosphorus) to empirically predict maize yield, as described in Shirley et al. [27]. The rainfall and temperature were sourced from the WorldClim platform (www.worldclim.org (accessed on 20 January 2022)) at approximately 1 km2 of spatial resolution [43,44], and soil fertility parameters were retrieved from https://www.isric.org (accessed on 20 January 2022) also at 1 km2 of spatial resolution. The WorldClim platform provides long-term (1970–2000) annual climatic observations that are widely used to predict both abiotic and biotic responses [43]. On the other hand, the maize growing area at 10 km2 spatial resolution was sourced from the MapSPAM data centre (https://www.mapspam.info/data/ (accessed on 20 January 2022)) [45]. The MapSPAM data were processed using the “Raster Calculator” tool in QGIS 3.10.9 software (https://qgis.org/, accessed on 20 January 2022)) [46] and transformed to the presence or absence of maize crop. We then resampled the maize growing layer to a spatial resolution of 1 km2 for harmonisation. The area under the maize layer was used to restrict our model to predict the maize yield within the growing sites.

2.3. Assumption

Overall, our experiment for predicting maize yield assumed that (1) maize growing area is the restricted spatial domain for our model; (2) maize yield under MLI and PPT are directly related mainly to rainfall, temperature, and soil fertility; (3) the effects of biotic factors like crop insect pests and weeds and other edaphic factors are minimal; and (4) the effect of other climatic factors like relative humidity and CO2 on maize yield is optimal.

2.4. Model Development and İmplementation

We implemented the SR model in the TuringBot software [47] linked to the Python programing language [48], while the FG model was fully implemented in Python [48]. To generate the mathematical expressions in SR, building blocks were used. These building blocks include mathematical operators (such as arithmetic, operators, trigonometric, hyperbolic, and exponential functions), variables, and constants. The building blocks are combined to generate the optimal model. After the random generation of the mathematical expressions, each operator helps describe the data accurately, and the next generation of mathematical expressions is created using an evolutionary algorithm (SA in this case). The selection of the predicting model was based on the generated models’ goodness of fit and simplicity.
On the other hand, the evolutionary fuzzy inference system powered by the genetic algorithm automatically generates a set of optimal connection weights required to train the rules efficiently, thus creating a robust model. The rules are as follows: f1, f2, …, fn, where n represents the number of rules:
Rule   n : if   x   is   A n   and   y   is   B n   ,   then   f n =   pnx   +   qny   +   rn
where A n , and, B n   are the membership functions for multiple inputs, including x and y.
Prior to generating the two models, we reduced dimensionality and correlation in our predictor datasets. Pearson’s correlation test and cluster analysis with a dendrogram were performed using R statistical software [49]. The 12 least correlated variables (rainfall, zinc, manganese, nitrogen, magnesium, temperature, sodium, iron, copper, boron, potassium, and phosphorus) (Figure 2) were input into the two models to predict maize yield. Moreover, we assessed the performance (goodness of fit) of the two models in fitting the data using the root mean square error (RMSE) and the coefficient of determination (R2).

2.5. Mapping Maize Yield in the Study Area

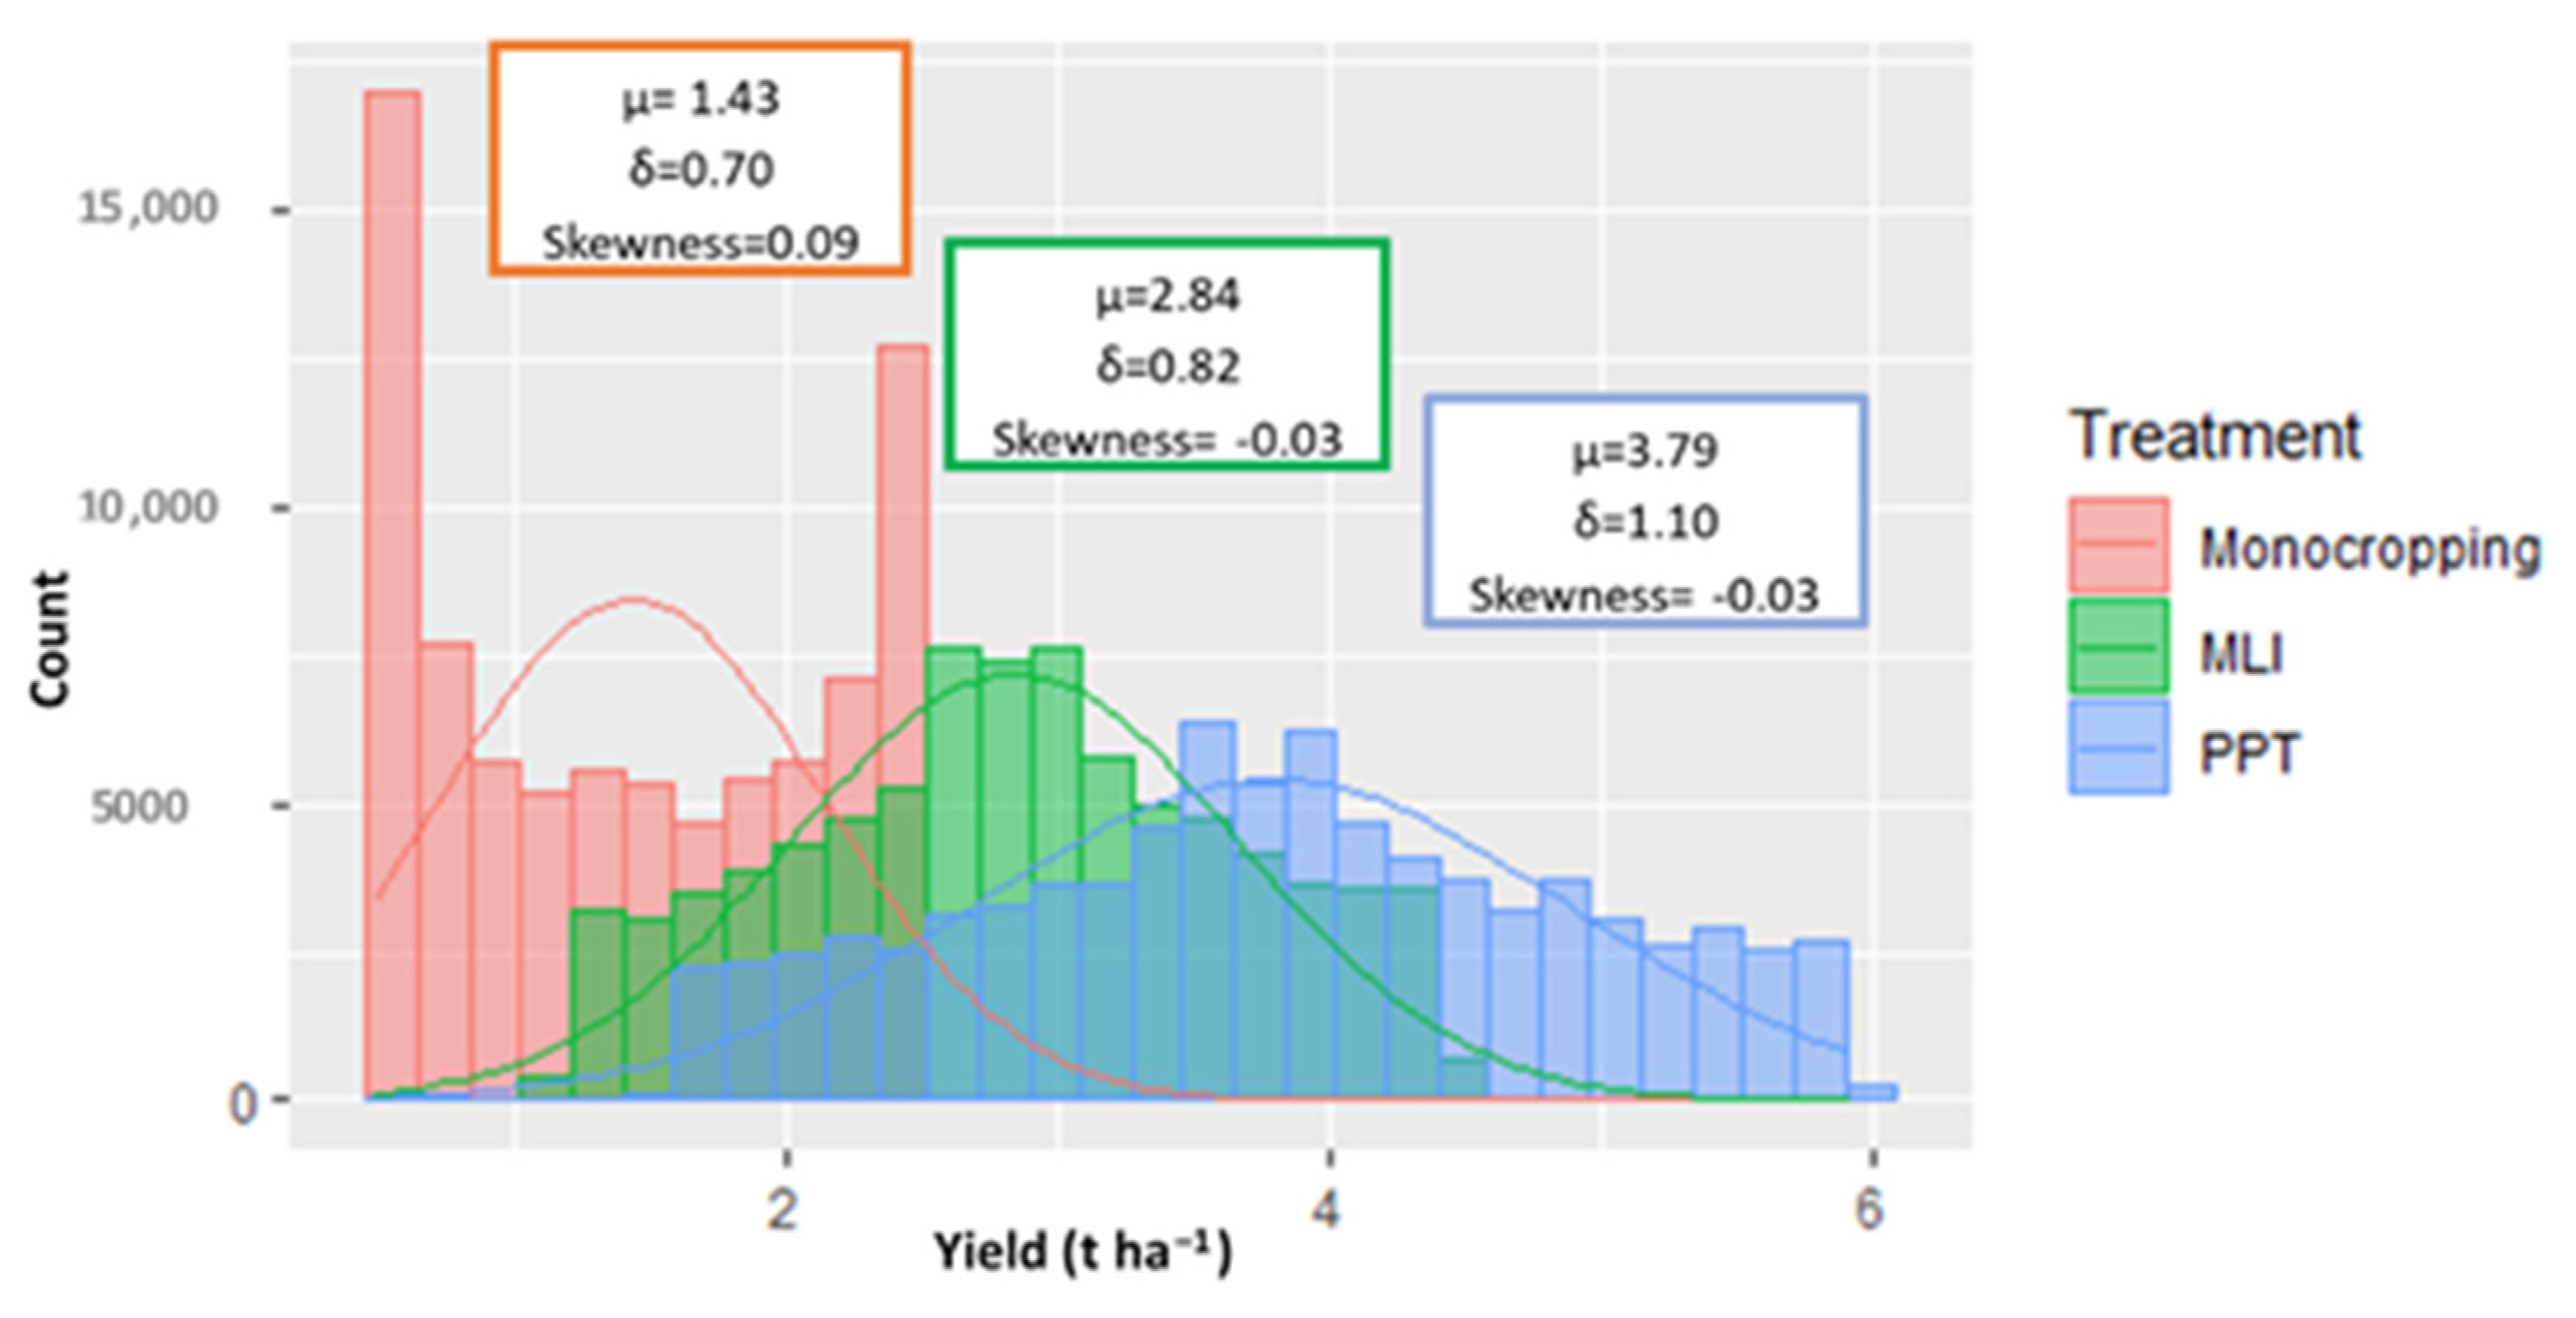
To predict maize yield in the entire study area (countries), we created a 1 km2 grid similar to the resolution of the predictor variables using the “Research tools: create grid” in QGIS [46]. Then the best-fitted model was extrapolated over the grid to provide a spatial representation of maize yield within the maize-growing areas in the study countries using Python programming language [48]. Furthermore, we calculated the mean simulated maize yield (t ha−1) under the monocropping system in each pixel using the R statistical software [49]. Subsequently, the simulated maize means yield was compared to the FAO mean (2017–2020) yield in each country to assess the performance of our developed data-driven modelling approach. Moreover, we used a fundamental descriptive statistical approach to further validate our yield estimation. We calculated maize yield in each centroid of a 2 × 2 km grid in each cropping system treatment (i.e., MLI, PPT, and monocropping), and then cleaned the data by removing the null values. The remaining (n = 82,155) yield records were plotted using a distribution histogram. We hypothesised that a good-performing model should predict maize yield with small standard deviation and skewness values.

3. Results

Overall, the symbolic regression (RMSE < 0.09 and R2 = 0.99) performed better than the FG (RMSE < 2 and R2 ranged from 0.87 to 0.90) in fitting the regression data; however, both models performed fairly well (Table 1). This indicates a highly accurate model performance, as rainfall, temperature, and soil fertility parameters can explain more than 90% of maize yield variability under the three farming practices.
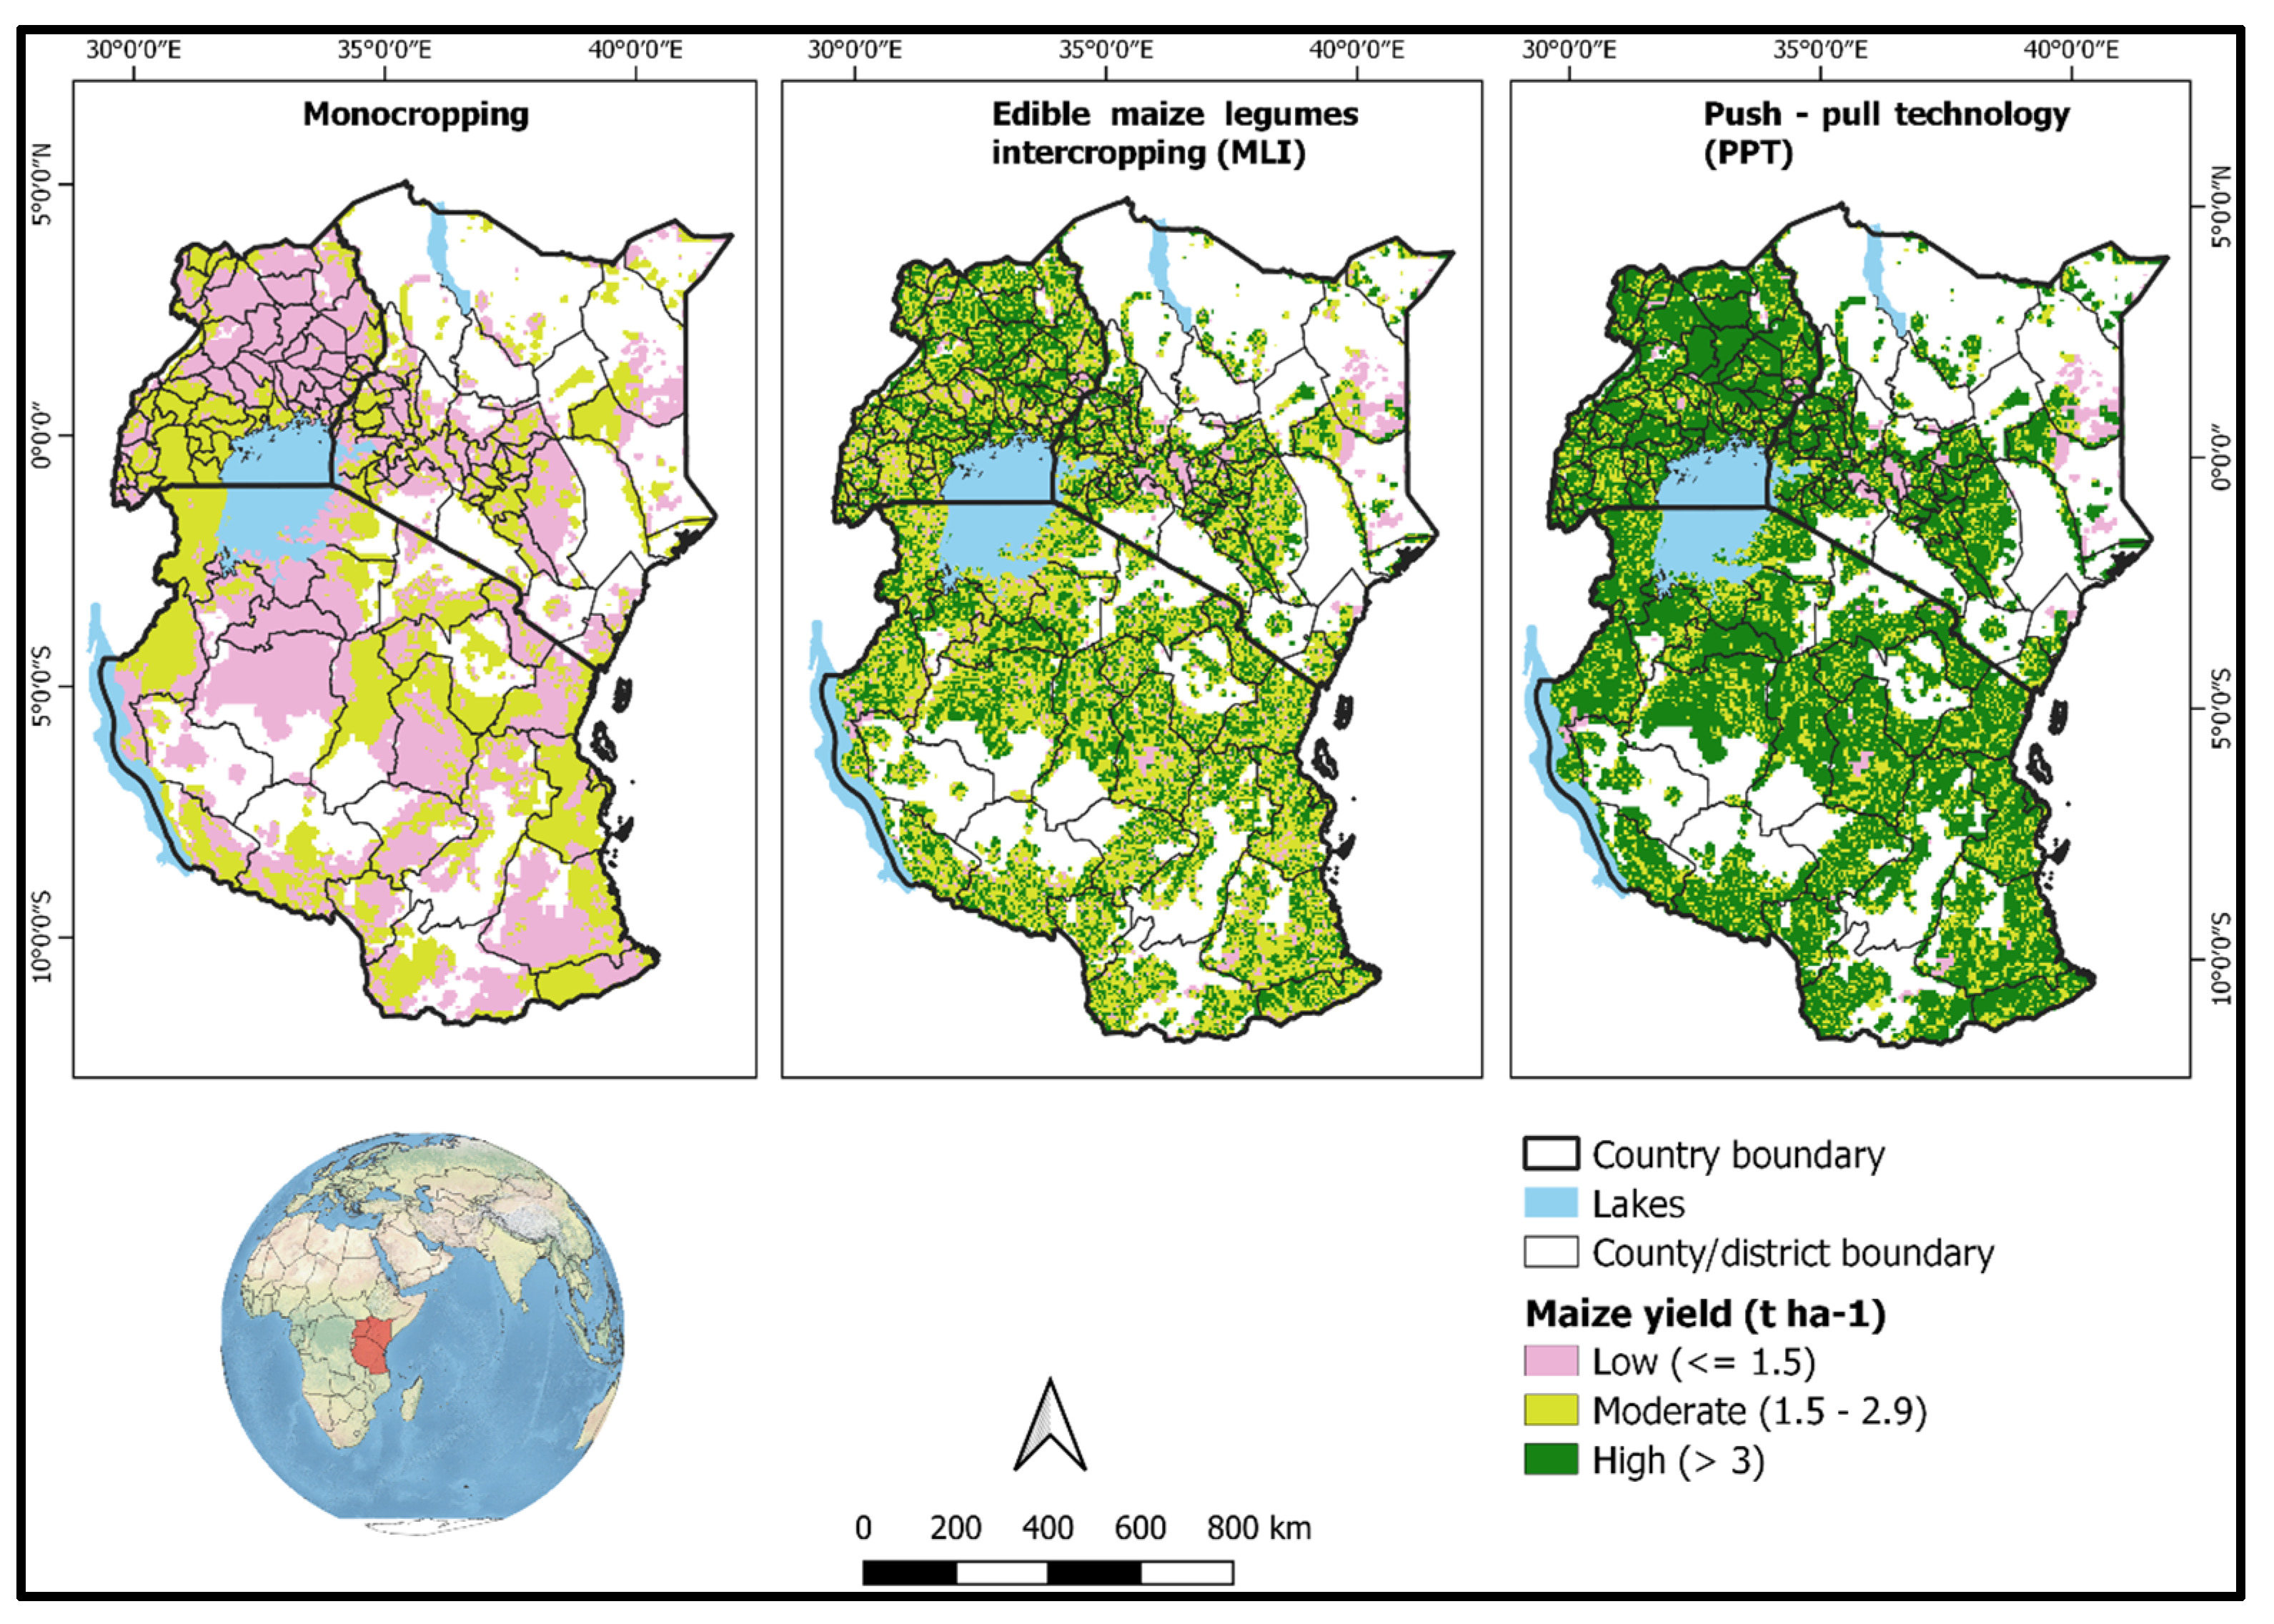
The spatial dispensation of maize yield (t ha−1) in the three study countries under the three production systems using the SR model is shown in Figure 3. The results generally indicated a low maize yield under monocropping compared with the MLI and PPT systems, while maize yield was higher under PPT than under the MLI system in all the study countries. Overall, Kenya, the Rift Valley, and the central, eastern and coastal regions were predicted with low maize yield under monocropping. Similarly, a low maize yield in Uganda was estimated in the northern and eastern regions under the same monocropping system, while the districts of low maize yield in Tanzania were Tabora, Shinyanga, Geita, Lindi, Iringa, and Dodoma. In contrast, under the MLI and PPT systems, there were no distinct maize yield trends among the counties and districts, but as earlier mentioned, a generally higher yield under PPT, as opposed to the MLI system, was predicted.
Results on the net maize yield due to the potential implementation of the MLI and PPT systems suggest an augmentation. Our modelling experiment predicted that when the monocropping system is practised, 57% of the study area is of low maize yield, and no high yield class was predicted (Table 2). Also, the table shows that under the MLI and PPT systems, 40% and 72% of the study area are under high maize yield, respectively.
Furthermore, assessing the performance of our developed SR modelling approach for the prediction of maize yield at a country level under the monocropping system, it is found that Tanzania had a higher deviation (29%) as a function of reported and simulated yield than Uganda (10%) and Kenya (4%) (Table 3).
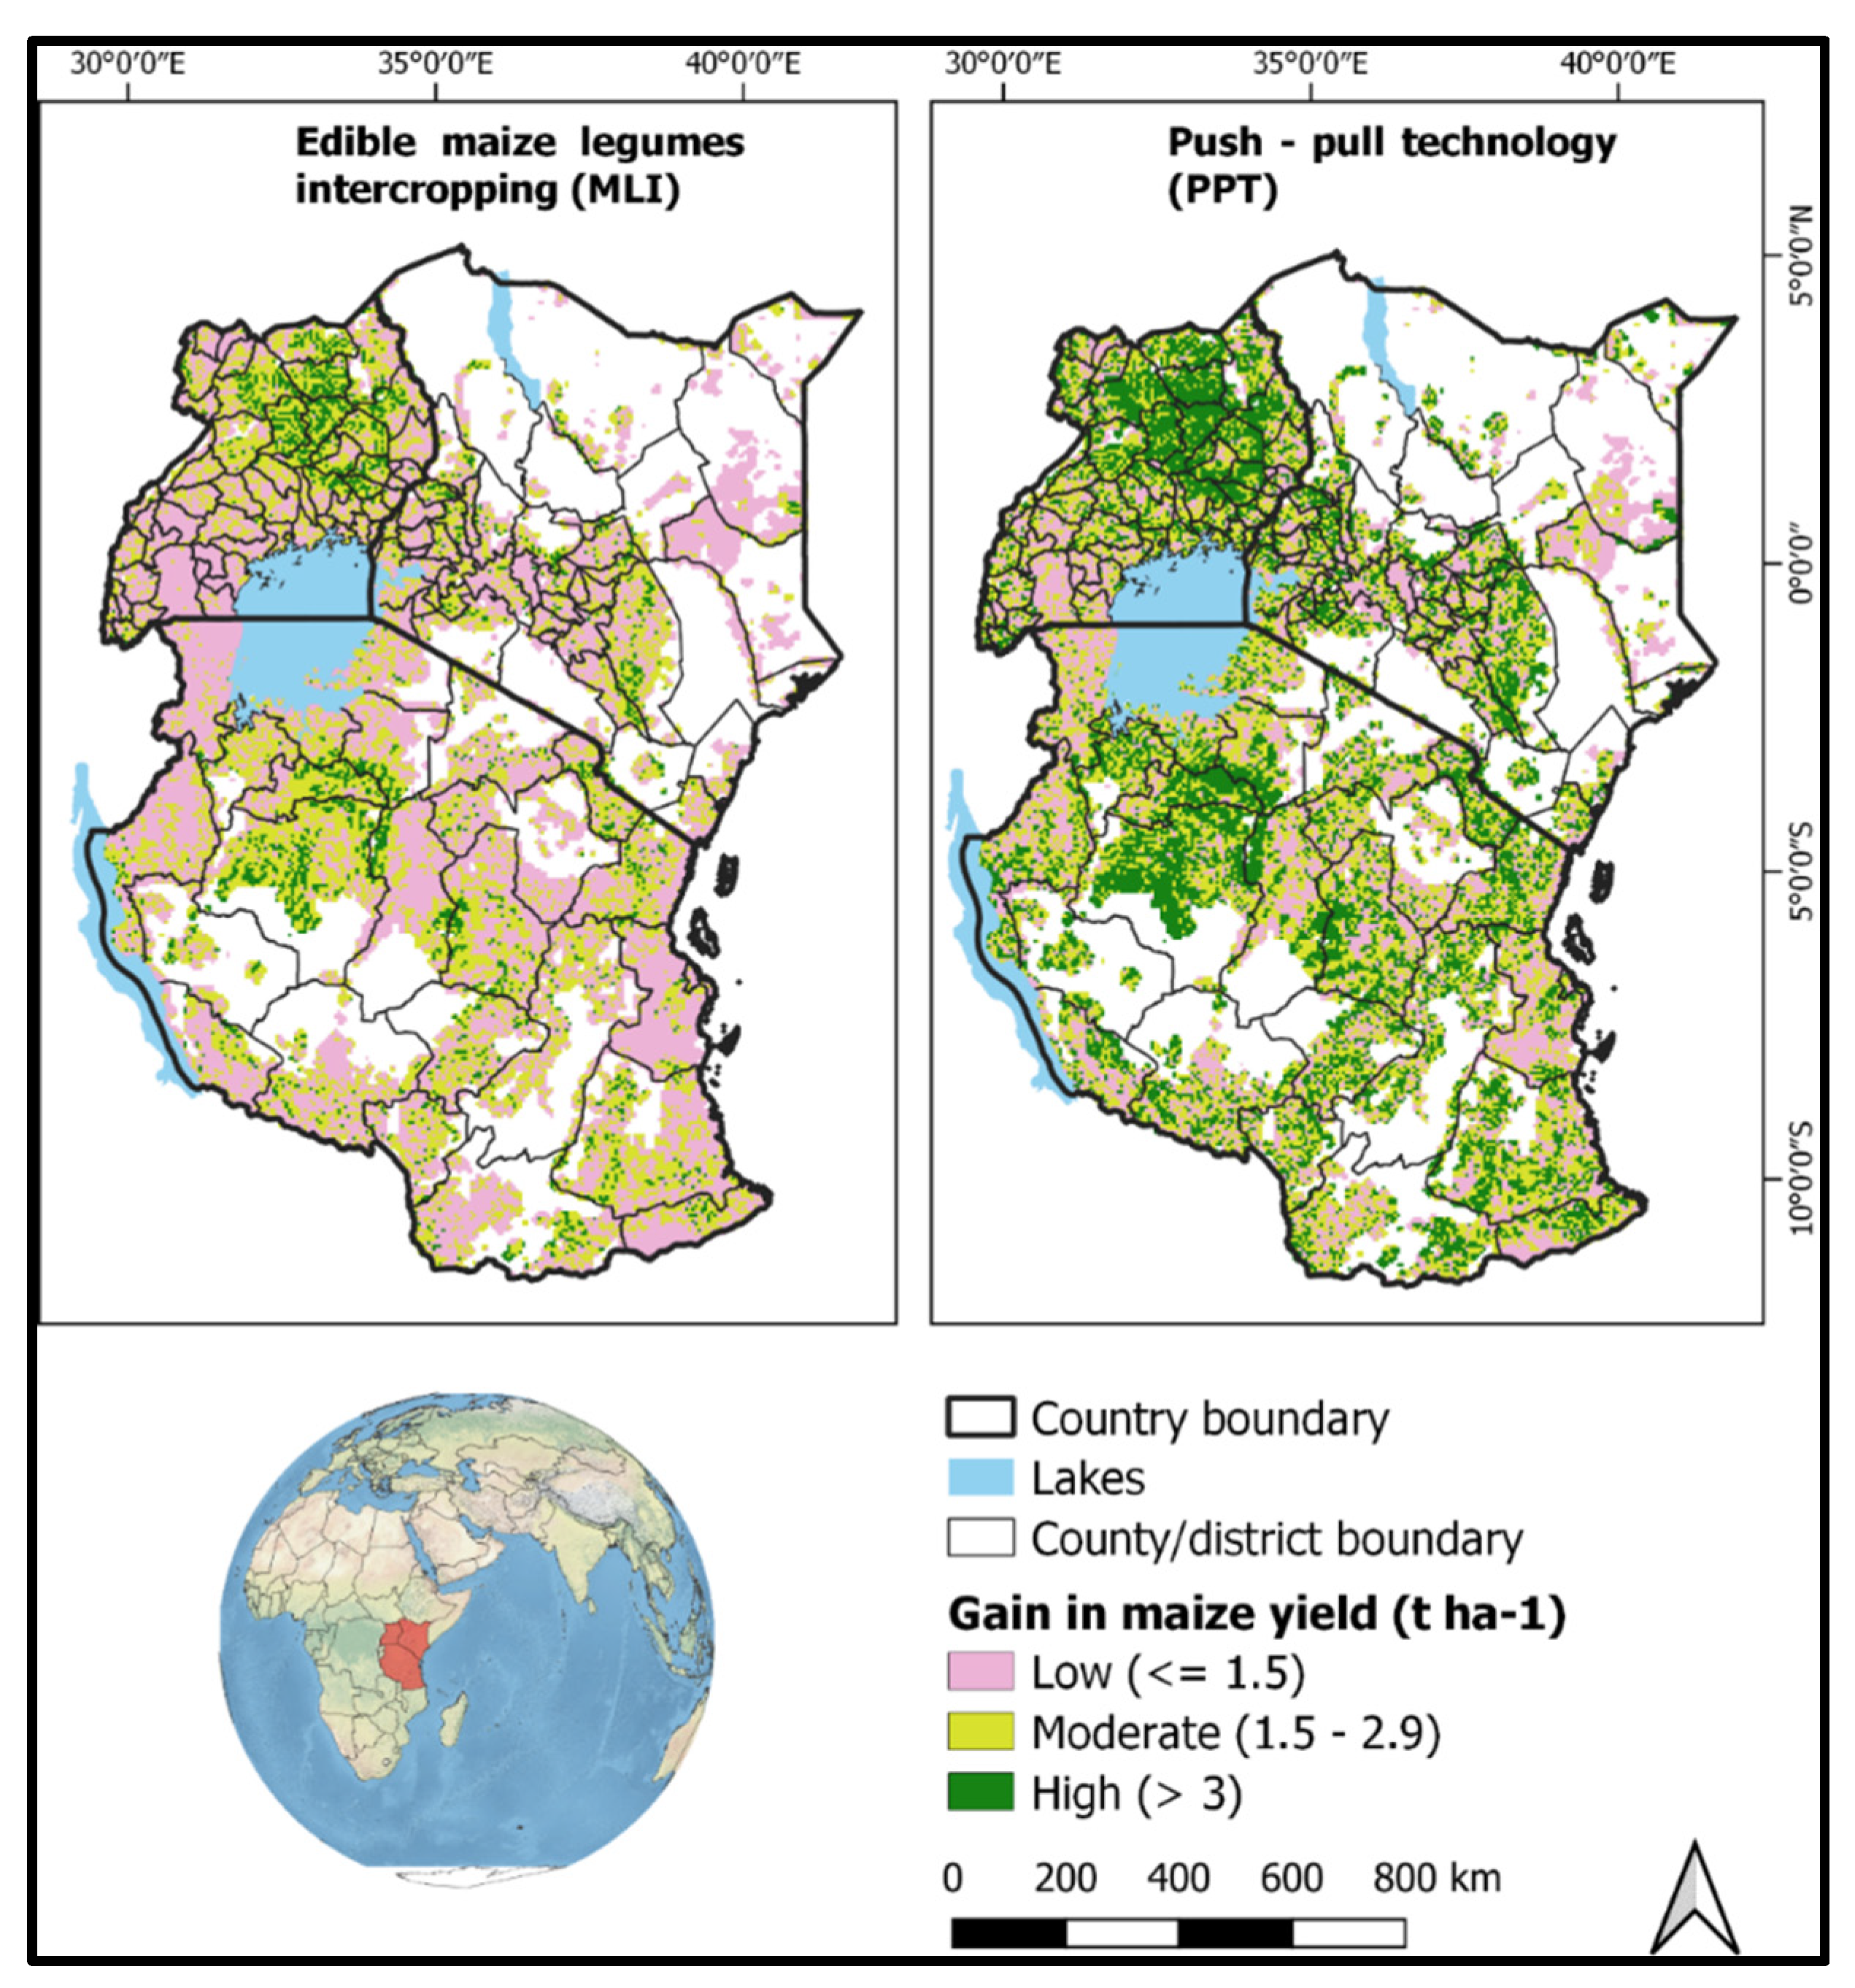
Figure 4 presents the geographical representation of gain in maize yield due to the MIL and PPT systems compared to the monocropping system. The maps show that Northern and Eastern Uganda, Tabora and Shinyanga districts in Tanzania and some belts around the Rift Valley and Eastern Kenya have moderate and high-yield trends under the MLI and PPT systems. But the increment in maize yield under PPT is more pronounced.
Moreover, the histograms in Figure 5 show the distribution of the predicted maize yield under each cropping system. The histogram reinforced the finding that there was a progressive increment in maize yield due to the use of the monocropping (µ = 1.83 t ha−1), MLI (µ = 2.84 t ha−1), and PPT (µ = 3.79 t ha−1) systems. This indicates that East African farmers would increase their annual maize yield by about 1.01 and 1.96 rates under MLI and PPT, respectively. The indicators of good model performance are low variabilities (standard deviation range 0.7–1.1) and skewness (range of absolute values of 0.03–0.09).

4. Discussion

This study presents a data-based method for building regression models to map maize yield under three farming practices, viz., monocropping, MLI, and PPT, using climatic and edaphic variables as predictors. The study first compared the FG and SR modelling approaches, with the SR (RMSE < 0.09) and R2 = 0.99) performing better than the FG (RMSE < 2 and R2 from 0.87–0.90) in fitting the data. The best-fitted model (SR) used for the spatial analysis in the present study performed well on the experimental maize yield data for the nine farms, showing highly accurate yield predictions. The three maize farming systems under which yield was predicted are the commonly used systems in East Africa.
The monocropping system is the region’s most commonly used cropping system. This is attributed to the fact that poorer East African farmers preferred monocrops, such as maize, due to the minimal production inputs required [50,51]. On the other hand, recently, farmers have been introduced to sustainable agronomic practices like MLI and PPT to maximize land use and reduce risks due to crop pests and climate shocks. Our study provided a maize yield prediction model under these cropping systems and further compared the estimates among these cropping systems and the study countries. Moreover, we estimated the gain in maize yield due to the implementation of the MLI and PPT systems. Our study is the first attempt to employ an advanced artificial intelligence algorithm for predicting crop yield under MLI and PPT treatments at scale. Crop yield predictions are mainly made for monocropping systems using conventional empirical modelling approaches [27]. However, such approaches either require a large sample size to avoid the Hughes (i.e., overfitting) problem or several experimental parameters that might not always be available [30].
Generally, the SR algorithm reliably unravels the intrinsic relationships in the maize yield and predictor variable dataset (RMSE of <0.09 and R2 of >0.9). In addition, our high modelling performance confirms the ability of advanced artificial intelligence and citizen science [29] to bypass the limitation of conventional empirical algorithms by correctly learning from incomplete, noisy experimental data [30]. In this study, the SR model predicted that more than 90% of maize yield variability could be explained by the predictor variables when only nine yield data points were used. Furthermore, our study suggests that the MLI and PPT systems can improve maize yield by about 1.01 and 1.96 rates, respectively, compared to the monocropping system. This is consistent with other study findings that showed better maize yield under MLI and PPT than under monocropping systems [16,21,52,53]. When the simulated yield under the monocropping system in each country was compared to the reported yield records [42], the results showed that Tanzania had a higher maize yield deviation (29%), followed by Uganda (10%) and Kenya (4%). This trend could be due to the nature of the data, which is not well distributed across the three countries. For instance, Tanzania has only one experimental plot compared to Kenya and Uganda, which had four plots each. This may explain the low performance of our model in Tanzania. Moreover, we used a data-driven model that accurately predicted maize yield, as observed from the low-predicted yield deviations and skewness values.
In addition, relatively higher agronomic advantages could explain maize yield under the MLI and PPT systems in terms of nutrient fixation and soil organic matter improvement [23], low pest infestation, and climate resilience [16]. Despite the general trend of yield improvement in the study area using MLI and PPT compared to monocropping, some sites in the three study countries showed low maize yield gain under all the treatments. We observed that these sites are mainly in areas of low soil fertility, i.e., the soil parameters were clustered around a very low value. Moreover, these sites might already have optimum maize production conditions or high crop production constraints.
Our study guides the upscaling of MLI and PPT by creating awareness and public-private partnerships to ensure the increased adoption of these farming systems. Despite the potentially increasing maize yield due to both MLI and PPT, as observed in this study, each technology provides an added value in terms of food and nutrition security, especially for small-scale farmers. Thus, a hybrid practice combining both techniques should be developed to increase their adoption rate among African farmers and spread these technologies. Nevertheless, this study’s experimental maize yield data might have been affected by other confounding factors like fall armyworm, stem/stalk borers, and Striga weed. Hence, extrapolating our experimental findings to a regional scale might be a source of bias in our modelling results. However, the effect of the confounding factors on maize yield could have been minor, as our simulated yield data under the monocropping system were comparable to the previously reported yield records [42]. In addition, our study targets the benefits in yield that East African farmers can gain when they use sustainable farming practices toward a conservation biological control approach, as opposed to the agronomic process of yield growth.
Nevertheless, further studies should investigate the possibility of comparing multiple AI methods, such as random forest regression, gradient boosting regression, deep neural network regression, and SR. Moreover, the biological control options, that has been reported to significantly reduce pests’ population [54,55,56,57], could be integrated into the maize yield prediction models. Since our study showed better maize yield under the MLI and PPT systems, these technologies’ scaling up should be accompanied by increased farmers’ information and communications technology (ICT) tools and device accessibility. Nevertheless, it is well known that African farmers have limited ICT tools in agriculture [58]. This could also limit the farmers’ practices, as they do not access pertinent information.

5. Conclusions

This study used a data-driven approach to predict the potential maize yield under MLI and PPT compared to the monocropping system. The results showed highly accurate fitting results, as indicated by RMSE (<0.009) and R2 (>90%). In addition, the simulated maize yield was comparable (4% difference in Kenya, for instance) to the previously reported yield records. In addition, our model performance was fairly good, as indicated by descriptive statistic metrics. Our study is the first attempt to predict maize yield under the MLI and PPT systems using artificial intelligence algorithms at a regional scale. It is recommended that future studies should integrate other crop production constraints like crop insect pests, disease, weeds, and biological control agents in modelling maize yield. Overall, the present study provides yield estimates information at a macro scale that better illustrates the benefit of using sustainable farming practices to attain food and nutrition security in SSA.

Author Contributions

K.M.A., H.E.Z.T., E.M.A.-R. and S.N. designed the project and the methodology. K.M.A. was primarily responsible for data collection and analysis. The manuscript was written by K.M.A., with contributions and editing from H.E.Z.T., J.O., O.M., S.N. and E.M.A.-R. All authors have read and agreed to the published version of the manuscript.

Funding

The first author of this study is supported by the German Academic Exchange Service’s In-Region Postgraduate Scholarship (DAAD). The study received financial support from the USAID/OFDA through the project titled “Reinforcing and Expanding the Community-Based Fall Armyworm Spodoptera frugiperda (Smith) Monitoring, Forecasting for Early Warning and Timely Management to Protect Food Security and Improve Livelihoods of Vulnerable Communities—CBFAMFEW II” grant Number “720FDA20IO00133”. The authors also gratefully acknowledge the financial support for this study by the following organizations and agencies: the Swedish International Development Cooperation Agency (Sida); the Swiss Agency for Development and Cooperation (SDC); the Federal Democratic Republic of Ethiopia; and the Government of the Republic of Kenya. The views expressed herein do not necessarily reflect the official opinion of the donors.

Institutional Review Board Statement

Not applicable.

Informed Consent Statement

Not applicable.

Data Availability Statement

The data that support the findings of this study are available permanently and for free online at the International Centre of Insect Physiology and Ecology (ICIPE) data warehouse through the following link: https://dmmg.icipe.org/dataportal/dataset/a-symbolic-regression-model-for-estimating-attainable-maize-yield (accessed on 19 September 2022).

Conflicts of Interest

The authors declare no conflict of interest.

References

  1. Thorne, P.J. Maize as Food, Feed, and Fertiliser in Intensifying Crop-livestock Systems in East and Southern Africa: An Ex Ante Impact Assessment of Technology Interventions to Improve Smallholder Welfare; ILRI (aka ILCA and ILRAD): Nairobi, Kenya, 2002; Volume 11. [Google Scholar]
  2. Okweche, S.I.; Ogunwolu, E.O.; Adeyemo, M.O. Parameters, Interrelationships with Yield and use of Carbofuran to Control Stem Borers in Maize (Zea mays L.) at Makurdi in the Nigerian Southern Guinea Savanna. Greener J. Agric. Sci. 2013, 3, 702–708. [Google Scholar] [CrossRef]
  3. Niassy, S.; Agbodzavu, M.K.; Kimathi, E.; Mutune, B.; Abdel-Rahman, E.F.M.; Salifu, D.; Hailu, G.; Belayneh, Y.T.; Felege, E.; Tonnang, H.E.Z.; et al. Bioecology of fall armyworm Spodoptera frugiperda (J. E. Smith), its management and potential patterns of seasonal spread in Africa. PLoS ONE 2021, 16, e0249042. [Google Scholar] [CrossRef] [PubMed]
  4. Mustroph, A. Improving Flooding Tolerance of Crop Plants. Agronomy 2018, 8, 160. [Google Scholar] [CrossRef] [Green Version]
  5. Gomez-Zavaglia, A.; Mejuto, J.; Simal-Gandara, J. Mitigation of emerging implications of climate change on food production systems. Food Res. Int. 2020, 134, 109256. [Google Scholar] [CrossRef]
  6. Dessie, A.B.; Abate, T.M.; Mekie, T.M.; Liyew, Y.M. Crop diversification analysis on red pepper dominated smallholder farming system: Evidence from northwest Ethiopia. Ecol. Process. 2019, 8, 50. [Google Scholar] [CrossRef] [Green Version]
  7. Launer, J. Monkey Business. Postgrad. Med. J. 2015, 91, 117–118. [Google Scholar] [CrossRef] [Green Version]
  8. Tonnang, H.E.; Hervé, B.D.; Biber-Freudenberger, L.; Salifu, D.; Subramanian, S.; Ngowi, V.B.; Guimapi, R.Y.; Anani, B.; Kakmeni, F.M.; Affognon, H.; et al. Advances in crop insect modelling methods—Towards a whole system approach. Ecol. Model. 2017, 354, 88–103. [Google Scholar] [CrossRef] [Green Version]
  9. Peace, N. Impact of Climate Change on Insects, Pest, Diseases and Animal Biodiversity. Int. J. Environ. Sci. Nat. Resour. 2020, 23, 151–153. [Google Scholar] [CrossRef]
  10. Ari, D.; Alagoz, B.B. An effective integrated genetic programming and neural network model for electronic nose calibration of air pollution monitoring application. Neural Comput. Appl. 2022, 34, 12633–12652. [Google Scholar] [CrossRef]
  11. Kfir, R.; Overholt, W.A.; Khan, Z.R.; Polaszek, A. Biology and Management of Economically Important Lepidopteran Cereal Stem Borers in Africa. Annu. Rev. Èntomol. 2002, 47, 701–731. [Google Scholar] [CrossRef]
  12. De Groote, H.; Kimenju, S.C.; Munyua, B.; Palmas, S.; Kassie, M.; Bruce, A. Spread and impact of fall armyworm (Spodoptera frugiperda J. E. Smith) in maize production areas of Kenya. Agric. Ecosyst. Environ. 2020, 292, 106804. [Google Scholar] [CrossRef] [PubMed]
  13. Johnson, S.J. Migration and the life history strategy of the fall armyworm, Spodoptera frugiperda in the western hemisphere. Int. J. Trop. Insect. Sci. 1987, 8, 543–549. [Google Scholar] [CrossRef]
  14. Tinoco-Ojanguren, R.; Halperin, D.C. Poverty, Production, and Health: Inhibition of Erythrocyte Cholinesterase via Occupational Exposure to Organophosphate Insecticides in Chiapas, Mexico. Arch. Environ. Health Int. J. 1998, 53, 29–35. [Google Scholar] [CrossRef] [PubMed]
  15. Maitra, S.; Shankar, T.; Banerjee, P. Potential and Advantages of Maize-Legume Intercropping System. In Maize-Production and Use; IntechOpen: London, UK, 2020. [Google Scholar] [CrossRef] [Green Version]
  16. Midega, C.A.; Pittchar, J.O.; Pickett, J.A.; Hailu, G.W.; Khan, Z.R. A climate-adapted push-pull system effectively controls fall armyworm, Spodoptera frugiperda (J. E. Smith), in maize in East Africa. Crop. Prot. 2017, 105, 10–15. [Google Scholar] [CrossRef]
  17. Iqbal, N.; Hussain, S.; Zhang, X.-W.; Yang, C.-Q.; Raza, M.A.; Deng, J.-C.; Ahmad, S.; Ashgar, M.A.; Zhang, J.; Yang, W.; et al. Imbalance Water Deficit Improves the Seed Yield and Quality of Soybean. Agronomy 2018, 8, 168. [Google Scholar] [CrossRef] [Green Version]
  18. Asseng, S.; Zhu, Y.; Basso, B.; Wilson, T.; Cammarano, D. Simulation Modeling: Applications in Cropping Systems. Encycl. Agric. Food Syst. 2014, 102–112. [Google Scholar] [CrossRef]
  19. Yu, Y. Crop Yields in Intercropping. Ph.D. Thesis, Wageningen University, Wageningen, The Netherlands, 20 April 2016. [Google Scholar]
  20. Khan, Z.R.; Midega, C.A.O.; Pittchar, J.O.; Murage, A.W.; Birkett, M.; Bruce, T.; Pickett, J.A. Achieving food security for one million sub-Saharan African poor through push-pull innovation by 2020. Philos. Trans. R. Soc. B Biol. Sci. 2014, 369, 20120284. [Google Scholar] [CrossRef] [PubMed] [Green Version]
  21. Midega, C.A.O.; Bruce, T.J.A.; Pickett, J.A.; Khan, Z.R. Ecological management of cereal stemborers in African smallholder agriculture through behavioural manipulation. Ecol. Èntomol. 2015, 40, 70–81. [Google Scholar] [CrossRef] [Green Version]
  22. Hailu, G.; Niassy, S.; Khan, Z.R.; Ochatum, N.; Subramanian, S. Maize-legume intercropping and push-pull for management of fall armyworm, stemborers, and striga in Uganda. Agron. J. 2018, 110, 2513–2522. [Google Scholar] [CrossRef]
  23. Ndayisaba, P.C.; Kuyah, S.; Midega, C.A.O.; Mwangi, P.N.; Khan, Z.R. Push-pull technology improves carbon stocks in rainfed smallholder agriculture in Western Kenya. Carbon Manag. 2022, 13, 127–141. [Google Scholar] [CrossRef]
  24. Bell, J.R.; Aralimarad, P.; Lim, K.-S.; Chapman, J.W. Predicting Insect Migration Density and Speed in the Daytime Convective Boundary Layer. PLoS ONE 2013, 8, e54202. [Google Scholar] [CrossRef] [PubMed]
  25. Liebhold, A.M.; Tobin, P.C. Population Ecology of Insect Invasions and Their Management. Annu. Rev. Èntomol. 2008, 53, 387–408. [Google Scholar] [CrossRef] [Green Version]
  26. Thornton, P.K.; Jones, P.G.; Alagarswamy, G.; Andresen, J. Spatial variation of crop yield response to climate change in East Africa. Glob. Environ. Chang. 2009, 19, 54–65. [Google Scholar] [CrossRef]
  27. Shirley, R.; Pope, E.; Bartlett, M.; Oliver, S.; Quadrianto, N.; Hurley, P.; Duivenvoorden, S.; Rooney, P.; Barrett, A.B.; Kent, C.; et al. An empirical, Bayesian approach to modelling crop yield: Maize in USA. Environ. Res. Commun. 2020, 2, 025002. [Google Scholar] [CrossRef]
  28. Xie, Y. Values and limitations of statistical models. Res. Soc. Strat. Mobil. 2011, 29, 343–349. [Google Scholar] [CrossRef] [PubMed] [Green Version]
  29. Karpatne, A.; Atluri, G.; Faghmous, J.H.; Steinbach, M.; Banerjee, A.; Ganguly, A.; Shekhar, S.; Samatova, N.; Kumar, V. Theory-Guided Data Science: A New Paradigm for Scientific Discovery from Data. IEEE Trans. Knowl. Data Eng. 2017, 29, 2318–2331. [Google Scholar] [CrossRef]
  30. Reinbold, P.A.K.; Kageorge, L.M.; Schatz, M.F.; Grigoriev, R.O. Robust learning from noisy, incomplete, high-dimensional experimental data via physically constrained symbolic regression. Nat. Commun. 2021, 12, 3219. [Google Scholar] [CrossRef] [PubMed]
  31. Lughofer, E.; Kronberger, G.; Kommenda, M.; Saminger-Platz, S.; Promberger, A.; Nickel, F.; Winkler, S.; Affenzeller, M. Robust Fuzzy Modeling and Symbolic Regression for Establishing Accurate and Interpretable Prediction Models in Supervising Tribological Systems. In Proceedings of the 8th International Joint Conference on Computational Intelligence-FCTA, Porto, Portugal, 9–11 November 2016; pp. 51–63. [Google Scholar] [CrossRef]
  32. Ashok, D.; Scott, J.; Wetzel, S.; Panju, M.; Ganesh, V. Logic guided genetic algorithms. arXiv 2020, arXiv:2010.11328. [Google Scholar]
  33. Schmidt, M.; Lipson, H. Distilling Free-Form Natural Laws from Experimental Data. Science 2009, 324, 81–85. [Google Scholar] [CrossRef] [PubMed]
  34. Jin, Y.; Fu, W.; Kang, J.; Guo, J.; Guo, J. Bayesian Symbolic Regression. arXiv 2019, arXiv:1910.08892. [Google Scholar]
  35. Udrescu, S.-M.; Tegmark, M. AI Feynman: A physics-inspired method for symbolic regression. Sci. Adv. 2020, 6, eaay2631. [Google Scholar] [CrossRef] [PubMed] [Green Version]
  36. Eren, Y.; Küçükdemiral, İ.B.; Üstoğlu, İ. Introduction to Optimization. In Optimization in Renewable Energy Systems; Elsevier: Amsterdam, The Netherlands, 2017; pp. 27–74. [Google Scholar]
  37. Jamielniak, J.A. A mathematical approach to study stress-related behaviors in captive golden-bellied capuchins (Sapajus xanthosthernos). Comput. Ecol. Softw. 2016, 6, 83. [Google Scholar]
  38. Zadeh, L.A. Fuzzy sets. Inf. Control. 1965, 8, 338–353. [Google Scholar] [CrossRef] [Green Version]
  39. Keshwani, D.R.; Jones, D.D.; Meyer, G.E.; Brand, R.M. Rule-based Mamdani-type fuzzy modeling of skin permeability. Appl. Soft Comput. 2008, 8, 285–294. [Google Scholar] [CrossRef] [Green Version]
  40. Center, B.; Verma, B.P. Fuzzy Logic for Biological and Agricultural Systems. In Artificial Intelligence for Biology and Agriculture; Springer: Berlin/Heidelberg, Germany, 1998; pp. 213–225. [Google Scholar]
  41. Bala, K.; Thakur, S.; Singh, V. Effect of plant nutrition in insect pest management: A Review. J. Pharmacogn. Phytochem. 2018, 7, 2737. [Google Scholar]
  42. FAOSTAT. Crops and Livestock Products. 2020. Available online: https://www.fao.org/faostat/en/#data/QCL (accessed on 30 January 2022).
  43. Fick, S.E.; Hijmans, R.J. WorldClim 2: New 1-km spatial resolution climate surfaces for global land areas. Int. J. Climatol. 2017, 37, 4302–4315. [Google Scholar] [CrossRef]
  44. Booth, T.H. Why understanding the pioneering and continuing contributions of BIOCLIM to species distribution modelling is important. Austral. Ecol. 2018, 43, 852–860. [Google Scholar] [CrossRef] [Green Version]
  45. I.F.P.R. Institute. Spatially-Disaggregated Crop Production Statistics Data in Africa South of the Sahara for 2017. Harv. Dataverse 2020, V2. [Google Scholar] [CrossRef]
  46. Q.D. Team. QGIS Geographic Information System; Open Source Geospatial Foundation: Chicago, IL, USA, 2009. [Google Scholar]
  47. Ruggiero, R. TuringBot [Computer Software]. 2020. Available online: https://turingbotsoftware.com/ (accessed on 19 September 2022).
  48. Van Rossum, G.; Drake, F.L., Jr. Python Tutorial; Centrum voor Wiskunde en Informatica: Amsterdam, The Netherlands, 1995; Volume 620. [Google Scholar]
  49. R Core Team. A Language and Environment for Statistical Computing; R Foundation for Statistical Computing: Vienna, Austria, 2020. [Google Scholar]
  50. Wynants, M.; Kelly, C.; Mtei, K.; Munishi, L.; Patrick, A.; Rabinovich, A.; Nasseri, M.; Gilvrear, D.; Roberts, N.; Boeckx, P.; et al. Drivers of increased soil erosion in East Africa’s agro-pastoral systems: Changing interactions between the social, economic and natural domains. Reg. Environ. Chang. 2019, 19, 1909–1921. [Google Scholar] [CrossRef] [Green Version]
  51. Blaikie, P.; Brookfield, H. Land Degradation and Society; Routledge: London, UK, 2015. [Google Scholar]
  52. Khan, Z.R.; Midega, C.A.O.; Bruce, T.; Hooper, A.; Pickett, J.A. Exploiting phytochemicals for developing a ‘push-pull’ crop protection strategy for cereal farmers in Africa. J. Exp. Bot. 2010, 61, 4185–4196. [Google Scholar] [CrossRef] [Green Version]
  53. Khan, Z.R.; Pickett, J.A. The ‘push-pull’ strategy for stemborer management: A case study in exploiting biodiversity and chemical ecology. In Ecological Engineering for Pest Management: Advances in Habitat Manipulation for Arthropods; CSIRO Publishing: Clayton, Australia, 2004; pp. 155–164. [Google Scholar] [CrossRef]
  54. Agboka, K.M.; Tonnang, H.E.Z.; Abdel-Rahman, E.M.; Odindi, J.; Mutanga, O.; Mohamed, S.A. A Fuzzy-Based Model to Predict the Spatio-Temporal Performance of the Dolichogenidea gelechiidivoris Natural Enemy against Tuta absoluta under Climate Change. Biology 2022, 11, 1280. [Google Scholar] [CrossRef] [PubMed]
  55. Sambo, S.M.; Akutse, K.S.; du Plessis, H.; Aigbedion-Atalor, P.O.; Mohamed, S.A.; Ndlela, S. Interactions between the Entomopathogenic Fungus Metarhizium anisopliae ICIPE 20 and the Endoparasitoid Dolichogenidea gelechiidivoris, and Implications for Combined Biocontrol of Tuta absoluta. Biology 2022, 11, 1323. [Google Scholar] [CrossRef] [PubMed]
  56. Gwokyalya, R.; Herren, J.K.; Weldon, C.W.; Khamis, F.M.; Ndlela, S.; Mohamed, S.A. Differential immune responses in new and old fruit fly-parasitoid associations: Implications for their management. Front. Physiol. 2022, 13, 945370. [Google Scholar] [CrossRef] [PubMed]
  57. Agboka, K.M.; Tonnang, H.E.; Abdel-Rahman, E.M.; Kimathi, E.; Mutanga, O.; Odindi, J.; Niassy, S.; Mohamed, S.A.; Ekesi, S. A systematic methodological approach to estimate the impacts of a classical biological control agent’s dispersal at landscape: Application to fruit fly Bactrocera dorsalis and its endoparasitoid Fopius arisanus. Biol. Control 2022, 175, 105053. [Google Scholar] [CrossRef]
  58. FAO. Information and Communication Technology (ICT) in Agriculture: A Report to the G20 Agricultural Deputies; Food and Agriculture Organization: Rome, Italy, 2017. [Google Scholar]
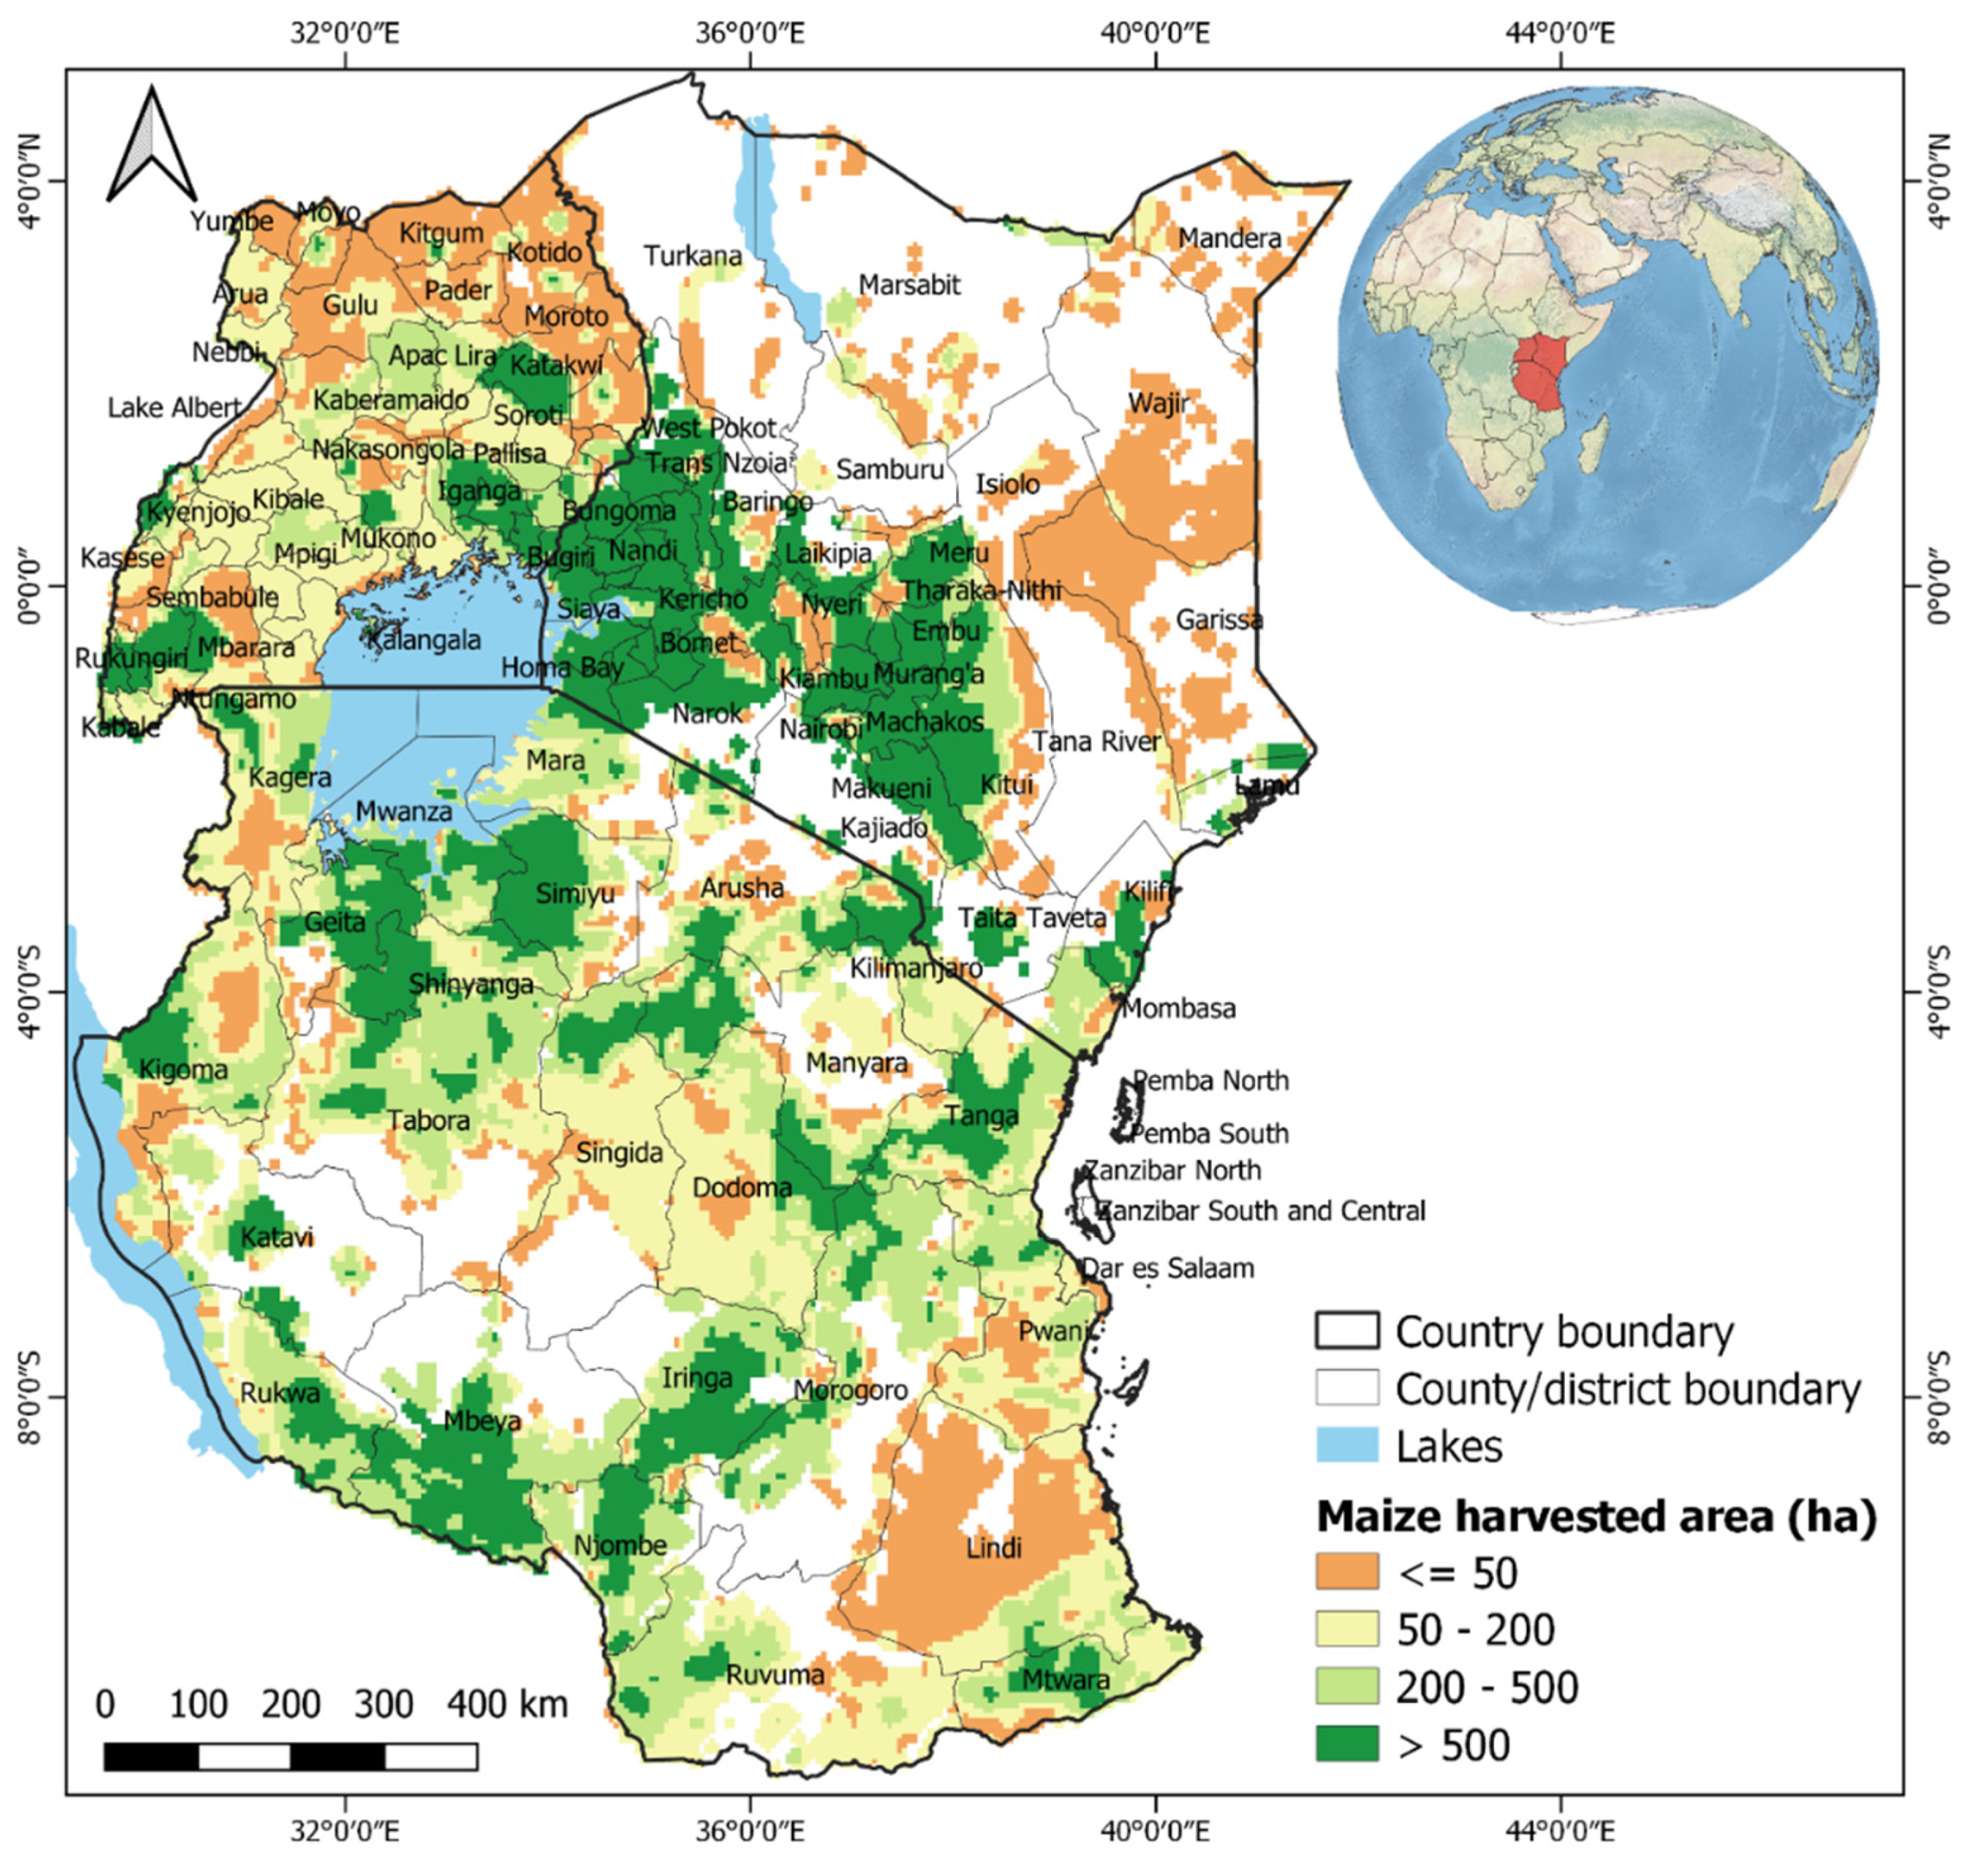
Figure 1. Map of the study area overlaid on the maize harvested area (ha).
Agronomy 12 03085 g001
Figure 2. Dendrogram obtained from cluster analysis with Pearson correlation coefficient.
Agronomy 12 03085 g002
Figure 3. Graphical representation of potential maize yield (t ha−1) under monocropping, maize legumes intercropping (MLI), and push-pull technology (PPT) systems predicted using rainfall and temperature variables.
Agronomy 12 03085 g003
Figure 4. Geographical representation of gain in maize yield (t ha−1) as a result of using the maize legume intercropping (MLI) and push-pull technology (PPT) systems in comparison with the monocropping system.
Agronomy 12 03085 g004
Figure 5. Distribution histogram fit for predicted maize yield (t ha−1) under monocropping, maize legume intercropping (MLI), and push-pull technology (PPT) systems.
Agronomy 12 03085 g005
Table 1. Model comparison in predicting maize yield class coverage (t ha−1) under monocropping, maize–legume intercropping (MLI), and push-pull (PPT) systems.
Fuzzy GeneticSymbolic Regression
TreatmentsR2RMSER2RMSE
Monocropping0.901.520.990.07
MLI systems0.871.850.990.06
PPT systems0.891.610.990.10
Table 2. Maize yield class coverage (%) under the monocropping, maize-legume intercropping (MLI), and push-pull (PPT) systems in the entire study area.
Maize Yield ClassMonocropping %MLI Systems %PPT Systems %
Low (0–1.5 t ha−1)57.009.003.0
Moderate (1.5–3.0 t ha−1)43.051.025.0
High (>3 t ha−1)None40.072.0
Table 3. Performance assessment of the developed symbolic regression modelling approach for predicting maize yield under the monocropping system in each study country.
CountryReported Mean Maize Yield (t ha−1)Simulated Mean Maize Yield (t ha−1)Yield Deviation (%)
Kenya1.641.604
Uganda1.691.5910
Tanzania2.692.4029
Publisher’s Note: MDPI stays neutral with regard to jurisdictional claims in published maps and institutional affiliations.