Article

Determination of Cassava Leaf Area for Breeding Programs

by
Phanupong Phoncharoen
1,
Poramate Banterng
1,2,*,
Nimitr Vorasoot
1,
Sanun Jogloy
1,2 and
Piyada Theerakulpisut
3
1
Department of Agronomy, Faculty of Agriculture, Khon Kaen University, Khon Kaen 40002, Thailand
2
Plant Breeding Research Center for Sustainable Agriculture, Faculty of Agriculture, Khon Kaen University, Khon Kaen 40002, Thailand
3
Department of Biology, Faculty of Science, Khon Kaen University, Khon Kaen 40002, Thailand
*
Author to whom correspondence should be addressed.
Agronomy 2022, 12(12), 3013; https://doi.org/10.3390/agronomy12123013
Submission received: 3 November 2022 / Revised: 22 November 2022 / Accepted: 27 November 2022 / Published: 29 November 2022
(This article belongs to the Special Issue Recent Advances in Crop Modelling)

Abstract

:
The evaluation of leaf area provides valuable information for decision-making for the cassava yield trail. The objectives of this study were (1) to determine the relationship between the leaf area and yield of the segregating populations and (2) to investigate the suitable mathematical model for calculating cassava leaf area. The single-row trial for 60 segregating progenies of Kasetsart 50 × CMR38–125–77 was conducted from 2021 to 2022. The trial for eighteen progenies and the Kasetsart 50 and CMR38–125–77 was carried out in 2022. The sampled leaves for each genotype were collected to measure the leaf area. The length (L) and width of the central lobe (W), number of lobes (N), the product of the length and width (L × W; K), and the product of the length and number of lobes (L × N; J) were recorded for developing the mathematical models. The result showed that there were statistically significant correlations between the maximum individual leaf area and the total crop fresh weight and storage root fresh weight. The mathematical model LA = −3.39L + 2.04K + 1.01J − 15.10 is appropriate to estimate the maximum individual leaf area and leaf area index (LAI). This mathematical model also provided the estimated individual maximum leaf area that had the highest correlation with actual biomass at the final harvest as compared to the other three functions. The results showed statistical significance for the estimated LAI and biomass correlation.

1. Introduction

Cassava (Manihot esculenta Crantz) is an important economic crop used as a material source for human food, animal feed, and industrial products [1]. Thailand is one of the most significant cassava producers and exports approximately 80 percent of the world trade [2]. However, the average yield for cassava in Thailand was lower than the expected yield (accounting for 20.3 t ha−1) [3]. The investigation of the superior cassava genotypes is a worthwhile investment to improve crop productivity.
The selection of the best cassava genotypes for multiple environments has been generally carried out based on storage root yield, harvest index, and starch content [4,5,6,7]. These crop traits, however, involve a high proportion of the interaction between genotypes and environments, which leads to the different performance of a particular genotype in various environments, and ultimately the difficulty of selection. The additional crop traits could provide more explanation in terms of crop behavior, leading to better selection. In addition, the use of other yield–related traits as criteria for selection may improve the efficiency of cultivar selection.
The cassava leaf acts as a photosynthetic organ, and it is an essential part to support plant growth [8]. Previous studies have illustrated that leaf area is a key factor to drive cassava growth and biomass, and the ratio of cassava leaf area to the unit of ground area (leaf area index; LAI) was also related to cassava yield [9,10,11,12,13,14,15]. The information based on the cassava crop simulation model also demonstrated that the LAI is a determinant criterion of yield potential [9]. In addition, the simulated results by the MANIHOT model showed that the maximum individual leaf area was related to LAI, aboveground biomass, and storage root yield. A parameter of maximum individual leaf area in the MANIHOT model showed the potential as an alternative criterion to improve selection efficiency for high storage root yield [16]. There was evidence from the MANIHOT model to show that the cassava genotypes with a high value of maximum individual leaf area had high simulated storage root yield for some planting dates and growing areas [17,18,19]. To prove the potential of leaf area as an important trait for cassava yield trials, the relationship between this trait and cassava biomass based on the data from actual yield trials is necessary to explore. The information on this issue is not only useful for more understanding of crop performance and better decision-making in varietal selection but it can also be applied for further designing a cassava ideotype for different growing environments to obtain the maximum yield.
The crop leaf area can be measured by both direct and indirect methods. The direct method requires separating the leaves from the plant, and the leaf area is directly measured using tools such as a leaf area meter. However, this approach is difficult to operate in the early stage of the cassava yield trial, due to the few populations for each genotype. The indirect method might be a valuable option for determining the cassava leaf area in the early stage of the cassava yield trial. This method involves the theory of the correlation between the actual leaf area and the leaf dimensions such as the length, width, or the product of both. Leaf area estimations by using mathematical models have been reported in many crops such as magnolia [20], squash [21], olive [22], sunflower [23], faba bean [24], and chestnut [25]. This indirect method would be an alternative way to measure the leaf area for the cassava yield trial with low cost and without crop destruction [26].
Estimating leaf area in cassava using mathematic models based on leaf dimensions has been reported. Zanetti et al. [27] presented several regression functions to estimate the leaf area for only a single cassava genotype (IAC 576–70) with Oblong lanceolate–shape lobes. Trachta et al. [28] recommended the “specific” equation to estimate the leaf area for the Vassourinha genotype with linear shape lobes, and they preferred the “general without Vassourinha” equation when estimating the leaf area of the other 14 genotypes with elliptical lanceolate-shaped lobes. However, the report about leaf area estimation has not been found for the other cassava genotypes with lanceolate-shaped lobes, such as Kasetsart 50, a widespread commercial cassava genotype in Thailand and Southeast Asia [29]. The objectives of this study were to (1) determine the relationship between the maximum individual leaf area and the storage root yield of the segregating populations and (2) investigate the suitable mathematical models to estimate cassava leaf area.

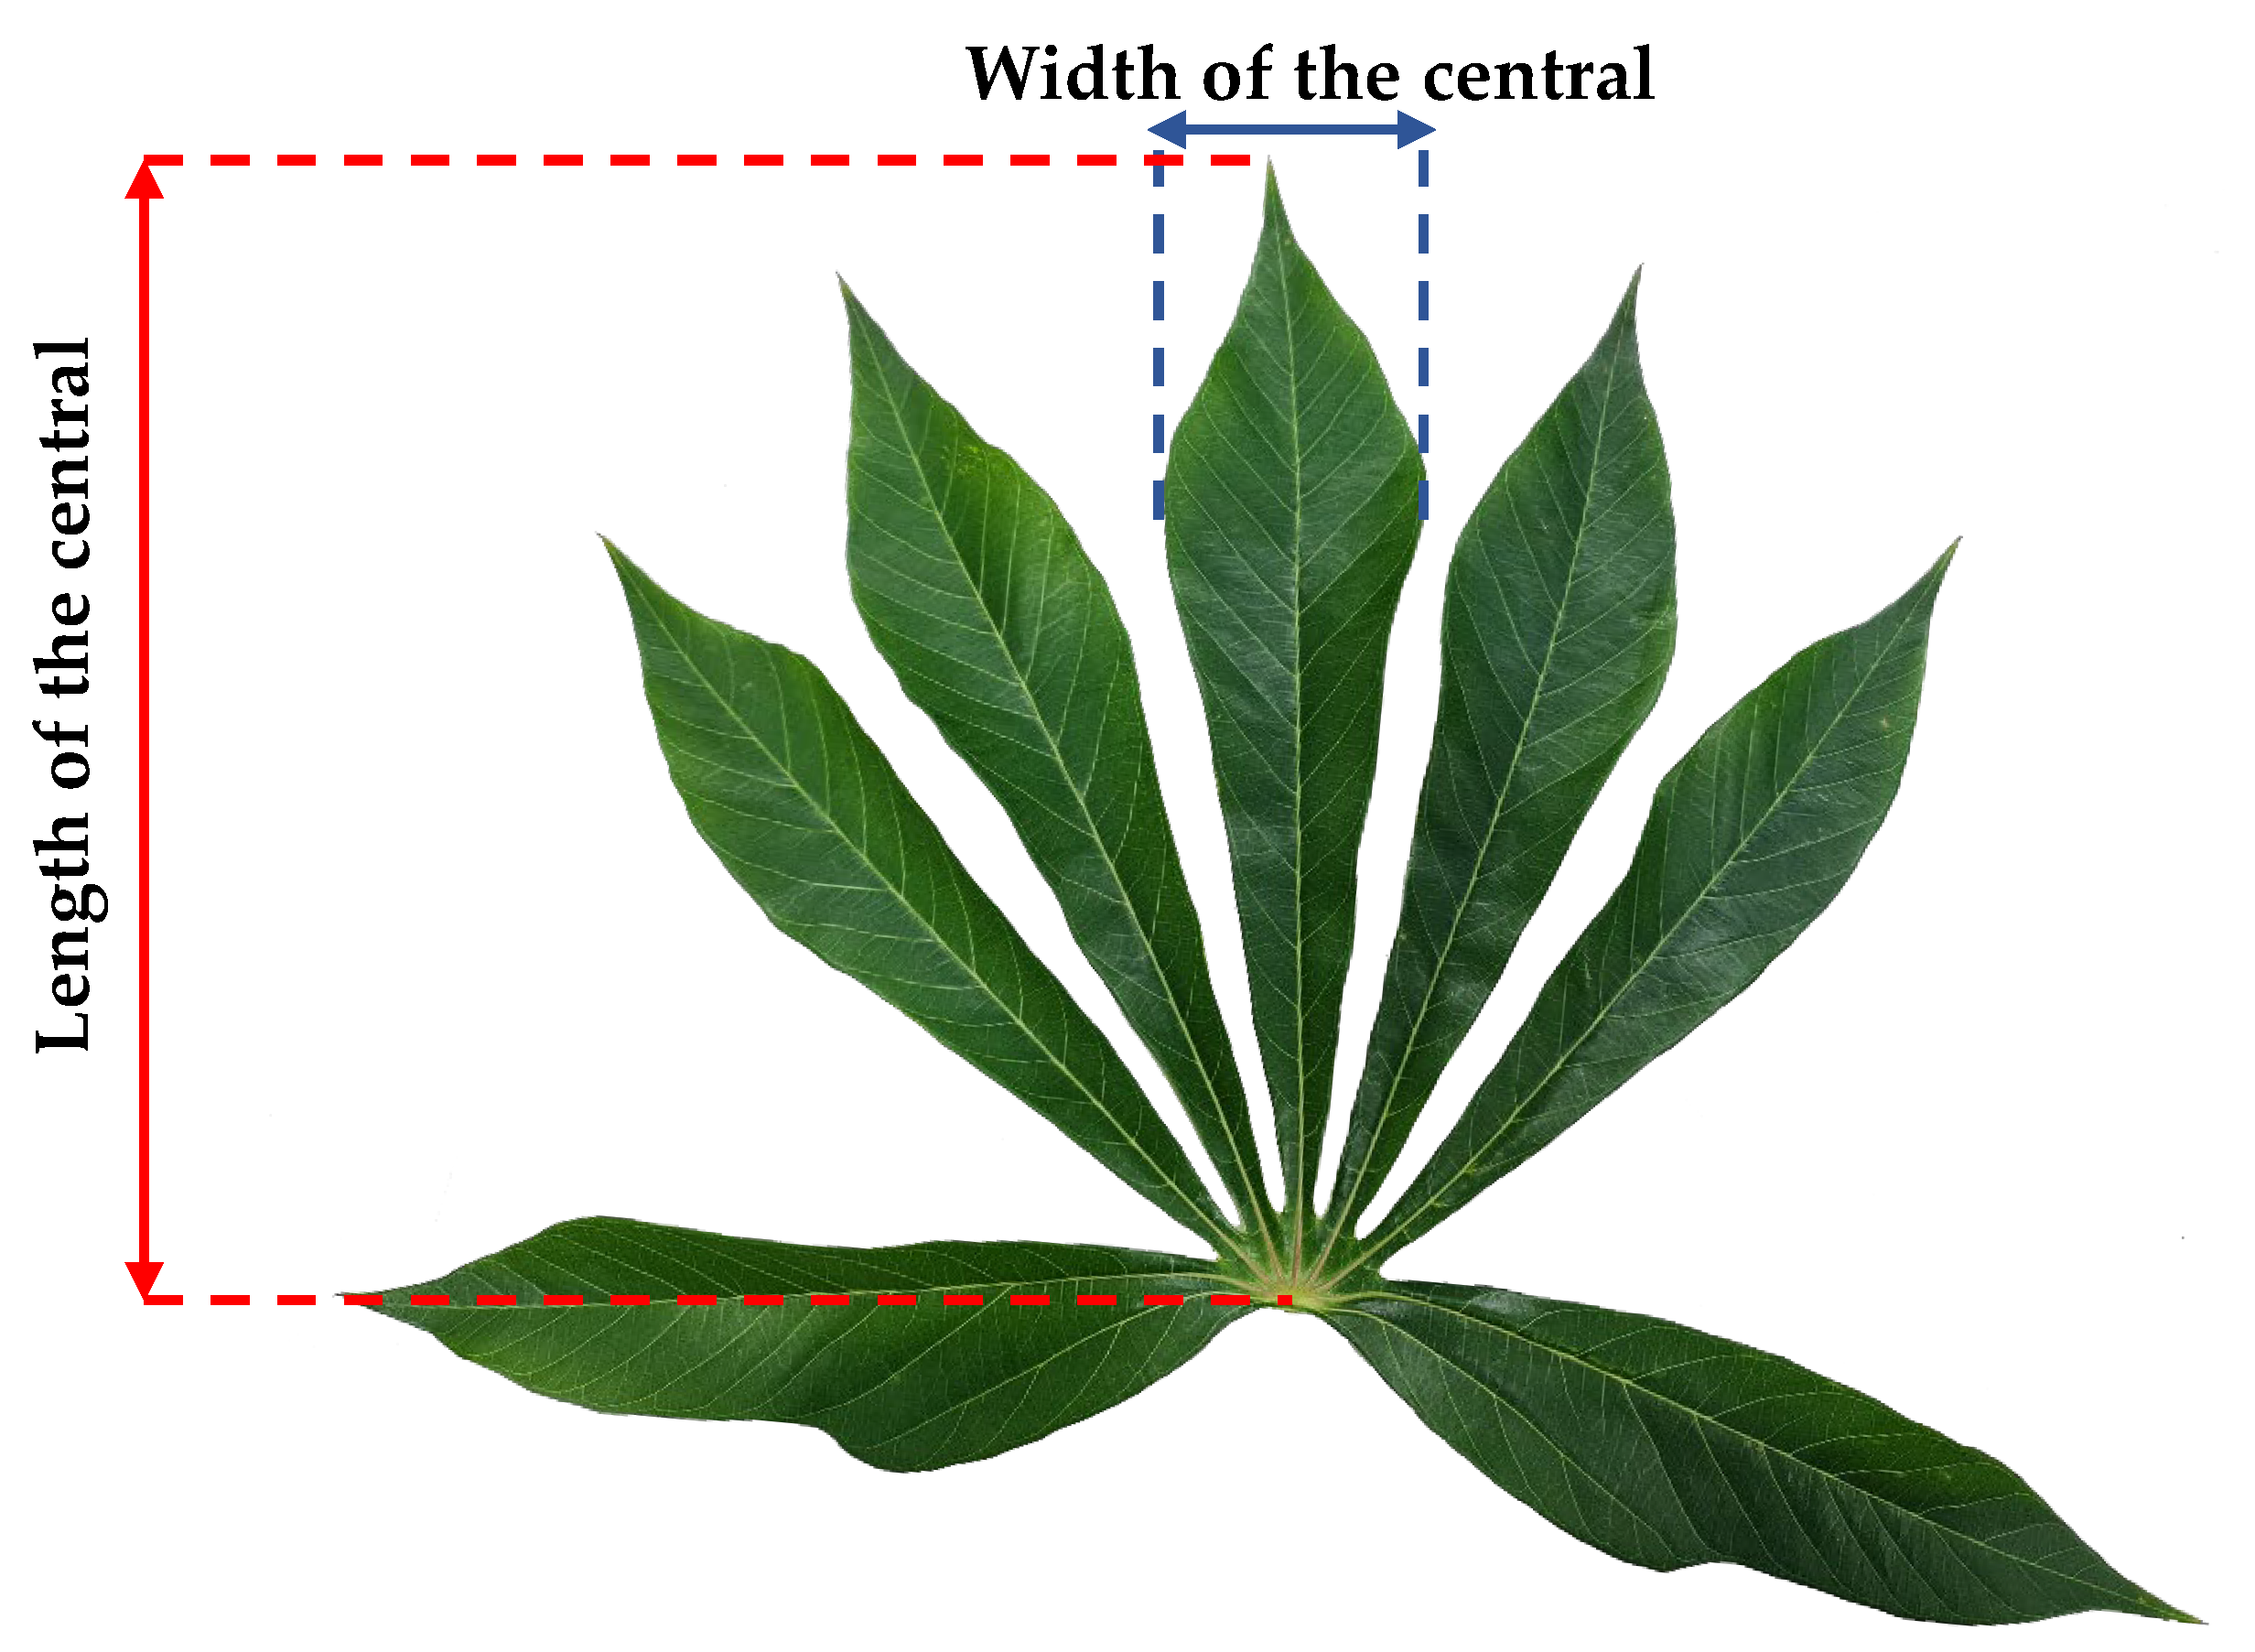
2. Materials and Methods

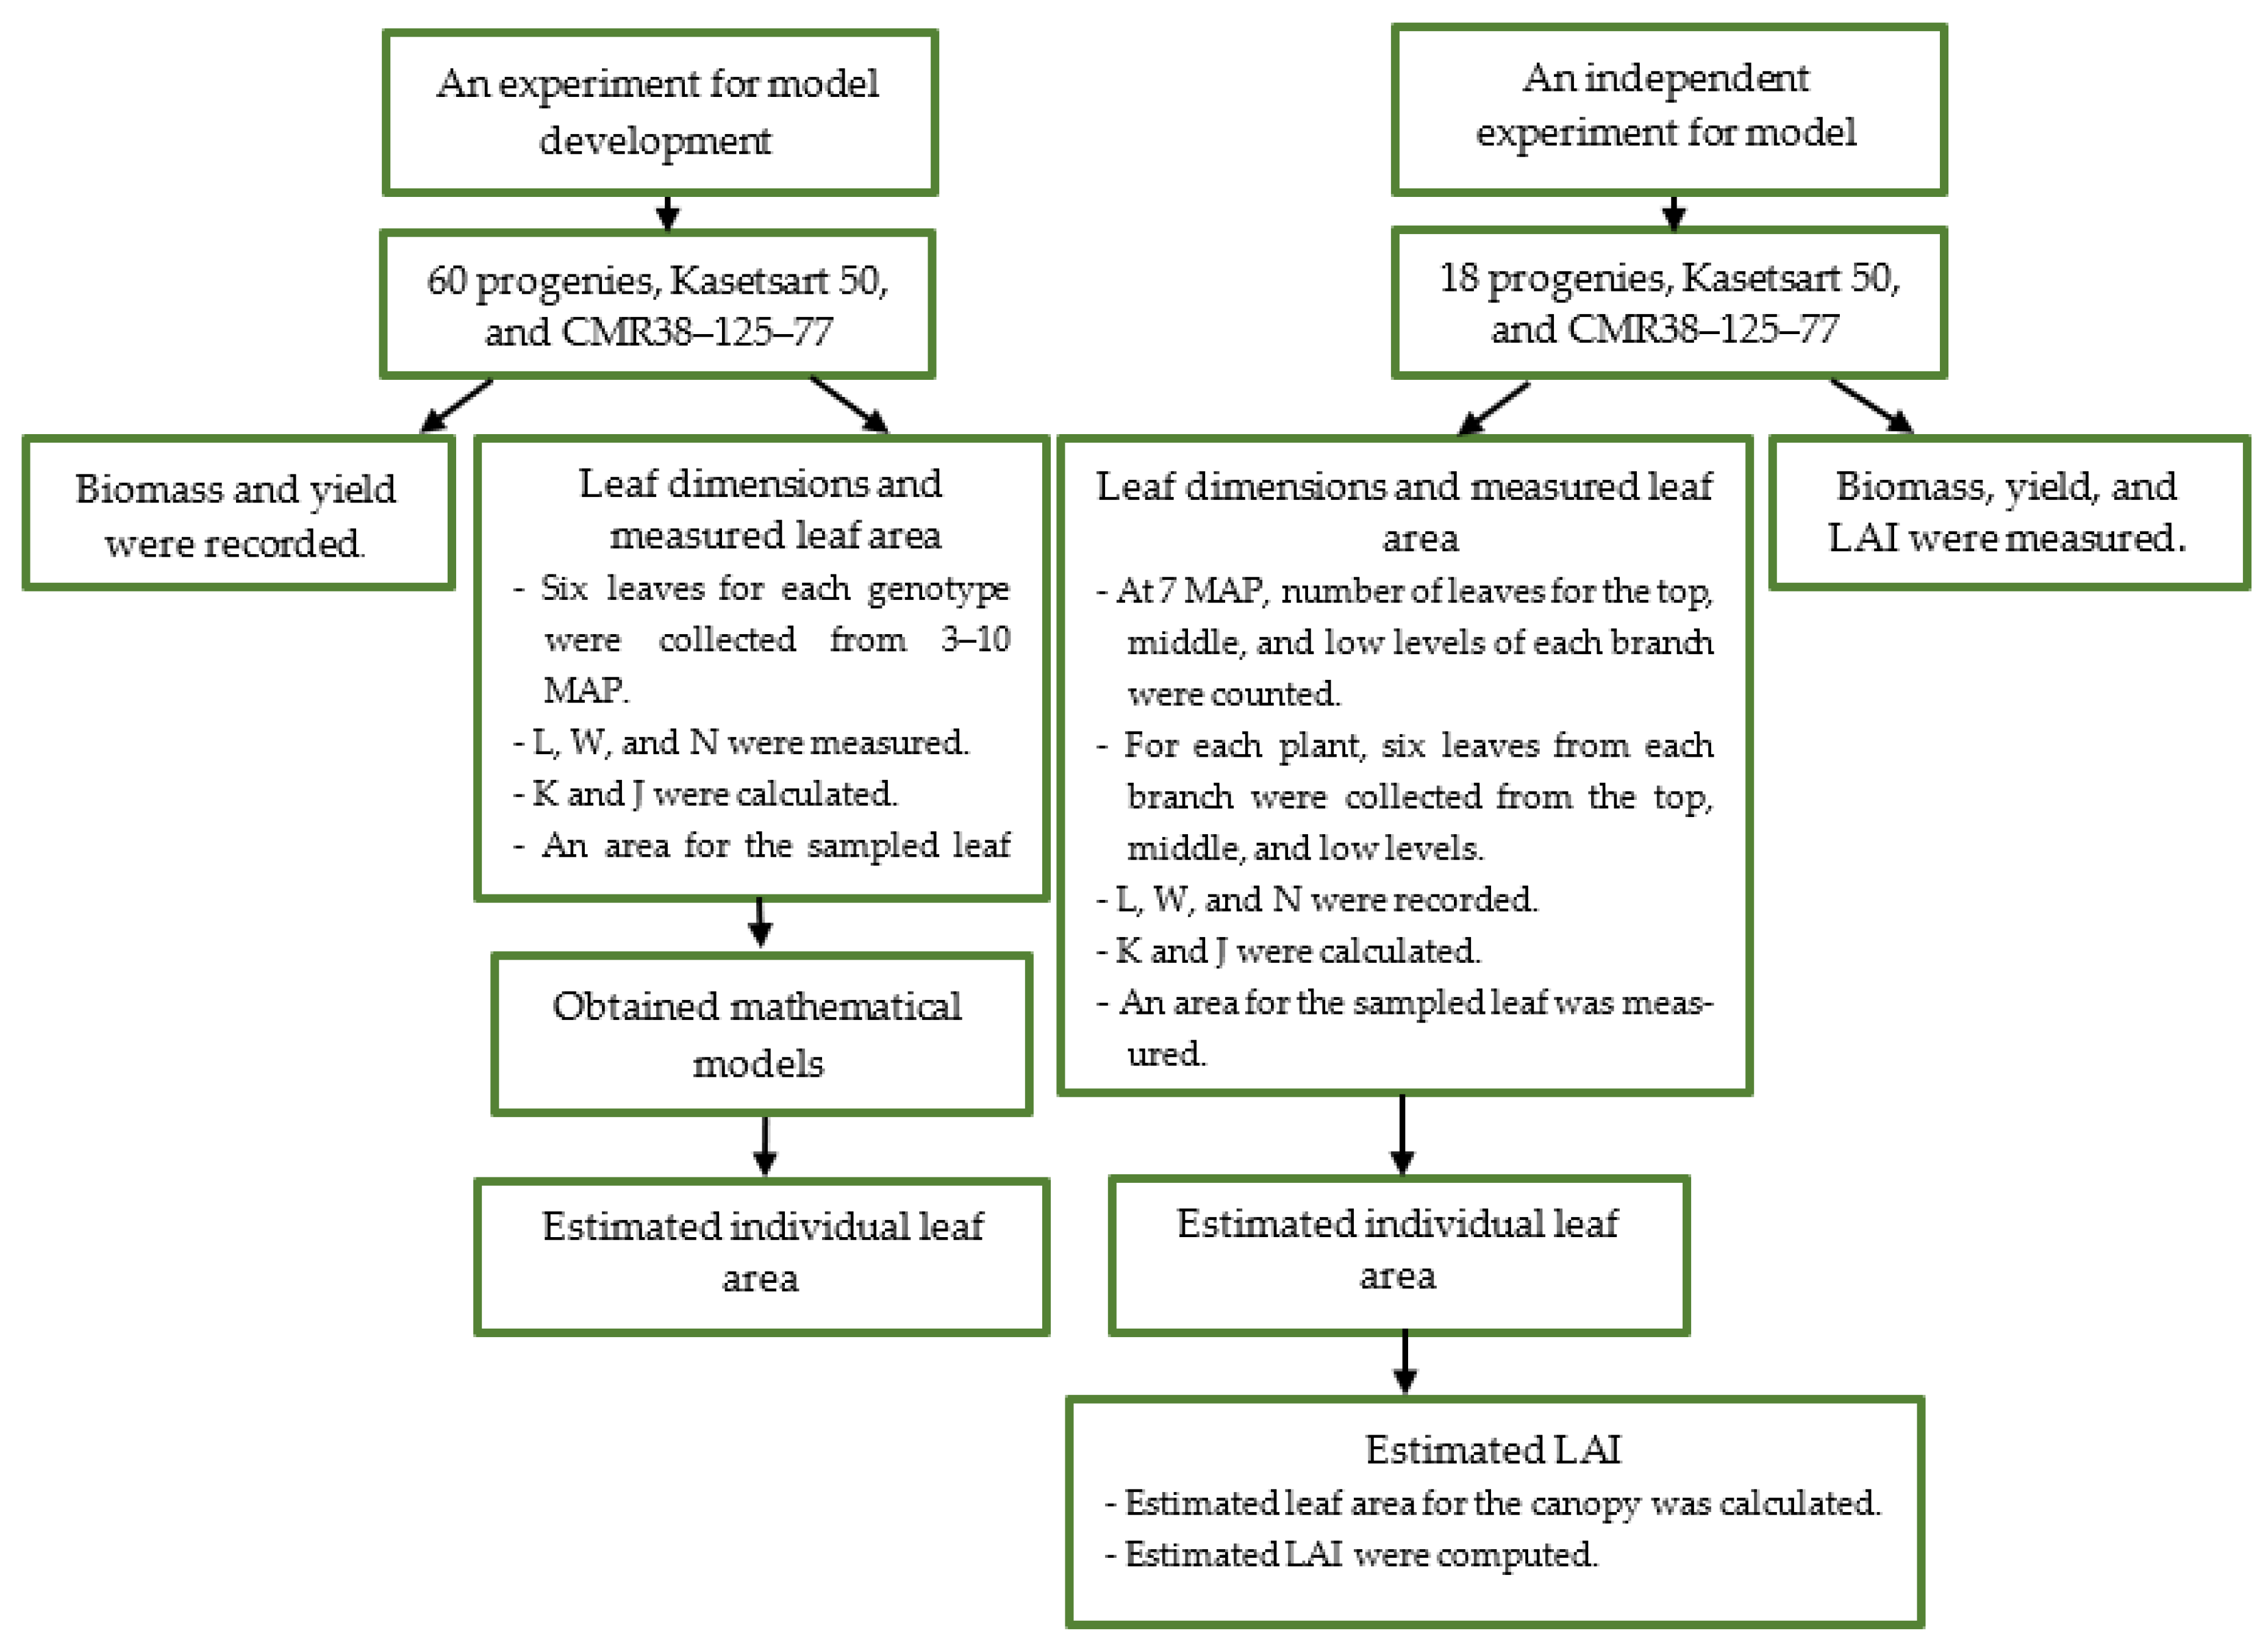
2.1. An Experiment for Model Development

The cross of Kasetsart 50 × CMR38–125–77 was performed in 2019 at Khon Kaen University, Khon Kaen, Thailand. The Kasetsart 50 genotype was selected to be a female parent as it has good adaptation and high yield potential [13,29], and it is a popular genotype in Thailand and Southeast Asia [29]. The male parent was a genotype CMR38–125–77, which had high LAI, total crop biomass, and yield [13,14]. The Kasetsart 50 genotype was introduced by Kasetsart University, Thailand, and the CMR38–125–77 genotype was promoted by the Department of Agriculture, Thailand. After harvesting the seeds, the single plant trial was conducted at Khon Kaen University from 2020–2021. The 60 progenies were then selected based on fresh weight at the final harvest for the single-row trial.
The single-row trial was carried out from 2021 to 2022 at Khon Kaen University (16°28′ N, 102°48′ E, 195 m above sea level). Land preparation was conducted by following normal procedures for the experimental field of cassava. The 60 progenies of Kasetsart 50 × CMR38–125–77 were planted on 9 April 2021. Each genotype was grown by 10 plants per row. The Kasetsart 50 and CMR38–125–77 genotypes were also planted as a border row for every 10 genotypes of segregating progeny. The distance between the plant and the row was 1 × 1 m. The stems of the cassava at 9 months after planting (MAP) were collected from the same field, cut as stakes of 20 cm in length, and soaked for 30 min with thiamethoxam (Syngenta crop protection limited, Bangkok, Thailand) 3–(2–chloro–thiazol–5–ylmethyl)–5–methyl–(1,3,5)–oxadiazinan–4–ylidene–N–nitroamine), and 25% water dispersible granules (WG) at a rate of 4 g per 20 L of water to prevent the cassava from infestation by mealybug (Rastrococcus invadens). The cassava stakes were then inserted vertically into the soil so that 2/3 of the length was buried. The fertilizer N–P2O5–K2O formula 15–7–18 was applied at the rate of 312.5 kg ha−1 at 1 and 2 MAP [30] (Chia tai company limited, Phranakhonsiayutthaya, Thailand). Weeds and pests were controlled manually throughout the experiment. Irrigation was applied throughout the growing period.
Six leaves for each genotype were randomly collected from the top, middle, and low levels of the canopy every month, starting from 3 MAP until 10 MAP (372 leaves for each time). In each leaf, the length (L) and width of the central lobe (W) were measured, and the number of lobes (N) was also recorded (Figure 1). Thereafter, the product of the length and width (L × W; K) and the product of the length and number of lobes (L × N; J) were calculated. The leaf area was determined by using a leaf area meter (LI–Cor 3100, LI–COR, Inc., Lincoln, NE, USA). The mathematical models based on the function of the leaf area and leaf dimensions were determined by the multiple linear regression method. Statistical analyses were performed using the Statistix 10 program [31]. The estimated leaf area was then calculated based on mathematical models. The agreement between the actual leaf area obtained from a leaf area meter and the estimated leaf area was determined by using the root mean square error (RMSE) (Equation (1)) and normalized root mean square error (nRMSE) (Equation (2)) [32]. The lower values of nRMSE indicate good agreement between the measured and estimated leaf area values. The equations for the statistical parameters are as follows:
RMSE = i = 1 n P i O i 2 n
n RMSE = RMSE   ×   100 O ¯
where n is the number of observations, Pi and Oi are the estimated and actual values, respectively, and Ō is the mean of the actual variable.
Ten plants for each genotype were harvested at 12 MAP. The harvested plants were separated into individual organs, including leaves, petiole, stem, root, and storage root. All plant samples were then measured for their fresh weight. The correlation analysis between the final harvest data and the maximum individual leaf area for all genotypes was performed. The 18 progenies were then selected based on the performance of fresh weight and maximum individual leaf area. The process was shown in Figure 2.

2.2. An Independent Experiment for Model Evaluation

All 18 progenies and the genotypes Kasetsart 50 and CMR38–125–77 were planted on 24 March 2022 at Khon Kaen University. The stakes of the length of 20 cm were prepared from the single-row trial. The 10 plants for each genotype were planted with 1 × 1 m of plant spacing. The land preparation and crop management practices were organized likewise in the previous single-row trial field. From 2 plants of each genotype at 7 MAP, the height for each branch was measured, and each branch was then separated into the top, middle, and low levels. The number of leaves for the top, middle, and low levels of each branch was also counted. There were different leaf dimensions among the top, middle, and low levels of each cassava branch. For each plant, therefore, six leaves from each branch were randomly collected from the top, middle, and low levels of the canopy. The data for the L, W, and N for each sampled leaf were recorded, and the values for K and J were then calculated. The leaf area for the sampled leaves was observed by using a leaf area meter. The agreement between the estimated and the measured leaf areas was evaluated by using nRMSE. The estimated leaf area for the whole canopy was calculated based on mathematical models and the number of leaves for the top, middle, and low levels, and the estimated LAIs were then computed as the ratio of the estimated leaf area for the canopy to the ground area. The sampled plants were separated into leaves, petiole, stem, root, and storage root. The leaves were subsampled (about 10% of the total fresh weight), and the subsamples of the green leaf were used to measure the leaf area using a leaf area meter. The leaf area for the whole canopy was determined, and the LAI was then recorded (measured LAI). The agreement between the estimated LAI and the measured LAI was explained by using the correlation coefficient and nRMSE. The storage root fresh weight and total crop fresh weight were also recorded. The correlation analysis between the fresh weight and the estimated LAI for all genotypes was performed. The process was shown in Figure 2.

3. Results and Discussion

3.1. Measured Leaf Area and Final Fresh Weights

As the previous studies based on the simulation model have demonstrated that the maximum individual leaf area had an impact on the simulated storage root yield [15,16,17,18], this study showed their relationship based on actual data from the cassava yield trial. The investigation of leaf traits for 60 segregating progenies and the Kasetsart 50 and CMR38–125–77 genotypes from 3 to 10 MAP indicated that the difference between the minimum and maximum values was observed for each measured leaf area (Table 1). The leaf area, L, W, N, K, and J from 3 to 10 MAP varied in the range of 14.09 to 522.16 cm, 5.09 to 27.60 cm, 1.20 to 7.00 cm, 1.00 to 9.00 lobes, 9.36 to 182.92 cm2, and 9.50 to 213.30 cm2, respectively. The values for standard deviation for L, W, and N were also low (varying from 0.71 to 2.93). There was high variation for the measured leaf area with the standard deviation values ranging from 41.66 to 68.3, demonstrating that the leaf size of cassava varies in the canopy. The maximum individual leaf area was found from 3 to 6 MAP for almost all of the genotypes. Our results correspond to a report from Irikura et al. [33] and Alves [34]. They demonstrated that the maximum leaf size was discovered at the canopy development stage (from 3 to 6 MAP).
The measured maximum individual leaf area and total fresh weight at final harvest varied from 182.64 to 470.98 cm2 and 3.97 to 9.38 kg plant−1, respectively (Figure 2 and Figure 3 and Table A1). In Figure 3 and Figure 4, the dendrogram showed seven groups of cassava in different colors. The blue color revealed the highest group for the measured maximum individual leaf area (Figure 3). The group with the highest total fresh weight was presented as a spring green color (Figure 4). The CM–KKU 62–03–67 genotype was identified as the highest for both the measured maximum individual leaf area and the total fresh weight. The CM–KKU 62–03–03 and CM–KKU 62–03–57 genotypes were classified as the highest for the measured maximum individual leaf area with high total fresh weight. The CM–KKU 62–03–28 genotype showed a high maximum individual leaf area, and it had the highest total fresh weight when compared to the others. The results revealed that some cassava genotypes with high values of maximum individual leaf area had high storage root yield. The correlation coefficients (r) between the maximum individual leaf area and the total crop fresh weight and the storage root fresh weight were statistically significant with values of 0.64 and 0.42, respectively. As the leaf plays an important role in crop growth and yield, the maximum individual leaf area had the potential to be an additional criterion for more explanation regarding crop adaptability for the cassava yield trial. In addition, collecting the leaf area for the whole canopy can also provide much clearer about crop behavior. However, the practical approach without the disturbance to plants for determining the leaf area is worth investigating, as there are a limited number of plants during the early stage of the cassava yield trial.

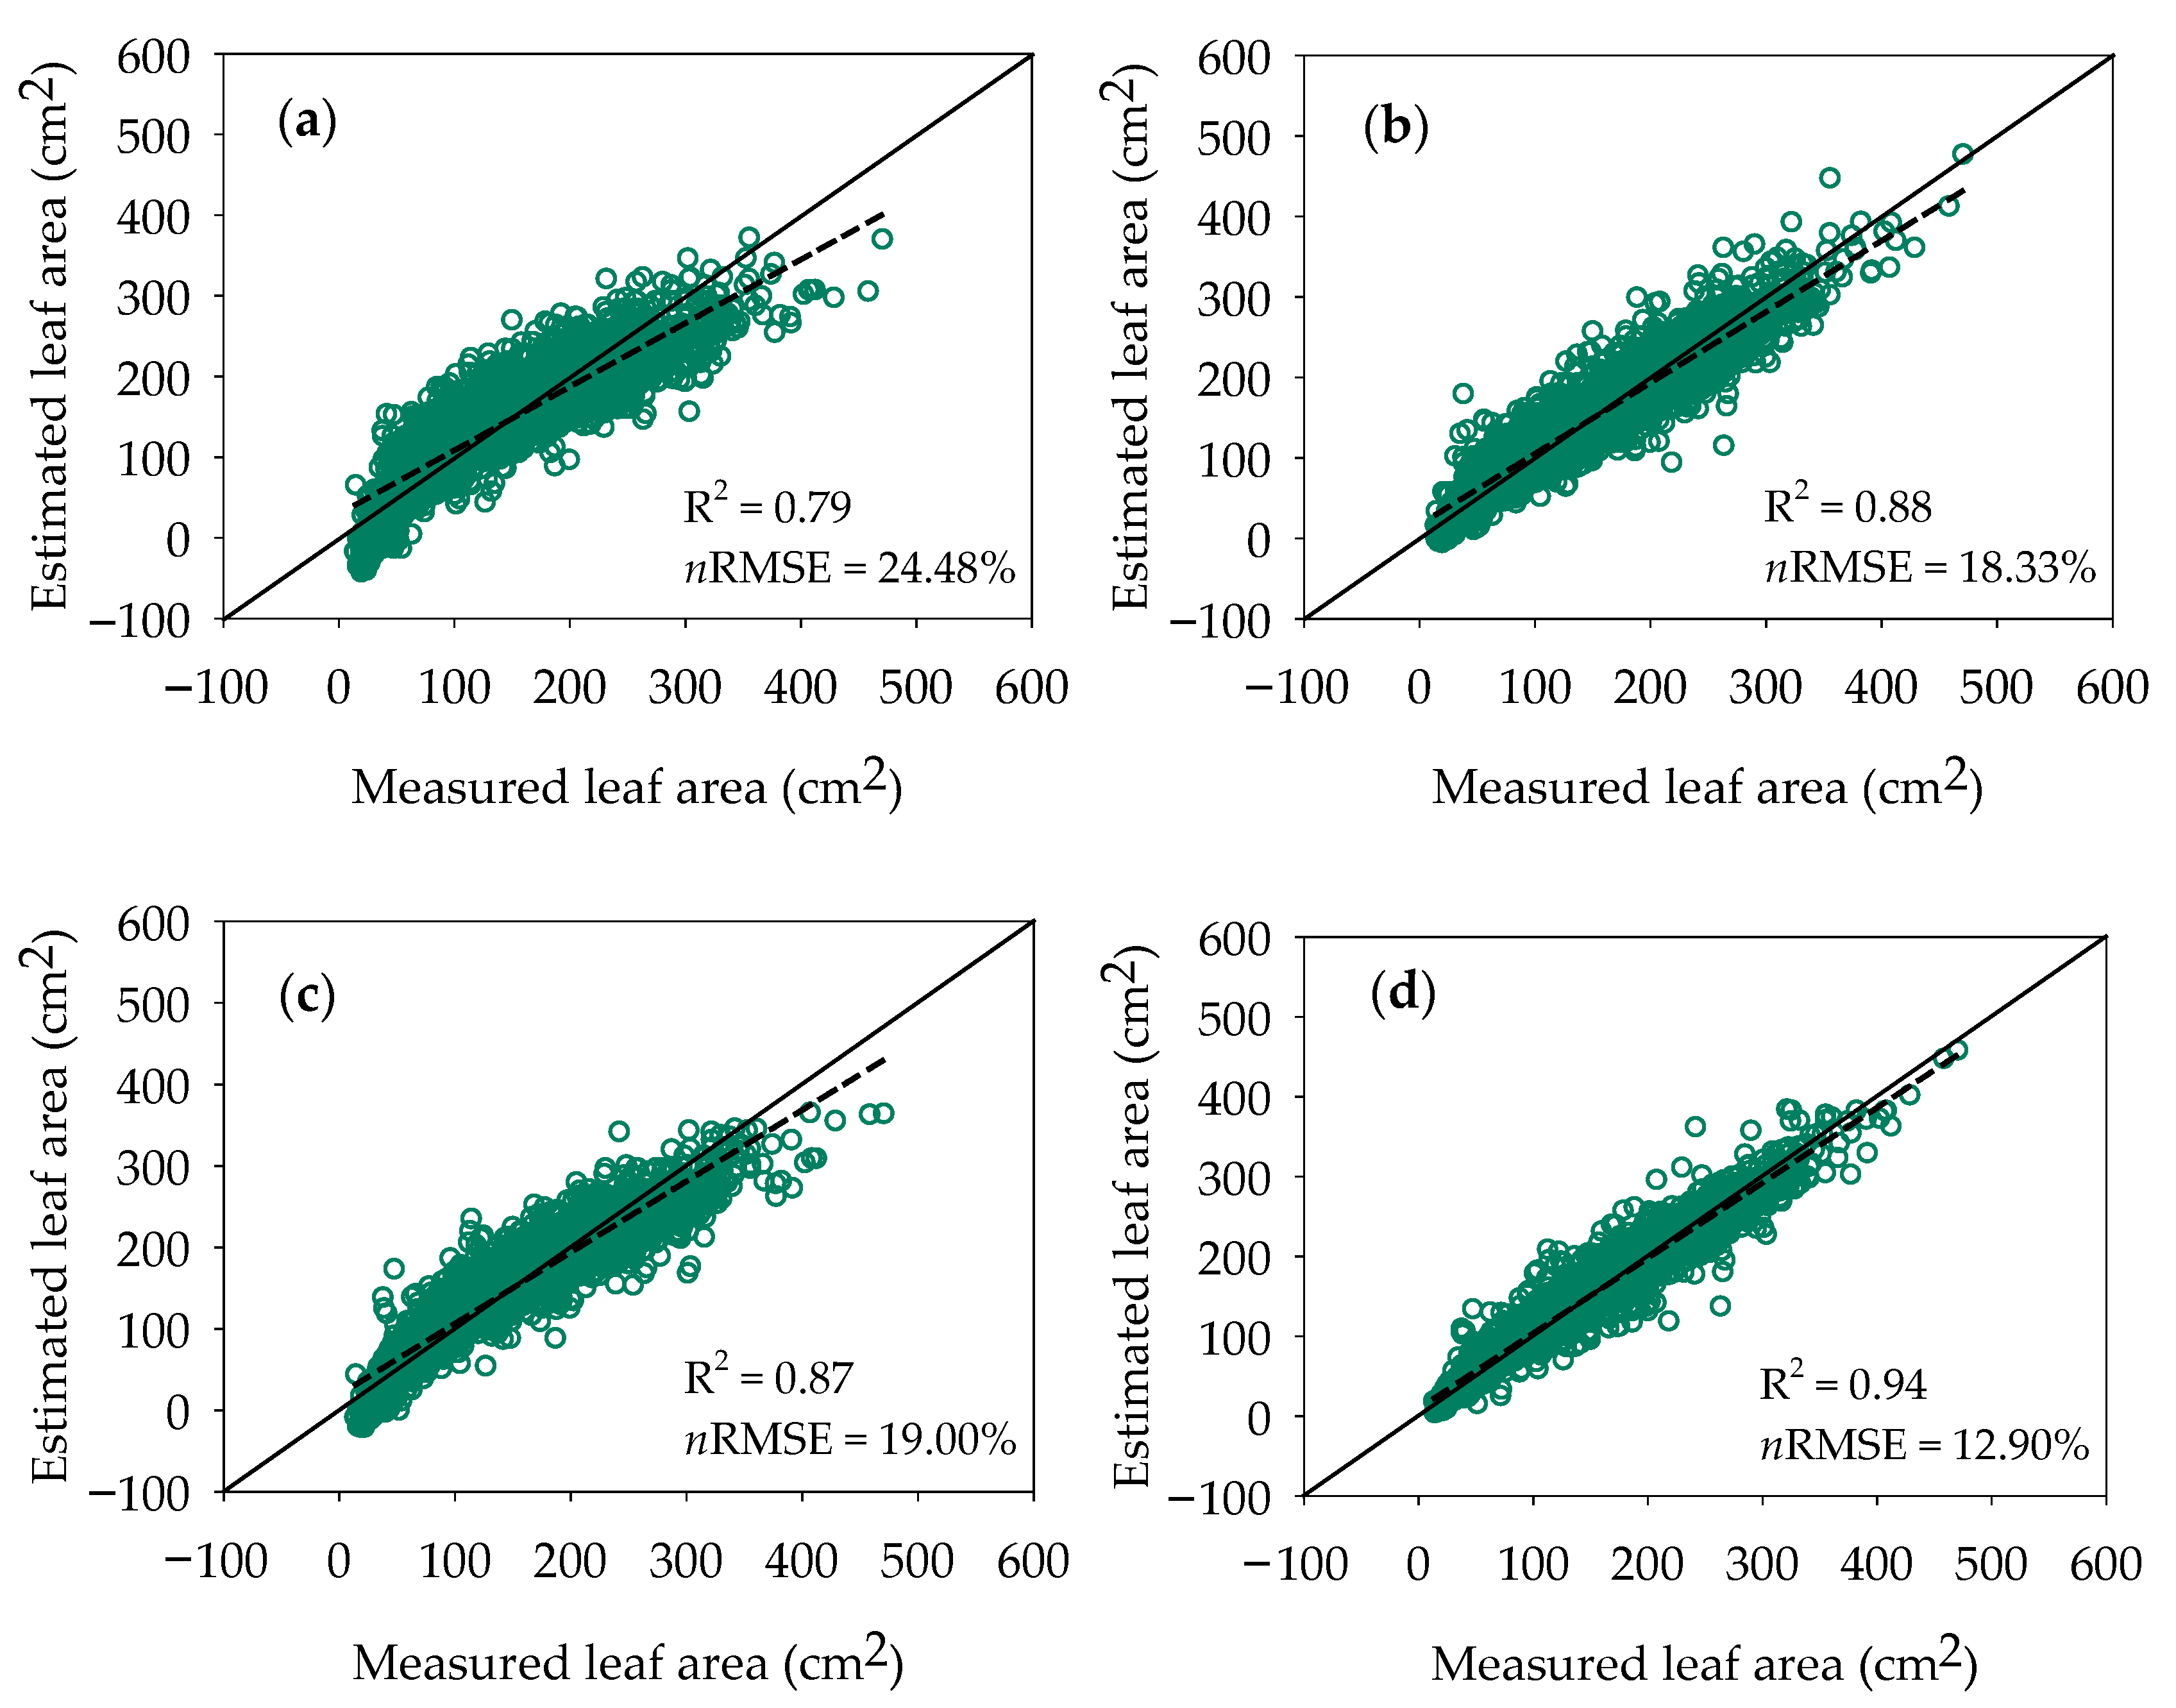
3.2. The Mathematical Model of Linear Regression for Estimating Leaf Area

Linear regression analysis for leaf area in the function of L, K, and J was shown in Table 2. The mathematical model based on the simple linear regression for the function of L was obtained (LA = 19.61L − 157.83), with an R2 value of 0.79 (Table 2). However, the multiple linear regression analysis that used L, K, and J together as independent variables (LA = −3.39L + 2.04K + 1.01J − 15.10) showed a better result than the linear regression function as indicated by an R2 value of 0.94 (Table 2). Our results differed from Zanetti et al. [27] and Trachta et al. [28] due to the difference in the leaf shape. They presented that a mathematical model with only the length of the central lobe is a suitable parameter to estimate the leaf area with high values of R2 (>0.90).
The dispersion of the data for the measured leaf area and the estimated leaf area for all four linear regression models are shown in Figure 5. For the linear regression of leaf area based on the function of L (LA = 19.61L − 157.83) (Figure 5a), there was a higher variation of data as compared to the other three functions, with the nRMSE value of 24.48%. Some of the estimated leaf area values for the function of L (LA = 19.6103L − 157.8280), L and K (LA = 3.68 L + 2.35K − 51.31), and L and J (LA = 8.92L + 1.18J − 99.29) showed the minus values based on the low values of measured L, W, and N (Figure 5a–c). However, a good agreement between the measured and estimated leaf area values was found for the function of L, K, and J (LA = −3.39L + 2.04K + 1.01J − 15.10) with the nRMSE value of 12.90% (Figure 5d).

3.3. Correlation between Estimated Maximum Individual Leaf Area and Biomass

The total crop fresh weight, storage root fresh weight, and estimated maximum individual leaf area of the Kasetsart 50 and CMR38–125–77 genotypes and 60 segregating progenies were shown in Table A1. The correlation values between the measured individual leaf area and biomass as mentioned earlier were higher than the values based on the estimated individual maximum leaf area and biomass (Table 3). The estimated individual maximum leaf area for the function of L, K, and J showed a higher correlation with the total crop fresh weight (0.54) than the other three functions. The discrepancy of the leaf area calculated using the linear regression models would affect the estimate of the maximum individual leaf area and ultimately the correlation value. The correlation between the maximum individual leaf area and biomass indicates the possibility of using the maximum individual leaf area as an additional criterion to help assist the cassava breeding program. Using the estimated individual maximum leaf area can be a valuable option in the early stage of cassava yield trials with a low cost and without disturbing the plants.
Generally, the data for single-row trials tend to have a large experimental error, because they have a single plot at one location, and this may explain the low correlation coefficients [35]. The low values of correlation coefficients between the fresh root yield and the harvest index in single-row trials were found in previous reports (r = 0.45 [36] and r = 0.47 [35]). However, Kawano et al. [36] suggested that direct selection for the yield itself at the single-row trial will be less effective than indirect selection for the yield through the harvest index. Although the correlation between the maximum individual leaf area and the storage root fresh weight was not high, it has the potential to be used as an additional criterion to improve the efficiency of varietal selection for a single-row trial. Ojulong et al. [37] also mentioned that collecting the major contribution traits at the earliest stage of the cassava yield trial could help improve breeding efficiency.
Our study demonstrates the possibility of determining the leaf area for a better explanation of cassava behavior and for better selection during the early stage of the cassava yield trial. The information regarding the appropriate maximum individual leaf area with high storage root yield may support the application of crop simulation models as a tool for the future design of cassava ideotypes. In addition, the correlation between the maximum individual leaf area and the cassava yield in progenies would be necessary to investigate during the cassava yield trial.

3.4. Evaluation of the Mathematical Models with Independent Data Set

The mathematical models (Table 2) were also evaluated using the independent data set obtained from 18 progenies and the genotypes Kasetsart 50 and CMR38–125–77. The results indicated the same trends as the previous results in Figure 5. The linear regression based on the function of L (LA = 19.61L − 157.83) showed a lower accuracy of the individual estimated leaf area when compared to the other models with an nRMSE value of 22.72% (Figure 6a). This evaluation result confirmed that the multiple linear regression based on the function of L, K, and J (LA = −3.39L + 2.04K + 1.01J − 15.10) provided a better estimated individual leaf area as compared to the other models, with the lowest nRMSE (11.85%) (Figure 6d). Zanetti et al. [27] also suggested that the multiple linear regression model is suitable to estimate leaf area for cassava with Oblong lanceolate-shaped lobes. The multiple linear regression from our study, therefore, could be a valuable model to help estimate leaf area for cassava breeding, and it can be applied to determine leaf area for the other cassava genotypes that have lanceolate-shaped lobes.
A good correlation with statistical significance between the estimated LAI and the measured LAI was recorded (Table 4). The total crop fresh weight, storage root fresh weight, measured LAI, and estimated LAI for the Kasetsart 50 and CMR38–125–77 genotypes and 18 segregating progenies were shown in Table A2. The statistically significant correlation between the estimated LAI and the total fresh weight and storage root fresh weight was observed with the correlation values varying from 0.41 to 0.65 (Table 4). The root rot symptoms due to high amounts of rainfall through growing periods (1030.6 mm from 24 March–24 October 2022) caused a decrease in the storage root yield and total crop fresh weight, and this may be the reason for some low correlation values.
Many previous studies have demonstrated that leaf area is an essential factor related to cassava biomass and yield [9,10,11,12,13,14,15]. The maximum yield of cassava can be obtained when there is an optimum balance between the photosynthetic assimilated distribution and LAI maintenance [9,38]. Cock et al. [9] reported that the optimum LAI to achieve the maximum storage root yield ranged from 3.0–3.5. Our results demonstrated that the mathematical model has the capability to estimate the LAI for the whole canopy, and the estimated LAI can explain the total crop fresh weight and storage root fresh weight of cassava. The results from this study indicated the possibility of determining leaf area and LAI without crop disturbance for cassava yield trials.

4. Conclusions

The results from an experimental field revealed that some cassava genotypes with high values of maximum individual leaf area had high values of total fresh weight and storage root yield. The multiple linear regression function of L, K, and J (LA = −3.39L + 2.04K + 1.01J − 15.10) showed the best result to estimate the maximum individual leaf area for the Kasetsart 50 and CMR38–125–77 genotypes and 60 segregating progenies. The evaluation results based on an independent data set confirmed that the mathematical regression based on L, K, and J gave a reasonable value of the estimated individual leaf area and LAI for the whole canopy. This mathematical model can be applied to determine the leaf area for the other cassava genotypes that have lanceolate-shaped lobes. In order to achieve a better understanding of the leaf performance of each cassava genotype and obtain better decision-making for cassava yield trials, this study provides valuable information for breeders to determine leaf area with a simple method and low cost, as well as without crop disturbance. Other appropriate mathematical models for cassava genotypes with different leaf shape slopes, however, may need to be explored.

Author Contributions

Conceptualization, P.P., P.B., N.V., S.J. and P.T.; data curation, P.P.; formal analysis, P.P. and P.B.; methodology, P.P., P.B., N.V., S.J. and P.T.; supervision, P.B.; investigation, P.P. and P.B.; writing (original draft preparation), P.P. and P.B.; writing (review and editing), P.P., P.B., N.V., S.J. and P.T. All authors have read and agreed to the published version of the manuscript.

Funding

This study was supported by the National Science and Technology Development Agency (NSTDA), Thailand, and the Post-Doctoral Training Program from Khon Kaen University, Thailand (Grant no. PD2565–01). Assistance in conducting the work was also received from the Plant Breeding Research Center for Sustainable Agriculture, Khon Kaen University, Thailand.

Data Availability Statement

Not applicable.

Conflicts of Interest

The authors declare no conflict of interest.

Appendix A

Table A1. Total fresh weight, storage root fresh weight, measured maximum individual leaf area, and estimated maximum individual leaf area based on the function of the length of the central lobe (L), the product of length and width (K), and the product of the length and number of lobes (J) for the Kasetsart 50 and CMR38–125–77 genotypes and 60 segregating progenies.
GenotypeTotal Fresh Weight
(kg Plant−1)
Storage Root Fresh Weight
(kg Plant−1)
Measured Maximum Individual Leaf Area (cm2)Estimated Maximum Individual Leaf Area (cm2)
LL, KL, JL, K, J
Kasetsart 506.964.65429.15297.13360.45354.51401.26
CMR38–125–775.724.32295.45257.91272.16265.26272.21
CM–KKU 62–03–037.043.72470.98240.26238.27268.44457.27
CM–KKU 62–03–055.213.53326.35263.79325.24270.42313.90
CM–KKU 62–03–084.883.37255.90218.69217.42225.71214.01
CM–KKU 62–03–114.933.32225.59263.79239.52245.00226.61
CM–KKU 62–03–124.393.00267.81234.38255.21244.62241.13
CM–KKU 62–03–145.864.26330.84287.33303.66340.81333.57
CM–KKU 62–03–155.543.87268.31263.79291.76219.58250.69
CM–KKU 62–03–166.373.86332.17320.66340.93320.28337.17
CM–KKU 62–03–174.112.42241.84206.92221.99220.55231.53
CM–KKU 62–03–184.903.02257.57263.79250.55245.00257.16
CM–KKU 62–03–196.935.09335.89273.60339.15279.01335.29
CM–KKU 62–03–207.504.84341.46279.48271.26336.90321.37
CM–KKU 62–03–214.742.95252.43238.30233.78248.06241.51
CM–KKU 62–03–234.763.15316.79253.99322.22261.82319.36
CM–KKU 62–03–245.343.66288.10312.82323.99279.01290.38
CM–KKU 62–03–256.534.39263.93216.73166.56229.15183.47
CM–KKU 62–03–264.353.05293.17204.96277.03218.83279.55
CM–KKU 62–03–274.302.98262.33230.46327.96225.71284.52
CM–KKU 62–03–289.384.45412.77306.94380.46308.25371.92
CM–KKU 62–03–317.503.11298.50253.99282.01282.13285.07
CM–KKU 62–03–323.972.36211.84226.53227.04232.59225.31
CM–KKU 62–03–344.672.45182.64234.38209.85198.19181.39
CM–KKU 62–03–357.104.74322.14332.43392.40330.60383.07
CM–KKU 62–03–364.722.33237.04210.85232.80223.99240.76
CM–KKU 62–03–386.063.86391.96265.75332.05309.52368.52
CM–KKU 62–03–395.373.93287.25320.66306.56299.65283.36
CM–KKU 62–03–427.415.15310.28287.33319.63264.21295.71
CM–KKU 62–03–435.694.09377.93253.99360.80297.78382.37
CM–KKU 62–03–444.932.93255.96273.60241.13261.82240.93
CM–KKU 62–03–456.054.39301.18253.99286.93261.82289.36
CM–KKU 62–03–465.773.99252.61214.77217.74227.43227.98
CM–KKU 62–03–476.954.56407.35306.94335.98364.29381.20
CM–KKU 62–03–485.594.01271.84244.18269.26253.22273.74
CM–KKU 62–03–496.564.33274.97220.65271.81232.59275.10
CM–KKU 62–03–506.814.56323.13255.95295.46288.00336.20
CM–KKU 62–03–536.674.62301.61253.99282.01212.16242.66
CM–KKU 62–03–545.033.47265.44252.03252.97260.10259.65
CM–KKU 62–03–555.133.71327.33275.56302.91286.05303.03
CM–KKU 62–03–567.254.80326.23265.75321.92272.14320.10
CM–KKU 62–03–577.104.66458.80304.98411.82362.33446.98
CM–KKU 62–03–586.574.03294.48242.22261.44251.50266.69
CM–KKU 62–03–605.092.33228.27222.61209.02234.31232.99
CM–KKU 62–03–615.533.57271.64277.52301.05261.82276.49
CM–KKU 62–03–624.112.56208.84224.57203.32236.03215.86
CM–KKU 62–03–636.074.08254.42204.96230.48175.84203.97
CM–KKU 62–03–644.752.99260.94207.51209.02221.06220.39
CM–KKU 62–03–656.435.00351.82312.82329.62313.41327.95
CM–KKU 62–03–678.812.38470.98371.65476.58363.27457.27
CM–KKU 62–03–685.353.42287.86259.87281.77266.98285.01
CM–KKU 62–03–695.883.67275.20316.74298.75296.21271.39
CM–KKU 62–03–715.964.05267.13240.26247.09249.78254.34
CM–KKU 62–03–736.744.05324.11275.56294.28280.73296.28
CM–KKU 62–03–746.914.51334.04273.60287.56279.01290.38
CM–KKU 62–03–768.265.02324.23289.29289.19292.77292.18
CM–KKU 62–03–777.964.50366.45346.16323.98342.64322.70
CM–KKU 62–03–795.093.07355.67293.21378.47296.21370.00
CM–KKU 62–03–804.522.98322.39263.79279.86321.25326.86
Table A2. Total fresh weight, storage root fresh weight, measured leaf area index (LAI), and estimated LAI. LAI based on the function of the length of the central lobe (L), the product of length and width (K), and the product of the length and number of lobes (J) together with the leaf numbers of the canopy for the Kasetsart 50 and CMR38–125–77 genotypes and 18 segregating progenies.
GenotypeTotal Fresh Weight
(kg Plant−1)
Storage Root Fresh Weight
(kg Plant−1)
Measured LAIEstimated LAI
LL, KL, JL, K, J
Kasetsart 504.090.511.251.521.341.551.39
CMR38–125–771.250.320.030.080.080.090.09
CM–KKU 62–03–052.180.470.770.971.021.031.07
CM–KKU 62–03–145.813.640.550.900.790.970.86
CM–KKU 62–03–152.190.370.550.710.690.640.63
CM–KKU 62–03–204.281.600.731.150.911.211.00
CM–KKU 62–03–256.633.431.241.651.251.821.45
CM–KKU 62–03–344.090.071.221.671.361.611.35
CM–KKU 62–03–424.621.062.382.082.362.332.54
CM–KKU 62–03–445.000.211.662.652.132.411.99
CM–KKU 62–03–465.873.410.601.081.111.221.23
CM–KKU 62–03–476.613.771.371.941.932.152.10
CM–KKU 62–03–537.184.460.781.221.141.231.16
CM–KKU 62–03–566.173.211.471.631.791.741.86
CM–KKU 62–03–576.884.230.890.920.961.051.07
CM–KKU 62–03–582.460.250.731.081.061.111.09
CM–KKU 62–03–775.832.891.301.871.701.931.77
CM–KKU 62–03–797.653.541.712.572.562.632.61
CM–KKU 62–03–817.584.261.972.552.182.282.00
CM–KKU 62–03–824.592.280.501.011.181.051.19

References

  1. Howeler, R.H. Sustainable Soil and Crop Management of Cassava in Asia; CIAT Publication: Hanoi, Vietnam, 2014. [Google Scholar]
  2. Food and Agriculture Organization of the United Nations. Food Outlook-Biannual Report on Global Food Markets–November 2018; Food and Agriculture Organization of the United Nations: Rome, Italy, 2018. [Google Scholar]
  3. Food and Agriculture Organization of the United Nations. FAOSTAT–Crops. Available online: http://www.fao.org/faostat/en/#data/QC/ (accessed on 3 March 2022).
  4. Kawano, K.; Narintaraporn, K.; Narintaraporn, P.; Sarakarn, S.; Limsila, A.; Limsila, J.; Suparhan, D.; Sarawat, V.; Watananonta, W. Yield improvement in a multistage breeding program for cassava. Crop Sci. 1998, 38, 325–332. [Google Scholar] [CrossRef]
  5. Ceballos, H.; Iglesias, C.A.; Pérez, J.C.; Dixon, A.G. Cassava breeding: Opportunities and challenges. Plant Mol. Biol. 2004, 56, 503–516. [Google Scholar] [CrossRef] [PubMed]
  6. Ceballos, H.; Pérez, J.C.; Joaqui Barandica, O.; Lenis, J.I.; Morante, N.; Calle, F.; Pino, L.; Hershey, C.H. Cassava breeding I: The value of breeding value. Front. Plant Sci. 2016, 7, 1227. [Google Scholar] [CrossRef] [PubMed] [Green Version]
  7. Ceballos, H.; Hershey, C.; Iglesias, C.; Zhang, X. Fifty years of a public cassava breeding program: Evolution of breeding objectives, methods, and decision–making processes. Theor. Appl. Genet. 2021, 134, 2335–2353. [Google Scholar] [CrossRef] [PubMed]
  8. El–Sharkawy, M.A. Cassava biology and physiology. Plant Mol. Biol. 2004, 56, 481–501. [Google Scholar] [CrossRef]
  9. Cock, J.H.; Franklin, D.; Sandoval, G.; Juri, P. The ideal cassava plant for maximum yield. Crop Sci. 1979, 19, 271–279. [Google Scholar] [CrossRef]
  10. Fukai, S.; Alcoy, A.B.; Llamelo, A.B.; Patterson, R.D. Effects of solar radiation on growth of cassava (Manihot esculenta Crantz.). I. Canopy development and dry matter growth. Field Crops Res. 1984, 9, 347–360. [Google Scholar] [CrossRef]
  11. El-Sharkawy, M.A. International research on cassava photosynthesis, productivity, eco-physiology, and responses to environmental stresses in the tropics. Photosynthetica 2006, 44, 481–512. [Google Scholar] [CrossRef]
  12. Mahakosee, S.; Jogloy, S.; Vorasoot, N.; Theerakulpisut, P.; Banterng, P.; Kesmala, T.; Holbrook, C.; Kvien, C. Seasonal variations in canopy size and yield of Rayong 9 cassava genotype under rainfed and irrigated conditions. Agronomy 2019, 9, 362. [Google Scholar] [CrossRef] [Green Version]
  13. Phoncharoen, P.; Banterng, P.; Vorasoot, N.; Jogloy, S.; Theerakulpisut, P.; Hoogenboom, G. Growth rates and yields of cassava at different planting dates in a tropical savanna climate. Sci. Agric. 2019, 76, 376–388. [Google Scholar] [CrossRef]
  14. Phoncharoen, P.; Banterng, P.; Vorasoot, N.; Jogloy, S.; Theerakulpisut, P.; Hoogenboom, G. The impact of seasonal environments in a tropical savanna climate on forking, leaf area index, and biomass of cassava genotypes. Agronomy 2019, 9, 19. [Google Scholar] [CrossRef] [Green Version]
  15. Phosaengsri, W.; Banterng, P.; Vorasoot, N.; Jogloy, S.; Theerakulpisut, P. Leaf performances of cassava genotypes in different seasons and its relationship with biomass. Turk. J. Field Crops 2019, 24, 54–64. [Google Scholar] [CrossRef] [Green Version]
  16. Moreno-Cadena, L.P.; Hoogenboom, G.; Fisher, M.J.; Ramirez-Villegas, J.; Prager, S.D.; Becerra Lopez–Lavalle, L.A.; Pypers, P.; Mejia de Tafur, M.S.; Wallach, D.; Muñoz–Carpena, R.; et al. Importance of genetic parameters and uncertainty of MANIHOT, a new mechanistic cassava simulation model. Eur. J. Agron. 2020, 115, 126031. [Google Scholar] [CrossRef]
  17. Phoncharoen, P.; Banterng, P.; Moreno Cadena, L.P.; Vorasoot, N.; Jogloy, S.; Theerakulpisut, P.; Hoogenboom, G. Performance of the CSM–MANIHOT–Cassava Model for Simulating Planting Date Response of Cassava Genotypes. Field Crops Res. 2021, 264, 108073. [Google Scholar] [CrossRef]
  18. Phoncharoen, P.; Banterng, P.; Vorasoot, N.; Jogloy, S.; Theerakulpisut, P.; Hoogenboom, G. Identifying suitable genotypes for different cassava production environments—A modeling approach. Agronomy 2021, 11, 1372. [Google Scholar] [CrossRef]
  19. Sawatraksa, N.; Banterng, P.; Jogloy, S.; Vorasoot, N.; Moreno Cadena, L.P.; Hoogenboom, G. Performance of a model in simulating growth and stability for cassava grown after rice. Agron. J. 2021, 113, 2335–2348. [Google Scholar] [CrossRef]
  20. He, J.; Reddy, G.V.; Liu, M.; Shi, P. A general formula for calculating surface area of the similarly shaped leaves: Evidence from six Magnoliaceae species. Glob. Ecol. Conserv. 2020, 23, e01129. [Google Scholar] [CrossRef]
  21. Toebe, M.; Souza, R.R.D.; Mello, A.C.; Melo, P.J.D.; Segatto, A.; Castanha, A.C. Leaf area estimation of squash ‘Brasileirinha’ by leaf dimensions. Cienc. Rural. 2019, 49, e20180932. [Google Scholar] [CrossRef] [Green Version]
  22. Koubouris, G.; Bouranis, D.; Vogiatzis, E.; Nejad, A.R.; Giday, H.; Tsaniklidis, G.; Ligoxigakis, E.K.; Blazakis, K.; Kalaitzis, P.; Fanourakis, D. Leaf area estimation by considering leaf dimensions in olive tree. Sci. Hortic. 2018, 240, 440–445. [Google Scholar] [CrossRef]
  23. Rouphael, Y.; Colla, G.; Fanasca, S.; Karam, F. Leaf area estimation of sunflower leaves from simple linear measurements. Photosynthetica 2007, 45, 306–308. [Google Scholar] [CrossRef]
  24. Peksen, E. Non–destructive leaf area estimation model for faba bean (Vicia faba L.). Sci. Hortic. 2007, 113, 322–328. [Google Scholar] [CrossRef]
  25. Serdar, Ü.; Demirsoy, H. Non–destructive leaf area estimation in chestnut. Sci. Hortic. 2006, 108, 227–230. [Google Scholar] [CrossRef]
  26. Pandey, S.K.; Singh, H. A simple, cost-effective method for leaf area estimation. J. Bot. 2011, 2011, 658240. [Google Scholar] [CrossRef] [Green Version]
  27. Zanetti, S.; Pereira, L.F.; Sartori, M.M.P.; Silva, M.A. Leaf area estimation of cassava from linear dimensions. An. Acad. Bras. Cienc. 2017, 89, 1729–1736. [Google Scholar] [CrossRef] [PubMed] [Green Version]
  28. Trachta, M.A.; Junior, A.Z.; Alves, A.F.; Freitas, C.P.D.O.D.; Streck, N.A.; Cardoso, P.D.S.; Santos, A.T.L.; Nascimento, M.D.F.D.; Rossato, I.G.; Simões, G.P.; et al. Leaf area estimation with nondestructive method in cassava. Bragantia 2020, 79, 472–484. [Google Scholar] [CrossRef]
  29. Malik, A.I.; Kongsil, P.; Nguyễn, V.A.; Ou, W.; Srean, P.; López–Lavalle, L.A.B.; Utsumi, Y.; Lu, C.; Kittipadakul, P.; Nguyễn, H.H.; et al. Cassava breeding and agronomy in Asia: 50 years of history and future directions. Breed. Sci. 2020, 70, 145–166. [Google Scholar] [CrossRef] [Green Version]
  30. Department of Agriculture. Good Agricultural Practices for Cassava; National Bureau of Agricultural Commodity and Food Standards Ministry of Agriculture and Cooperatives: Bangkok, Thailand, 2008.
  31. Analytical Software. Statistix, version 10; Analytical Software: Tallahassee, FL, USA, 2013.
  32. Wallach, D.; Goffinet, B. Mean squared error of prediction as a criterion for evaluating and comparing system models. Ecol. Modell. 1989, 44, 299–306. [Google Scholar] [CrossRef]
  33. Irikura, V.; Cock, J.H.; Kawano, K. The physiological basis of genotype–temperature interactions in cassava. Field Crops Res. 1979, 2, 227–239. [Google Scholar] [CrossRef]
  34. Alves, A.A.C. Cassava botany and physiology. In Cassava: Biology, Production and Utilization; Hillocks, R.J., Thresh, J.M., Bellotti, A.C., Eds.; CABI Publishing: New York, NY, USA, 2002; pp. 67–89. [Google Scholar]
  35. Joaqui Barandica, O.; Pérez, J.C.; Lenis, J.I.; Calle, F.; Morante, N.; Pino, L.; Hershey, C.H.; Ceballos, H. Cassava breeding II: Phenotypic correlations through the different stages of selection. Front. Plant Sci. 2016, 7, 1649. [Google Scholar] [CrossRef] [Green Version]
  36. Kawano, K. Thirty years of cassava breeding for productivity–biological and social factors for success. Crop Sci. 2003, 43, 1325–1335. [Google Scholar] [CrossRef]
  37. Ojulong, H.F.; Labuschagne, M.T.; Herselman, L.; Fregene, M. Yield traits as selection indices in seedling populations of cassava. Crop Breed. Appl. Biotechnol. 2010, 10, 191–196. [Google Scholar] [CrossRef] [Green Version]
  38. Tan, S.L.; Cock, J.H. Branching habit as a yield determinant in cassava. Field Crops Res. 1979, 2, 281–289. [Google Scholar] [CrossRef]
Figure 1. Demonstration measurement of the length and width of the central lobe of cassava.
Agronomy 12 03013 g001
Figure 2. Diagram for the study process. L = length of the central lobe, W = width of the central lobe, N = number of lobes, K = product of length and width, J = product of length and number of lobes, LAI = leaf area index.
Agronomy 12 03013 g002
Figure 3. Dendrogram of Kasetsart 50 and CMR38–125–77 genotypes and 60 segregating progenies by Ward’s cluster analysis based on measured maximum individual leaf area (cm2).
Agronomy 12 03013 g003
Figure 4. Dendrogram of Kasetsart 50 and CMR38–125–77 genotypes and 60 segregating progenies by Ward’s cluster analysis based on total fresh weight (kg plant−1).
Agronomy 12 03013 g004
Figure 5. Estimated individual leaf area (cm2) and measured individual leaf area (cm2) using the function LA = 19.61L − 157.83 (a), LA = 3.68 L + 2.35K − 51.31 (b), LA = 8.92L + 1.18J − 99.29 (c), and LA = −3.39L + 2.04K + 1.01J − 15.10 (d) for cassava leaves of Kasetsart 50 and CMR38–125–77 genotypes and 60 segregating progenies (n = 2976), nRMSE = normalized root mean square error.
Agronomy 12 03013 g005
Figure 6. Estimated individual leaf area (cm2) and measured individual leaf area (cm2) using the function LA = 19.61L − 157.83 (a), LA = 3.68 L + 2.35K − 51.31 (b), LA = 8.92L + 1.18J − 99.29 (c), and LA = −3.39L + 2.04K + 1.01J − 15.10 (d) for cassava leaves of the Kasetsart 50 and CMR38–125–77 genotypes and 18 segregating progenies (n = 474), nRMSE = normalized root mean square error.
Agronomy 12 03013 g006
Table 1. Minimum, maximum, mean, median, and standard deviation of leaf area (LA), the length of the central lobe (L), the width of the central lobe (W), the number of lobes (N), the product of the length and width (K), and the product of the length and number of lobes (J).
AgeVariablenMinimumMaximumMeanMedianStandard
Deviation
3 MAPLA (cm2)37290.67458.80212.33206.4760.61
L (cm)37212.4024.0017.4017.202.09
W (cm)3722.407.004.454.400.94
N3725.009.006.847.000.91
K (cm2)37233.28160.4878.5176.5523.44
J (cm2)37271.50212.40119.38119.0023.43
4 MAPLA (cm2)37283.74412.77209.35206.3961.47
L (cm)37211.6025.7018.1718.202.54
W (cm)3722.206.304.214.200.72
N3723.009.006.617.001.01
K (cm2)37233.58147.4277.5875.6021.74
J (cm2)37245.00204.30120.20121.8025.32
5 MAPLA (cm2)37276.15470.98193.20184.7962.25
L (cm)37211.6027.0017.9518.002.47
W (cm)3722.506.804.144.100.72
N3723.009.006.247.001.08
K (cm2)37234.80182.9275.4673.3221.39
J (cm2)37244.10213.30112.48112.0027.09
6 MAPLA (cm2)37238.07374.58166.21159.2668.30
L (cm)37211.0024.7017.1617.002.64
W (cm)3721.805.903.933.900.75
N3723.009.006.026.001.13
K (cm2)37221.24143.2668.8366.6021.81
J (cm2)37237.20202.50104.55105.0029.96
7 MAPLA (cm2)37225.25342.37134.10123.2861.24
L (cm)3728.0024.5015.4815.002.93
W (cm)3721.805.603.603.500.73
N3723.009.005.405.001.35
K (cm2)37218.60129.8557.4252.5021.44
J (cm2)37224.00204.3085.3680.0032.43
8 MAPLA (cm2)37227.63308.38106.7393.0953.63
L (cm)3728.5021.4014.0013.952.59
W (cm)3721.805.603.343.200.71
N3722.009.004.975.001.46
K (cm2)37217.85109.2048.0944.8418.19
J (cm2)37221.00181.8071.2067.2529.12
9 MAPLA (cm2)37214.09322.1477.3567.7545.25
L (cm)3726.0025.0012.3812.102.73
W (cm)3721.206.003.002.900.72
N3721.008.004.615.001.55
K (cm2)3729.36150.0038.5235.4817.21
J (cm2)3729.50175.0058.4852.6527.93
10 MAPLA (cm2)37214.63246.2374.9864.7741.66
L (cm)3725.9020.0011.7411.402.82
W (cm)3721.405.602.982.900.73
N3722.007.004.645.001.33
K (cm2)37210.03100.2436.4633.7016.70
J (cm2)37218.60137.9055.9052.0024.86
n = number of leaves.
Table 2. The function models for estimating leaf area (LA) as a function of the length of the central lobe (L), the product of length and width (K), and the product of the length and number of lobes (J).
Independent VariableFunctionR2
LLA = 19.61L − 157.830.79
L, KLA = 3.68 L + 2.35K − 51.310.88
L, JLA = 8.92L + 1.18J − 99.290.87
L, K, JLA = −3.39L + 2.04K + 1.01J − 15.100.94
R2 = coefficient of determination.
Table 3. Correlation coefficient (r) between biomass and estimated maximum individual leaf area as a function of the length of the central lobe (L), the product of the length and width (K), and the product of the length and number of lobes (J).
Leaf AreaTotal Fresh WeightStorage Root Fresh Weight
Estimated maximum leaf area (L)0.50 **0.31 *
Estimated maximum leaf area (L, K)0.50 **0.32 *
Estimated maximum leaf area (L, J)0.51 **0.35 **
Estimated maximum leaf area (L, K, J)0.54 **0.33 **
*, ** Significant at the 0.05 and 0.01 probability levels, respectively.
Table 4. Correlation coefficient (r) between estimated leaf area index (LAI) (based on a function of the length of the central lobe (L), the product of length and width (K), and the product of length and number of lobes (J) together with the number of leaves) and measured LAI, total fresh weight, and storage root fresh weight.
Estimated LAIMeasured LAITotal Fresh WeightStorage Root Fresh Weight
Estimated LAI (L)0.93 **0.65 **0.44 **
Estimated LAI (L, K)0.94 **0.58 **0.41 **
Estimated LAI (L, J)0.95 **0.64 **0.46 **
Estimated LAI (L, K, J)0.96 **0.59 **0.43 **
** Significant at the 0.01 probability level.
Publisher’s Note: MDPI stays neutral with regard to jurisdictional claims in published maps and institutional affiliations.

