Article

Greenhouse Gas Emissions with Low Disturbance Liquid Dairy Manure Incorporation into a Live Winter Cereal Cover Crop-Corn System

Institute for Environmentally Integrated Dairy Management Research Unit, USDA-ARS, Marshfield, WI 54449, USA
*
Author to whom correspondence should be addressed.
Agronomy 2022, 12(12), 2978; https://doi.org/10.3390/agronomy12122978
Submission received: 15 October 2022 / Revised: 15 November 2022 / Accepted: 24 November 2022 / Published: 27 November 2022

Abstract

:
Dairy manure is an important nutrient source for crops but can also contribute to ammonia (NH3) and greenhouse gas (GHG) emissions. While incorporating manure into the soil reduces nutrient loss potential in surface runoff, impacts on GHGs are unclear. Here, our objective was to quantify NH3, nitrous oxide (N2O), methane (CH4), and carbon dioxide (CO2) fluxes for two seasons after liquid dairy manure was spring-applied to a live winter cereal cover crop-corn system with different incorporation methods. Broadcast application and no manure controls were compared to manure incorporated by vertical tillage (VT) or chisel plowing (CP). Corn yields did not differ in 2018 but were greater for CP in 2019. Mean NH3 emissions for VT were 70 and 23% of broadcast and 7 and 11% of broadcast for CP in 2018 and 2019, respectively. While VT N2O-N fluxes were also about 70% lower than broadcast both years, CO2 fluxes were larger for VT. On average, CP and VT had 16 and 4% lower global warming potential (GWP) index values than broadcast, respectively. Despite differing effects on N2O, our results showed that CP more effectively conserved NH3 while reducing GWP from liquid manure compared to VT, stressing the importance of site-specific soil-manure-tillage interactions when quantifying dairy system GHG fluxes.

1. Introduction

The use of dairy manure as a fertilizer is common in Wisconsin and the upper Midwest where dairy production is prevalent, but the use of manure on cropland can increase greenhouse gas (GHG) release from soils [1,2,3,4], particularly nitrous oxide (N2O), carbon dioxide (CO2), and methane (CH4). Manure addition to corn (Zea mays L.) or other crops also affects soil properties and carbon (C) sequestration that can further influence GHG fluxes [5]. Dairy manure additions can also lead to ammonia (NH3) loss, sometimes considered to be a secondary N2O emitter. Ammonia volatilization is also a major N loss pathway to the air, particularly with surface application [6,7,8]. Incorporating manure thus conserves more NH3 and decreases nitrogen (N) and phosphorus (P) runoff risk [9,10,11].
While tillage incorporation of manure or injection decreases NH3 loss, N2O fluxes can increase as a result of greater inorganic N availability [12]. Mineralization of manure organic N to NH4+ with subsequent nitrification (i.e., NH4+ → NO3) provides ample NO3 for denitrification reactions that drive N2O formation [13,14,15,16]. Tillage practices affect aeration status and interact with other factors including soil fertility, organic matter turnover/decomposition, C availability and therefore influence N2O dynamics [17].
Cover crops are utilized in corn production systems to decrease sediment and associated N and P losses in surface runoff, particularly in colder climates where winter runoff is a major contributor to annual loads [18,19,20], as well as reduce N leaching between cropping seasons through N assimilation [21,22]. Some studies suggest that soil C from cover crops can increase GHG emissions, especially N2O [23]), however, and the incorporation of the cover crop residues may significantly contribute to these increases [24]. Delaying cover crop termination for 1–2 weeks after planting or “planting green” into a cover crop is relatively new and few studies have examined agri-environmental benefits. By delaying cover crop termination until later, soil moisture can continue to be transpired, decreasing water-filled pore space and decreasing potential N2O release [21,25,26,27,28]. Later termination may also help slow decomposition, delaying N release to later in the season when corn needs more N [27,28,29].
Some studies show a potential yield depression with delaying cover crop termination near corn planting time or later [25,26,27,28,29]. Some degree of tillage and/or manure incorporation may help decrease this corn yield depression risk. Raimbault et al. [30] found moving residue out of the row area in no-till plots reduced negative effects on growth, while Ewing et al. [31] reported that subsoiling improved water availability to crops and increased grain yield where cover crops were present. However, Duiker and Curran [32] found no benefit of in-row tillage to no-till on crop yield or weed control with rye killed in the late boot-stage. Such studies document corn yield risks with planting green and ways to minimize potential yield losses, and in particular, post-planting cover crop (live) management schemes. While this is an important aspect of corn (Zea mays, L.) production, few studies have focused on water quality and GHG aspects of planting green [33]. Research on the effect of this practice on GHG emissions has been relatively non-existent.
Planting into live or recently terminated cover crops is gaining more interest, particularly with no-till and reduced tillage farms, however relatively few if any studies have investigated the impacts of manure incorporation on GHG and NH3 losses in upper Midwest corn-cover crop systems. The objective of our experiment was to quantify NH3, N2O, CH4, and CO2 fluxes in the field for two seasons after liquid dairy manure was either applied on the surface (broadcast) or incorporated via chisel plowing (CP) or vertical tillage (VT). We additionally measured corn and cover crop yield and monitored changes in soil C, N, and other properties.

2. Materials and Methods

This field experiment was conducted on a moderately well drained Loyal silt loam soil (fine-loamy, mixed, superactive, frigid Oxyaquic Glossudalfs; 1–6% slope) located on the University of Wisconsin Marshfield Agricultural Research Station at Stratford, WI. The field used was planted 12 September 2017 with a Brillion seeder to Triticale (Triticale hexaploide L.) at 224 kg ha−1 and 23 October 2018 to winter rye (Secale cereale) at 112 kg ha−1. Plots were arranged in a randomized complete block design with 4 blocks and 4 treatments, each 4.6 × 15.2 m in size. Blocks were set up along two transects (up and down the slope) with a 3-m-wide border between blocks within each transect and a 17-m-wide border between transects to accommodate the size and turning radius of field equipment. Plots were positioned and applications of dairy slurry were made along the longer dimension of the rectangle oriented perpendicular to the slope. Triticale was cut at a 10 cm height and harvested on 29 May 2018. Rye growth averaged a height of 25 cm in 2019 and was minimal enough to plant directly into the crop without cutting and harvesting.
Treatments consisted of a no-manure control (control) and three dairy manure treatments applied all on the same day each year (on 4 June 2018 and 6 June 2019). Dairy manure treatments were broadcast using a toolbar with drop tubes (Yetter Avenger, Yetter Manufacturing, Colchester, IL, USA) set at 30 cm spacings raised to a height of 38 cm above the soil surface in both years. The three manure treatments were: (1) surface application with no incorporation (broadcast); (2) surface application incorporated using a McFarlane Incite 5000 (McFarlane Manufacturing, Sauk City, WI, USA) vertical tillage tool at a 3° disk angle (VT) to a 3.5 cm depth; and (3) surface application incorporated using a Brillion chisel plow (Landoll Farm Equipment, Brillion, WI, USA) to a depth of 15 cm (CP), followed by a pass with the VT tool to smooth the surface for corn planting. The VT and CP plots received tillage within 10 min of manure application. Plots were immediately planted to silage corn (Zea mays L.; Prairie Estates C-2908 hybrid, Middleton, WI, USA 2018, 69,000 seeds ha−1; Dekalb DKC38-01 hybrid, St. Louis, MO, USA 2019, 84,785 seeds ha−1) after manure application and incorporation (CP and VT) using a John Deere Max Emerge six row planter (John Deere, Moline, IL, USA).
During the application process manure was sampled twice and subsequently tested (University of Wisconsin Soil and Forage Laboratory, Marshfield, WI, USA) for TN, TP, ammonium-N (NH4-N), water extractable P and solids content [34]. Manure application rates were approximately 66,200 L ha−1 in 2018, which supplied an average of 14.6 kg P ha−1 and 106 kg N ha−1, and 142,000 L ha−1. In 2019, an applicator mistakenly over-applied manure, supplying 66.7 kg P ha−1 and 293 kg N ha−1. Liquid fertilizer (7-9-13-2[S]) was applied via the planter in a 2 × 2 configuration (50 mm to the side of the seed row and 50 mm deep at a rate of 93.5 L ha−1. Cereal stubble was sprayed 25 June 2018 and 11 June 2019 with Roundup® (Monsanto, St. Louis, MO, USA) and Status® (BASF, Florham Park, NJ, USA) to reduce competition, the silage corn hybrid planted in 2018 was not roundup ready and the field was replanted 29 June 2018 with silage corn (Legacy 2847, Scandinavia, WI, USA) in the same manner as on 4 June 2018, except with no starter fertilizer.
Concentrations of N2O, NH3, CO2, and CH4 were measured using static chambers, (similar the GRACEnet protocol) [35] modified to work with a portable closed path Fourier-transform infrared spectrophotometer (FTIR, Gasmet DX4040, Vantaa, Finland). Chambers consisted of stainless-steel bases (81.3 × 38.1 × 15.2 cm) based on the design of Venterea [36], centered over the second and fifth row of each plot. Bases were inserted leaving an average height of 5 cm above soil surface to account for surface topography. Chambers were moved for field operations only, at which time they were alternately placed 1.5 or 2.5 m from plot edge in the respective row. Insulated stainless steel lids (81.3 × 38.1 × 15.2 cm) equipped with 0.64 cm quick connect fittings to connect to FTIR tubing were sealed (weather stripping) on top of bases during measurement by clipping steel lids to bases with binder clips. Gas samples were collected by FTIR, pumped through 4 m long 4 mm ID PTFE tubing equipped with a 47 mm polycarbonate membrane filter on the instrument inlet line to remove moisture and other debris, sample air was then pumped back into the chamber as part of the closed loop. Sample gas concentrations were determined every 40 s over a 7 min period and were typically determined in a window between 0800 h and 1300 h to approximate mean daily temperature. Gas fluxes were calculated from the rate of change in concentration over the sampling period with linear regression and adjusted for theoretical underestimation as described by Venterea [36] to compensate for chamber deployment. The method also permits estimates of GHG consumption by soils (expressed as negative fluxes on graphs).
Plot-level soil volumetric moisture content (5 cm depth; Delta-T Devices Theta Probe) and temperature (5 cm depth; digital soil thermometer) were measured at each sampling for necessary GHG flux adjustments. Measurement began about 1 day after manure application in 2018 and 2 days after in 2019 and continued into winter as weather allowed. Sampling resumed in the spring and was done approximately weekly (more frequently after manure or rain, less frequently late in the season) through corn harvest.
Soil bulk density was measured (two 48 mm-diam. × 0.1 m deep cores per plot) 4 to 6 times per year at the beginning of each sampling year and after field activities expected to affect bulk density (used for flux underestimation adjustments [36]). Soil samples were collected approximately monthly (6, 2 cm diameter cores/plot, 0 to 10 and 10 to 20 cm depths). Nitrate-N and NH4-N concentrations were determined after extraction by 2 M potassium chloride [34] and measured on a flow injection analyzer using standard techniques [37,38]. Prior to the start and after harvest in 2019 a more thorough soil sampling was done. Fifteen, 2 cm diameter cores/plot were collected and divided into 0 to 5; 5 to 10; 10 to 20; and 20 to 30 cm depths in addition to 3, 2 cm diameter cores taken at 30–60 cm depth. Samples were dried, ground (2-mm) and analyzed for plant available P, and potassium (K) [36], NO3-N, and NH4-N as described earlier, and OM by loss on ignition [39,40]. Wet soil aggregate stability was measured using 100 g subsamples (for 0 to 10, 10 to 20 and 20 to 30 cm depths) to determine mean weight diameter (MWD) and percent large (>2 mm diameter) and small (>0.25 mm to <2 mm diameter) macro-aggregates, and micro-aggregates (<0.25 mm diameter) [41].
Winter cereal rye biomass yields were estimated by gently tossing two sampling frames (0.25 × 0.25 m) into larger plots then from the location of the first sampling. Whole plant corn samples were taken at silage harvest, a 3.3 m section of rows 3 and 4 were cut 16 cm above the soil surface, chopped, and weighed. Corn and cereal biomass samples were dried (55 °C), ground (1 mm), and analyzed for N by high temperature combustion (Elementar VarioMax CN analyzer). Residue cover (corn and cereal) was measured by photographs using digital imagery analysis (SamplePoint software) [42], 2 photos per plot (each 2.25 m2). Residue coverage was measured prior to manure application and planting and after to contrast coverage changes due to field activity. Monthly precipitation and air temperature were obtained from a portable weather station on the edge of the field (Spectrum Technologies, Aurora, IL, USA).
Plots were arranged in a randomized complete block design and manure application method was the main effect with NH3, N2O, CH4, and CO2 as dependent variables. Analysis of variance was conducted to test for main effects using the Proc Mixed procedure of the Statistical Analysis System (SAS) and least square means were separated using the PDIFF option [43]. Block was treated as a random effect. Data were tested (Proc Univariate) and transformed (log10 or square root) as needed for normality and homogeneity of variance. Annual cumulative GHG flux was estimated by linear interpolation between sampling times by trapezoidal integration of flux over time assuming linear changes in daily fluxes [36]. Sampling years were considered to span from the spring through the fall/early winter of each year. All dependent variables are presented as untransformed means to maintain consistency. Pearson correlation coefficients were conducted between GHGs, soil temperature, and volumetric moisture content (Proc Corr). Because of the inherent variability associated with NH3 and GHG fluxes, treatment effects and means were considered significant at p ≤ 0.05.

3. Results and Discussion
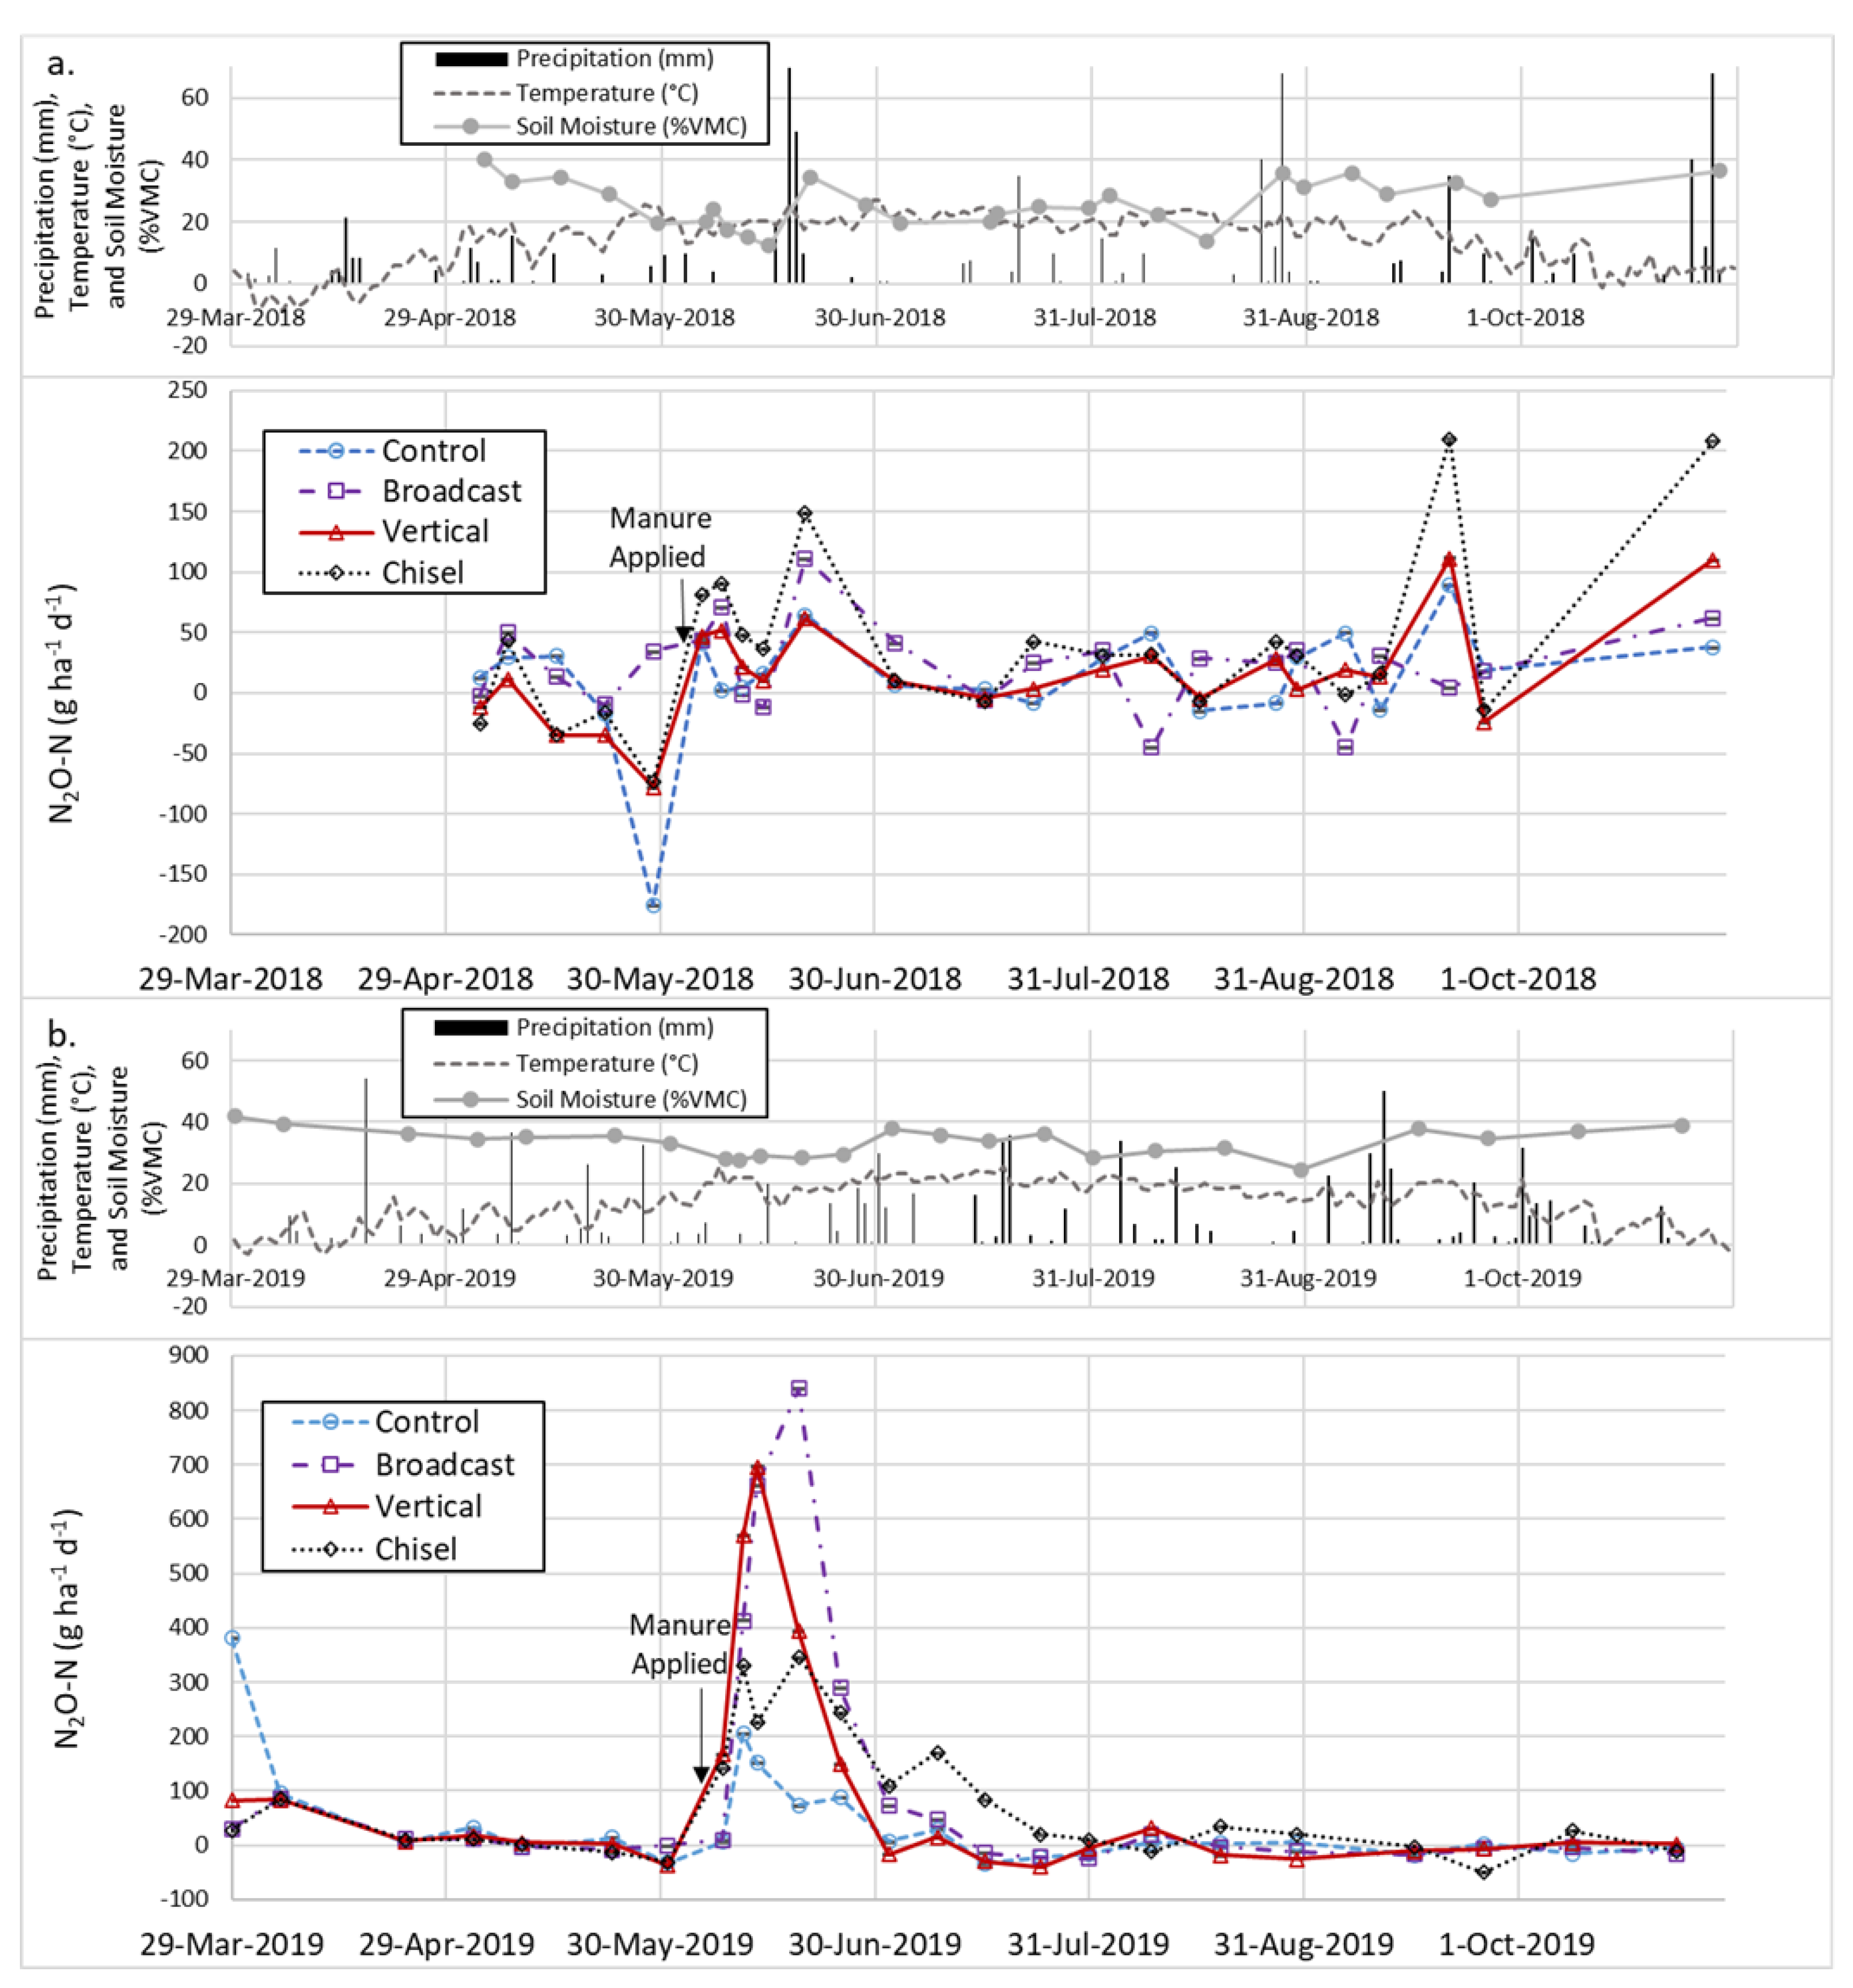
3.1. Weather

Average temperatures for the growing season averaged within 1% of the 40-year average (18.9 °C; Jason Cavadini, personal communication, 2017). Rain totals during the growing season were similar in 2018 (529 mm) and 2019 (517 mm) but the distribution varied. Rainfall totals were on average 19% greater than the 40-year average during the growing season (May to September). Most of the rain for 2018 fell in a few large events in June and the end of August with very few smaller events the rest of the season, while in 2019 it was more evenly distributed (additional weather data are presented in the GHG section).

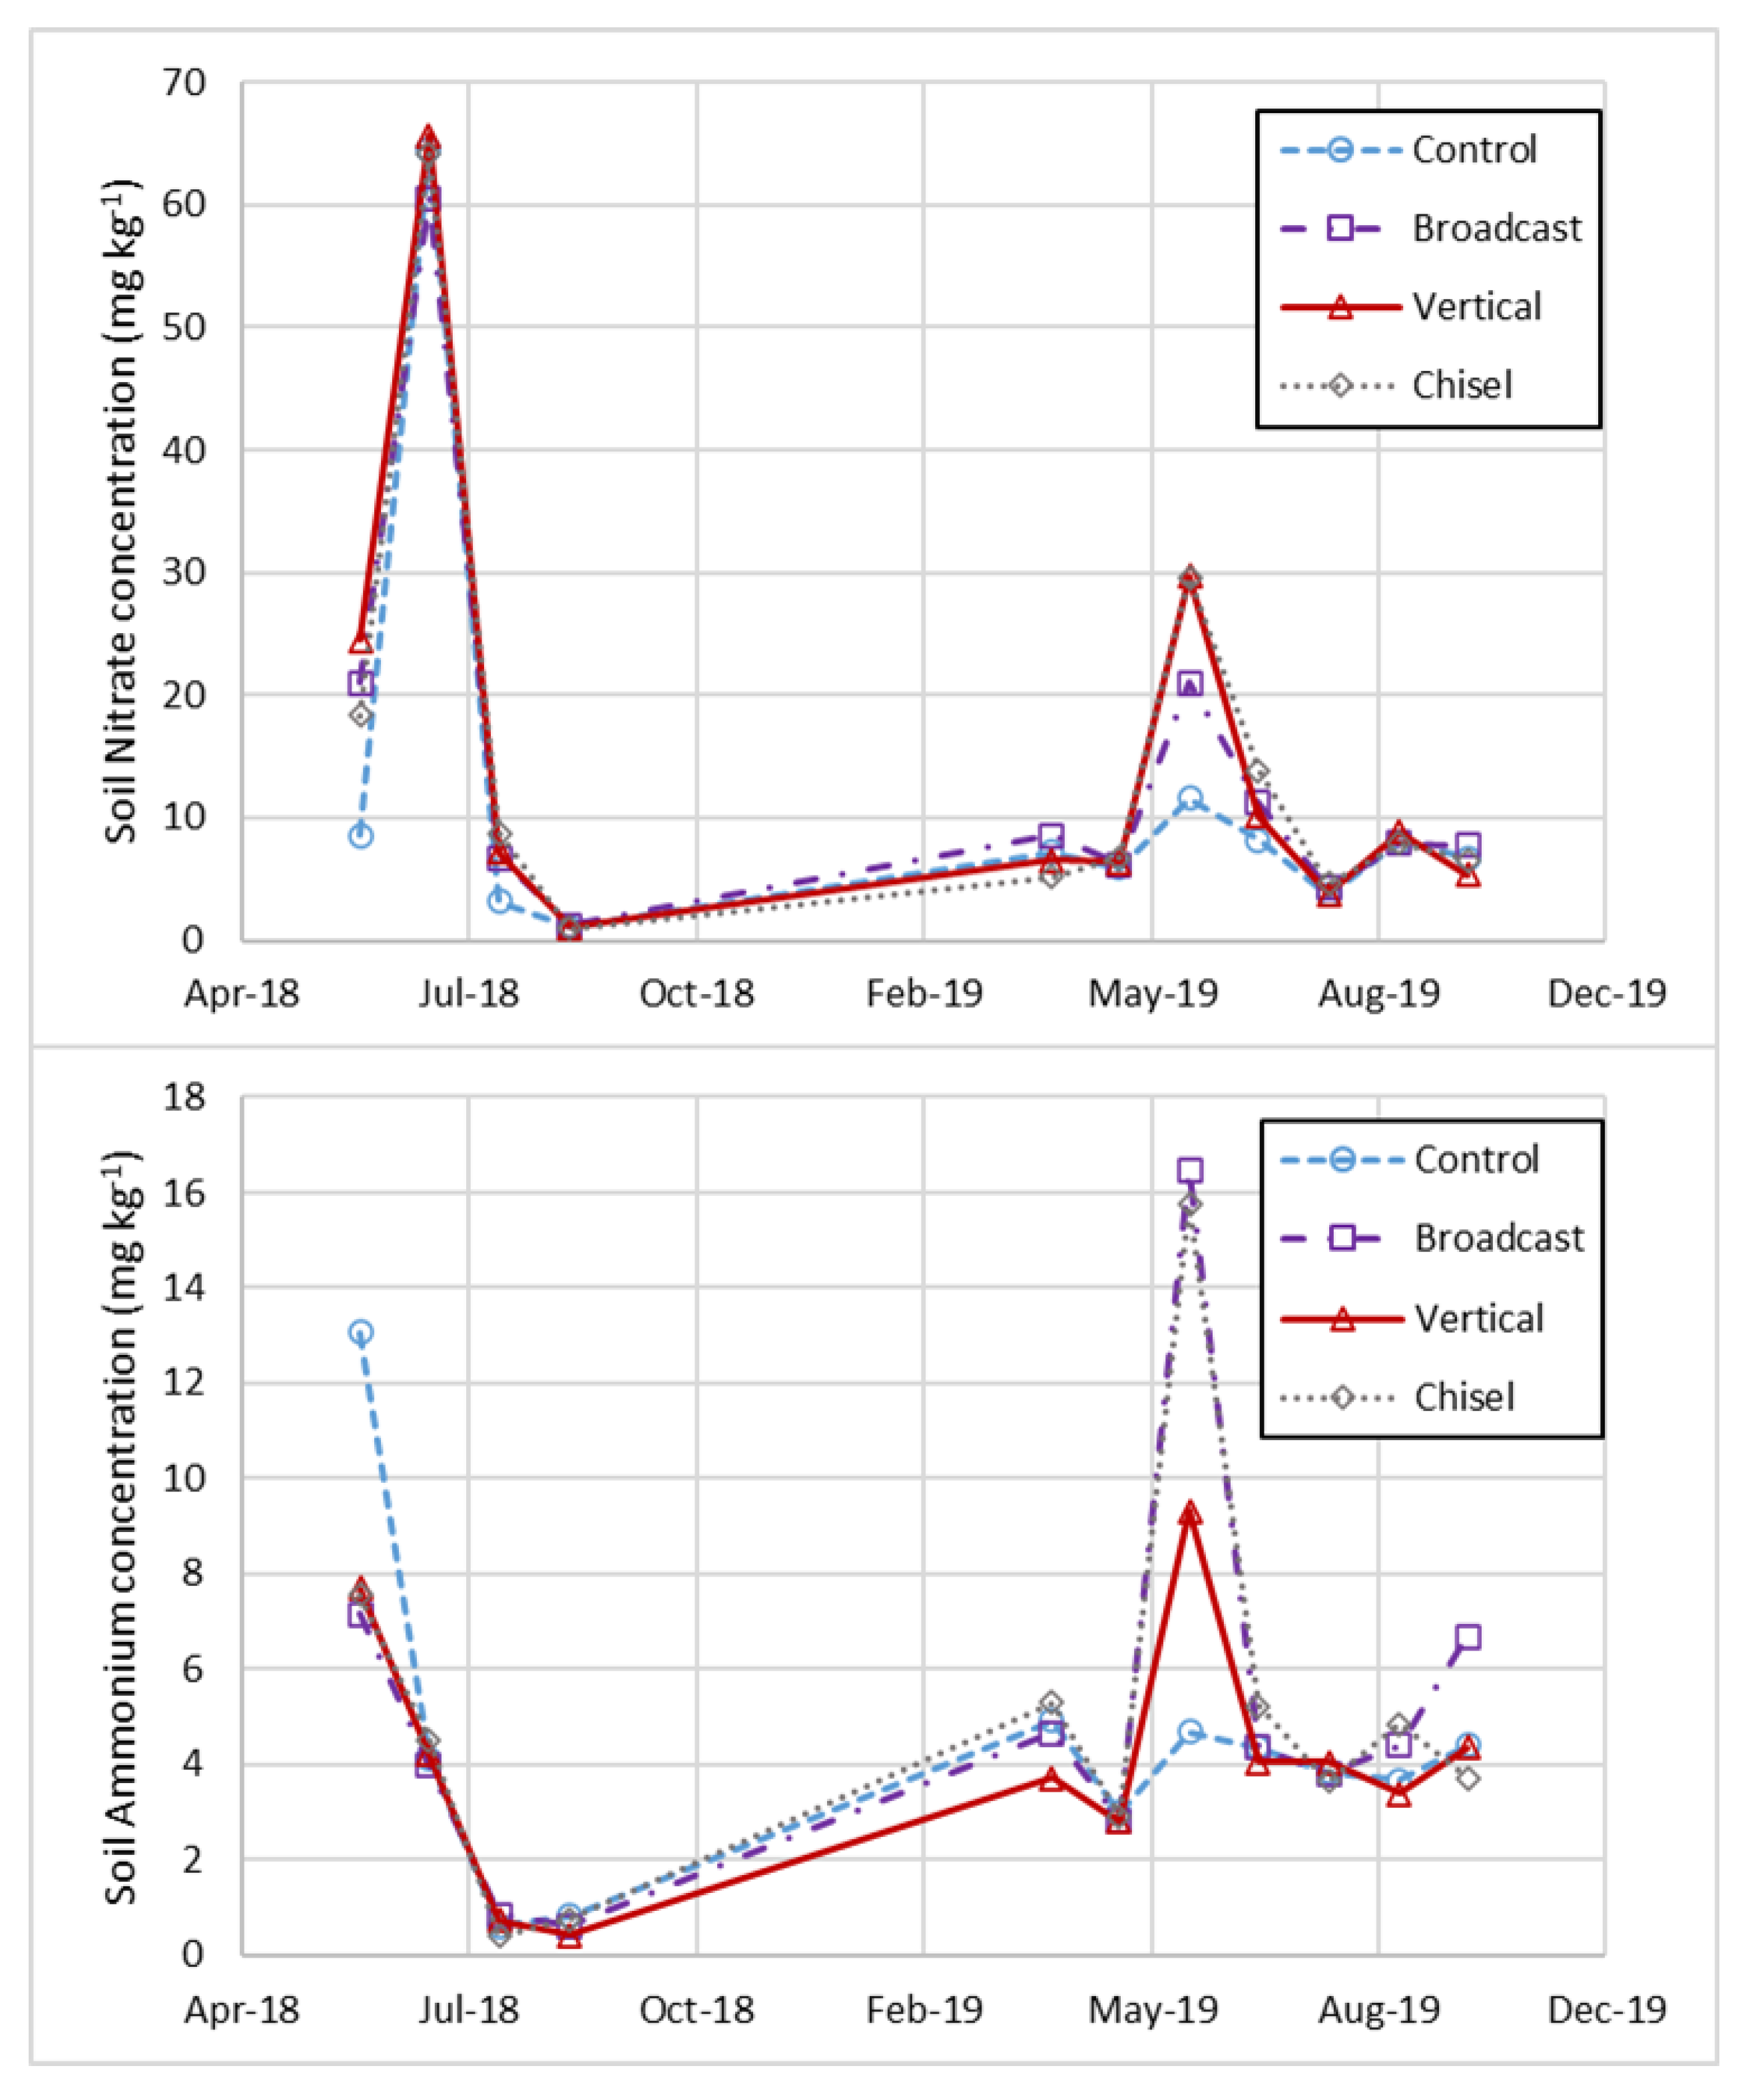
3.2. Plant Yields and Soil Nutrients
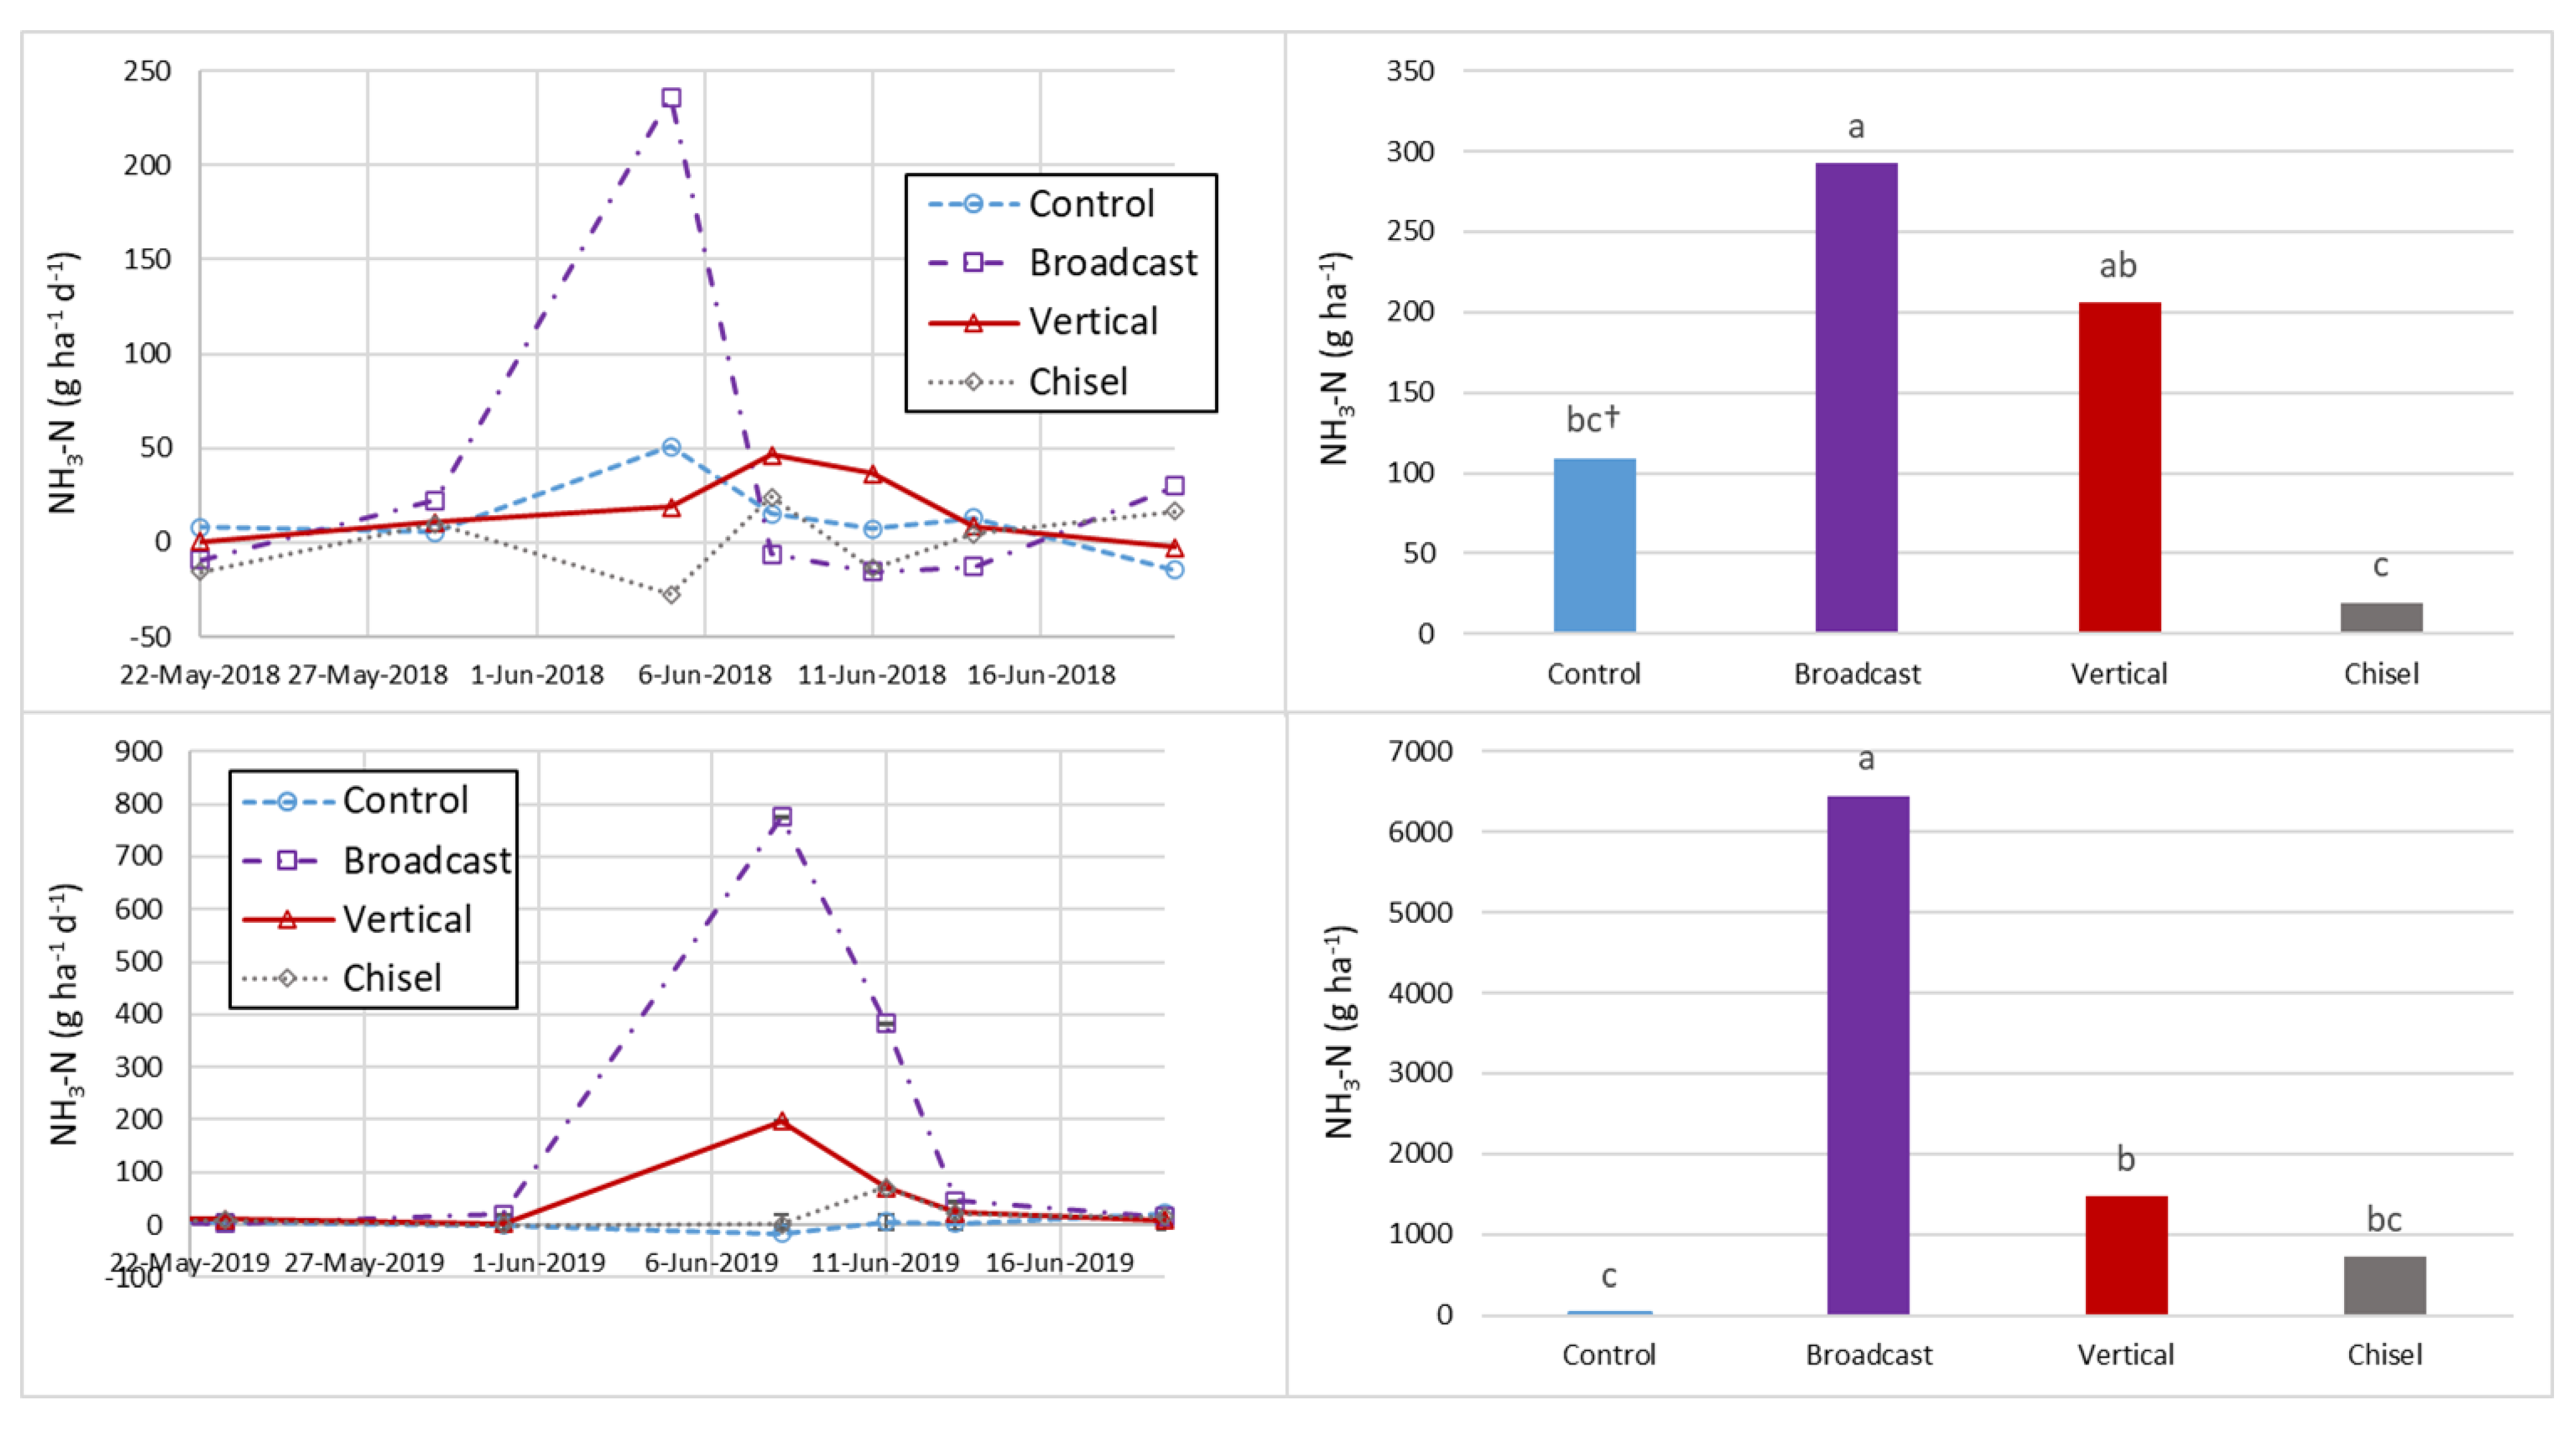
There were no differences in cereal growth among treatments before the trial began in 2018 (average 6413 kg ha−1) or in 2019 (average 1214 kg ha−1). There were also no significant differences for corn yield (average 12.2 Mg ha−1) or N uptake (average 140 kg ha−1) in 2018. However, CP had significantly greater yield in 2019 (14.0 Mg ha−1) with lower yields for control and broadcast (7.3 and 9.6 Mg ha−1, respectively). Uptake of N also differed among treatments in 2019 with a similar trend for treatments. Soil PSNT levels differed among treatments in 2018 (data not shown) with all above the critical range for corn (21–26 mg kg−1) [44,45]. In 2019, PSNT for CP was 8.2 mg NO3-N kg−1 while control and broadcast were 3.8 mg kg−1; the low values were likely due to a rainy period that occurred in late June 2019. While VT incorporated less manure than CP and yield and N uptake were also lower than CP, it was higher than broadcast (10.7 Mg ha−1 and 99.3 kg ha−1, respectively). Later terminated cereal rye incorporated into the soil may release N at a time corn needs it most within the root zone [29], which may additionally have contributed to CP higher yield and N uptake and intermediate yield for VT.
There were no significant soil nutrient differences in the top three depth increments prior to treatment in 2018 (Table 1). In October of 2019, N, C, K, P, and OM were significantly lower in CP plots than VT or surface applied treatments at the 0–5 cm depth, and in some cases (N, C, and OM) were lower than the control (Table 1). At 5–10 cm CP was only significantly lower in C but had the lowest OM content of all treatments in the 10–20 and 20–30 cm depth, as well as low C and N at 20–30 cm. Tillage in some cases can cause significant C depletion due to dilution effects [46]. The CP treatment incorporated manure and stubble (approximately 15 cm of disturbance) into the soil and mixing biomass throughout the upper portion of the soil more vigorously than VT and likely contributed to lower soil C and N. Since mixing residue/manure via CP tends to decrease topsoil nutrients including labile C via mass dilution, it is possible that microbe respiration was reduced by lack of labile C, particularly if structural disruption led to surface crusting and lower oxygen diffusion [4,47], further reducing respiration/CO2 flux.
Aggregate stability measurements also showed some impact of lower soil OM from CP. There were no aggregate size classes or MWD differences in 2018 for soil samples (data not shown). In 2019, CP had significantly lower MWD at all measured depths (about 50% of other treatments, average) and also significant aggregate size distribution changes compared to other treatments (10% greater microaggregates at all depths and 20% less large macroaggregates in surface soils). These results could be related to the combination of mechanical disruption, lower biological activity and OM content [48].

3.3. Ammonia Fluxes

An average of 4753 kg DM ha−1, 200 kg TN ha−1, 40.6 kg TP ha−1, 116 kg NH4-N ha−1, and 9.8 kg WEP ha−1 was applied in manure. Emissions of NH3-N were generally greatest immediately after manure was applied (Figure 1, left panels). In both years broadcast lost the greatest amount of cumulative NH3-N (Fig 1, right panels) but there were some differences in effectiveness of incorporation on N conservation. In both years, CP NH3 losses were statistically similar to the control.
Differences between years is likely related to the manure quantity and quality applied as has been seen elsewhere [6,8]. The solids content was one fifth and NH4-N content was 50% lower in the manure applied in 2018 than 2019. The lower solids content manure was likely able to move into the soil more easily, leaving less on the surface where NH3 volatilization rates are far greater [49,50]. Greater solids application in 2019 likely kept manure on the soil surface and on the cover crop biomass for longer allowing for greater losses. Residue coverage measurements show 26% more manure on the surface for broadcast and 24% for VT in 2019 than 2018 emphasizing overall less incorporation/absorption into the soil.
The overall amounts of NH3-N loss were much lower than what has been cited elsewhere [6,51,52] and could be partly due to delayed sampling for NH3 to permit FTIR measurements, since large NH3 volatilization losses can occur within hours after manure application [6,7,53]. Dell et al. [6] reported >50% of NH4-N applied was lost with broadcast application during this short timeframe.
Our methodology quantified fluxes days after manure application based on linear relationships, thus more rapid changes in NH3 fluxes after manure application may not be captured accurately. Other methods, such as passive diffusion sampling [54], can track NH3-N loss in the hours after application but is extremely labor intensive. Notwithstanding, relationships in our study still reflect overall field scale loss patterns as treatment impacts indicative of other studies showing CP can reduce NH3 by 90% vs. broadcast, while lower disturbance methods are less effective and more variable [6,7].

3.4. Nitrous Oxide Fluxes
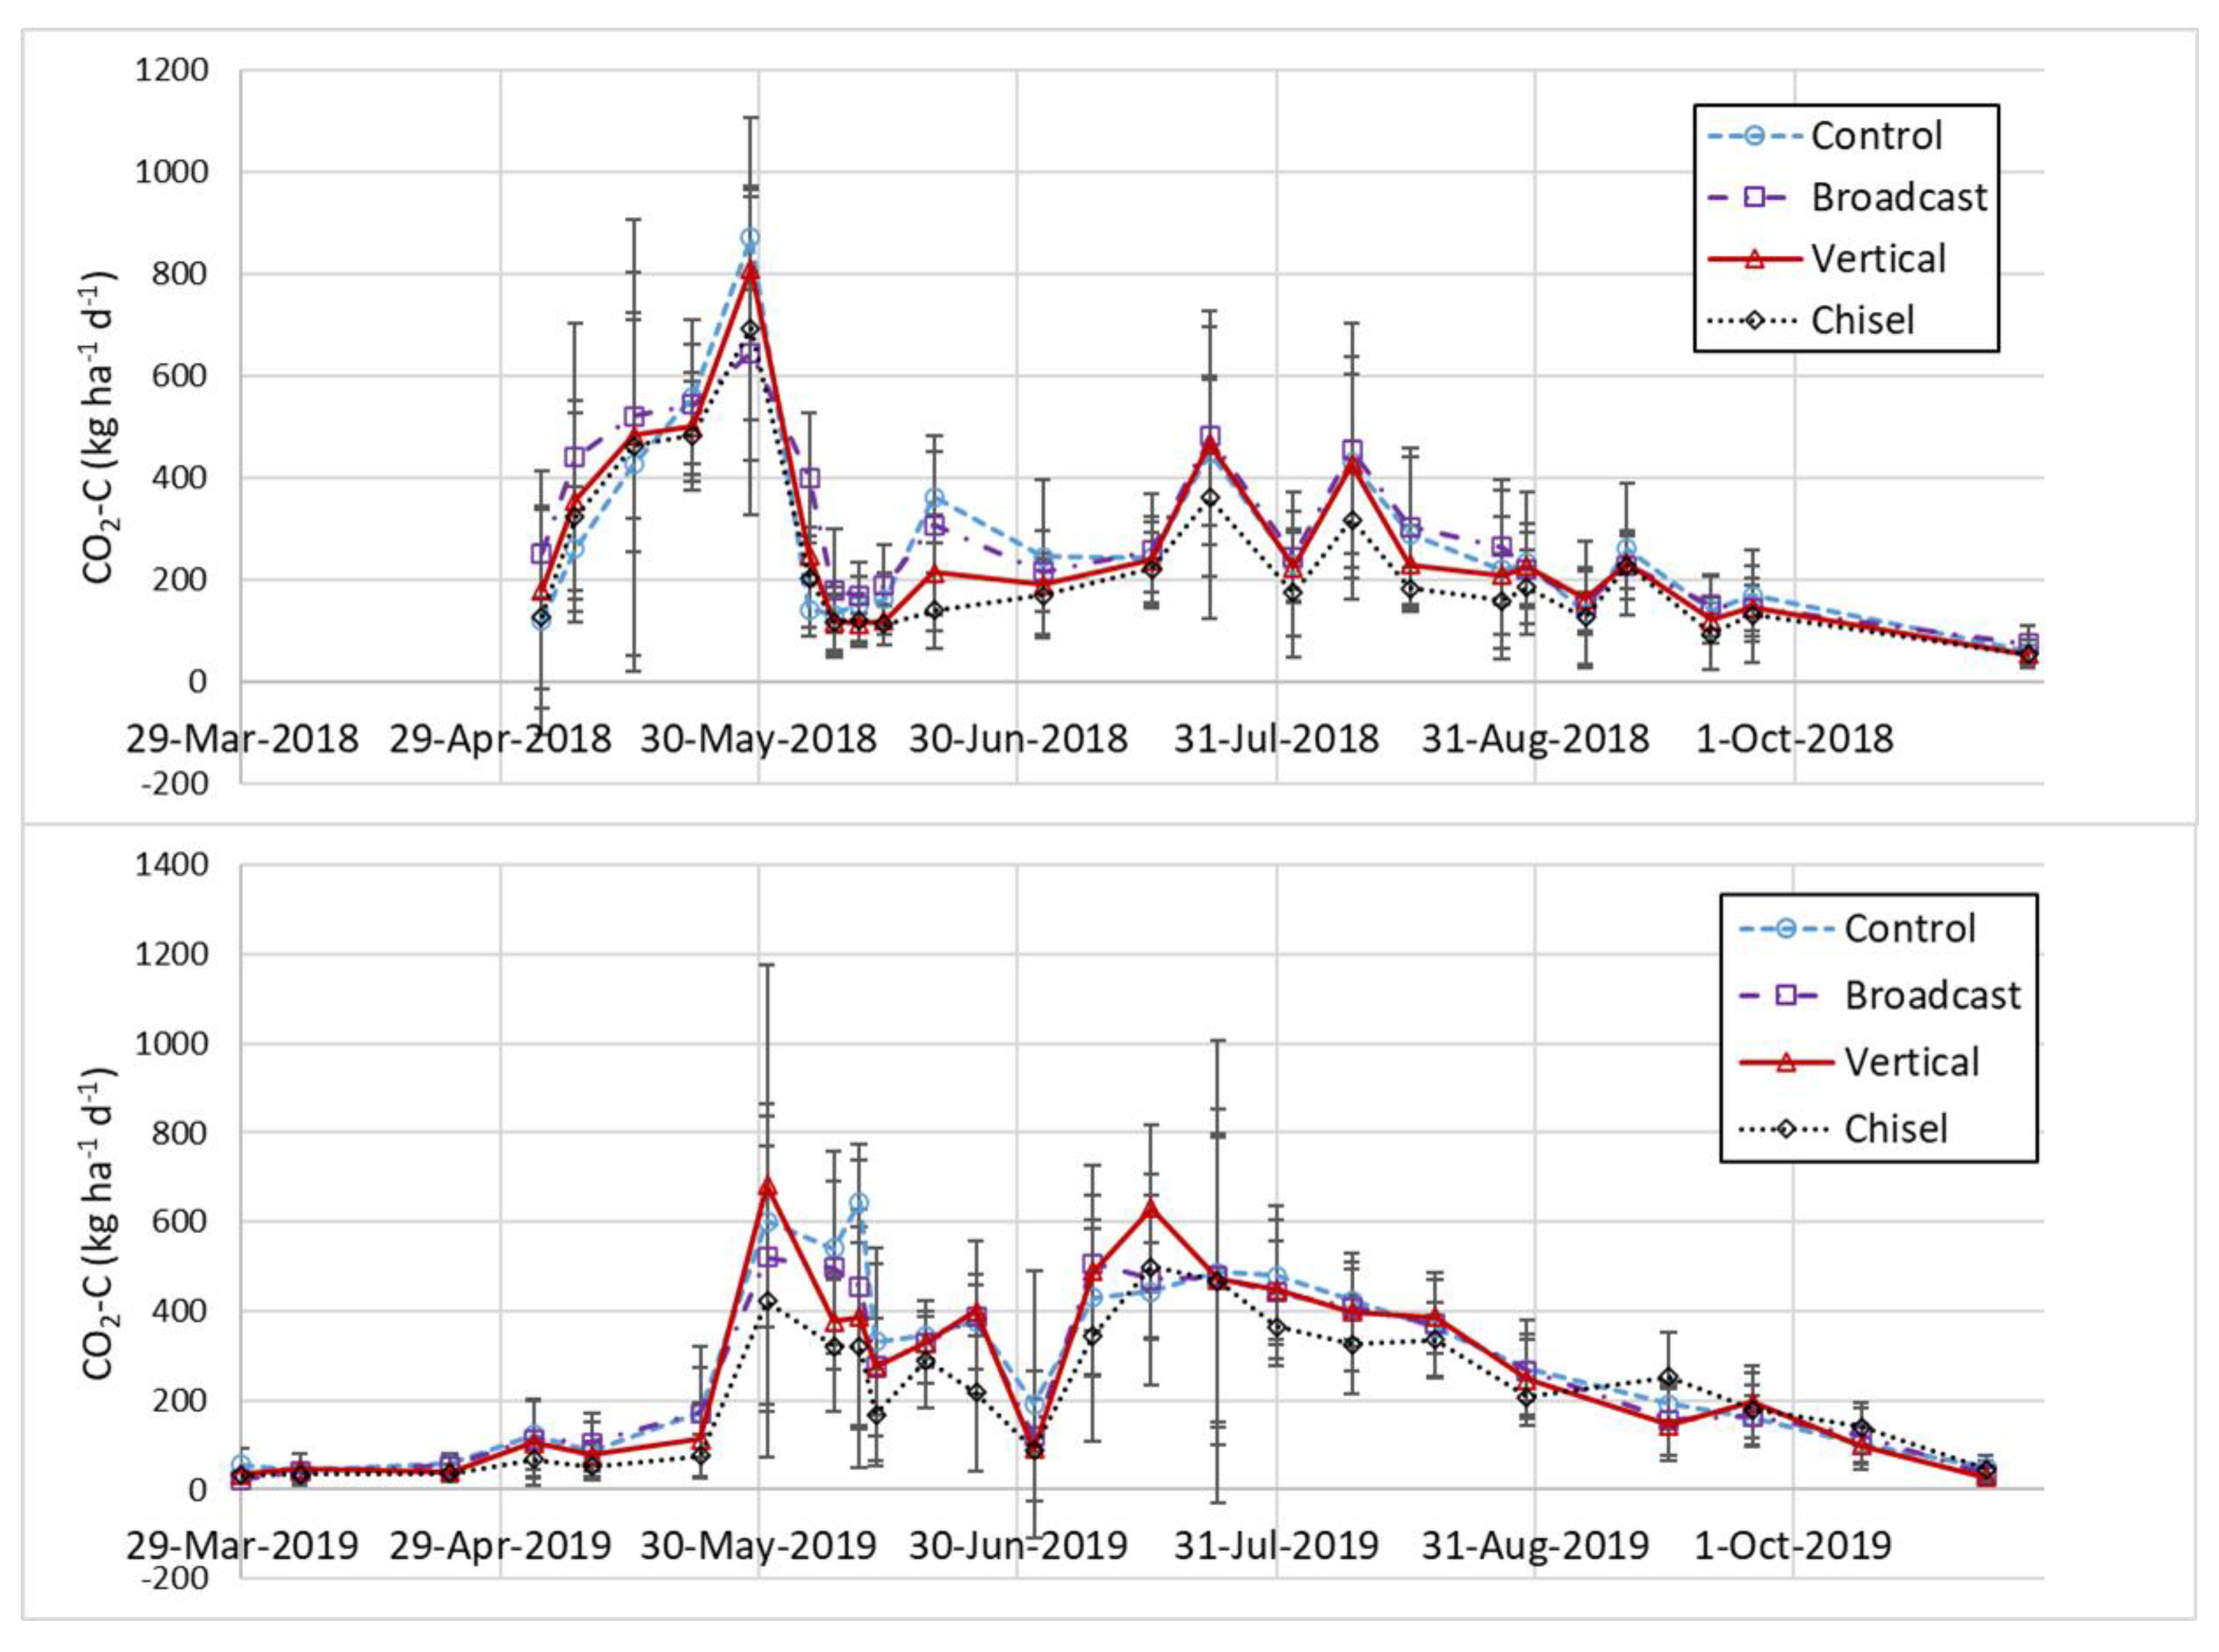
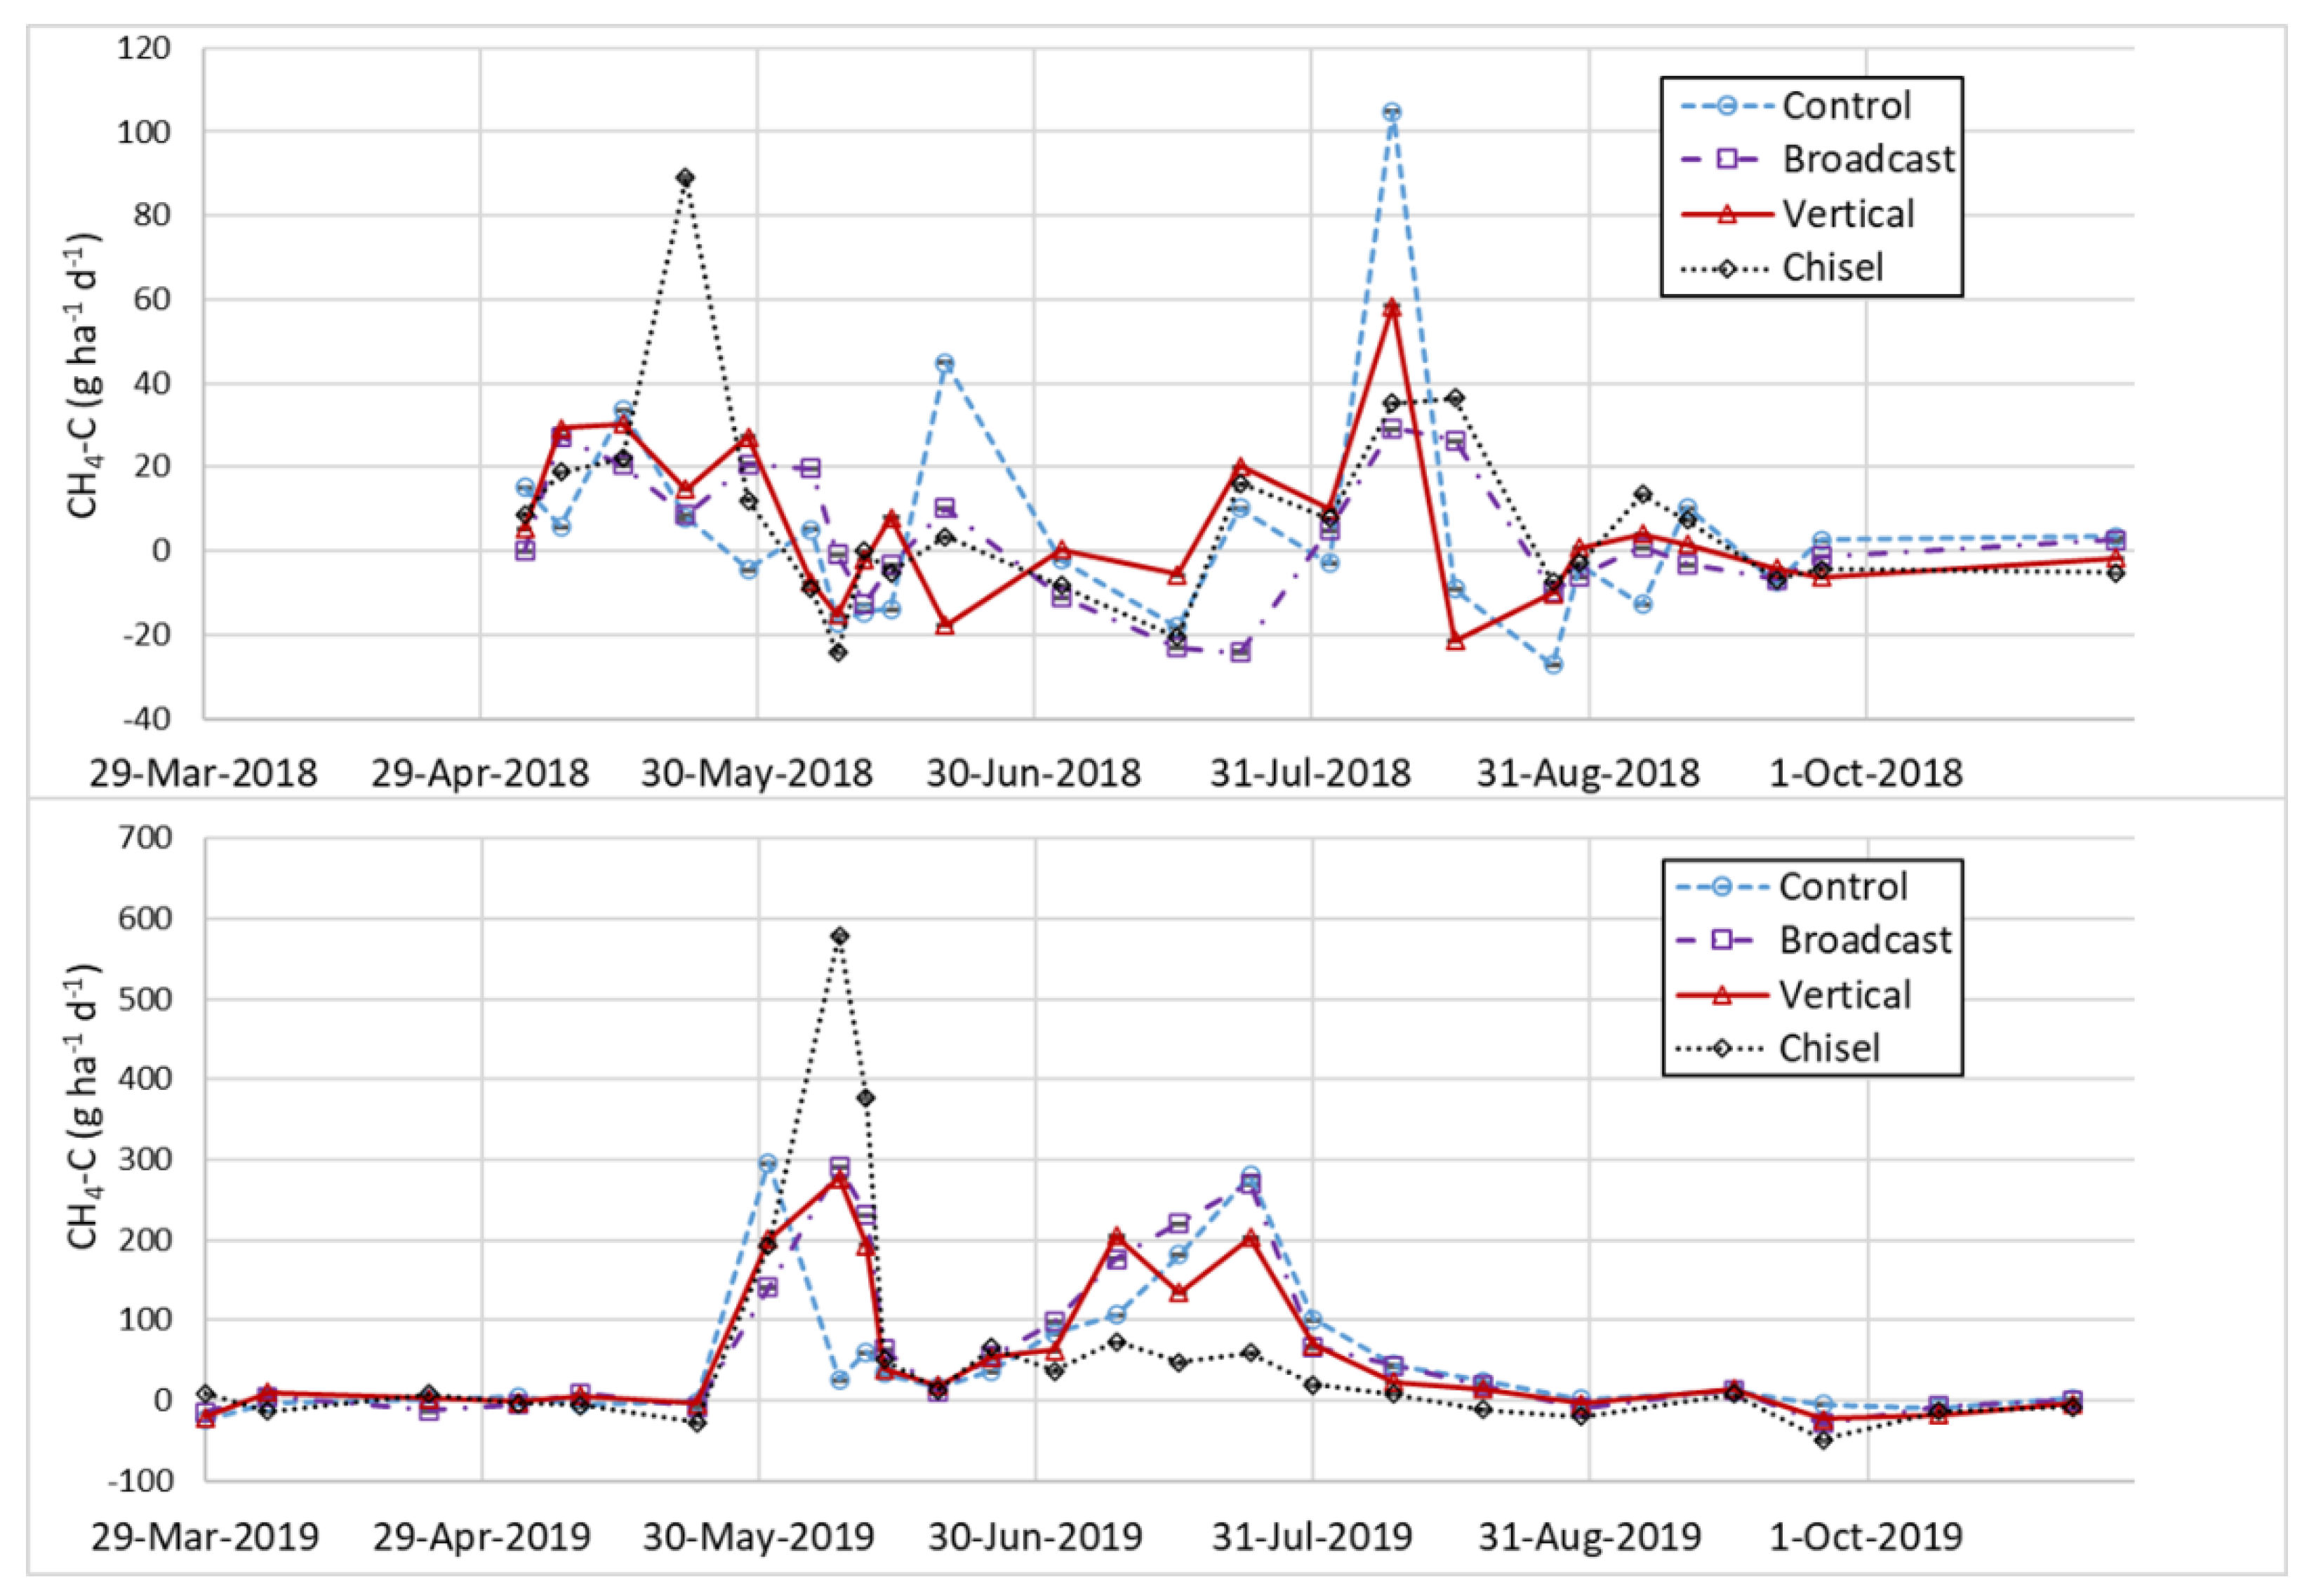
Mean N2O-N emissions in 2018 increased after manure application (4–7 days following) and during the fall period (September), whereas in 2019 emission increases were primarily after manure application (5–20 days following) (Figure 2). Additional peaks were evident in both years after large precipitation events. Soil moisture fluctuated to a greater extent in 2018 (average = 26.2% range: 12.4 to 40.2%) and was generally lower than 2019 (average = 33.2%; range: 24.5 to 41.8%) and may relate to the lower N2O emissions, as greater moisture content leads to more water-filled pore space (WFPS), favoring N2O release. Average WFPS in 2018 was only 52%, much lower than 70% in 2019; the threshold for increased denitrification is between 60 and 65% [27,28]. Overall, N2O was not significantly correlated with moisture or temperature and could be related to the variability in weather conditions between years and at the time of manure application.
There were few significant differences among treatments within sampling dates, with only one difference in 2018 and four in 2019 (all occurring right after manure application.) Total cumulative N2O losses represented 4.4%, 3.0%, and 8.8% of TN applications in 2018 and 4.2%, 2.9%, and 3.4% of TN applications in 2019 for broadcast, VT, and CP, respectively. Injection/incorporation of manure generally increases N2O-N emissions [4,8,55] with reduced tillage tending to increase emissions over conventional tillage [17]. In 2018, cumulative N2O loss for CP was significantly greater than other treatments (broadcast, VT, and control total emissions were 49%, 34%, and 26% of CP), however it was only significantly greater than the control in 2019 and similar to other manure treatments (broadcast, VT, and control total emissions were 125%, 85%, and 39% of CP). Additionally, broadcast total emissions were significantly greater than the control.
Van Kessel et al. [56] reported that N2O fluxes for no-till or reduced tillage were only lower than conventional tillage for long-term studies compared to shorter duration experiments across 239 studies, possibly due to compaction restricting gas escape [13]. They reported similar N2O fluxes for incorporated and surface application, hypothesizing that soil crusting/structural damage limited O2 diffusion for both practices, confounding potential difference compared to less restrictive soil conditions [57]. It is possible that the higher emissions from untilled broadcast plots in our trial was related to variable legacy compaction in these silt loam soils from heavy manure tanker traffic over time.
Greater crop N uptake in 2018 may have additionally contributed to fewer differences in N2O fluxes among treatments in 2019, as soil inorganic N was not replenished to 2018 levels with manure additions in 2019 (largely due to high NH3-N losses (Figure 1) and immediate high N2O-N release (Figure 2)) and concentrations of both NO3-N and NH4-N were quite low at the end of July (Figure 3). Soil NH4-N concentration was particularly high in 2019 for CP and broadcast (Figure 3), approximately twice 2018 levels after manure application, which may have contributed to the larger N2O loss for those treatments immediately after application additionally contributing to low inorganic N levels by July. The high application rate may have also contributed to a sealing effect for broadcast, possibly further reducing aeration. Some studies have reported that C near the surface can stimulate N2O production by increasing microbial activity [4,48,58], which could have also contributed to the relatively high emissions for broadcast application in our study.

3.5. Carbon Fluxes

Methane emissions were variable in 2018 and 2019 (Figure 4), however patterns appeared to be related to changes in soil moisture and temperature and CH4-C flux was significantly correlated to temperature (r = 0.28; p = 0.0002) on average over the two years. Fluxes were generally low in 2018, with larger emission rates after rain in mid-June and late July. Emissions were much larger in 2019, likely driven by the overall wetter season, particularly the large spike after manure application on June 6. Other research has demonstrated CH4 flux spikes after liquid manure application [53,59,60]. Numerical differences among treatments were noted in 2018 and 2019 near the time of peak emissions, however treatment effects were variable and inconsistent, contributing to the overall lack of significance. Several other trials have also reported a lack treatment effects for tillage practice and/or amendment sources on CH4 fluxes [2,61,62]. Greater soil moisture/lower redox status increases CH4 release potential [2,53,61] as microbes consume oxygen. In our study, there was a weak but significant correlation between soil moisture content and CH4-C fluxes (r = 0.24, p = 0.02) in 2019 but not in 2018.
Event based and cumulative CO2 fluxes were consistently lower for CP, with 18% lower mean cumulative CO2-C fluxes than VT and 22% lower than broadcast (Figure 5). Not surprisingly, CO2 fluxes were correlated with soil temperature (r = 0.53; p < 0.0001) as others have reported [3,63,64]. Soil moisture content was also weakly correlated with CO2 fluxes (r = −0.18; p = 0.02) with generally lower CO2 fluxes when soils were wetter.
Higher C and N as well as larger bacterial biomass near the surface in reduced or no tillage soils has been linked with greater CO2 fluxes compared to conventional tillage [28]. Some studies have reported higher CO2-C emissions with manure incorporation, suggesting C substrates are readily decomposed and that mechanical aeration further aids this process [1,13,65]. In contrast, tillage has also been reported to reduce respiration and CO2 production [17,66] by burying residues in deeper layers, effectively slowing down decomposition/respiration. We hypothesize that CP likely had a similar effect in our study, diluting labile C and reducing respiration. Disruption of soil structure and crusting at the surface in these silt loam soils may have also contributed, since a lack of macroporosity has been linked to lower CO2 emissions [13,52]. The incorporation of live biomass when planting green may have additionally reduced CO2-C emissions by being more recalcitrant to rapid decomposition than dead residue [1,13,65].

3.6. Global Warming Potential

Global warming potential (GWP) was calculated by multiplying cumulative emissions for each GHG for the sampling season by its AR5 100-year GWP value (using 265 for N2O plus 1% of NH3-N as N2O and 28 for CH4 [67]) to calculate CO2-equivalents. Incorporating manure led to significantly lower overall GWP for CP (16% lower than broadcast; data not shown) in both years, primarily because of lower CO2 flux. On average, VT had a 4% lower GWP than broadcast and was similar to the control. Because of the large contribution of CO2 to the GWP, we made estimates for just N2O and CH4 equivalents due to their potency as GHG’s. On average across the two years, broadcast and CP had significantly greater GWP than the control. Additionally, VT was not statistically different than the control, showing mitigation of N2O and CH4 emissions with VT is possible. It should also be noted, however, that in the context of IPCC GHG estimates [67], particularly in the case of N2O, the amount of N2O lost as a percentage of total N applied for all treatments in both years was far above the 0.4% emission factor assigned to organic manure amendments, especially under the wet study conditions.

4. Conclusions

Our results suggest that while incorporating manure significantly decreased NH3-N losses by an average of 54% for VT and 92% for CP, it increased N2O-N emission potential, particularly for CP. The VT treatment showed potential to decrease N2O-N emissions over CP, while also decreasing NH3-N losses and maintaining yields similar to CP under wet post-plant conditions. Incorporating manure into a live cover crop has promise for reducing overall GHG emissions, particularly when considering GWP, and at the same time, conserving N and increasing yield compared to broadcast manure application. Minimal tillage with VT has the added benefit of maintaining low disturbance designed to enhance drainage/aeration, minimize soil structure damage and mitigate nutrient loss risk in general. More research is warranted to better understand the environmental and yield benefits of incorporating manure into a live cover crop and associated impacts on nutrient cycling and GHG dynamics over multiple seasons in different regions.

Author Contributions

Conceptualization, J.S.; methodology, J.S.; software, J.S. and E.Y.; validation, J.S. and E.Y.; formal analysis, J.S.; investigation, J.S.; resources, J.S.; data curation, J.S.; writing—original draft preparation, J.S.; writing—review and editing, J.S. and E.Y.; visualization, J.S.; supervision, J.S.; project administration, J.S.; All authors have read and agreed to the published version of the manuscript.

Funding

This research received no external funding.

Data Availability Statement

Published USDA-ARS data are publicly available.

Acknowledgments

The authors thank the University of Wisconsin, Marshfield Agricultural research Station field crop staff for their time operating equipment for this research.

Conflicts of Interest

The authors declare no conflict of interest.

References

  1. Dittmer, K.M.; Darby, H.M.; Goeschel, T.R.; Adair, E.C. Benefits and tradeoffs of reduced tillage and manure application in a Zea mays silage system. J. Environ. Qual. 2020, 49, 1236–1250. [Google Scholar] [CrossRef] [PubMed]
  2. Dungan, R.S.; Leytem, A.B.; Tarkalson, D.D.; Ippolito, J.A.; Bjorneberg, D.L. Greenhouse gas emissions from an irrigated dairy forage rotation as influenced by fertilizer and manure applications. Soil Sci. Soc. Am. J. 2017, 81, 537–545. [Google Scholar] [CrossRef] [Green Version]
  3. Leytem, A.B.; Moore, A.D.; Dungan, R.S. Greenhouse gas emissions from an irrigated crop rotation utilizing dairy manure. Soil Sci. Soc. Am. J. 2019, 83, 137–152. [Google Scholar] [CrossRef] [Green Version]
  4. Zhou, M.; Zhu, B.; Wang, S.; Zhu, X.; Vereecken, H.; Bruggemann, N. Stimulation of N2O emission by manure application to agricultural soils may largely offset carbon benefits: A global meta-analysis. Glob. Chang. Biol. 2017, 23, 4068–4083. [Google Scholar] [CrossRef] [PubMed]
  5. Fargione, J.E.; Bassett, T.; Boucher, S.D.; Bridgham, R.T.; Conant, S.C.; Cook-Patton, S.C.; Ellis, P.W.; Falcucci, A.; Fourqurean, J.W.; Griscom, B.W.; et al. Natural climate solutions for the United States. Sci. Adv. 2018, 4, eaat1869. [Google Scholar]
  6. Dell, C.J.; Kleinman, P.J.A.; Schmidt, J.P.; Beegle, D.B. Low-disturbance manure incorporation effects on ammonia and nitrate loss. J. Environ. Qual. 2012, 41, 928–937. [Google Scholar] [CrossRef]
  7. Dell, C.J.; Meisinger, J.J.; Beegle, D.B. Subsurface application of manures slurries for conservation tillage and pasture soils and thier impact on the nitrogen balance. J. Environ. Qual. 2011, 40, 352–361. [Google Scholar] [CrossRef]
  8. Duncan, E.W.; Dell, C.J.; Kleinman, P.J.; Beegle, D.B. Nitrous oxide and ammonia emissions from injected and broadcast-applied dairy slurry. J. Environ. Qual. 2017, 46, 36–44. [Google Scholar] [CrossRef]
  9. Jokela, W.E.; Coblentz, W.K.; Hoffman, P.C. Dairy heifer manure management, dietary phosphorus and soil test P effects on runoff phosphorus. J. Environ. Qual. 2012, 41, 1600–1611. [Google Scholar] [CrossRef] [Green Version]
  10. Jokela, W.E.; Sherman, J.; Cavadini, J. Nutrient runoff losses from liquid dairy manure applied with low-disturbance methods. J. Environ. Qual. 2016, 45, 1672–1679. [Google Scholar] [CrossRef] [PubMed]
  11. Kovar, J.L.; Moorman, T.B.; Singer, J.W.; Cambardella, C.A.; Tomer, M.D. Swine manure injection with low-disturbance applicator and cover crops reduce phosphorus losses. J. Environ. Qual. 2011, 40, 329–336. [Google Scholar] [CrossRef] [PubMed]
  12. Omonode, R.A.; Vyn, T.J. Tillage and nitrogen source impacts on relationships between nitrous oxide emission and nitrogen recovery efficiency in corn. J. Environ. Qual. 2019, 48, 421–429. [Google Scholar] [CrossRef] [PubMed] [Green Version]
  13. Ball, B.C.; Scott, A.; Parker, J.P. Field N2O, CO2, and CH4 fluxes in relation to tillage, compaction and soil quality in Scotland. Soil Till. Res. 1999, 53, 29–39. [Google Scholar] [CrossRef]
  14. Gagnon, B.; Ziadi, N.; Rochette, P.; Chantigny, M.H.; Angers, D.A. Fertilizer source influenced nitrous oxide emissions from a clay soil under corn. Soil Sci. Soc. Am. J. 2011, 75, 595–604. [Google Scholar] [CrossRef]
  15. Kool, D.M.; Dolfing, J.; Wrage, N.; Van Groenigen, J.W. Nitrifier denitrification as a distinct and significant source of nitrous oxide from soil. Soil Biol. Biochem. 2011, 43, 174–178. [Google Scholar] [CrossRef]
  16. Thangarajan, R.; Bolan, N.S.; Tian, G.; Naidu, R.; Kunhikrishnan, A. Role of organic amendment application on greenhouse gas emission. Sci. Tot. Environ. 2013, 465, 72–96. [Google Scholar] [CrossRef] [PubMed]
  17. Lognoul, M.; Theodorakopoulos, N.; Hiel, M.-P.; Regaert, D.; Broux, F.; Heinesch, B.; Bodson, B.; Vandenbol, M.; Aubinet, M. Impact of tillage on greenhouse gas emissions by an agricultural crop and dynamics of N2O fluxes: Insights from automated closed chamber measurements. Soil Till. Res. 2017, 167, 80–89. [Google Scholar] [CrossRef]
  18. Good, L.W.; Carvin, R.; Lamba, J.; Fitzpatrick, F.A. Seasonal variation in sediment and phosphorus yields in four Wisconsin agricultural watersheds. J. Environ. Qual. 2018, 48, 950–958. [Google Scholar] [CrossRef] [PubMed]
  19. Griffith, K.E.; Young, E.O.; Klaiber, L.B.; Kramer, S.R. Winter rye cover crop impacts on runoff water quality in a northern New York (USA) tile-drained maize agroecosystem. Water Air Soil Pollut. 2020, 231, 84. [Google Scholar] [CrossRef]
  20. Liu, J.; Baulch, H.M.; Macrae, M.L.; Wilson, H.F.; Elliot, J.A.; Bergström, L.; Glenn, A.J.; Vadas, P.A. Agricultural water quality in cold climates: Processes, drivers, management options, and research needs. J. Environ. Qual. 2019, 48, 792–802. [Google Scholar] [CrossRef] [PubMed] [Green Version]
  21. Alonso-Ayuso, M.; Gabriel, J.L.; Quemada, M. The kill date as amanagement tool for cover cropping success. PLoS ONE 2014, 9, e109587. [Google Scholar] [CrossRef] [PubMed]
  22. Thapa, R.; Mirsky, S.B.; Tully, K.L. Cover crops reduce nitrate leaching in agroecosystems: A global meta-analysis. J. Environ. Qual. 2018, 47, 1400–1411. [Google Scholar] [CrossRef] [PubMed]
  23. Mitchell, D.C.; Castellano, M.J.; Sawyer, J.E.; Pantoja, J.L. Cover crop effects on nitrous oxide emissions: Role of mineralizable carbon. Soil Sci. Soc. Am. J. 2013, 77, 1765–1773. [Google Scholar] [CrossRef] [Green Version]
  24. Peterson, S.O.; Mutegi, J.K.; Hansen, E.M.; Munkholm, L.J. Tillage effects on N2O emissions as influenced by a winter cover crop. Soil Biol. Biochem. 2011, 43, 1509–1517. [Google Scholar] [CrossRef]
  25. Mirsky, S.B.; Curran, W.S.; Mortensen, D.A.; Ryan, M.R.; Shumway, D. Timing of cover-crop management effects on weed suppression in no-till planted soybean using a roller-crimper. Weed Sci. 2011, 59, 380–389. [Google Scholar] [CrossRef]
  26. Reed, H.K.; Karsten, H.D.; Curran, W.S.; Tooker, J.F.; Duiker, S.W. Planting green effects on corn and soybean production. Agron. J. 2019, 111, 2314–2325. [Google Scholar] [CrossRef] [Green Version]
  27. Dobbie, K.E.; Smith, K.A. Nitrous oxide emission factors for agricultural soils Great Britain: The impact of soil water-filled pore space and other controlling variables. Glob. Chang. Biol. 2003, 9, 204e218. [Google Scholar]
  28. Linn, D.M.; Doran, J.W. Aerobic and anaerobic microbial populations in no-till and plowed soils. Soil Sci. Soc. Am. J. 1984, 48, 794–799. [Google Scholar] [CrossRef] [Green Version]
  29. Otte, B.; Mirsky, S.B.; Schomberg, H.; Davis, B.; Tully, K. Effect of cover crop termination timing on pools and fluxes of inorganic nitrogen in no-till corn. Agron. J. 2019, 111, 2832–2842. [Google Scholar] [CrossRef]
  30. Raimbault, B.A.; Vyn, T.J.; Tollenaar, M. Corn response to rye cover crop, tillage methods, and planter options. Agron. J. 1991, 83, 287–290. [Google Scholar] [CrossRef]
  31. Ewing, R.P.; Wagger, M.G.; Denton, H.P. Tillage and cover crop management effects on soil water and corn yield. Soil Sci. Soc. Am. J. 1991, 55, 1081–1085. [Google Scholar] [CrossRef]
  32. Duiker, S.W.; Curran, W.S. Rye cover crop mananagement for corn production in the northern Mid-Atlantic region. Agron. J. 2005, 97, 1413–1418. [Google Scholar] [CrossRef]
  33. Sherman, J.F.; Young, E.O.; Cavadini, J. Tillage and liquid dairy manure effects on overland flow nitrogen and phosphorus loss potential in an upper Midwest corn silage-winter triticale cropping system. Agronomy 2021, 11, 1775. [Google Scholar] [CrossRef]
  34. Peters, J. Wisconsin Procedures for Soil Testing, Plant Analysis and Feed and Forage Analysis. 2013. Available online: https://uwlab.soils.wisc.edu/lab-procedures// (accessed on 11 November 2019).
  35. Parkin, T.B.; Venterea, R.T. Chamber-based trace gas flux measurements. In Sampling Protocols; Follett, R.F., Ed.; USDA-ARS: Beltsville, MD, USA, 2010. Available online: www.ars.usda.gov/research/GRACEnet (accessed on 7 March 2018).
  36. Venterea, R.T. Simplified Method for Quantifying Theoretical Underestimation of Chamber-Based Trace Gas Fluxes. J. Environ. Qual. 2010, 39, 126–135. [Google Scholar] [CrossRef] [PubMed] [Green Version]
  37. Egan, L. Determination of Ammonia by Flow Injection Analysis (High Throughput) (Salicylate Method/DCIC) (Multi Matrix Method); QuikChem Method 90-107-06-3-A; Lachat Instruments: Loveland, CO, USA, 2011. [Google Scholar]
  38. Harbridge, J. Determination of Nitrate in 2M KCl Soil Extracts by Flow Injection Analysis; Quikchem Method 12-107-04-1-J; Lachat Instruments: Loveland, CO, USA, 2007. [Google Scholar]
  39. Schulte, E.E.; Hopkins, B.G. Estimation of soil organic matter by weight 3. Organic matter (LOI) loss-on-ignition. In Soil Organic Matter: Analysis and Interpretation; Magdoff, F.R., Tabatabai, M.A., Hanlon, E.A., Jr., Eds.; Soil Science Society of America: Madison, WI, USA, 1996; pp. 21–31. [Google Scholar]
  40. Laboski, C.A.M.; Peters, J.B. Nutrient Application Guidelines for Field, Vegetable, and Fruit Crops in Wisconsin; University of Wisconsin–Extension, Ed.; Cooperative Extension: Madison, WI, USA, 2012. [Google Scholar]
  41. Cambardella, C.A.; Elliot, E.T. Carbon and nitrogen distribution in aggregates from cutivated and native grassland soils. Soil Sci. Soc. Am. J. 1993, 57, 1071–1076. [Google Scholar] [CrossRef] [Green Version]
  42. Booth, D.T.; Cox, S.E.; Berryman, R.D. Point sampling digital imagery with SamplePoint. Environ. Monit. Assess. 2006, 123, 97–108. [Google Scholar] [CrossRef] [PubMed]
  43. SAS Institute Inc. SAS 9.4 Guide to Software Updates; SAS Institute Inc.: Cary, NC, USA, 2013. [Google Scholar]
  44. Blackmer, A.M.; Pottker, D.; Cerrato, M.E.; Webb, J. Correlations between soil nitrate concentrations in late spring and corn yields in Iowa. J. Prod. Agric. 1989, 2, 103–109. [Google Scholar] [CrossRef]
  45. Fox, R.H.; Roth, G.W.; Iversen, K.V.; Piekielek, W.P. Soil and tissue nitrate tests compared for predicting soil nitrogen availability to corn. Agron. J. 1989, 81, 971–974. [Google Scholar] [CrossRef]
  46. Halvorson, A.D.; Wienhold, B.J.; Black, A.L. Tillage, nitrogen, and cropping system effects on soil carbon sequestration. Soil Sci. Soc. Am. J. 2002, 66, 906–912. [Google Scholar] [CrossRef]
  47. Velthof, G.L.; Kuikman, P.J.; Oenema, O. Nitrous oxide emission from animal manures applied to soil under controlled conditions. Biol. Fertil. Soils. 2003, 37, 221–230. [Google Scholar] [CrossRef]
  48. Abdalla, M.; Osborne, B.; Lanigan, G.; Forristal, D.; Williams, M.; Smith, P.; Jones, M.B. Conservation tillage systems: A review of its consequences for greenhouse gas emissions. Soil Use Manag. 2013, 29, 199–209. [Google Scholar] [CrossRef]
  49. Meisinger, J.J.; Jokela, W.E. Ammonia volatilization from dairy and poultry manure. In Managing Nutrients and Pathogens from Animal Agriculture (NRAES-130); Natural Resource, Agriculture, & Engineering Service: Ithaca, NY, USA, 2000. [Google Scholar]
  50. Sommer, S.G.; Genermont, S.; Cellier, P.; Hutchings, N.J.; Olesen, J.E.; Morvan, T. Process controlling ammonia emission from livestock slurry in the field. Eur. J. Agron. 2003, 19, 465–486. [Google Scholar] [CrossRef]
  51. Powell, J.M.; Jokela, W.E.; Misselbrook, T.H. Dairy slurry application method impacts ammonia emission and nitrate leaching in no-till corn silage. J. Environ. Qual. 2011, 40, 383–392. [Google Scholar] [CrossRef]
  52. Sherman, J.F.; Young, E.O.; Jokela, W.E.; Cavadini, J. Impacts of low-disturbance dairy manure incorporation on ammonia and greenhouse gas fluxes in a corn silage-winter rye cover crop system. J. Environ. Qual. 2021, 50, 836–846. [Google Scholar] [CrossRef]
  53. Pfluke, P.D.; Jokela, W.E.; Bosworth, S.C. Ammonia volatilization from surface-banded and broadcast application of liquid dairy manure on grass forage. J. Environ. Qual. 2011, 40, 374–382. [Google Scholar] [CrossRef] [PubMed] [Green Version]
  54. Svensson, L. A New Dynamic Chamber Technique for Measuring Ammonia Emissions from Land-Spread Manure and Fertilizers. Acta Agric. Scand. Sect. B-Soil Plant Sci. 1994, 44, 35–46. [Google Scholar] [CrossRef]
  55. Webb, J.; Pain, B.F.; Bittman, S.; Morgan, J. The impacts of manure application methods on emissions of ammonia, nitrous oxide and on crop response—A review. Agric. Ecosyst. Environ. 2010, 137, 39–46. [Google Scholar] [CrossRef]
  56. van Kessel, C.; Venterea, R.T.; Six, J.; Adviento-Borbe, M.A.; Linquist, B.; van Groenigen, K.J. Climate, duration, and N placement determine N2O emissions in reduced tillage systems: A meta-analysis. Glob. Change Biol. 2013, 19, 33–44. [Google Scholar] [CrossRef] [PubMed]
  57. Mkhabela, M.S.; Madani, A.; Gordon, R.; Burton, D.; Cudmore, D.; Elmi, A.; Hart, W. Gaseous and leaching nitrogen losses from no-tillage and conventional tillage systems following surface application of cattle manure. Soil Till. Res. 2008, 98, 187–199. [Google Scholar] [CrossRef]
  58. Dalal, R.C.; Gibson, I.; Allen, D.E.; Menzies, N.W. Green waste compost reduces nitrous oxide emissions from feedlot manure applied to soil. Agric. Ecosyst. Environ. 2010, 136, 273–281. [Google Scholar] [CrossRef]
  59. Flessa, H.; Beese, F. Laboratory estimates of trace gas emissions following surface application and injection of cattle slurry. J. Environ. Qual. 2000, 29, 262–268. [Google Scholar] [CrossRef]
  60. Perala, P.; Kapuinen, P.; Esala, M.; Tyynela, S.; Regina, K. Influence of slurry and mineral fertiliser application techniques on N2O and CH4 fluxes from a barley field in southern Finland. Agric. Ecosyst. Environ. 2006, 117, 71–78. [Google Scholar] [CrossRef]
  61. Ullah, S.; Moore, T.R. Biogeochemical controls on methane, nitrous oxide, and carbon dioxide fluxes from deciduous forest soils in eastern Canada. J. Geophys. Res. 2011, 116, 1–15. [Google Scholar] [CrossRef] [Green Version]
  62. Halvorson, A.D.; Del Grosso, S.J.; Stewart, C.E. Manure and inorganic nitrogen affect trace gas emissions under semi-arid irrigated corn. J. Environ. Qual. 2016, 45, 906–914. [Google Scholar] [CrossRef] [PubMed]
  63. Drury, C.F.; Reynolds, W.D.; Tan, C.S.; Welacky, T.W.; Calder, W.; McLaughlin, N.B. Emissions of nitrous oxide and carbon dioxide: Influence of tillage type and nitrogen placement depth. Soil Sci. Soc. Am. J. 2006, 70, 570–581. [Google Scholar] [CrossRef]
  64. Hao, X. Nitrous oxide and carbon dioxide emissions during the nongrowing season from manured soils under rainfed and irrigated conditions. Geomicrobiol. J. 2015, 32, 648–654. [Google Scholar] [CrossRef]
  65. Reicosky, D.C.; Archer, D.W. Moldboard plow tillage depth and short-term carbon dioxide release. Soil Till. Res. 2007, 94, 109–121. [Google Scholar] [CrossRef]
  66. Kainiemi, V.; Arvidsson, J.; Kätterer, T. Effects of autumn tillage and residue management on soil respiration in a long-term field experiment in Sweden. J. Plant Nutr. Soil Sci. 2015, 178, 189–198. [Google Scholar] [CrossRef]
  67. IPCC. 2019 Refinement to the 2006 IPCC Guidelines for National Greenhouse Gas Inventories; Calvo Buendia, E., Tanabe, K., Kranjc, A., Baasansuren, J., Fukuda, M., Ngarize, S., Osako, A., Pyrozhenko, Y., Shermanau, P., Federici, S., Eds.; IPCC: Geneva, Switzerland, 2019. [Google Scholar]
Figure 1. Seasonal (left panels) and cumulative (right panels) ammonia emissions in 2018 (top) and 2019 (bottom). † treatments with the same letter are not different at p = 0.05.
Agronomy 12 02978 g001
Figure 2. Nitrous oxide fluxes by treatment plotted with precipitation, temperature and average volumetric soil moisture content for the 2018 (a) and 2019 (b) seasons.
Agronomy 12 02978 g002
Figure 3. Soil nitrate (NO3-N, top) and ammonium (NH4-N, bottom) nitrogen concentrations in control and treatment plots (0–10 cm depth) from April 2018 to October 2019.
Agronomy 12 02978 g003
Figure 4. Methane (CH4-C) fluxes by treatment for 2018 (top) and 2019 (bottom).
Agronomy 12 02978 g004
Figure 5. Carbon dioxide (CO2-C) fluxes by treatment for 2018 (top) and 2019 (bottom).
Agronomy 12 02978 g005
Table 1. Select soil nutrient properties from May 2018 and October 2019.
DepthTreatmentOM PKNC
(cm) (%)(mg kg−1)(mg kg−1)(g kg−1)(g kg−1)
May 2018
0–5Control4.7930.32182.4124.4
Broadcast4.8831.02202.4025.8
Vertical Till4.7831.82232.4625.3
Chisel Plow4.9330.02122.3124.5
CV9.413.98.16.86.5
p-valueNS NSNSNSNS
5–10Control3.6918.01081.8518.8
Broadcast3.7218.81211.9019.1
Vertical Till3.6818.81171.8518.6
Chisel Plow3.6618.81191.8018.0
CV9.19.416.57.67.2
p-valueNSNSNSNSNS
10–20Control3.1414.543.31.5114.6
Broadcast2.9615.050.31.4914.2
Vertical Till3.0314.348.01.4814.4
Chisel Plow3.1314.351.81.4014.2
CV10.47.116.58.87.9
p-valueNSNSNSNSNS
20–30Control2.4613.033.30.969.25
Broadcast2.1711.534.30.767.95
Vertical Till2.0010.533.50.707.16
Chisel Plow1.8610.034.30.485.88
CV25.220.49.048.439.0
p-valueNSNSNSNSNS
October 2019
0–5Control4.07 a §25.8 c165 b2.44 a23.8 b
Broadcast4.31 a36.8 b232 a2.60 a25.2 a
Vertical Till4.12 a40.6 a237 a2.45 a24.1 b
Chisel Plow3.40 b28.8 c176 b2.03 b19.8 c
CV11.322.618.111.811.7
p-value0.0010.00020.00030.002<0.0001
5–10Control3.3715.0 b78.1 b2.0218.90
Broadcast3.4718.3 a124 a2.0519.60
Vertical Till3.3718.6 a115 a1.9518.30
Chisel Plow3.1319.6 a109 a1.8217.30
CV9.015.120.29.29.5
p-valueNS0.050.009NSNS
10–20Control2.69 b12.038.91.5614.6
Broadcast2.86 a13.249.71.5614.5
Vertical Till2.76 ab13.750.71.3112.4
Chisel Plow2.50 c12.448.41.2112.2
CV9.411.020.620.417.8
p-value0.003NSNSNSNS
20–30Control1.89 a10.536.40.80 a8.00 a
Broadcast2.13 a12.234.81.00 a9.65 a
Vertical Till1.81 a10.638.41.03 a9.61 a
Chisel Plow1.20 b8.7439.80.34 b4.14 b
CV34.221.412.666.452.3
p-value0.01NSNS0.030.02
OM = soil organic matter; P = Bray-1 extractable phosphorus; K = Bray-1 extractable potassium N = total soil nitrogen; C = total soil carbon; NS = not soil significant; § treatments with the same letter are not different at p = 0.05.
Publisher’s Note: MDPI stays neutral with regard to jurisdictional claims in published maps and institutional affiliations.

