Article

Identification, Interaction, Expression, and Function of QTLs on Leaf Numbers with Single-Segment Substitution Lines in Rice

1
Guangdong Key Laboratory of Plant Molecular Breeding, South China Agricultural University, Guangzhou 510642, China
2
Kunpeng Institute of Modern Agriculture at Foshan, Foshan 528200, China
*
Author to whom correspondence should be addressed.
These authors contributed equally to this work.
Agronomy 2022, 12(12), 2968; https://doi.org/10.3390/agronomy12122968
Submission received: 22 October 2022 / Revised: 21 November 2022 / Accepted: 22 November 2022 / Published: 25 November 2022
(This article belongs to the Special Issue Genetics Research and Molecular Breeding of Crops)

Abstract

:
Rice leaf is a solar panel of photosynthesis and determines the light energy utilization and yield of plants. Leaf numbers appear as S-type or parabola-type growth curves throughout their development. However, the ways in which the genes regulate the process of leaf numbers still remain poorly understood. This paper first identified five QTLs associated with leaf numbers using single-segment substitution lines (SSSLs). Then, the epistatic effects between double QTLs were estimated via the decomposition of the QTL polymerization effects. Additionally, further the expression patterns and functions for these five QTLs and their epistasis were revealed by the methodologies of conditional QTL mapping and functional QTL mapping, respectively. The five SSSLs were detected as having significant additive and/or dominant effects at one or more stages, all of which increased the leaf numbers, except for the negative additive effect of the first SSSL. Seven pairs of QTLs interacted each other via three or four epistatic components, with the opposite effects in the case of single genes, i.e., most epistatic effects were negative. The five QTLs expressed their effects mainly in three stages, namely within 14 days, from 28 days to 42 days, and from 49 days to 63 days after transplantation. Positive effects and negative interactions of the QTLs were observed in the early and the late stages, but opposite interactions were observed in the middle stage. Mainly, three functional parameters, including the inflexion point, the peak value, and the degradation rate, were regulated via the QTL effects and their opposite interactions. This paper uncovered the genetic rule of five QTLs on the leaf numbers, including the interaction, expression, and function features. The information will be helpful to understand the genetic mechanism for developmental traits.

1. Introduction

A mature rice leaf is strap-like and is usually divided into three distinct regions along the proximal–distal axis, namely the leaf blade (lamina), the leaf sheath, and the blade–sheath boundary region [1]. A leaf functions as a solar panel, where photosynthesis converts carbon dioxide and water into carbohydrates and oxygen [2,3]. The leaf shape and leaf numbers directly determine the plant architecture, including the leaf spatial distribution and leaf area index, and ultimately affect the light energy utilization and yield per unit area of the plants [4,5,6,7]. Therefore, a deeper understanding of leaf development contributes to improvements in the crop production.
At the cellular or tissue level, rice leaf ontogeny, the developmental process of the main stem leaves from initiation to maturation, was described in detail [1]. A staging system was proposed for the adult leaves, in which the whole developmental process was divided into seven stages, from P0 to P6, each including landmark events [1,8]. In view of an individual or a group, the development of leaves also represents a dynamic process from less to more and then reduction. Each stem node, in turn, grows the first and then the second leaves, and so on, until the last sword leaf is grown. After the rice irrigation stage, the leaves on the lower part of the plant successively degenerate and die. The leaf number varies, following the curve of the “S” type or “parabola” type in the developmental process.
The differentiation and formation of rice leaves are regulated by a complex genetic network [9]. Many genes have been identified as being responsible for rice leaf development. For instance, the LIGULELESS1 gene is important for the differentiation of the organs in the blade–sheath boundary region [10]. The KNOTTED1 gene is responsible for the maintenance of the shoot apical meristems [11]. Six gene clusters and forty-nine genes were identified in specific stages, which were expressed in different parts of various leaves, respectively [8]. Although many genes that are related the development of rice leaves were identified at the cellular level, few of the genes that regulate the changes in rice leaf numbers from initiation to maturation have been reported.
Recently, we reported on the dynamics of the developmental traits, tiller number, and plant height of rice at the individual level based on the materials of single-segment substitution lines (SSSLs) and the methodologies of conditional and functional QTL mapping [12,13,14,15,16]. SSSLs are ideal materials for QTL mapping, especially QTL identification and epistatic analysis [17]. Conditional QTL mapping is an effective approach to revealing the temporal expression of QTLs, thus acquiring QTL net effects at a certain stage of development [13,18,19,20]. Meanwhile, functional QTL mapping can detect the QTLs that regulate the growth curves of developmental traits [21,22,23,24,25]. Based on these materials and methods, five SSSLs were identified, carrying QTLs on both the tiller number and plant height in rice. These QTLs interacted with each other to affect the target traits expressed in specific time periods and regulated the process of trait development [14,15,16]. In this paper, the leaf number of the rice was selected as the target trait, which was measured and recorded in nine stages. The QTLs were detected first, and then the QTL epistasis, expression, and function were analyzed. Our aims were to reveal the gene interaction mechanisms, elucidate the gene expression profiles, and characterize the gene functions behind the process of the development of the leaf number in rice.

2. Materials and Methods

2.1. Materials and Mapping of the Population

Huajingxian 74 (HJX74) and its five single-segment substitution lines (SSSLs) were applied in this trial (Table 1). These experimental materials were described in our previous studies [14,15,16].
HJX74 is an elite indica variety with many excellent properties, which was cultured in our laboratory in South China [17]. The SSSL possessed only a single substituted segment from a donor with the HJX74 genetic background, which was distributed in the related molecular marker regions on the corresponding chromosomes of given lengths (Figure 1). With the markers, the foreground selections of the donors and the background selections of HJX74 were performed in order to ensure that the single fragment was unique.
Double-segment substitution lines (DSSLs) were polymerized based on the F2 populations derived from the crossing combinations of the two SSSLs. Then, a half-diallel mating scheme was developed using HJX74 and its SSSLs and DSSLs as the crossing parents to generate the mapping population. A total of 39 genotypic materials, including HJX74, 5 SSSLs, 7 DSSLs, and 26 crossing combinations, were included in the mapping population. Some crossing combinations were lacking, since the seeds of F1 were scarce.

2.2. Field Experiments and Measurement of the Leaf Numbers

The field trial was carried out at the teaching and experimental station of South China Agricultural University in Guangzhou, China (23°79’N, 113°159’E), in the early season (from March to July) of 2018. The experimental design and management were the same as those applied in the previous studies [14,15,16]. A completely randomized block design with three replications was adopted. The germinated seeds were sown in a seedling bed, and then the seedlings were transplanted to a rice field 20 days later, with one plant per hill at a density of 16.7 cm × 16.7 cm. Each plot consisted of four rows with ten plants per row. Local standard practices were used for the management of the trial. The leaf numbers per hill on the 10 central plants were counted in each plot from seven days after transplantation onwards, and data were continuously recorded at intervals of every 7 days for nine weeks (denoted by t 1 to t 9 ). The average leaf numbers in each plot during the nine stages were used as input data for the subsequent analysis.

2.3. QTL Analysis

The QTL identifications were executed by testing the significance of the differences between the SSSLs and HJX74 in terms of the leaf numbers. A QTL was identified if the estimation of the additive effect (a) or dominant effect (d) ( S i H J X 74 ) was significant. The QTL epistatic effect (e) was calculated using the formula ( D i j + H J X 74 S i S j ) , where S , D , and HJX74 indicated the phenotypic means of single- and dual-segment substitution materials and HJX74, respectively, and i , j represented two homozygotes or heterozygotes of the SSSLs.
The QTL expressions were analyzed by the method of conditional QTL mapping. The conditional variable y t | t 1 was first estimated by y t | t 1 = y t b t / t 1 ( y t 1 y ¯ t 1 ) , where y t 1 , y ¯ t 1 and y t ,   y t were the phenotypic values and the means at times t − 1 and t, respectively, and b t / t 1 was the regression coefficient for the phenotypic values at time t versus those at time t − 1. Conditional QTLs were then obtained based on the conditional variable, which represented the net effects of the QTLs in the stage from t − 1 to t.
The QTL functions were determined by the method of functional QTL mapping. Four functional parameters in the Wang–Lan–Ding model, the K (the upper limit), t 0 (the inflexion point), r , and c (the growth rate and the degradation rate) [26], were first estimated by the DUD (do not use derivatives) method using the SAS software v9.13. Then, QTL mapping was carried out based on the estimations of these functional parameters.
The statistical analysis and estimation of QTL effects were carried out using the aov() and lm() functions in the R language “The R Project for Statistical Computing. https://cran.r-project.org/src/base/R-4/ (accessed on 3 October 2022)”.
The study was in compliance with the relevant institutional, national, and international guidelines and legislation.

3. Results and Analysis

3.1. Phenotypic Variation in the Leaf Number

The developmental curves for the 39 genotypes in the nine stages indicated the dynamic variations in the leaf numbers (Figure 2). The numbers of leaves increased slowly in the initial growth stage and then grew increasingly faster, and then they slowly reached the maximum value. After this, the leaf numbers started to decline. The growth in the leaf numbers during the investigating stages approximately followed the logistic growth curve. The analysis of variance indicated that the genetic variances were significantly larger than the error variances, implying the existence of gene effects.

3.2. QTL Identification of the Leaf Numbers

We compared the numbers of leaves between each SSSL and HJX74 in order to identify the QTLs. The tests based on the least significant difference (LSD) method found that all five SSSLs harbored QTLs of the leaf numbers (Table 2). One QTL was identified when an SSSL was tested with a significant additive effect (a) and/or dominant effect (d) in any stage. All the SSSLs were identified as having a QTL on the leaf numbers due to their significant additive and/or dominant effects that appeared in at least one stage. Some QTLs, such as the QTLs on S1, S2, and S3 (denoted as QTL1, QTL2, and QTL3, respectively, hereinafter), carried both a and d simultaneously, implying that they had effects on the leaf numbers in both the homozygous and the heterozygous states. The other QTLs, QTL4 and QTL5, only had d, indicating effects in the heterozygous state alone. Except for QTL1, appearing with negative effects in the middle to late stages, all the QTLs increased the leaf numbers in multiple stages. The fact that these QTLs could be detected repeatedly guaranteed their truth. All the QTLs remained consistent in terms of their effect direction in various stages. Here, d was always larger than a, indicating that these QTLs may be more effective in the process of heterosis. Additionally, these results also indicated that more QTLs could be detected through the combination of the homozygous and the heterozygous materials and multi-period testing.

3.3. QTL Epistatic Interactions and Their Effects on the Leaf Numbers

In a polygenic system, epistatic interactions between genes are inescapable. According to the additive–dominance–epistasis model, the epistatic effect e i j between the double loci i and j can be estimated by e i j = y i j μ a i a j , where y   a n d   μ are genotypic values of the polymeric material and HJX74, respectively, and a is the additive or dominant effect. Four epistatic components were estimated according to the genotypic configurations of the QTLs (Table 3), where aa, ad, da, and dd represented four epistatic components, the additive–additive, additive–dominant, dominant–additive, and dominant–dominant epistases, respectively. All the combinations of the SSSLs investigated were detected as having significant interaction effects, further verifying the prevalence of epistasis. The epistatic component a 1 d 3 (denoted as a d of S 1 / S 3 hereinafter) was detected only in the stage t9, and its reliability was subjected to further verification. The other epistatic components were significant in at least at two stages, indicating the validity of these interactions. The epistatic effects were mostly negative, which played a part in reducing the leaf numbers. Several positive epistases appeared, mainly in the stage t5, resulting in the increase in the leaf numbers. Our previous studies confirmed that positive (negative) QTL effects always result in negative (positive) epistatic effects [14,15,16]. The conclusion was further verified by the results of this paper. Most epistatic effects remained consistent in terms of their directions across various components and across different developmental stages, with some exceptions. Four epistatic components, a1d2, a1d4, d1a5, and d2d3, appeared to show opposite effect directions between the early stages and the middle to late stages.

3.4. QTL Expressions on Leaf Numbers

To explore the QTL expression during a certain period, we first estimated the conditional effects, and then the conditional QTL effects were calculated based on the conditional effects (Table 4). A conditional QTL effect reflects the net effect of the QTLs expressed in a certain period. The QTLs expressed their additive and/or dominant effects in certain periods, for the temporal expressions of the genes providing further proof. In the case of QTL1, QTL4, and QTL5, they expressed their additive effects only in one of periods. Meanwhile, the effects of the other QTLs were significant in the case of at least two time intervals, implying that these QTLs had multiple expressions. Multiple expressions often produced different direction effects. Most QTLs generated increasing effects on the leaf numbers from the stages of t0 to t2, decreasing effects from t2 to t8, and enhancing effects again from t8 to t9. In three time intervals, namely from t0 to t2, from t4 to t6, and from t7 to t9, the QTL expressions were seemingly more active. It must be said that QTLs may be expressed in any one period simply due to the effects being too small to be detected or being masked by excessively large experimental errors.
Similarly, conditional epistatic effects were also estimated for seven QTL pairs (Table 5), which represented net interactions expressed in certain periods. The QTL interaction effects exhibited different dynamics compared with the single-QTL effects. We did not detect the expression periods of all the aa components. Three components, a1d3, d1a3, and a1d4, were expressed only in one of the stages, while the others could be detected in multiple periods. In opposition to the expression of a single QTL, the interactions between double QTLs mostly appeared to show the negative effects from the stages of t0 to t2, positive effects from t2 to t8, and negative effects again from t8 to t9. The epistatic expressions also occurred mainly in the three periods from t0 to t2, from t4 to t6, and from t7 to t9, which was consistent with the expression stages of the single QTL. Some epistatic components had significant accumulated effects in certain stages, but their expression periods could not be detected due to the insignificant dispersed expression observed previously. Conversely, some epistatic components had significant net effects in certain stages but had no significant accumulated effects due to the reverse expressions observed previously. Many epistatic expressions were too weak to be detected, while some large expressions became invisible because of the large experimental errors.

3.5. QTL Functions on Leaf Numbers

To understand the functions of these QTLs, we examined their effects on the four functional parameters, namely the optimum time ( t 0 ) , the growth rate ( r ) , the maximum value ( K ) , and the degradation rate ( c ) (Table 6). These parameters regulate the growth curves of the leaf numbers. All of the five QTLs related to one or more of the four functional parameters. QTL1, QTL2, and QTL4 negatively regulated t0, shortening the time of the inflexion point on a curve. QTL1, QTL3, and QTL5 influenced K, enabling the potential for change in the leaf numbers. Meanwhile, QTL1, QTL2, QTL3, and QTL5 positively controlled c, accelerating the degradation rate of the leaf numbers. The parameter r was found to be unaffected by these QTLs. Additionally, QTL pleiotropies were also detected. For instance, QTL1 simultaneously affected three parameters, t 0 , K , and c .
The question of whether the epistatic interactions of these QTLs affected these functional parameters was also analyzed (Table 7). Seven pairs of S i / S j had one or more epistatic components significantly affecting at least two functional parameters. The parameters t0 and c were positively and negatively regulated by the epistatic interactions of seven and six pairs of QTLs, delaying the time of the inflexion point and reducing the degradation rate on a curve, respectively. a1a5 accelerated the growth in the leaf numbers, while the QTL interactions of S1/S4 and S2/S5 increased and decreased the potential of the leaf numbers, respectively.

4. Discussion

4.1. Dynamic Expression of the QTL on the Leaf Number

The formation of the leaf shape in rice is dynamic from the initial formation of the leaf primordium to the maturation of the complete leaf [1]. The dynamic process is regulated by a complex genetic network of multiple genes [9]. Research has indicated that genes work in particular temporal and spatial conditions [8]. The gene transcriptomes change dramatically throughout the processes of leaf blade and sheath differentiation, and multiple genes exhibit a localized expression in the tissues characteristic of rice leaves [8]. The rice leaf numbers of a plant or a group also undergo the processes of enhancement and decline. From transplantation to the heading stage, the numbers of leaves continues to increase to the maximum, and then gradually decrease. This dynamic change in the leaf numbers must be regulated by genes. Many studies have indicated that the development of the rice tiller number and plant height is regulated by many genes, which have typical spatiotemporal expression characteristics [14,15,16]. However, the genetic mechanism of the development of the rice leaf numbers are known little. In this paper, we investigated the leaf numbers in nine developmental stages from transplantation to filling. The change in the leaf numbers was detected across all stages and basically followed the growth curve of the “S” type (Figure 2). Five SSSLs were identified with QTLs related to the dynamics of the leaf numbers, which were detected as being significant in multiple stages (Table 2). These QTLs regulated the leaf numbers mainly via positive additive or/and dominant effects and negative epistatic effects (Table 2 and Table 3). Next, we measured the expression stages of these QTLs. The temporal expressions of the QTLs and their interactions were ascertained, since they exhibited significant net effects in specific stages (Table 4 and Table 5). Some common features, such as multiple expressions and reverse expressions, were detected during the whole developmental period (Table 4 and Table 5). In the end, we explored the effects of the five QTLs on the growth curve of the leaf numbers, and we found that they changed the developmental trajectory of the leaf numbers via the regulation of three functional parameters (Table 6). Seven pairs of QTLs also influenced the developmental process through epistatic interactions (Table 7). This paper provides abundant information about QTL dynamics and their effects on leaf numbers, including the interactions, expressions, and functions of the five QTLs.

4.2. Advantages of SSSLs for QTL Analysis

Beginning in 1998, a library of SSSLs was constructed in our laboratory based on the receptor parent of Huajingxian 74 (HJX74), an elite indica variety developed in our laboratory, and the donor parents of eight species of rice of the AA genome, including more than forty varieties [17]. We crossed the receptor with one of the donors first and then continuously backcrossed the receptor with the offspring. A total of 574 polymorphic markers that were distributed uniformly on the whole genome were utilized to detect segments from the donors or the receptor for the individual in the generations after four instances of backcrossing. When a segment was detected as being from a donor, the individual was then purified by self-crossing. Finally, an SSSL carrying a single segment from the donor in the genetic background of the receptor HJX74 was obtained [27,28]. To date, a total number of 2360 SSSLs have been developed, in which the accumulated length and the average length of the substitution segments reach 44,000 cM and 19 cM, respectively [17]. Compared with the receptor parent, an SSSL has the same genetic background, except for its exogenous segment. Thus, a QTL analysis based on SSSLs can minimize the interference of the background genetic effects, providing a more reliable QTL detection and estimation of the QTL effects. SSSLs are considered to be the ideal materials for QTL analysis. On the one hand, SSSLs can sensitively detect QTLs. Since each of the SSSLs contains only one substituted segment from a donor in the receptor genetic background, all the genetic variation between one of the SSSLs and the receptor can be associated with the substituted segment [17,27]. On the other hand, SSSLs can effectively estimate the epistatic effects. By dividing the pyramiding effect, the epistatic effect was estimated as the difference from the additive effect of multiple QTL effects [14,15,16]. In this paper, we successfully applied five SSSLs to detect the effects of five QTLs on the leaf numbers (Table 2) and to estimate the epistatic effects on seven pairs of QTLs (Table 3). Again, this paper fully indicates the advantages of SSSLs for QTL analysis.

4.3. The Approaches to the Dynamic Analysis of QTLs

To explore the dynamics of QTLs, several common approaches have been adopted to analyze the developmental traits thus far [20]. QTL mapping, based on the phenotypes of the traits in the final growth stage, cannot provide the dynamic changes in QTLs [18,29]. The comparison of the results of QTL mapping in regard to the phenotypic values or the increments measured at sequential time points can be used to infer the dynamics of the QTLs but cannot provide the net effects of the QTL expressions [19,30]. Conditional QTL mapping, based on the estimations of conditional phenotypes, can effectively measure the net expressions of the QTLs from time ( t 1 ) to time ( t ) [13,20,31,32,33,34]. Additionally, functional QTL mapping, based on the estimations of functional parameters fitted to the growth function, can detect the QTLs that regulate the shape and trajectory of trait changes owing to the incorporation of biological principles [21,22,23,24,25]. In this paper, five SSSLs carrying QTLs on the leaf numbers in rice were detected (Table 2). By the method of conditional QTL analysis, we measured the net expressions of the five QTLs and the epistatic interactions between the QTLs, revealing their expression stages and expression magnitudes. The results indicated that the five QTLs and their interactions were expressed mainly in three stages, namely within 14 days, from 28 days to 42 days, and from 49 days to 63 days after transplantation. The QTLs were mainly positive in both the first and the third expression phases and negative in the second expression phase, as mentioned above (Table 4). The epistatic expressions among the QTLs also mainly occurred also in the three periods, with mainly negative, positive, and negative effects, respectively (Table 5). This paper reconfirms the temporal expression of QTLs. Subsequently, we fitted the growth curve of the leaf number using the Wang–Lan–Ding function, in which four parameters regulate the trajectory of the growth [12,15,16,26]. For instance, the diminishing of t 0 and the increasing of r and K , would bring the inflection point forward, accelerate the growth, and increase the potential, respectively, as shown in Figure 3. By the method of functional QTL mapping, we found that three QTLs regulated t 0 and K , respectively, and four QTLs were related to c (Table 6). There were seven, one, two, and six pairs of QTLs that regulated t 0 , r , k , and c , respectively, via different epistatic components (Table 7). Through the methods of both conditional and functional QTL mapping, the dynamics of the five QTLs on leaf number were effectively interpreted.

4.4. Impact of Epistasis on the Leaf Number

Epistasis is an important genetic component of complex quantitative traits [35,36,37]. Using SSSLs and their pyramiding lines, we can effectively estimate various epistatic components of some traits, such as the panicle number, tiller number, heading date, plant height, and yield components, according to the additive–dominant–epistatic model [14,15,16,38,39,40,41,42,43]. In this paper, we first detected five SSSLs that carried QTLs on the leaf number (Table 2), and then four components of epistases were estimated via the analysis of the pyramiding effects derived from two SSSLs (Table 3). Our results indicated that all seven pairs of the QTLs interacted each other to influence the leaf numbers, further confirming the prevalence of QTL epistasis. Epistasis may serve as homeostasis, which is always accompanied by the inverse effects together with QTLs themselves [36,37]. Our previous studies also confirmed that negative (positive) epistasis is mainly derived from interactions between positive (negative) QTLs [14,15,16]. In this paper, most pf the QTLs were detected as being positive additive and/or dominant (Table 2); thus, the estimations of the epistatic components were mainly negative (Table 3). Positive epistasis occurred, since negative QTLs appeared only after the stage of t 5 (Table 2 and Table 3). We understood that the property of epistasis was stipulated by the calculated formula and homeostatic mechanism [16], which was further confirmed by the results described in this paper. Epistasis increases the difficulty of character improvement. A gene can be used in polymeric breeding only if it has epistasis in the same direction as the gene effect [43].

Author Contributions

All authors contributed to the study conception and design. S.B. wrote the original draft. P.Z. and G.L. revised and edited the manuscript. L.H. and J.T. were the principal investigators of the leaf number experiments, and L.C. and Z.L. participated in the investigations. H.Z. and L.M. executed the project administration, and S.W. was the supervisor of our research team and provided financial support. All authors have read and agreed to the published version of the manuscript.

Funding

This research was supported by the Key Projects of Basic Research and Applied Basic Research of Guangdong Province, China (2019B030302006), the National Key Research and Development Program of China (2021YFF1000404), and the Research and Development Program in the Key Areas of Guangdong Province, China (2022B0202060002).

Institutional Review Board Statement

Not applicable.

Informed Consent Statement

Not applicable.

Data Availability Statement

The study did not report any data.

Acknowledgments

We appreciate the support of Haiming Xu at Zhejing University in the estimations of the functional parameters.

Conflicts of Interest

The authors declare no conflict of interest.

References

  1. Itoh, J.; Nonomura, K.; Ikeda, K.; Yamaki, S.; Inukai, Y.; Yamagishi, H.; Kitano, H.; Nagato, Y. Rice plant development: From zygote to spikelet. Plant Cell Physiol. 2005, 46, 23–47. [Google Scholar]
  2. Du, F.; Guan, C.; Jiao, Y. Molecular mechanisms of leaf morphogenesis. Mol. Plant 2018, 11, 1117–1134. [Google Scholar] [CrossRef] [PubMed] [Green Version]
  3. Uzair, M.; Long, H.; Zafar, S.; Suyash, B.; Chun, Y.; Li, L.; Fang, J.; Zhao, J.; Peng, L.; Yuan, S.; et al. Narrow Leaf21, encoding ribosomal protein RPS3A, controls leaf development in rice. Plant Physiol. 2021, 186, 497–518. [Google Scholar] [CrossRef] [PubMed]
  4. Khush, G.S. Green revolution: The way forward. Nat. Rev. Genet. 2001, 2, 815–822. [Google Scholar] [CrossRef] [PubMed]
  5. Peng, S.B.; Khush, G.S.; Virk, P.D.; Tang, Q.Y.; Zou, Y.B. Progress in ideotype breeding to increase rice yield potential. Field Crop. Res. 2008, 108, 32–38. [Google Scholar] [CrossRef]
  6. Fei, C.; Xu, Q.; Xu, Z.J.; Chen, W.F. The effect of rice breeding process on improvement of yield and quality in China. Rice Sci. 2020, 27, 363–367. [Google Scholar]
  7. Wang, J.J.; Xu, J.; Qian, Q.; Zhang, G.H. Development of rice leaves: How histiocytic cells modulate leaf polarity establishment. Rice Sci. 2020, 27, 468–479. [Google Scholar]
  8. Mayi, M.; Takanori, Y.; Yutaka, S.; Jun-Ichi, I. Genome-wide analysis of spatiotemporal expression patterns during rice leaf development. BMC Genom. 2021, 22, 169. [Google Scholar]
  9. Nikolov, L.A.; Runions, A.; Gupta, M.D.; Tsiantis, M. Leaf development and evolution. Curr. Top. Dev. Biol. 2019, 131, 109–139. [Google Scholar]
  10. Lee, J.; Park, J.J.; Kim, S.L.; Yim, J.; An, G. Mutations in the rice liguleless gene result in a complete loss of the auricle, ligule, and laminar joint. Plant Mol. Biol. 2007, 65, 487–499. [Google Scholar] [CrossRef]
  11. Jackson, D. Double labeling of KNOTTED1 mRNA and protein reveals multiple potential sites of protein trafficking in the shoot apex. Plant Physiol. 2002, 129, 1423–1429. [Google Scholar] [CrossRef] [Green Version]
  12. Liu, G.F.; Li, M.; Wen, J.; Du, Y.; Zhang, Y.M. Functional mapping of quantitative trait loci associated with rice tillering. Mol. Genet. Genom. 2010, 284, 263–271. [Google Scholar] [CrossRef]
  13. Liu, G.F.; Zhu, H.T.; Liu, S.W.; Zeng, R.Z.; Zhang, Z.M.; Li, W.T.; Ding, X.H.; Zhao, F.M.; Zhang, G.Q. Unconditional and conditional QTL mapping for the developmental behavior of tiller number in rice (Oryza sativa L.). Genetica 2010, 138, 885–893. [Google Scholar] [CrossRef]
  14. Zhou, H.; Yang, W.; Ma, S.; Luan, X.; Zhu, H.; Wang, A.; Huang, C.; Rong, B.; Dong, S.; Meng, L.; et al. Unconditional and conditional analysis of epistasis between tillering QTLs based on single segment substitution lines in rice. Sci. Rep. 2020, 10, 5912. [Google Scholar] [CrossRef]
  15. Luan, X.; Xiong, L.; Xu, H.; Zhu, H.; Bu, S.; Meng, L.; Liu, G.; Wang, S. Functional mapping of tillering QTLs using the Wang–Lan–Ding model and a SSSL population. Mol. Genet. Genom. 2021, 296, 1279–1286. [Google Scholar] [CrossRef]
  16. Fu, Y.; Zhao, H.; Huang, J.; Zhu, H.; Luan, X.; Bu, S.; Liu, Z.; Wang, X.; Peng, Z.; Meng, L.; et al. Dynamic analysis of QTLs on plant height with single segment substitution lines in rice. Sci. Rep. 2022, 12, 5465. [Google Scholar] [CrossRef]
  17. Zhang, G.Q. The platform of breeding by design based on the SSSL library in rice. Hereditas 2019, 41, 754–760. (In Chinese) [Google Scholar]
  18. Zhu, J. Analysis of conditional genetic effects and variance components in developmental genetics. Genetics 1995, 141, 1633–1639. [Google Scholar] [CrossRef]
  19. Zhu, J. Mixed model approaches of mapping genes for complex quantitative traits. J. Zhejiang Univ. 1999, 33, 327–335. [Google Scholar]
  20. Xu, H.M.; Zhu, J. Statistical approaches in QTL mapping and molecular breeding for complex traits. Chin. Sci. Bull. 2012, 57, 2637–2644. [Google Scholar]
  21. Ma, C.X.; Casella, G.; Wu, R.L. Functional mapping of quantitative trait loci underlying the character process: A theoretical framework. Genetics 2002, 161, 1751–1762. [Google Scholar] [CrossRef] [PubMed]
  22. Wu, R.L.; Ma, C.X.; Lin, M.; Wang, Z.H.; Casella, G. Functional mapping of quantitative trait loci underlying growth trajectories using a transform-both-sides logistic model. Biometrics 2004, 60, 729–738. [Google Scholar] [CrossRef] [PubMed]
  23. Wu, R.L.; Lin, M. Opinion-functional mapping-how to map and study the genetic architecture of dynamic complex traits. Nat. Rev. Genet. 2006, 7, 229–237. [Google Scholar] [CrossRef]
  24. Cui, Y.H.; Zhu, J.; Wu, R.L. Functional mapping for genetic control of programmed cell death. Physiol. Genom. 2006, 25, 458–469. [Google Scholar] [CrossRef] [PubMed] [Green Version]
  25. Cui, Y.H.; Li, S.Y.; Li, G.X. Functional mapping imprinted quantitative trait loci underlying developmental characteristics. Theor. Biol. Med. Model. 2008, 5, 1–15. [Google Scholar] [CrossRef] [PubMed] [Green Version]
  26. Wang, R.S.; Lan, Z.X.; Ding, Y.X. Studies on mathematical models of the relationship between insect development and temperature. Acta Ecol. Sin. 1982, 2, 47–57. [Google Scholar]
  27. Zhang, G.Q.; Zeng, R.Z.; Zhang, Z.M.; Ding, X.H.; Li, W.T.; Liu, G.M.; He, F.H.; Tulukdar, A.; Huang, C.E.; Xi, Z.Y.; et al. The construction of a library of single segment substitution lines in rice (Oryza sativa L.). Rice Genet. Newsl. 2004, 21, 85–87. [Google Scholar]
  28. Xi, Z.Y.; He, F.H.; Zeng, R.Z.; Zhang, Z.M.; Ding, X.H.; Li, W.T.; Zhang, G.Q. Development of a wide population of chromosome single segment substitution lines in the genetic background of an elite cultivar of rice (Oryza sativa L.). Genome 2009, 49, 476–484. [Google Scholar] [CrossRef]
  29. Atchley, W.R.; Zhu, J. Developmental quantitative genetics, conditional epigenetic variability and growth in mice. Genetics 1997, 147, 765–776. [Google Scholar] [CrossRef]
  30. Wu, W.R.; Li, W.M.; Tang, D.Z.; Lu, H.R.; Worland, A.J. Time-related mapping of quantitative trait loci underlying tiller number in rice. Genetics 1999, 151, 297–303. [Google Scholar] [CrossRef]
  31. Yan, J.; Zhu, J.; He, C.X.; Benmoussa, M.; Wu, P. Molecular dissection of developmental behavior of plant height in rice (Oryza sativa L.). Genetics 1998, 150, 1257–1265. [Google Scholar] [CrossRef]
  32. Cao, G.; Zhu, J.; He, C.; Gao, Y.; Yan, J.; Wu, P. Impact of epistasis and QTL×environment interaction on the developmental behavior of plant height in rice (Oryza sativa L.). Theor. Appl. Genet. 2001, 103, 153–160. [Google Scholar] [CrossRef]
  33. Yang, G.; Xing, Y.; Li, S.; Ding, J.; Yue, B.; Deng, K.; Li, Y.; Zhu, Y. Molecular dissection of developmental behavior of tiller number and plant height and their relationship in rice (Oryza sativa L.). Hereditas 2006, 143, 236–245. [Google Scholar] [CrossRef]
  34. Jiang, H.; Jiang, L.; Guo, L.; Gao, Z.; Zeng, D.; Zhu, L.; Liang, G.; Qian, Q. Conditional and unconditional mapping of quantitative trait loci underlying plant height and tiller number in rice (Oryza sativa L.) grown at two nitrogen levels. Prog. Nat. Sci.-Mater. 2008, 18, 1539–1547. [Google Scholar] [CrossRef]
  35. Örjan, C.; Chris, S.H. Epistasis: Too often neglected in complex trait studies? Nat. Rev. Genet. 2004, 5, 618–625. [Google Scholar]
  36. Mackay, T.F.C.; Stone, E.A.; Ayroles, J.F. The genetics of quantitative traits: Challenges and prospects. Nat. Rev. Genet. 2009, 10, 565–577. [Google Scholar] [CrossRef]
  37. Mackay, T.F.C. Epistasis and quantitative traits: Using model organisms to study gene-gene interactions. Nat. Rev. Genet. 2014, 15, 22–33. [Google Scholar] [CrossRef] [Green Version]
  38. Eshed, Y.; Zamir, D. An introgression line population of Lycopersicon pennellii in the cultivated tomato enables the identification and fine mapping of yield-associated QTL. Genetics 1995, 141, 1147–1162. [Google Scholar] [CrossRef]
  39. Eshed, Y.; Zamir, D. Less-than-additive epistatic interactions of quantitative trait loci in tomato. Genetics 1996, 143, 1807–1817. [Google Scholar] [CrossRef]
  40. Lin, H.X.; Yamamoto, T.; Sasaki, T.; Yano, M. Characterization and detection of epistatic interactions of 3 QTLs, Hd1, Hd2, and Hd3, controlling heading date in rice using nearly isogenic lines. Theor. Appl. Genet. 2000, 101, 1021–1028. [Google Scholar] [CrossRef]
  41. Zhu, H.T.; Li, Y.; Liang, J.Y.; Luan, X.; Xu, P.; Wang, S.K.; Zhang, G.Q.; Liu, G.F. Analysis of QTLs on heading date based on single segment substitution lines in rice (Oryza Sativa L.). Sci. Rep. 2018, 8, 13232. [Google Scholar] [CrossRef] [PubMed]
  42. Wang, X.L.; Jin, L.; Zhu, H.T.; Wang, S.K.; Zhang, G.Q.; Liu, G.F. QTL epistatic analysis for yield components with single-segment substitution lines in rice. Plant Breed. 2018, 137, 346–354. [Google Scholar] [CrossRef]
  43. Yang, Z.F.; Jin, L.; Zhu, H.T.; Wang, S.K.; Zhang, G.Q.; Liu, G.F. Analysis of epistasis among QTLs on heading date based on single segment substitution lines in rice. Sci. Rep. 2018, 8, 3059. [Google Scholar] [CrossRef] [PubMed]
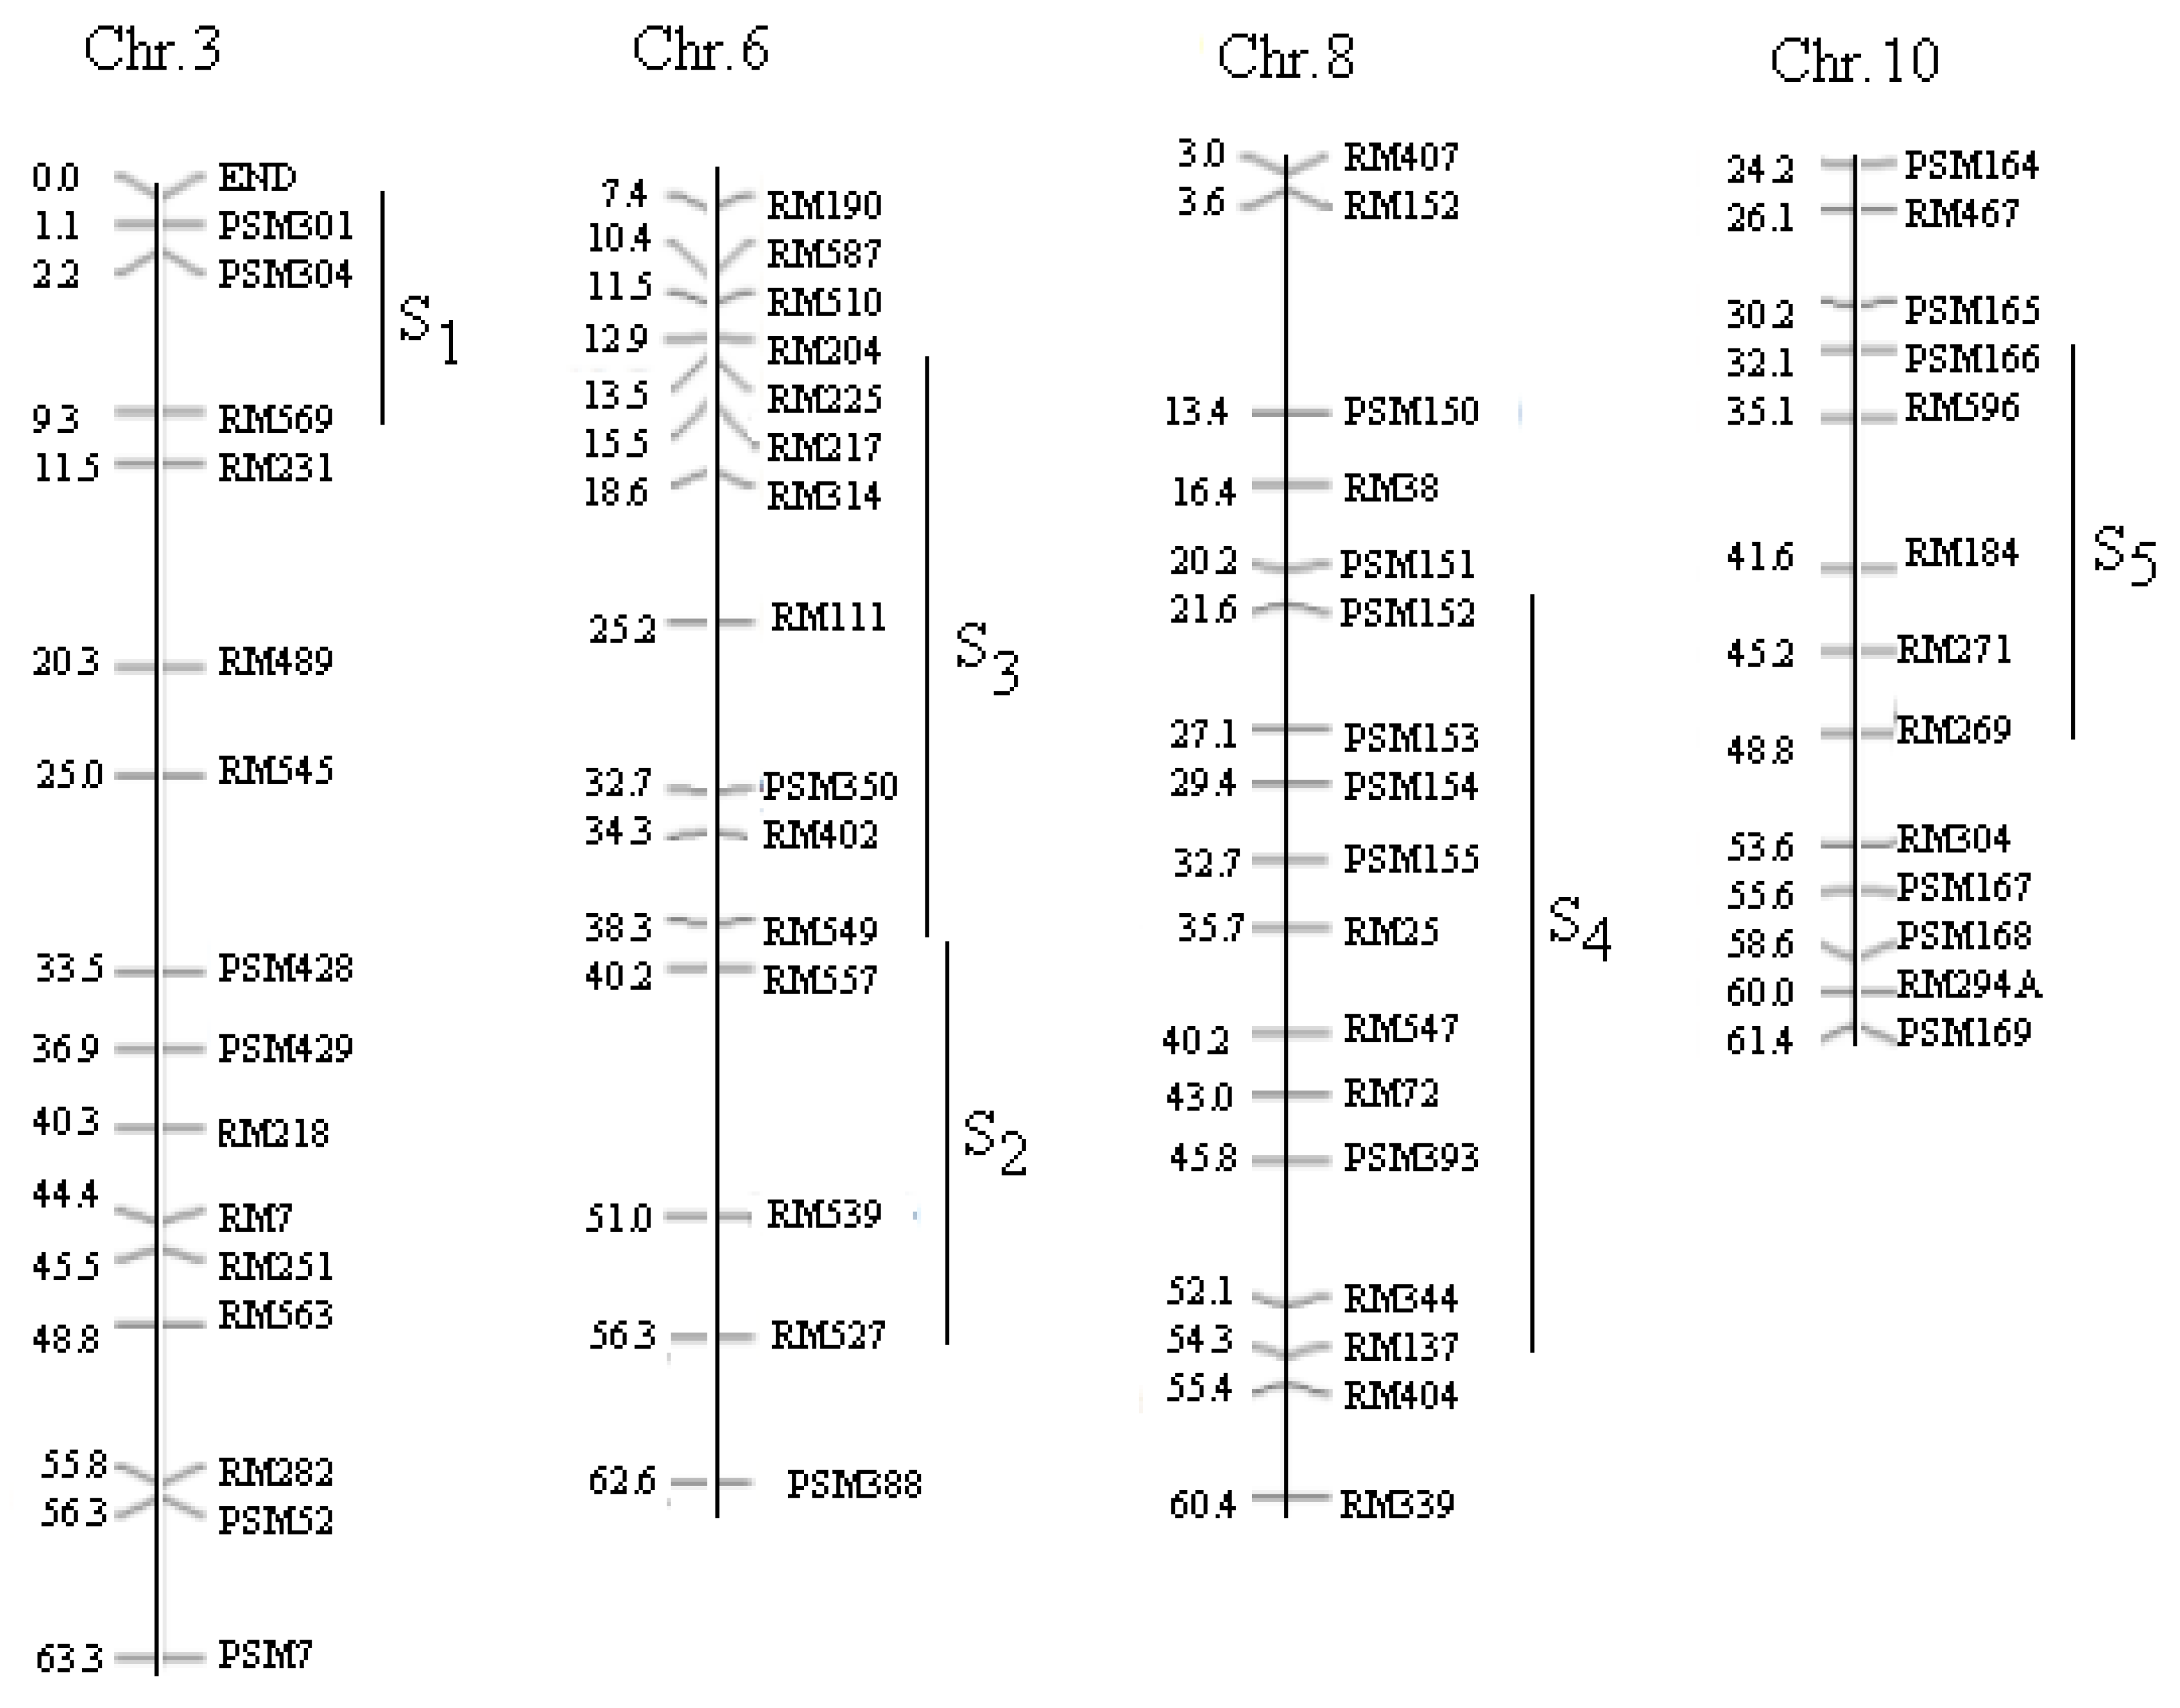
Figure 1. The approximate lengths and locations of the substitution segments on the chromosomes. Chr. is an abbreviation of chromosome, followed by the chromosomal number. Genetic distance (cM) and marker codes are listed on the left and right of Chr., respectively. The vertical lines on the right of Chr. represent substitution segments with serial numbers S i , which represent the ith SSSL.
Agronomy 12 02968 g001
Figure 2. Development of dynamic variations in the leaf numbers for 39 genotypes. t i indicates the ith stage of the measurement.
Agronomy 12 02968 g002
Figure 3. Sketch map of the parameters related to the change in the growth curve. (AC) show the inflection point moving forward, acceleration of the growth, and increase in the potential, respectively. The arrows between two lines indicated the moving direction of the curves. The solid and dotted lines represented the original and new curves, respectively.
Agronomy 12 02968 g003
Table 1. Single-segment substitution lines (SSSLs) and their basic information. SSSL is an abbreviation of single-segment substitution line. Si represents the code of the ith SSSL. Chr is an abbreviation of chromosome.
SSSLCodeChrMarker on Substituted SegmentDonor Parent
W23-03-08-09-27-82S13End--PSM301-PSM304--RM569Lemont
W08-18-09-09-06-02S26RM549-RM136-RM527IR64
W04-47-68-05-04-04-02-02S36RM510--RM204--RM50--RM549BG367
W06-26-35-01-05-02S48PSM152--PSM154-RM72--RM404Katy
W11-17-03-07-05-08S510PSM166--RM596-RM271--RM269Basmati 370
Table 2. Additive (a) and dominant (d) effects of SSSLs on the leaf numbers in various developmental stages. SSSL is an abbreviation of single-segment substitution line. S i represents the ith SSSL. t i indicates the ith stage of the measurement. “–” indicates descending leaf numbers due to alleles from the donors. * and ** show significance at the levels of the 0.05 and 0.01 probabilities, respectively.
SSSLEffectt1t2t3t4t5t6t7t8t9
S1a −7.8 *−11.6 *−14.4 **−16.5 **−13.8 **
d3.0 **4.2 **7.3 **
S2a 3.9 **5.7 **7.2 *
d4.7 **11.0 **14.5 **14.1 **11.3 **
S3a 11.1 *
d 10.6 *15.7 **14.6 **21.6 **
S4d 5.3 **8.2 **7.6 *
S5d3.3 **7.2 **8.5 **10.5 **10.5 **11.6 *9.0 *
Table 3. Epistatic effects of the estimated QTLs on the leaf number in various developmental stages. SSSL is an abbreviation of single-segment substitution line. S i / S j represents the combination of SSSLi and SSSLj. aa, ad, da, and dd represent additive-additive, additive-dominant, dominant-additive, and dominant-dominant epistases, respectively. t i indicates the ith stage of the measurement. “−” indicates descending leaf numbers due to alleles from the donors. * and ** show significance at the levels of the 0.05 and 0.01 probabilities, respectively.
SSSL CombinationEpistatic Componentt1t2t3t4t5t6t7t8t9
S1/S2aa −5.1 *−6.8 *
ad−2.4 *−11.5 **−10.9 ** 19.0 **25.6 **24.4 **
da−3.2 **−5.9 **−12.3 **−12.1 *
dd−7.3 **−13.8 **−21.1 **−16.4 **−11.9 *
S1/S3ad −15.0 *
da−2.4 *−5.2 *−8.0 **
dd−3.6 **−5.6 **−10.5 **−9.9 *−10.8 *−17.9 *−16.5 *−17.7 **−28.2 **
S1/S4ad −4.9 *−4.9 * 13.5 *19.2 **18.5 **
da 18.2 *25.0 **31.6 **22.3 **
dd−4.8 **−10.6 **−18.7 **−20.3 **−14.5 *
S1/S5ad−2.9 *−6.2 **−5.2 * 15.4 *
da−2.8 * −6.5 *
dd−6.1 **−11.4 **−17.0 **−16.3 **−17.5 **−18.4 *
S2/S3aa −4.1 *−5.6 *
ad −15.5 * −15.0 *
da−4.3 **−11.3 **−13.4 **−11.6 **−13.0 *
dd −4.5 * 25.1 **35.1 **32.4 **38.8 **26.6 **
S2/S4aa −4.8 *−7.9 **−11.7 **−14.2 *−14.9 *−13.7 *
ad −10.0 **−14.4 **−15.6 **
da−4.5 **−10.5 **−14.4 **−12.1 **−11.1 *
dd−6.3 **−16.8 **−24.5 **−24.0 **−18.4 **
S2/S5aa −5.6 **−8.8 **−9.6 *−10.9 *
ad−5.3 **−13.7 **−18.2 **−21.8 **−23.1 **−22.9 **−19.3 **
da−5.9 **−13.2 **−17.1 **−16.5 **−16.7 **
dd−9.0 **−19.8 **−25.9**−24.1 **−23.2 **−15.7 *
Table 4. Expression of QTLs according to additive and dominant effects on the leaf numbers in various developmental stages. SSSL is an abbreviation of single-segment substitution line. S i represents the ith SSSL. aa, ad, da, and dd represent additive-additive, additive-dominant, dominant-additive, and dominant-dominant epistases, respectively. t i | t i 1 indicates the stage from i 1 to t . “−” indicates descending leaf numbers due to alleles from the donors. * and ** show significance at the levels of the 0.05 and 0.01 probabilities, respectively.
SSSLEffectt1|t0t2|t1t3|t2t4|t3t5|t4t6|t5t7|t6t8|t7t9|t8
S1a −2.9 *
d3.0 ** −5.6 * −6.4 * 5.5 *
S2a 2.8 * −4.2 *
d4.7 **3.0 * −7.4 **−10.0 **
S3d 4.5 * 6.2 **
S4a 5.5 *
d1.4 *2.9 * −5.2 *−6.5 * −4.8 *4.2 *
S5a 5.4 *
d3.3 ** −8.2 **7.0 **
Table 5. Expression of QTLs according to the epistatic effects on the leaf number in various developmental stages. SSSL is an abbreviation of single-segment substitution line. S i / S j represents the combination of SSSLi and SSSLj. aa, ad, da, and dd represent additive-additive, additive-dominant, dominant-additive, and dominant-dominant epistases, respectively. t i | t i 1 indicates the stage from i 1 to t . “−” indicates descending leaf numbers due to alleles from the donors. * and ** show significance at the levels of the 0.05 and 0.01 probabilities, respectively.
SSSL CombinationEpistatic Componentt1|t0t2|t1t3|t2t4|t3t5|t4t6|t5t7|t6t8|t7t9|t8
S1/S2ad −9.3 **5.4 **8.1 *7.5 *11.4 **
da−3.2 ** 8.2 **
dd−7.3 ** 8.4 **11.0 **7.5 *7.9 *
S1/S3ad −7.5 *
da−2.4 *
dd−3.6 ** −10.4 *
S1/S4ad 8.8 *
da 6.3 * 8.2 *
dd−4.8 ** 9.3 **
S1/S5ad−2.9 ** 4.0 *
da−2.8 ** −6.8 *
dd−6.1 ** 10.0 *7.8 *−10.5 **
S2/S3ad −6.7 * 6.7 *
da−4.3 ** 9.4 *
dd 3.9 * 13.2 **
S2/S4ad −7.1 ** 10.7 **8.9 *
da−4.5 ** 8.4 *
dd−6.3 **−6.0 ** 13.6 **15.3 **
S2/S5ad−5.3 **−4.3 * 6.2 * 10.5 **
da−5.9 ** 10.3 **
dd−9.0 ** 9.1 **11.3 ** 10.1 **
Table 6. QTL effects of the four functional parameters on the leaf numbers. SSSL is an abbreviation of single-segment substitution line. S i represents the homozygote or heterozygote ith SSSL. The additive effect ( a ) or dominant effect ( d ) of the QTLs was estimated by the mean of ( S i H J X 74 ) , where HJX74 is an abbreviation of Huajingxian 74. t 0 ,   r ,   K , and c are the optimum time, the growth rate, the maximum value, and the degradation rate, respectively. “−” indicates descending parameters due to alleles from the donors. * and ** indicate significance at the 5% and 1% levels, respectively.
SSSLEffectt0rKc
S1a −13.2 *0.235 *
d−1.29 ** −15.5 *
S2a−0.57 *
d−1.43 ** 0.397 **
S3a 13.5 *0.209 *
d 22.3 **
S4a
d−1.05 **
S5a 0.227 *
d 12.2 *0.403 **
Table 7. Epistatic effects of the QTLs on the four functional parameters of the leaf numbers. SSSL is an abbreviation of single-segment substitution line. S i represents the homozygote or heterozygote ith SSSL. aa, ad, da, and dd represent the additive-additive, additive-dominance, dominance-additive, and dominance-dominance epistatic components, respectively, which were estimated by the means of ( D i j + H J X 74 S i S j ) (where D i j ,   S i ,   S j indicate the dual segment and its two single-segment materials, respectively, which may be homozygotes or heterozygotes). t 0 ,   r ,   K , and c are the optimum time, the growth rate, the maximum value, and the degradation rate, respectively. The sign “–” indicates descending parameters due to alleles from the donors. * and ** indicate significance at the 5% and 1% levels, respectively.
EpistasisEpistatic Component t 0 r K c
S1/S2ad1.55 ** −0.716 **
da1.54 **
dd2.61 **
S1/S3aa −0.364 *
da0.93 *
S1/S4ad1.08 * 20.3 *
da1.28 ** 42.8 **
dd2.52 **
S1/S5aa 0.394 * −0.365 *
ad −0.373 *
dd1.59 ** −0.299 *
S2/S3da0.92 * −0.476 **
dd1.47 ** −0.415 **
S2/S4ad1.74 **
da1.10 * −0.449 **
dd2.82 **
S2/S5ad1.14 ** −21.1 *−0.467 **
da1.95 ** −0.380 *
dd1.94 ** −23.0 *−0.654 **
Publisher’s Note: MDPI stays neutral with regard to jurisdictional claims in published maps and institutional affiliations.

