Article

Estimation of Actual Evapotranspiration and Crop Coefficient of Transplanted Puddled Rice Using a Modified Non-Weighing Paddy Lysimeter

1
ICAR-Research Complex for Eastern Region, ICAR Parisar, Patna 800014, India
2
Civil, Environmental and Natural Resources Engineering, Lulea University of Technology, 97187 Lulea, Sweden
3
Division of Agricultural Engineering, ICAR-IARI, New Delhi 110012, India
4
CERIS, Instituto Superior Técnico, Universidade de Lisboa, 1049-001 Lisbon, Portugal
5
Civil Engineering Department, University for Business and Technology, 10000 Pristina, Kosovo
*
Author to whom correspondence should be addressed.
Agronomy 2022, 12(11), 2850; https://doi.org/10.3390/agronomy12112850
Submission received: 24 September 2022 / Revised: 22 October 2022 / Accepted: 10 November 2022 / Published: 15 November 2022

Abstract

:
Lysimetric and eddy covariance techniques are commonly used to directly estimate actual crop evapotranspiration ( E T a ). However, these technologies are costly, laborious, and require skills which make in situ ET estimation difficult, particularly in developing countries. With this in mind, an attempt was made to determine E T a and stagewise crop coefficient (Kc) values of transplanted puddled rice using a modified non-weighing paddy lysimeter. The results were compared to indirect methods, viz., FAO Penman–Monteith and pan evaporation. Daily E T a ranged from 1.9 to 8.2 mmday−1, with a mean of 4.02 ± 1.35 mmday−1, and their comparison showed that the FAO Penman–Monteith equation performed well for the coefficient of determination (R2 of 0.63), root mean squared error (RMSE = 0.80), and mean absolute percentage error (MAPE = 13.6 %), and was highly correlated with E T a throughout the crop season. However, the pan evaporation approach was underestimated (R2 of 0.24; RMSE = 0.98; MAPE = 22.13%) due to a consistent pan coefficient value (0.71), vegetation role and measurement errors. In addition, actual Kc values were obtained as 1.13 ± 0.13, 1.27 ± 0.2, 1.23 ± 0.16, and 0.93 ± 0.18 for the initial, crop development, mid-season, and end-season stages, respectively. These estimated crop coefficient values were higher than FAO Kc values. Statistical analysis results revealed that the overall stagewise-derived average Kc values were in line with FAO values, but different from the derived pan Kc values, although found insignificant at a 5% significance level. In addition, water productivity and agro-meteorological indices were derived to evaluate the cultivar performance in this experiment. Therefore, such a methodology may be used in the absence of weighing lysimeter-derived Kc values. The derived regional Kc values can be applied to improve irrigation scheduling under similar agro-climatic conditions.

1. Introduction

Water is one of the most critical natural resources for almost all living organisms existing on the blue planet, and is needed for socio-economic development activities [1,2,3]. Freshwater resources are dynamically fluctuating globally owing to global warming, climate change and unsustainable anthropogenic actions [4]. Freshwater scarcity is a major challenge in today’s world, and it has been projected to worsen by 2050 when the world population may reach between 9.4 and 10.2 billion [1]. Worldwide, agriculture water use currently accounts for 70% of the total water resource availability, and is mostly used for irrigation [5]. India accounts for about 17% of the world’s population and has 4% of the world’s freshwater resources [2]. Water resources in India are highly unevenly distributed at spatial and temporal scales [6]. The dynamic distribution of water resources must be managed efficiently to achieve the sustainable overall development of the nation.
The most important cropping systems followed under rainfed medium land situations are rice–fallow, rice–wheat, rice–winter maize, rice–gram, rice–winter vegetables, etc., with approximately 135% cropping intensity [7]. The rice–wheat cropping system is mainly followed in the Indo-Gangetic plains (IGPs), the heartland of the green revolution which covers about 13.5 million hectares and contributes significantly to India’s food security [7]. In India, approximately 85% of the upland rice (Oryza sativa L.) areas are located in the states of Assam, Bihar, Jharkhand, Odisha, West Bengal, the eastern parts of Madhya Pradesh, and Uttar Pradesh [8]. Furthermore, there has also been a substantial amount of yield variability in these regions, which is threatening IGP agriculture sustainability. Except for Punjab and Haryana states in the Trans-Gangetic plains, middle and lower IGPs such as Bihar, Uttar Pradesh, and West Bengal still have low productivity for rice–wheat cropping patterns [8]. The lack of irrigation facilities, high crop water requirements, the declining water table, high pumping expenses, labor-intensive production, lack of reliable on-farm gadgets, and erratic rainfall all contribute to lower crop productivity in these regions.
Due to current water shortages, particularly in IGPs, water-saving is difficult for rice production. Major crops such as rice require significantly more water than other cereal crops, i.e., 1 kg of rice production needs 3000–5000 L of water [9,10,11]. Similarly, more than 75% of worldwide rice is grown in nurseries before being transplanted into puddled fields [12]. Rice production using the traditional method is seen as resource-intensive regarding water, energy, and money [13]. Various researchers have reported that puddling and conventional rice farming require massive amounts of water (>2000 mm) to harvest a single rice crop [7,9,12,14]. Around 50–80% of the applied water is lost in deep percolation, seepage, and evaporation [15,16,17,18]. Therefore, estimating actual crop evapotranspiration ( E T a ) and developing stagewise crop coefficient (Kc) values for transplanted puddled rice based on local climatic conditions and existing crop management practices would be helpful in the efficient irrigation scheduling, planning, and design of irrigation systems to obtain higher crop water productivity [7,19,20,21]. Among various methods, the FAO Penman–Monteith method was found to have the lowest overestimation error (1%) and is widely known as the best approach for estimating reference evapotranspiration [22,23].
Crop evapotranspiration is highly sensitive to Kc values [20,22,24,25,26]. Stagewise Kc values vary depending on local field management approaches, canopy cover, variety, weather variations, etc. Various studies have been carried out to estimate E T a and derive stagewise Kc values of various crops in different agro-climatic regions worldwide [20,24,26,27,28,29]. Multiple methods, such as lysimetric studies, field water balance, modeling, eddy covariance (EC) techniques, etc., can be used for actual evapotranspiration estimation [30,31,32,33,34,35]. In addition to these techniques, soil water balance based on TDR for barley [17], neutron probes for quinoa [36], gravimetric approaches for amaranth grain [37], EC and remote sensing approaches [38], and EC and modelling approaches (SIMDualKc) in wheat [39] have also been used. However, most research has concentrated on E T a measurements using non-weighing and weighing lysimeters in various crops [19,40,41,42,43]. The lysimeter provides a precise and continuous field measurement of E T a . However, it is expensive, complicated and should only be used by skilled personnel. For various crops, drainage lysimeters (non-weighing) have been used to estimate E T a in dry beans along with a soil water balance based on neutron probes [44], and in green gram along with capacitance probes [45]. Moreover, weighing lysimeters (WL) has been used in spring wheat [46], canola [47], and cowpea [48]. In addition, various researchers have also completed lysimetric studies to estimate the E T a in paddy crop [18,28,29,49] and developed stagewise crop coefficients (Kc) varied from 0.61 to 1.15, 0.97 to 1.44, 1.14 to 1.59, and 0.9 to 1.02 for the initial, crop development, mid-season, and late season stages, respectively, in different agro-climatic zones [16,23,27,28,42,50,51]. However, a few researchers used a locally constructed paddy lysimeter to quantify E T a which is simple in design, inexpensive, and provides satisfactory results [52,53]. Time-averaged crop coefficient values for low land paddy in the Senegal river valley were 1.01, 1.31, and 1.12 during the crop development, mid-season, and late-season stages, respectively, and actual crop evapotranspiration was 841.5 and 855.4 mm in 2014 and 2015, respectively [29]. Doorenbos and Pruitt [54] proposed Kc values for various crops cultivated in diverse agro-climatic regions.
Furthermore, previous studies showed that there is no database of crop coefficients for different crops in diverse agro-climatic regions of the MIGP. Therefore, FAO Kc values are commonly utilized for irrigation scheduling in different crops. FAO-56, on the other hand, is recommended for developing in situ stagewise Kc values for various crops for precise irrigation scheduling at the regional scale [20,30]. Therefore, the present investigation was conducted with two specific objectives, i.e., (1) to estimate E T a and develop stagewise Kc values of transplanted puddled rice using modified non-weighing paddy lysimeter, and (2), to compare E T a and Kc values with indirect methods such as Penman–Monteith and pan evaporation to improve in situ water productivity. In addition, water productivity and agrometeorological indices were also computed for drought-tolerant rice cultivar, viz., Swarn Shreya. The developed knowledge of rice E T a and Kc values may aid in improving water use efficiency in similar agro-climatic regions by reducing the water wastage attributed to deep percolation and runoff produced in the vicinity of over irrigation due to the inadequacy of efficient irrigation scheduling information.

2. Materials and Methods

2.1. Site Description, Climate, and Soil

A field experiment was carried out at the ICAR Research Complex for Eastern Region (ICAR-RCER), Patna, Bihar (25° 35′30″ N, 85° 05′03″ E and 52 m above mean sea level), which is located in the sub-tropical humid climatic region of the Middle Indo-Gangetic Plains (MIGP) (Figure 1). The Indo-Gangetic Plains have been divided into four parts which include Upper Indo-Gangetic Plains (UIGP), Trans-Indo-Gangetic Plains (TIGP), MIGP, and Lower Indo-Gangetic Plains (LIGP), as displayed in Figure 1.
Daily weather data were collected from ICAR-RCER, an agro-meteorological observatory, and their variation throughout the cropping season was depicted in Table 1.
The region receives an annual mean precipitation of about 1213 mm. Soil samples were also collected using a core sampler, and soil physical properties were determined using the standard methods presented in Table 2. Paddy seedlings were transplanted on 26 July and harvested on 25 October 2021. All the recommended fertilizer doses, irrigation, and agronomical practices were followed across the entire field and within lysimeters to ensure uniform growth and check the oasis effect on crop ET.

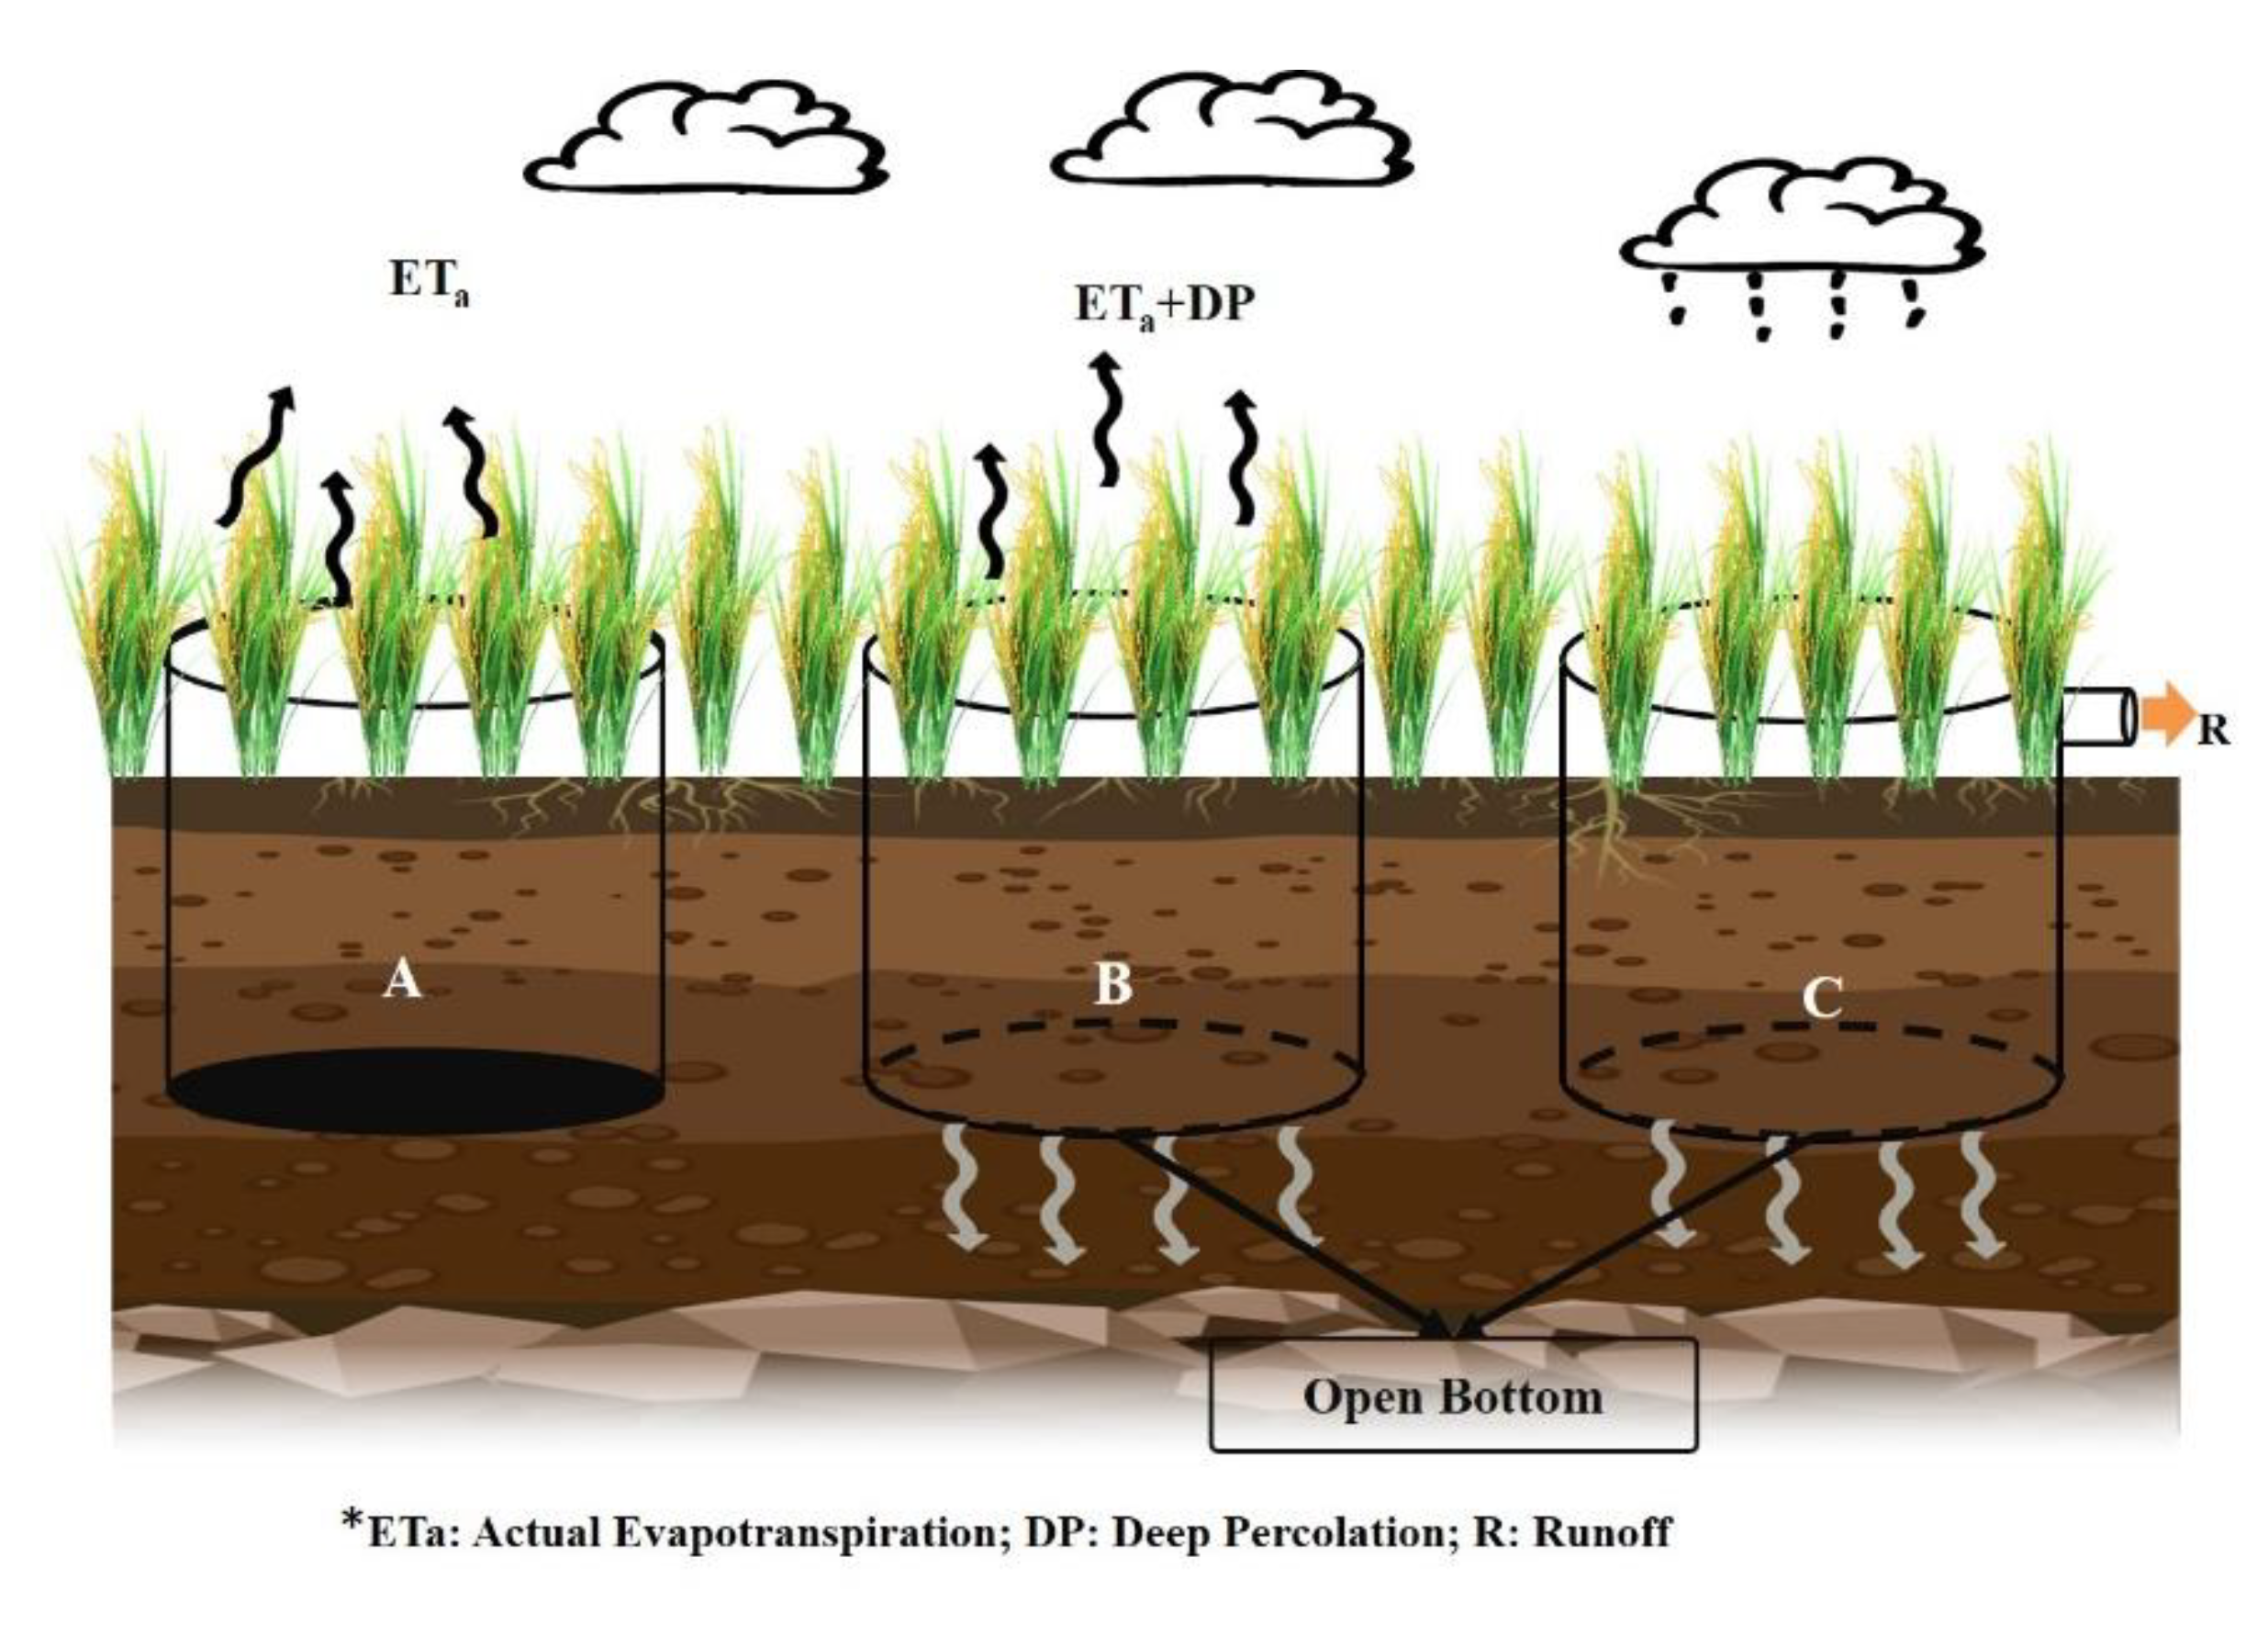
2.2. Estimation of Actual Crop Evapotranspiration Using Paddy Lysimeter

Actual evapotranspiration was determined using a modified paddy non-weighing lysimeter based on the water budget equation expressed in Equation (1).
  Inflow   Outflow = ± Δ Storage
where   I n f l o w = I + P ;     O u t f l o w = E T a + R + D P ;   Δ S t o r a g e = ΔS within the root zone; *I is irrigation; P is rainfall; DP is percolation beyond the root zone; R is runoff; and ΔS is the change in soil moisture storage in the root zone.
Both I and P were directly measured. To measure E T a , a paddy lysimeter with slight modifications (outlet at recommended bund height for this region) was used in which three drums (namely, A, B, and C) with a diameter of 50 cm and height of 128.75 cm were buried in a rice field with roughly a fourth of their height above ground level (Figure 2). Drum A had a closed bottom, while Drum B and C had open bottoms. The outlet pipe was installed at bund height (25 cm) in container C for precise runoff estimation.
In this experiment, the modified paddy lysimeter was a low-cost volumetric-type set of three drums used to measure E T a and soil water balance components. The major modifications include setting the outlet at the recommended bund height (25 cm) of these regions to estimate runoff from the field. Twenty-seven-day-old seedlings of the rice cultivar Swarn Shreya were transplanted using a standard agronomic package of practices inside the drums. The entire area of outside drums was also transplanted with the same rice variety. The water level inside the drums was maintained at the same level as it was in the cropped field. The difference in water level over two successive days in drum A represents actual evapotranspiration. In contrast, percolation loss is defined as the daily difference in water levels between drums A and B. The plots were bunded (25 cm) and there was no overflow from drum C throughout the season, resulting in no runoff from the paddy field.

2.3. Estimation of Reference Evapotranspiration

Reference evapotranspiration (ET0) from 2017 to 2021 was computed using daily weather data collected from a local agro-meteorological observatory using FAO Penman–Monteith and US Class A pan evaporimeter techniques.

2.3.1. FAO Penman–Monteith Equation

Daily observations of air temperature (maximum and minimum), relative humidity, daily solar hours, and wind speed were considered for determining ET0 using FAO’s CROPWAT 8.0 software [20,24]. For estimating reference evapotranspiration (ET0), the Penman–Monteith equation was used as follows:
ET 0 = 0.408 Δ ( R n     G ) + γ 900 T + 273 u 2 ( e s e a ) Δ + γ ( 1 + 0.34 u 2 )
where ET0 = a reference evapotranspiration (mm day–1), u2 = a wind speed at 2 m height (m s–1), Rn = a net radiation at crop surface (MJ m–2 day –1), G = a soil heat flux density (MJ m–2 day –1) Tmean = a mean daily air temperature at 2 m height (°C), γ = a psychrometric constant (kPa °C–1), ∆ = a slope of vapor pressure curve (kPa °C–1), and es − ea = a saturation vapor pressure deficit (kPa).

2.3.2. Pan Evaporation Approach

The pan evaporation method is a physical approach that may be applied worldwide without requiring parameter adjustments. In this method, the Class A evaporation pan from the US Weather Bureau, having a circular cross-section with a diameter of 120.7 cm and a depth of 25 cm, is widely used to monitor daily evaporation losses. The relationship between reference evapotranspiration and pan evaporation is expressed in Equation (3)
ET0 = KP × Epan
where ET0 = a reference evapotranspiration (mm day–1), Kp = a pan coefficient (0.71), and Epan = a daily pan evaporation (mm day−1).

2.4. Estimation of Stagewise Crop Coefficient

The impacts of actual crop evapotranspiration and soil evaporation are integrated into the single crop coefficient approach. In order to estimate stage–Kc, daily reference evapotranspiration was estimated using CROPWAT 8.0 software, and modified paddy lysimeter was used to estimate actual daily evapotranspiration by observing the daily water level change in these three drums. Then, the crop coefficient was determined as the ratio of actual evapotranspiration to reference evapotranspiration, as given by Equation (4)
K c = E T a ET 0
where E T a =   an   actual   crop   evapotranspiration   ( mm 1 ) and ET 0 =   a   reference   crop   evapotranspiration   ( mm 1 ) .
Pan–crop coefficient was estimated by the ratio of actual evapotranspiration to reference evapotranspiration based on the pan evaporation approach.

2.5. Statistical Analysis

Various statistical performance parameters such as mean absolute percentage error (MAPE), root mean square error (RMSE) and coefficient of determination (R2) were calculated for error analysis (Equations (5)–(7)).
MAPE = 1 n i = 1 n | ( O i P i ) / O i |
RMSE = i n ( P i O i ) 2 n
R 2 = 1   i n ( P i     O i ) 2 i n ( P i     O ¯ ) 2
where Pi, Oi and O ¯ are the observed, estimated, and mean estimated values, respectively. Then, the significant test between the measured and estimated Kc values was performed using the non-parametric Mann–Whitney U test. The flowchart of the whole methodology was presented in Figure 3.

2.6. Water Productivity and Agro-Meteorological Indices

In this study, two different approaches were used to estimate water productivity: crop water productivity (CWP) and total water productivity (TWP). Crop water productivity was determined by dividing the marketable grain yield by the water used to meet crop evapotranspiration. Then CWP of the rice cultivar (Swarn Shreya) was estimated by the following equation:
CWP   ( kg   ha 1 mm 1 ) = Grain   Yield   ( kg   ha 1 ) Actual   Crop   Evapotranspiration   ( mm )  
Irrigation water use efficiency (IWUE), or total water productivity(TWP), originated from drought resistance and tolerance ideas [61]. In crop production, IWUEis defined as the crop yield ratio to the water applied in the field [62].
IWUE = Crop   Yield   ( kg   ha 1 ) Water   used   to   produce   yield ( m 3 ha 1 )  
The daily meteorological data were used to calculate agro-meteorological indices, viz., growing degree days (GDD), heliothermal units (HTU), photothermal units (PTU), heat use efficiency (HUE), and heliothermal use efficiency (HTUE) (Equations (10)–(14), respectively). Daily GDD was calculated using a base temperature of 10 °C. The daily mean temperature above the base temperature, expressed in degree days, was added to calculate cumulative growing degree days.
Growing degree days (GDD) is calculated as:
GDD =   T max + T min 2 Tb
where Tmax—daily maximum temperature (°C), Tmin—daily minimum temperature (°C), and Tb—minimum threshold/base temperature (°C).
Heliothermal units (HTU): the product of the growing degree day and the corresponding bright sunshine hours has been termed heliothermal units (HTU).
HTU =   GDD   ×   actual   bright   sunshine   hours   ( n )
Photothermal units (PTU): the product of the growing degree day and the corresponding maximum possible sunshine hours has been termed photothermal units (PTU).
PTU =   GDD   ×   N
N—maximum possible sunshine hours.
Heat use efficiency (HUE): heat use efficiency is also represented by thermal time use efficiency (TTUE), which indicates the amount of dry matter produced per unit of growing degree days or thermal time, expressed in g/m2/° day. This was computed by using the following formula:
HUE = Total   dry   matter   GDD
Heliothermal use efficiency (HTUE): heliothermal use efficiency was calculated by dividing the total dry matter recorded on respective days by the accumulated heliothermal units, and is expressed as kg ha−1 °C Day h.
HTUE was calculated as
HTUE = Total   dry   matter   HTU

3. Results

3.1. Variation in Reference Evapotranspiration, Water Balance Components and Actual Crop Evapotranspiration

Daily mean ET0-PM varied from 1.72 to 5.67 mm day−1 with a mean value of 3.39 (±0.95) mm day−1, while the corresponding daily ET0-Pan ranged between 1.56 and 3.98 mm day−1 with an average value of 3.06 ± 0.52 mm day−1 throughout the crop season. However, stagewise ET0-PM revealed 3.42 ± 0.73 mm day−1, 3.56 ± 0.94 mm day−1, 3.40 ± 1.03 mm day−1, and 2.77 ± 0.55 mm day−1 during the initial, crop development, mid-season and late-season stages, respectively. Daily mean ET0-Pan findings showed their values to be 2.99 ± 0.66 mm day−1, 3.16 ± 0.47 mm day−1, 3.02 ± 0.56 mm day−1, and 2.97 ± 0.29 mm day−1 during the initial, crop development, mid-season and end/late-season stages, respectively. In addition, the daily variations in ET0-PM and ET0-Pan throughout the last five years (2017–2021) of the crop period were shown in Figure 4. The results showed that their values ranged between 2.69 and 4.92 mm day−1, with an average value of 3.59 ± 0.56 mm day−1 for ET0-PM and 2.03 to 3.78 mm day−1 with an average of 2.78 ± 0.33 mm day−1 for ET0-Pan.
The overall relationship between ET0-PM and ET0-Pan presented in Figure 5 showed a poor relationship, with R2 = 0.27 (RMSE:0.28, MAPE:8.34%) in the MIGP region. Throughout the crop period, lower reference evapotranspiration had been reported compared to ET0-PM, suggesting the development of local revised pan coefficient values in these regions.
During the cropping season, E T a using a modified paddy lysimeter varied from 1.9 to 8.2 mm day−1, with a mean value of 4.02 ± 1.35 mm day−1, and reported a total of 369.4 mm, accounting for 49.77% of the total water applied after transplanting. On the other hand, the percolation beyond the crop root zone was 262.48 mm, or around 35.36% of the total water applied, and the rest (14.87%) was stored within the root zone of the crop (Figure 6). A total of 111.09 mm evapotranspiration was estimated during the nursery. In addition to this, the stagewise-measured daily average E T a was 3.86 ± 0.95 mm day−1, 4.51 ± 1.41 mm day−1, 4.05 ± 1.28 mm day−1, and 2.52 ± 0.51 mm day−1 during the initial, crop development, mid-season, and late-season stages, respectively (Table 3).

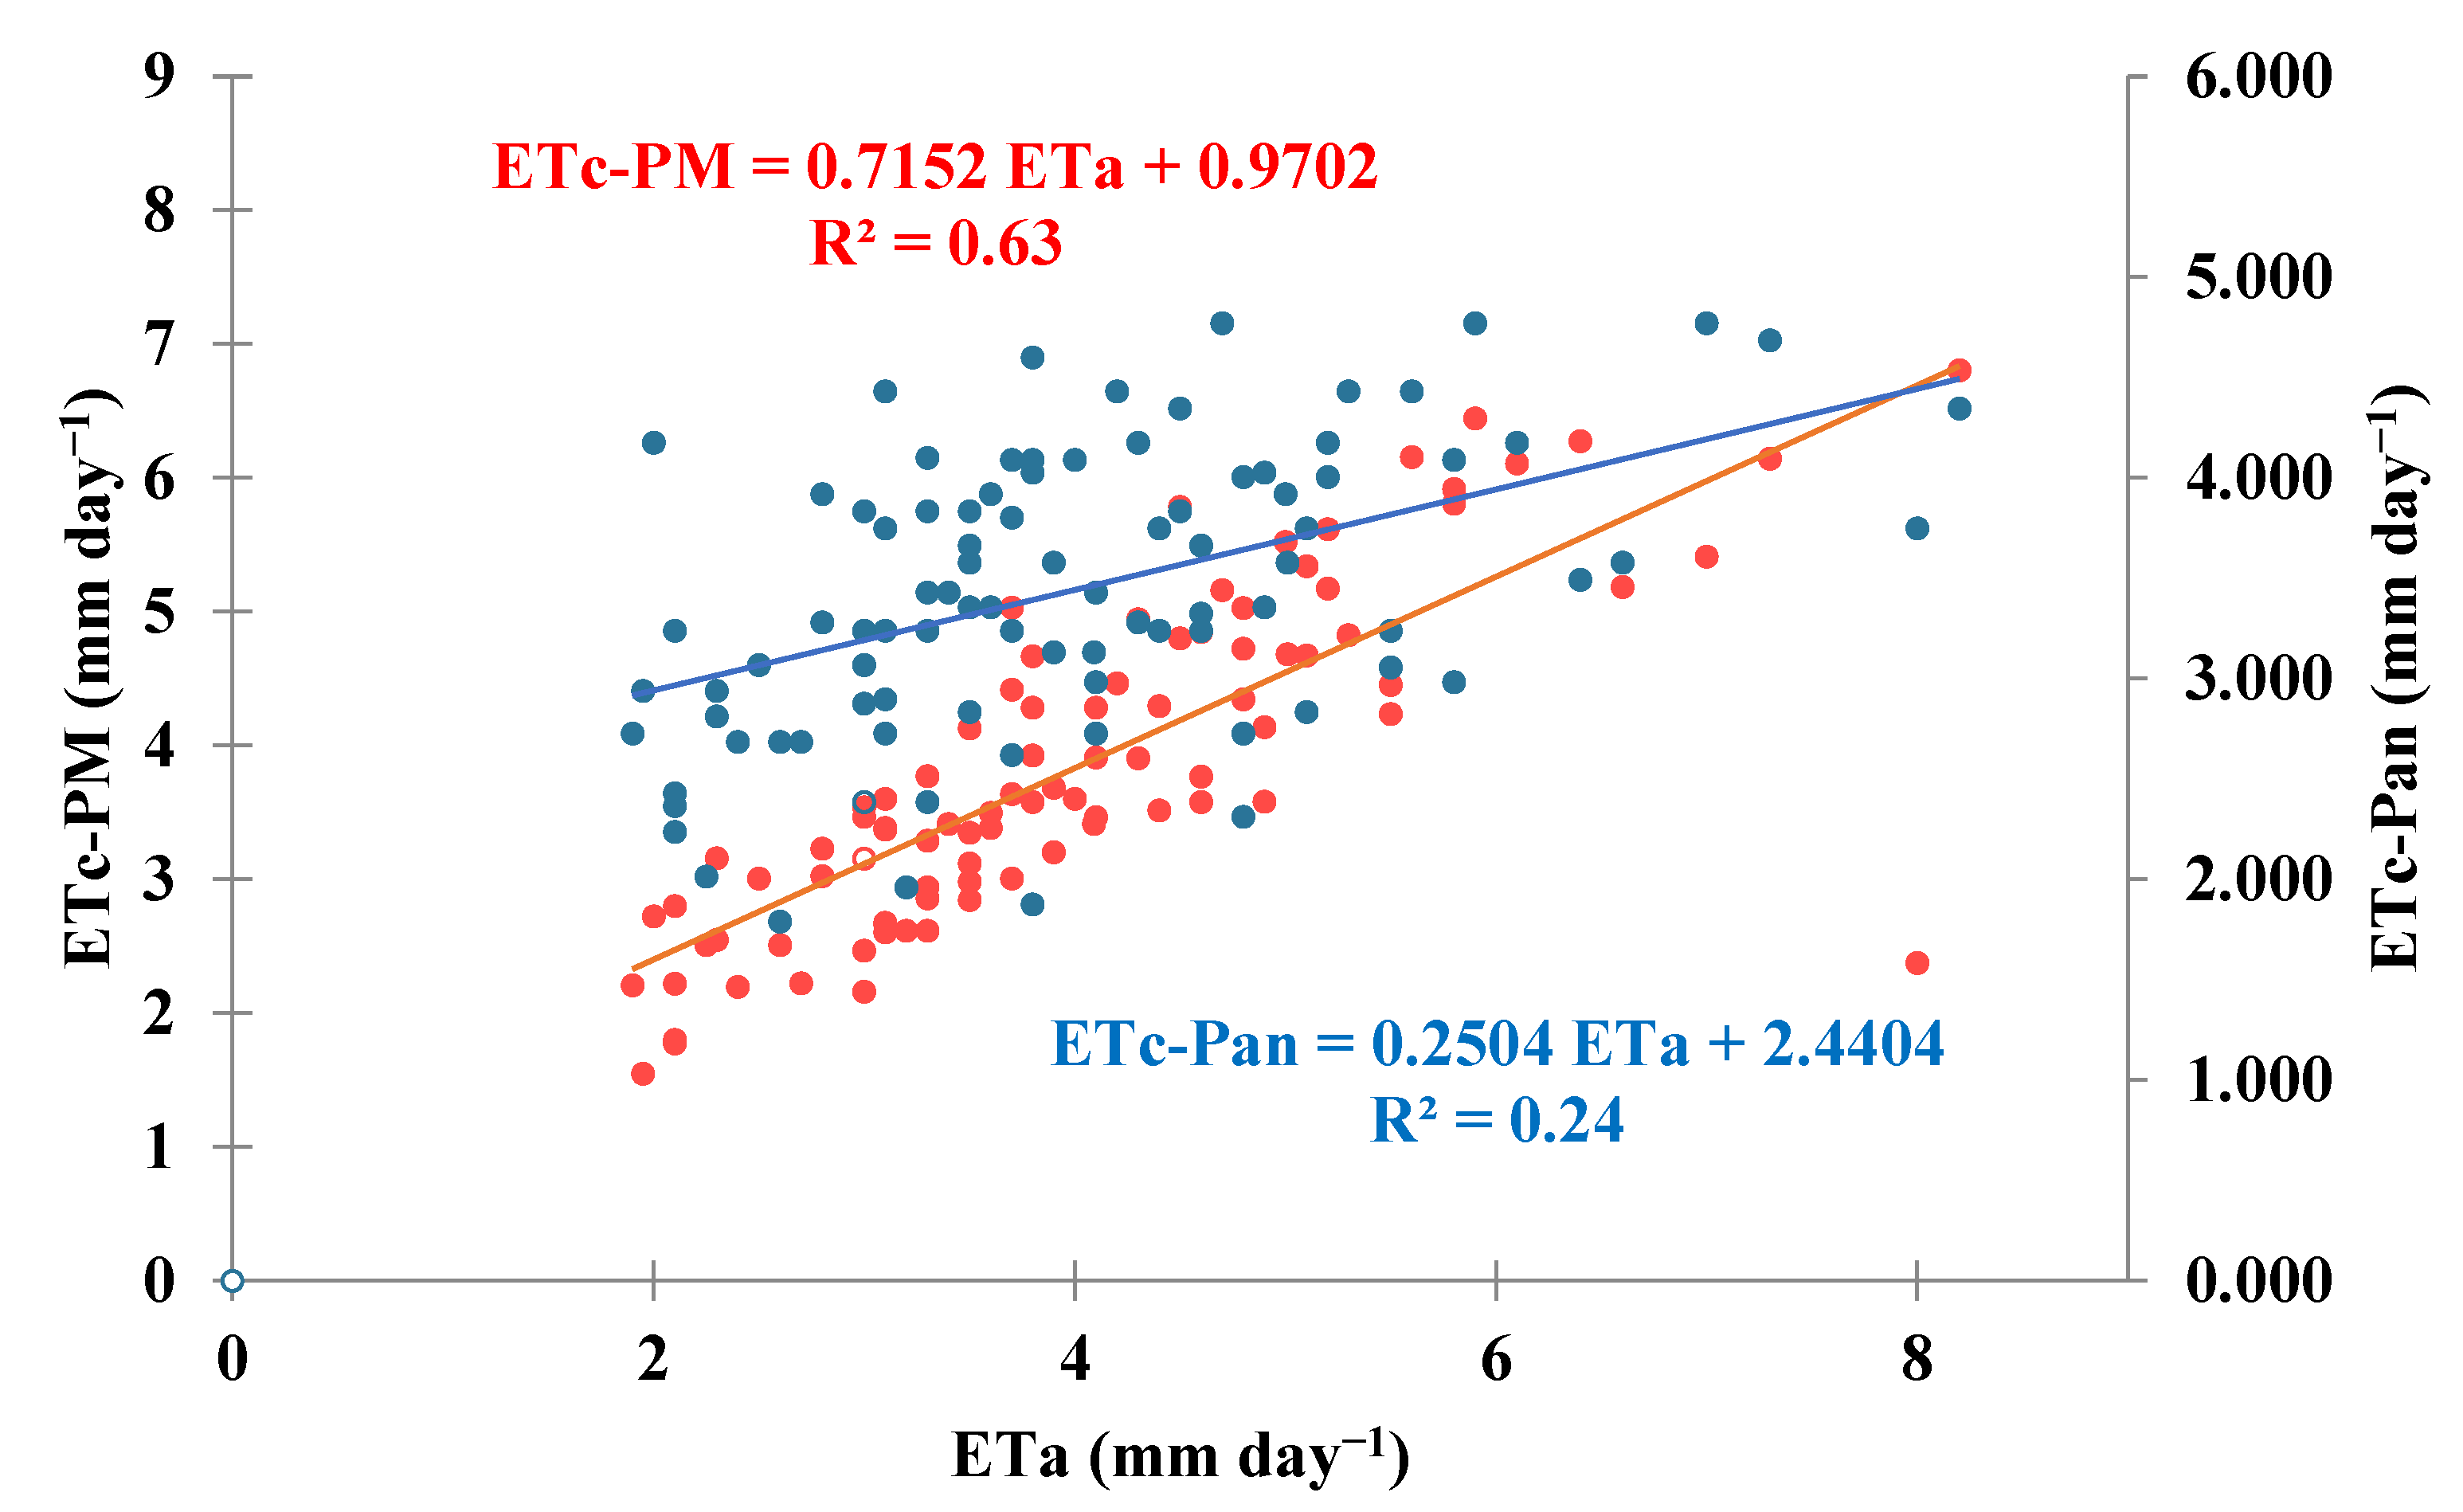
3.2. Comparation of Actual Evapotranspiration with FAO-PMand Pan Evaporation-Derived Evapotranpiration during Crop Period

During the crop growing season, FAO-PM derived evapotranspiration (ETc-PM) varied from 1.55 to 6.8 mm/day with a mean value of 3.84 ± 1.21 mm day−1, while the corresponding daily pan-derived evapotranspiration (ETc-Pan) varied from 1.87 to 4.77 mm day−1 with a mean value of 3.45 ± 0.69 mm day−1. Similarly, daily E T a loss during the crop growing season varied from 1.9 to 8.2 mm/day, with a mean value of 4.02 ± 1.35 mm day−1 (Table 3). Overall, the variations in stagewise-estimated crop evapotranspiration using Penman–Monteith, the pan evaporation approach, and measured daily mean E T a were shown in Figure 7.
Multiple regression analysis results showed that, overall, pan evapotranspiration underestimated the crop evapotranspiration in all four crop growth stages (R2 = 0.24; RMSE = 0.96; and MAPE = 22.3%), whereas the Penman–Monteith equation performed well (R2 = 0.63; RMSE = 0.64; and MAPE = 13.6%), as shown in Figure 8.
However, crop evapotranspiration using the Penman–Monteith equation was highly correlated with measured E T a in the initial (R2 = 0.80; RMSE = 0.49; MAPE = 10.76%) and crop development stages (R2 = 0.79; RMSE = 0.79; MAPE = 13.69%); conversely, in the mid-season and end-season stages, R2 varied to 0.47 (with RMSE = 1.01 and MAPE = 12.76%) and R2 = 0.15(with RMSE = 0.53 and MAPE= 19.42 %), respectively. Similarly, stagewise crop evapotranspiration based on the pan evaporation approach was found to poorly correlate with E T a in the initial (R2 = 0.08; RMSE = 1.19; MAPE = 20.70%), mid-season (R2 = 0.06; RMSE = 1.36; MAPE =26.15 %) and end-season stages (R2 = 0.09; RMSE = 0.50; MAPE =15.32%), while the opposite stronger correlation was found for the crop development stage (R2 = 0.43; RMSE = 1.43; MAPE =19.86% (Figure 9)).

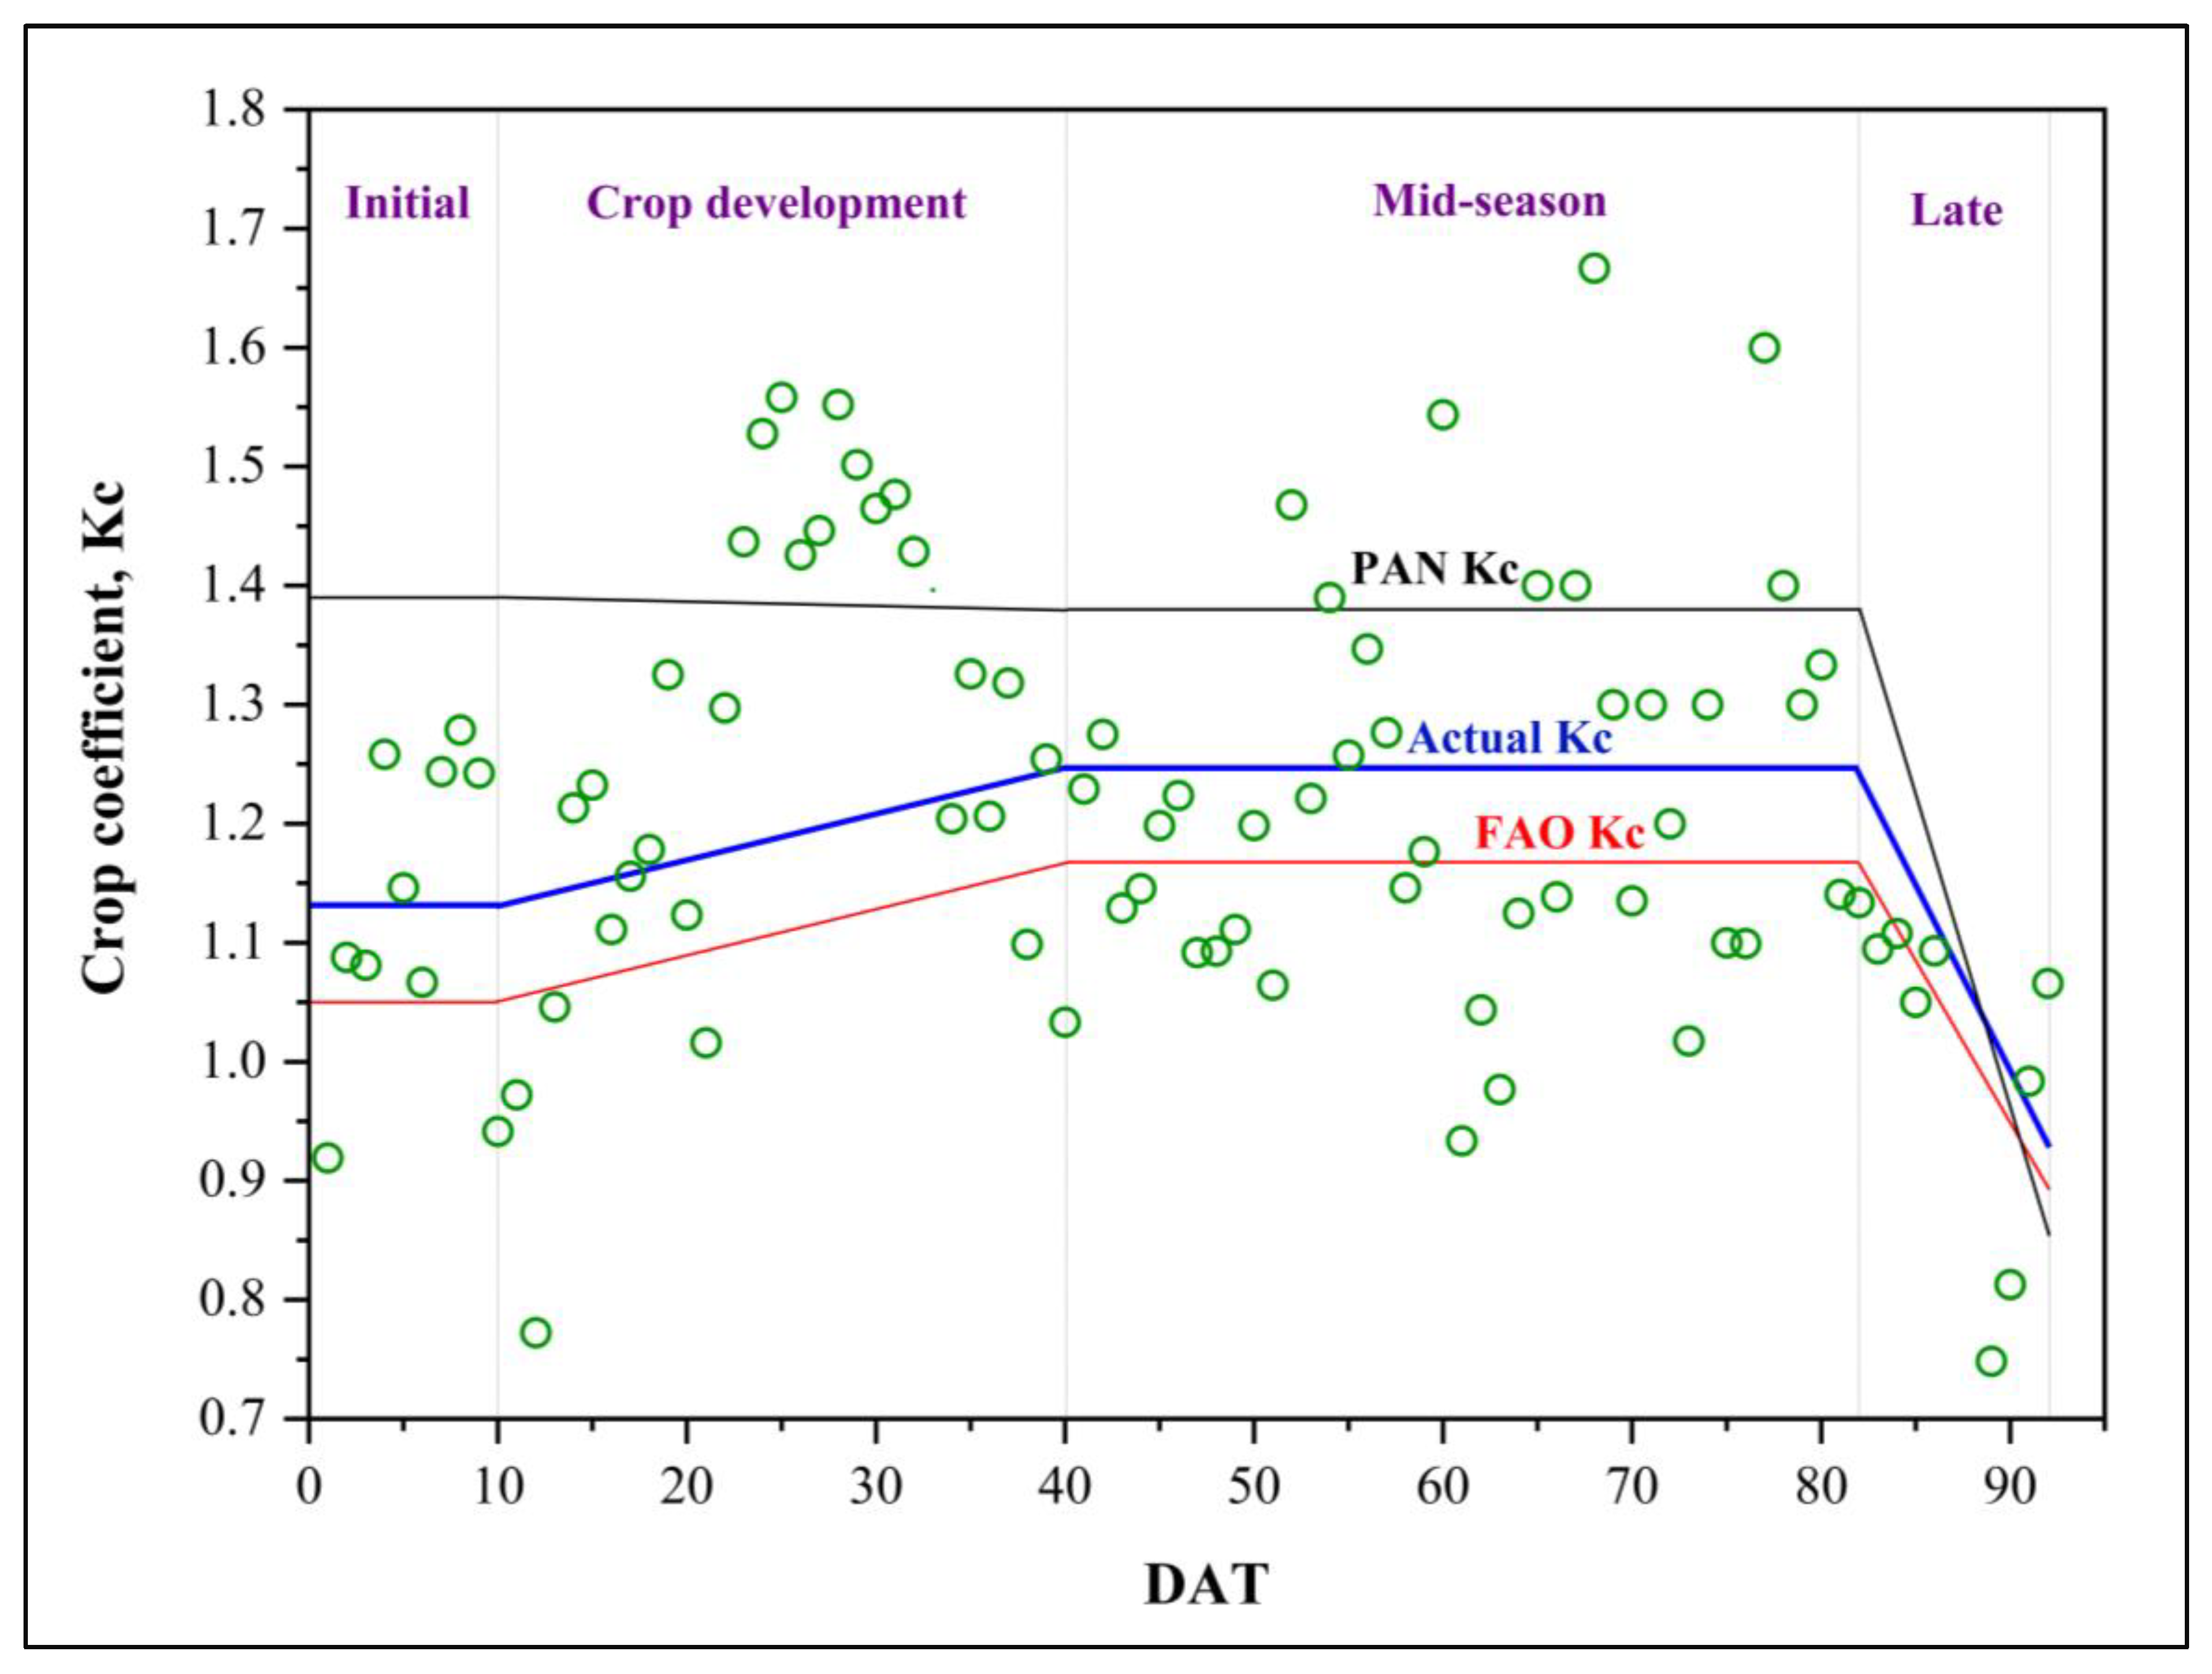
3.3. Comparison of Stagewise Actual Kc vs. Single FAO-56 Kc Values and Derived Pan–Crop Coefficient Values

At the regional scale, actual crop coefficient values were estimated to be 1.13 ± 0.13, 1.27 ± 0.2, 1.23 ± 0.16, and 0.93 ± 0.18 for the initial, crop development, mid-season and late-season stages, respectively. The derived crop coefficient values were 7.62%, 5.83%, 2.5%, and 3.33%, higher during the initial, crop development, mid-season and end/late season stages than the FAO Kc values for the MIGP region, while the pan–crop coefficient values estimated were 1.33 ± 0.41, 1.42 ± 0.36, 1.38 ± 0.48, and 0.85 ± 0.16, i.e., 26.67%, 18.33%, and 15% higher and 5.5% lower for the initial, crop development, mid-season and late-season stages respectively in comparison to the FAO Kc values. Overall, the stagewise variation in measured Kc compared to the FAO-56 Kc values and Pan- Kc values depicted in Figure 10. However, the non-parametric Mann–Whitney U test was performed to compare the association between these stagewise- derived averaged actual Kc values with FAO-56 Kc values and pan–crop coefficient values. The results showed that, at different crop growth stages, the actual average Kc values were in line with FAO values but slightly deviated from the pan-coefficient values, though were non-significant at the 5% level of significance (Figure 11). Overall, the coefficients of determination (R2) between the derived average stagewise Kc vs. single FAO-56 Kc values and derived pan–crop coefficient values were shown in Table 4.
However, based on the average ET0-PM and ET0-Pan estimated from 2017 to 2021 in reference to the actual measured crop evapotranspiration during 2021, the average actual Kc values were calculated to be 1.08 ± 0.29, 1.14 ± 0.33, 1.18 ± 0.37, and 0.84 ± 0.09, while the corresponding average Kc-Pan values were 1.42 ± 0.35, 1.57 ± 049, 1.52 ± 053, and 0.90 ± 1.67 during the initial, crop development, mid-season and end/late-season stages, respectively.

3.4. Influence of Weather Variables on Reference and Actual Evapotranspiration

From the correlation matrix involving weather variables and evapotranspiration, it was confirmed that ET0-PM was positively and significantly influenced by solar radiation, sunshine hours, Tmax, and wind speed and negatively affected by RHmean, whereas in the case of ET0-Pan, pan evaporation, Tmax and solar radiation were the dominant factors that affected it positively and RHmean had a negative effect. More or less similar trends were also seen in E T a as well, where Tmax, sunshine hours, and solar radiation were the main determinants (Figure 12).

3.5. Water Productivity and Agro-Meteorological Indices

The grain yield was measured to be 0.548 kg/m2. Irrigation water use efficiency (IWUE) was estimated to be 0.74 kg/m3, whereas crop water productivity (CWP) was 1.14 kg/m3. Agrometeorological indices, viz., accumulated GDD (°C days), HTU (°C days h), PTU (°C days day −1), and RTD during different phenophases, as well as HUE (kg ha−1 °C Day), HTUE (kg ha−1 °C Day h) and PTUE (kg ha−1 °C Day hrs) for grain and dry matter production under different phenophases, were calculated and presented in Table 5 and Table 6. The results showed that the accumulated GDD, HTU, PTU and RTD values of the rice cultivar (Swarn Shreya) were estimated to be 2321 °C days, 8138 °C days hr, 25,995 °C days day −1, and 26.3 °C, respectively, throughout the crop period (transplanting to harvesting). However, HUE, HTUE and PTUE were estimated to be 2.40 kg ha−1 °C day, 0.62 kg ha−1 °C day h, and 0.21 kg ha−1 °C day h, respectively, which will help in studying the crop response to ambient temperature at different phenological stages.

4. Discussion

4.1. Variation in Reference Evapotranspiration, Water Balance Components, and Actual Evapotranspiration

Overall, a poor relationship was found between the FAO-PM and pan evaporation approaches for estimating reference evapotranspiration, with R2 = 0.27, RMSE = 0.28, and MAPE = 8.34% for the last five years (2017–2021). The reason behind the lower reference evapotranspiration in the case of the pan approach in comparison to ET0-PM is mainly due to a constant pan coefficient (0.71) that needs to be revised at the local scale to imitate the evaporation from the free water surface. This resulted in the underestimation of vegetation role as well as human errors. Similarly, Chatterjee et al. [30] conducted research in Cuttack, Odisha, and part of Eastern India, and reported a poor relationship between FAO-modified PM and Epan-derived ET0, with R2 varying from 0.16 to 0.24, which is in close agreement with our findings. The decrease in Epan could be due to a phenomenon known as the “Pan Evaporation Paradox” [63,64]. However, previous studies also revealed that E T a can exceed Epan for short periods of time (e.g., at different stages of plant growth) when there is a lot of advected heat and a drop in the diurnal temperature range [63,65,66,67,68,69]. Daily E T a used 369.4 mm of water, accounting for 49.77% of the total water applied after transplanting to the harvesting stage. Likewise, Dash et al. [70] reported that around half of the water applied in irrigated puddled rice fields is used in the form of evapotranspiration. However, daily E T a using a modified paddy lysimeter varied from 1.9 to 8.2 mm/day, with a mean value of 4.02 ± 1.35 mm day−1. This variation is mainly due to various biophysical parameters such as vegetation type and density, growth phase, stomatal conductance, weather variations, local field management practices, etc. [34]. Several researchers have indicated that daily mean E T a rates of rice in the Asian continent ranged from 4 to 7 mm per day [30,71], which is in line with the E T a values obtained in our study. However, overall, daily measured E T a increased erratically with the increase in days after transplanting (DAT), reached peak value at the crop development to mid-season stages, mainly due to a larger leaf area index leading to maximum transpiration losses, and eventually decreased at the end-season stage due to leaf senescence [16,18].
E T a estimation using a modified lysimeter, however, had its own limitations. For example, because the drums were installed about 36 cm above the ground, the microclimate (Tmin slightly increased and Tmax slightly decreased by about 0.1–0.3 °C compared to the open field, while relative humidity varied by 1–2%) within the drum differed from the entire field and affected E T a estimation, but only up to 15–20 days after transplanting. After that, plant height increased and came outside the drum. Therefore, the microclimate did not have too much affected E T a estimation. However, the exposed rim of modified lysimeter also caused local advection, but did not significantly affect the E T a estimation. Similarly, research on the potential impacts of advection on flooded rice has not revealed any substantial advection implications [72]. The FAO-recommended Penman–Monteith method is considered to be the best method for ET0 estimation due to the fact that it considers all the weather parameters which influence ET0 [20].

4.2. Comparison of Crop Evapotranspiration and Stagewise Crop Coefficients

Based on the results, overall E T a measured using a modified paddy lysimeter showed a close association with FAO PM-derived evapotranspiration (R2: 0.63). However, the ET0-Pan approach underestimated (R2: 0.24) in these regions. Maina et al. [73] also reported FAO-PM as a better approach than the pan approach due to its good approximation of trustworthy lysimeter readings. In these areas, there has been a documented underestimation of the pan method. The main cause is the constant pan coefficient, which should be updated for these regions [74,75,76]. Similarly, the bulk of the estimated pan coefficients, according to Sabziparvar et al. [77], were not statistically used in the pan ET0 conversion technique. As a result, for each climate, a good model for calculating the pan coefficient is required [78]. However, the overall actual evapotranspiration estimated using the FAO-PM and pan approaches increased significantly as the phenological phases of growth progressed, peaked at mid-season, and subsequently declined at maturity during the crop growing season, similar to previous Indian and international studies [42,79,80]. Tyagi et al. [18] also reported similar results to those obtained in our study. These variations are mainly due to changes in E T a because of weather conditions, crop type and variety, crop growth stages, and local management practices in these areas [33,72]. Rice crop coefficient values for the initial, crop development, mid-season and late-season stages were calculated as 1.13 ± 0.13, 1.27 ± 0.2, 1.23 ± 0.16, and 0.93 ± 0.18, respectively, and results showed that the overall average crop coefficient values at different stages showed at par with the FAO Kc values, but slightly deviated with pan–crop coefficient values. Statistically, these variations were insignificant (at a 5% level of significance). Higher crop coefficient values had been observed, except for end/late-season stage, mainly due to the stagnation of water during the crop season. Depending on the irrigation method, the Kc in the initial stage, with the exception of permanent flooding, declined in comparison to the FAO 56 Kc value [81]. Various findings also reported that stagewise crop coefficients for rice varied from 0.61 to 1.15, 0.97 to 1.44, 1.14 to 1.59, and 0.9 to 1.02, in the initial, crop development, mid-season, and late-season stages, respectively, using a lysimetric and other water balance approaches which were consistent with our findings [14,18,24,26,27,50,51]. Many distinct crop varieties and diverse water management practices, ranging from deep water to floating up to aerobic sprinkler settings, have been observed to cause a significant difference in the paddy crop coefficient [82]. In addition, higher pan–crop coefficient values were found owing to the constant and fixed pan coefficient value (0.71), resulting in significant ET0 estimation errors which need to be revised in these locations, and this approach also underestimated the vegetation contribution [77,81,83]. Undertaking studies to revise the pan coefficient values locally considering the influence of weather parameters on pan evaporation in different climatic conditions is recommended.

4.3. Influence of Weather Variables on Reference and Actual Evapotranspiration

From the results, it was concluded that solar radiation, sunshine hours, Tmax, and wind speed positively affected evapotranspiration, whereas RHmean negatively affected evapotranspiration (ET0-PM, ET0-Pan and E T a ). Similar patterns of influence of these weather variables on evapotranspiration estimation were also reported in semi-arid IGPs [84]. Additionally, a significant factor influencing the weekly fluctuation in E T a was reported as net solar radiation variation (r ≥ 0.87) in IGPs by [7]. Chatterjee et al. [30] also reported a strong positive relationship between E T a and Tmean, as well as solar radiation in Eastern India. These variables mainly affected the sensible heat flux from soil to canopy and substantially affected their estimations during crop season.

4.4. Assessment of Water Productivity (WP) and Agro-Meteorological Indices

The results revealed that the IWUEand CWPof rice were 0.74 and 1.14 kg/m3, respectively. This figure fits within the range of the internationally recorded WP of rice (0.6–1.6 kg/m3) [85]. Similarly, the crop water productivity ranged between 0.9 and 1.54 kg/m3, while total WP was varied from 0.68 to 0.98 kg/m3 for different rice varieties [85]. Rice water productivity ranged from 0.6 to 1.5 kg/m3, which supports our findings according to Mboyerwa et al. [86]. These variations are mainly due to climate, soil type, soil structure, crop type, variety, duration, irrigation methods, fertilizer applications, etc. Agrometeorological indices showed that temperature affects crop growth and yield. These indices also varied due to different transplanting dates and varieties [84]. In the present study, various agrometeorological indices for the rice cultivar Swarna Shreya had been calculated and their variations showed the pattern of biomass accumulation at different phenological stages, which ultimately affect crop productivity. This type of study helps in understanding crop response to temperature variation for future yield forecasting in these regions under climate change scenarios.

5. Conclusions

Agriculture water management is aided by accurate ET quantification and crop coefficient computation during different crop growth stages. In this study, the stagewise average daily crop evapotranspiration rates (mm day−1) were estimated as 3.86 ± 0.95, 4.51 ± 1.41, 4.05 ± 1.28, and 2.52 ± 0.51, and their corresponding Kc values were 1.13 ± 0.13, 1.27 ± 0.2, 1.23 ± 0.16, and 0.93 ± 0.18 for the initial, crop development, mid-season and late-season stages, respectively. The derived average crop coefficient values were reported 7.62%, 5.83%, 2.5%, and 3.33%, higher during the initial, crop development, mid-season, and end-season stages compared to FAO Kc values. However, the average pan–crop coefficients estimated as 1.33 ± 0.41, 1.42 ± 0.36, 1.38 ± 0.48, and 0.85 ± 0.16 were 26.67%, 18.33%, and 15% higher and 5.5% lower than the initial, crop development, mid-season and late-season stages, respectively, in comparison to FAO Kc values. Overall, the results showed good agreement (R2 = 0.63) between E T a and FAO-PM-calculated ETc . Conversely, the pan evaporation approach underestimated the crop evapotranspiration compared to E T a , which suggests revising the pan coefficient values for the study region will achieve better accuracy. Thus, we recommend revising the pan coefficient values considering the influence of weather parameters. The IWUEand CWP for rice were estimated as 0.74 and 1.14 kg/m3, respectively. Similarly, agrometeorological indices were also estimated for Swarna Shreya to help in forecasting the occurrence of different phenophases in similar agro-climatic regions. Therefore, this type of methodology could also be used in other edaphoclimatic and data-scarce regions where lysimeters are unavailable to estimate actual evapotranspiration in paddy areas. In addition, the derived stagewise Kc values at the regional scale may help in efficient irrigation planning for similar agro-climatic conditions. Overall, Kc and E T a values may be beneficial to improve irrigation scheduling in water-intensive rice crop.

Author Contributions

Conceptualization, methodology, field experiment, formal analysis, writing—original draft preparation, A.K. (Arti Kumari), A.U. and P.J.; results analysis, graphics A.K. (Arti Kumari); J.R., N.A.-A. and A.K. (Alban Kuriqi); visualization, writing—reviewing and editing, A.K. (Arti Kumari), A.U., P.J., P.K.S., K.S., V.P., N.A.-A. and A.K.S.; writing—reviewing and editing, A.K. (Arti Kumari), R.K.R. and V.G.; visualization, funding acquisition, writing—reviewing, A.K. (Alban Kuriqi) and N.A.-A. All authors have read and agreed to the published version of the manuscript.

Funding

This research work has not received external funding.

Data Availability Statement

All relevant data are included in the paper.

Acknowledgments

Authors are thankful to the Indian Council of Agricultural Research—Research Complex for Eastern Region (ICAR-RCER), Patna, for lending all the facilities needed to conduct the field experiments.

Conflicts of Interest

The authors declare no conflict of interest.

References

  1. Boretti, A.; Rosa, L. Reassessing the Projections of the World Water Development Report. NPJ Clean Water 2019, 2, 15. [Google Scholar] [CrossRef] [Green Version]
  2. Dimple, D.; Rajput, J.; Al-Ansari, N.; Elbeltagi, A.; Zerouali, B.; Santos, C.A.G. Determining the Hydrological Behaviour of Catchment Based on Quantitative Morphometric Analysis in the Hard Rock Area of Nand Samand Catchment, Rajasthan, India. Hydrology 2022, 9, 31. [Google Scholar] [CrossRef]
  3. Rajput, J.; Kothari, M.; Bhakar, S.R.; Dimple; Kushwaha, N.L.; Singh, P.K.; Paramaguru, P.K.; Rai, A.; Elbeltagi, A.; Rana, L. Evaluation of Water Delivery Performance of Right Main Canal of Bhimsagar Medium Irrigation Scheme, Rajasthan. ISH J. Hydraul. Eng. 2022, 1–11. [Google Scholar] [CrossRef]
  4. Rajput, J.; Kothari, M.; Kumari, A. Development of Optimum Irrigation Schedule and Rotational Water Allocation Plan for Bhimsagar Canal Command System. Int. J. Agric. Sci. 2018, 10, 5849–5853. [Google Scholar]
  5. World Water Development Report. 2018. Available online: https://www.unwater.org/publications/world-water-development-report-2018 (accessed on 24 September 2022).
  6. Rajput, J.; Kothari, M.; Bhakar, S.R. Performance Evaluation of Water Delivery System for Command Area of Left Main Canal of Bhimsagar Irrigation Project, Rajasthan. J. Agric. Eng. 2017, 54, 57–66. [Google Scholar]
  7. Choudhury, B.U.; Singh, A.K.; Pradhan, S. Estimation of Crop Coefficients of Dry-Seeded Irrigated Rice–Wheat Rotation on Raised Beds by Field Water Balance Method in the Indo-Gangetic Plains, India. Agric. Water Manag. 2013, 123, 20–31. [Google Scholar] [CrossRef]
  8. Sekar, I.; Pal, S. Rice and Wheat Crop Productivity in the Indo-Gangetic Plains of India: Changing Pattern of Growth and Future Strategies. Indian J. Agric. Econ. 2012, 67, 1–15. [Google Scholar]
  9. Bouman, B. How Much Water Does Rice Use? Rice Today 2009, 8, 28–29. [Google Scholar]
  10. Geethalakshmi, V.; Ramesh, T.; Palamuthirsolai, A. Lakshmanan Agronomic Evaluation of Rice Cultivation Systems for Water and Grain Productivity. Arch. Agron. Soil Sci. 2011, 57, 159–166. [Google Scholar] [CrossRef]
  11. Kumar, N.; Chhokar, R.S.; Meena, R.P.; Kharub, A.S.; Gill, S.C.; Tripathi, S.C.; Gupta, O.P.; Mangrauthia, S.K.; Sundaram, R.M.; Sawant, C.P.; et al. Challenges and Opportunities in Productivity and Sustainability of Rice Cultivation System: A Critical Review in Indian Perspective. Cereal Res. Commun. 2021, 1–29. [Google Scholar] [CrossRef]
  12. Tuong, T.P.; Bouman, B.A.M. Rice Production in Water-Scarce Environments; International Water Management Institute: Colombo, Sri Lanka, 2003. [Google Scholar]
  13. Bhatt, R.; Kukal, S.S.; Busari, M.A.; Arora, S.; Yadav, M. Sustainability Issues on Rice–Wheat Cropping System. Int. Soil Water Conserv. Res. 2016, 4, 64–74. [Google Scholar] [CrossRef] [Green Version]
  14. Yadav, S.; Humphreys, E.; Kukal, S.; Gill, G.; Ramaswamy, R. Effect of Water Management on Dry Seeded and Puddled Transplanted Rice: Part 2: Water Balance and Water Productivity. Field Crops Res. 2011, 120, 123–132. [Google Scholar] [CrossRef]
  15. Bouman, B.; Tuong, T.P. Field Water Management to Save Water and Increase in Productivity in Irrigated Lowland Rice. Agric. Water Manag. 2001, 49, 11–30. [Google Scholar] [CrossRef]
  16. Choudhury, B.; Bouman, B.; Singh, A.K. Yield and Water Productivity of Rice–Wheat on Raised Beds at New Delhi, India. Field Crops Res. 2007, 100, 229–239. [Google Scholar] [CrossRef]
  17. Angaleeswari, M.; Ravikumar, V.; Kannan, S.V. Evapotranspiration Estimation by Inverse Soil Water Flow Modelling. Irrig. Sci. 2021, 39, 633–649. [Google Scholar] [CrossRef]
  18. Tyagi, N.; Sharma, D.; Luthra, S. Determination of Evapotranspiration and Crop Coefficients of Rice and Sunflower with Lysimeter. Agric. Water Manag. 2000, 45, 41–54. [Google Scholar] [CrossRef]
  19. Tyagi, N.; Sharma, D.; Luthra, S. Evapotranspiration and Crop Coefficients of Wheat and Sorghum. J. Irrig. Drain. Eng. Asce 2000, 126, 215–222. [Google Scholar] [CrossRef]
  20. Allen, R.; Pereira, L.; Raes, D.; Smith, M. FAO Irrigation and Drainage Paper No. 56. Rome Food Agric. Organ. United Nations 1998, 56, 26–40. [Google Scholar]
  21. Gaddikeri, V.; Hasan, M.; Kumar, D.; Sarangi, A.; Alam, W. Performance Analysis and Measurement of Soil Moisture Content by Piezoresistive Sensor. Mapan 2022, 37, 149–160. [Google Scholar] [CrossRef]
  22. Popova, Z.; Pereira, L.S. Modelling for maize irrigation scheduling using long term experimental data from Plovdiv region, Bulgaria. Agric. Water Manag. 2011, 98, 675–683. [Google Scholar] [CrossRef]
  23. Rodrigues, G.C.; Pereira, L.S. Assessing Economic Impacts of Deficit Irrigation as Related to Water Productivity and Water Costs. Biosyst. Eng. 2009, 103, 536–551. [Google Scholar] [CrossRef] [Green Version]
  24. Allen, R.G.; Pruitt, W.O.; Wright, J.L.; Howell, T.A.; Ventura, F.; Snyder, R.; Itenfisu, D.; Steduto, P.; Berengena, J.; Yrisarry, J.B.; et al. A Recommendation on Standardized Surface Resistance for Hourly Calculation of Reference ETo by the FAO56 Penman-Monteith Method. Agric. Water Manag. 2006, 81, 1–22. [Google Scholar] [CrossRef]
  25. Beeson , R.C., Jr. Weighing Lysimeter Systems for Quantifying Water Use and Studies of Controlled Water Stress for Crops Grown in Low Bulk Density Substrates. Agric. Water Manag. 2011, 98, 967–976. [Google Scholar] [CrossRef]
  26. Cai, X.; Mckinney, D.; Lasdon, L. Integrated Hydrologic-Agronomic-Economic Model for River Basin Management. J. Water Resour. Plan. Manag. Asce 2003, 129, 4–17. [Google Scholar] [CrossRef] [Green Version]
  27. Satti, S.R.; Jacobs, J.M.; Irmak, S. Agricultural Water Management in a Humid Region: Sensitivity to Climate, Soil and Crop Parameters. Agric. Water Manag. 2004, 70, 51–65. [Google Scholar] [CrossRef]
  28. Babaee, M.; Shokat-Naghadeh, A.; Ahmadpari, H.; Nabi-Jalali, M. Comparison of Different Methods with Lysimeter Measurements in Estimation of Rice Evapotranspiration in Sari Region. Rev. Ing. UC 2019, 26, 175–184. [Google Scholar]
  29. Djaman, K.; Rudnick, D.R.; Moukoumbi, Y.D.; Sow, A.; Irmak, S. Actual Evapotranspiration and Crop Coefficients of Irrigated Lowland Rice (Oryza sativa L.) under Semiarid Climate. Ital. J. Agron. 2019, 14, 19–25. [Google Scholar] [CrossRef] [Green Version]
  30. Chatterjee, S.; Stoy, P.; Debnath, M.; Nayak, A.K.; Swain, C.; Tripathi, R.; Chatterjee, D.; Mahapatra, S.; Talib, A. Actual Evapotranspiration and Crop Coefficients for Tropical Lowland Rice (Oryza sativa L.) in Eastern India. Theor. Appl. Climatol. 2021, 146, 155–171. [Google Scholar] [CrossRef]
  31. Choudhury, B.U.; Singh, A.K. Estimation of Crop Coefficient of Irrigated Transplanted Puddled Rice by Field Scale Water Balance in the Semi-Arid Indo-Gangetic Plains, India. Agric. Water Manag. 2016, 176, 142–150. [Google Scholar] [CrossRef]
  32. Alberto, M.C.R.; Quilty, J.R.; Buresh, R.J.; Wassmann, R.; Haidar, S.; Correa, T.Q.; Sandro, J.M. Actual Evapotranspiration and Dual Crop Coefficients for Dry-Seeded Rice and Hybrid Maize Grown with Overhead Sprinkler Irrigation. Agric. Water 2014, 136, 1–12. [Google Scholar] [CrossRef]
  33. Timm, A.U.; Roberti, D.R.; Streck, N.A.; de Gonçalves, L.G.G.; Acevedo, O.C.; Moraes, O.L.L.; Moreira, V.S.; Degrazia, G.A.; Ferlan, M.; Toll, D.L. Energy Partitioning and Evapotranspiration over a Rice Paddy in Southern Brazil. J. Hydrometeorol. 2014, 15, 1975–1988. [Google Scholar] [CrossRef]
  34. Arif, C.; Setiawan, B.I.; Sofiyuddin, H.A.; Martief, L.M.; Mizoguchi, M.; Doi, R. Estimating Crop Coefficient in Intermittent Irrigation Paddy Fields Using Excel Solver. Rice Sci. 2012, 19, 143–152. [Google Scholar] [CrossRef] [Green Version]
  35. Arif, C.; Setiawan, B.I.; Mizoguchi, M.; Doi, R. Estimation of Water Balance Components in Paddy Fields under Non-Flooded Irrigation Regimes by Using Excel Solver. J. Agron. 2012, 11, 53–59. [Google Scholar] [CrossRef] [Green Version]
  36. Garcia, M.; Raes, D.; Jacobsen, S.-E. Evapotranspiration Analysis and Irrigation Requirements of Quinoa (Chenopodium Quinoa) in the Bolivian Highlands. Agric. Water Manag. 2003, 60, 119–134. [Google Scholar] [CrossRef]
  37. Pulvento, C.; Riccardi, M.; Lavini, A.; D’Andria, R.; Ragab, R. Parameterization and Field Validation of Saltmed Model for Grain Amaranth Tested in South Italy. Irrig. Drain. 2015, 64, 59–68. [Google Scholar] [CrossRef]
  38. French, A.N.; Hunsaker, D.J.; Sanchez, C.A.; Saber, M.; Gonzalez, J.R.; Anderson, R. Satellite-Based NDVI Crop Coefficients and Evapotranspiration with Eddy Covariance Validation for Multiple Durum Wheat Fields in the US Southwest. Agric. Water Manag. 2020, 239, 106266. [Google Scholar] [CrossRef]
  39. Zhang, B.; Liu, Y.; Xu, D.; Zhao, N.; Lei, B.; Rosa, R.D.; Paredes, P.; Paço, T.A.; Pereira, L.S. The Dual Crop Coefficient Approach to Estimate and Partitioning Evapotranspiration of the Winter Wheat–Summer Maize Crop Sequence in North China Plain. Irrig. Sci. 2013, 31, 1303–1316. [Google Scholar] [CrossRef]
  40. Tripathi, R.P. Evapotranspiration and Crop Coefficient for Rice, Wheat and Pulses under Shallow Water Table Conditions of Tarai Region of Uttaranchal. J. Agrometeorol. 2004, 6, 17–29. [Google Scholar] [CrossRef]
  41. Mohan, S.; Arumugam, N. Irrigation Crop Coefficients for Lowland Rice. Irrig. Drain. Syst. 1994, 8, 159–176. [Google Scholar] [CrossRef]
  42. Kingra, P.; Hundal, S.; Sharma, P. Characterization of Crop Coefficients for Wheat and Rice Crops in Punjab. J. Agrometeorol. 2004, 6, 58–60. [Google Scholar]
  43. Moratiel, R.; Martínez-Cob, A. Evapotranspiration and Crop Coefficients of Rice (Oryza sativa L.) under Sprinkler Irrigation in a Semiarid Climate Determined by the Surface Renewal Method. Irrig. Sci. 2013, 31, 411–422. [Google Scholar] [CrossRef] [Green Version]
  44. Laike, S.; Tilahun, K.; Hordofa, T. Crop Coefficient of Haricot Bean at Melkassa, Central Rift Valley of Ethiopia. JARTS 2006, 107, 33–40. [Google Scholar]
  45. Patil, A.; Tiwari, K.N. Yield Assessment, N Uptake and KC Development of Green Gram Crop during Wet Season of India. Arch. Agron. Soil Sci. 2021, 67, 313–328. [Google Scholar] [CrossRef]
  46. López-Urrea, R.; Montoro, A.; González-Piqueras, J.; López-Fuster, P.; Fereres, E. Water Use of Spring Wheat to Raise Water Productivity. Agric. Water Manag. 2009, 96, 1305–1310. [Google Scholar] [CrossRef]
  47. López-Urrea, R.; Sánchez, J.M.; de la Cruz, F.; González-Piqueras, J.; Chávez, J.L. Evapotranspiration and Crop Coefficients from Lysimeter Measurements for Sprinkler-Irrigated Canola. Agric. Water Manag. 2020, 239, 1–10. [Google Scholar] [CrossRef]
  48. Cavalcante Junior, E.G.; de Medeiros, J.F.; Espínola Sobrinho, J.; Figueirêdo, V.B.; da Costa, J.P.N.; de O. Santos, W. Development and Water Requirements of Cowpea under Climate Change Conditions in the Brazilian Semi-Arid Region. Rev. Bras. Eng. Agríc. Ambient. 2016, 20, 783–788. [Google Scholar] [CrossRef]
  49. Hatiye, S.D.; Hari Prasad, K.S.; Ojha, C.S.P.; Adeloye, A.J. Estimation and Characterization of Deep Percolation from Rice and Berseem Fields Using Lysimeter Experiments on Sandy Loam Soil. J. Hydrol. Eng. 2016, 21, 05016006. [Google Scholar] [CrossRef]
  50. Kar, G.; Kumar, A.; Martha, M. Water Use Efficiency and Crop Coefficients of Dry Season Oilseed Crops. Agric. Water Manag. 2007, 87, 73–82. [Google Scholar] [CrossRef]
  51. Chahal, G.B.S.; Sood, A.; Jalota, S.K.; Choudhury, B.U.; Sharma, P.K. Yield, Evapotranspiration and Water Productivity of Rice (Oryza sativa L.)-Wheat (Triticum aestivum L.) System in Punjab (India) as Influenced by Transplanting Date of Rice and Weather Parameters. Agric. Water Manag. 2007, 88, 14–22. [Google Scholar] [CrossRef]
  52. Sivapalan, S. Water Balance of Flooded Rice in the Tropics. In Irrigation and Drainage; Javaid, M.S., Ed.; IntechOpen: Rijeka, Croatia, 2015. [Google Scholar]
  53. Shiraki, S.; Cho, T.M.; Matsuno, Y.; Shinogi, Y. Evapotranspiration and Crop Coefficient of Ratoon Rice Crop Determined by Water Depth Observation and Bayesian Inference. Agronomy 2021, 11, 1573. [Google Scholar] [CrossRef]
  54. Doorenbos, J.; Pruitt, W.O. Guidelines for Predicting Crop Water Requirements. Irrig. Drain. Pap. FAO 1975, 24, 1–179. [Google Scholar]
  55. Bouyoucos, G.J. Hydrometer Method Improved for Making Particle Size Analyses of Soils1. Agron. J. 1962, 54, 464–465. [Google Scholar] [CrossRef]
  56. Klute, A.; Dirksen, C. Hydraulic Conductivity and Diffusivity: Laboratory Methods. In Methods of Soil Analysis; John Wiley & Sons, Ltd.: Hoboken, NJ, USA, 1986; pp. 687–734. ISBN 978-0-89118-864-3. [Google Scholar]
  57. Blake, G.R.; Hartge, K.H. Bulk Density. In Methods of Soil Analysis; John Wiley & Sons, Ltd.: Hoboken, NJ, USA, 1986; pp. 363–375. ISBN 978-0-89118-864-3. [Google Scholar]
  58. Wirth, E.H. Soil and Plant Analysis, by C. S. PIPER. Interscience Publishers, Inc., New York. J. Am. Pharm. Assoc. 1946, 35, 192. [Google Scholar] [CrossRef]
  59. Walkley, A.; Black, I.A. An Examination Of The Degtjareff Method for Determining Soil Organic Matter, and A Proposed Modification of the Chromic Acid Titration Method. Soil Sci. 1934, 37, 29–38. [Google Scholar] [CrossRef]
  60. Cassel, D.K.; Nielsen, D.R. Field Capacity and Available Water Capacity. In Methods of Soil Analysis; John Wiley & Sons, Ltd.: Hoboken, NJ, USA, 1986; pp. 901–926. ISBN 978-0-89118-864-3. [Google Scholar]
  61. Passioura, J. Increasing Crop Productivity When Water Is Scarce—From Breeding to Field Management. Agric. Water Manag. 2006, 80, 176–196. [Google Scholar] [CrossRef] [Green Version]
  62. Ali, M.H.; Talukder, M.S.U. Increasing Water Productivity in Crop Production—A Synthesis. Agric. Water Manag. 2008, 95, 1201–1213. [Google Scholar] [CrossRef]
  63. Hobbins, M.T.; Ramírez, J.A.; Brown, T.C. Trends in Pan Evaporation and Actual Evapotranspiration across the Conterminous U.S.: Paradoxical or Complementary? Geophys. Res. Lett. 2004, 31, 2665–2668. [Google Scholar] [CrossRef] [Green Version]
  64. van Heerwaarden, C.C.; Vilà-Guerau de Arellano, J.; Teuling, A.J. Land-Atmosphere Coupling Explains the Link between Pan Evaporation and Actual Evapotranspiration Trends in a Changing Climate. Geophys. Res. Lett. 2010, 37, 1–15. [Google Scholar] [CrossRef] [Green Version]
  65. Zhang, Y.; Liu, C.; Tang, Y.; Yang, Y. Trends in Pan Evaporation and Reference and Actual Evapotranspiration across the Tibetan Plateau. J. Geophys. Res. Atmos. 2007, 112, 1–12. [Google Scholar] [CrossRef]
  66. Rowshon, M.K.; Amin, M.S.M.; Mojid, M.A.; Yaji, M. Estimated Evapotranspiration of Rice Based on Pan Evaporation as a Surrogate to Lysimeter Measurement. Paddy Water Environ. 2014, 12, 35–41. [Google Scholar] [CrossRef]
  67. Lawrimore, J.H.; Peterson, T.C. Pan Evaporation Trends in Dry and Humid Regions of the United States. J. Hydrometeorol. 2000, 1, 543–546. [Google Scholar] [CrossRef]
  68. Golubev, V.S.; Lawrimore, J.H.; Groisman, P.Y.; Speranskaya, N.A.; Zhuravin, S.A.; Menne, M.J.; Peterson, T.C.; Malone, R.W. Evaporation Changes over the Contiguous United States and the Former USSR: A Reassessment. Geophys. Res. Lett. 2001, 28, 2665–2668. [Google Scholar] [CrossRef]
  69. Kahler, D.M.; Brutsaert, W. Complementary Relationship between Daily Evaporation in the Environment and Pan Evaporation. Water Resour. Res. 2006, 42, 1–9. [Google Scholar] [CrossRef]
  70. Jyotiprava Dash, C.; Sarangi, A.; Singh, D.K.; Singh, A.K.; Adhikary, P.P. Prediction of Root Zone Water and Nitrogen Balance in an Irrigated Rice Field Using a Simulation Model. Paddy Water Environ. 2015, 13, 281–290. [Google Scholar] [CrossRef]
  71. Tuong, T.P. Productive Water Use in Rice Production. J. Crop Prod. 2000, 2, 241–264. [Google Scholar] [CrossRef]
  72. Alberto, M.C.R.; Wassmann, R.; Hirano, T.; Miyata, A.; Hatano, R.; Kumar, A.; Padre, A.; Amante, M. Comparisons of Energy Balance and Evapotranspiration between Flooded and Aerobic Rice Fields in the Philippines. Agric. Water Manag. 2011, 98, 1417–1430. [Google Scholar] [CrossRef]
  73. Maina, M.M.; Amin, M.S.M.; Aimrun, W.; Asha, T.S. Evaluation of Different ET [Evapotranspiration] Calculation Methods: A Case Study in Kano State, Nigeria. Philipp. Agric. Sci. 2012, 95, 394–399. [Google Scholar]
  74. Snyder, R.L.; Orang, M.; Matyac, S.; Grismer, M.E. Simplified Estimation of Reference Evapotranspiration from Pan Evaporation Data in California. J. Irrig. Drain. Eng. 2005, 131, 249–253. [Google Scholar] [CrossRef]
  75. Ghare, A.D.; Porey, P.D.; Ingle, R.N. Discussion of “Simplified Estimation of Reference Evapotranspiration from Pan Evaporation Data in California” by Richard L. Snyder, Morteza Orang, Scott Matyac, and Mark E. Grismer. J. Irrig. Drain. Eng. 2006, 132, 519–520. [Google Scholar] [CrossRef]
  76. Cobaner, M. Reference Evapotranspiration Based on Class A Pan Evaporation via Wavelet Regression Technique. Irrig. Sci. 2011, 31, 119–134. [Google Scholar] [CrossRef]
  77. Sabziparvar, A.-A.; Tabari, H.; Aeini, A.; Ghafouri, M. Evaluation of Class A Pan Coefficient Models for Estimation of Reference Crop Evapotranspiration in Cold Semi-Arid and Warm Arid Climates. Water Resour. Manag. Int. J. Publ. Eur. Water Resour. Assoc. 2010, 24, 909–920. [Google Scholar] [CrossRef]
  78. Conceição, M.A.F. Reference Evapotranspiration Based on Class A Pan Evaporation. Sci. Agric. 2002, 59, 417–420. [Google Scholar] [CrossRef]
  79. Midmore, D.J.; Cartwright, P.M.; Fischer, R.A. Wheat in Tropical Environments. II. Crop Growth and Grain Yield. Field Crops Res. 1984, 8, 207–227. [Google Scholar] [CrossRef]
  80. Kuo, S.-F.; Ho, S.-S.; Liu, C.W. Estimation Irrigation Water Requirements with Derived Crop Coefficients for Upland and Paddy Crops in ChiaNan Irrigation Association, Taiwan 2005. Agric. Water Manag. 2006, 82, 433–451. [Google Scholar] [CrossRef]
  81. Roderick, M.L.; Rotstayn, L.D.; Farquhar, G.D.; Hobbins, M.T. On the Attribution of Changing Pan Evaporation. Geophys. Res. Lett. 2007, 34, L17403. [Google Scholar] [CrossRef] [Green Version]
  82. Pereira, L.S.; Paredes, P.; Hunsaker, D.J.; López-Urrea, R.; Mohammadi Shad, Z. Standard Single and Basal Crop Coefficients for Field Crops. Updates and Advances to the FAO56 Crop Water Requirements Method. Agric. Water Manag. 2021, 243, 106466. [Google Scholar] [CrossRef]
  83. Pradhan, S.; Sehgal, V.; Bandyopadhyay, K.; Singh, R. Evapo-Transpiration Based Irrigation Scheduling. In Training Manual; Division of Agricultural Physics: New Delhi, India; Indian Agricultural Research Institute: New Delhi, India, 2012; pp. 80–86. [Google Scholar]
  84. Jagtap, D.N.; Sutar, M.W.; Mahadkar, U.V.; Chavan, S.A.; Pinjari, S.S.; Jadhav, M.S. Study of Agrometeorological Indices as Affected by Different Duration Rice Varieties and Crop Establishment Methods. IJBSM 2018, 9, 655–660. [Google Scholar] [CrossRef]
  85. López, R.; Jiménez-Chong, J.; Hernández-Aragón, L.; Ibarra, M. Water Productivity of Rice Genotypes with Irrigation and Drainage: Water Productivity of Rice. Irrig. Drain. 2018, 67, 508–515. [Google Scholar] [CrossRef]
  86. Mboyerwa, P.A.; Kibret, K.; Mtakwa, P.W.; Aschalew, A. Evaluation of Growth, Yield, and Water Productivity of Paddy Rice with Water-Saving Irrigation and Optimization of Nitrogen Fertilization. Agronomy 2021, 11, 1629. [Google Scholar] [CrossRef]
Figure 1. Location map of the experimental site.
Agronomy 12 02850 g001
Figure 2. Water balance components in modified non-weighing paddy lysimeter.
Agronomy 12 02850 g002
Figure 3. Methodology of E T a and stagewise Kc estimation using modified non-weighing paddy lysimeter.
Agronomy 12 02850 g003
Figure 4. Daily variation in ET0-PM and ET0-Pan from 2017 to 2021 during crop period.
Agronomy 12 02850 g004
Figure 5. Relationship between ET0-PM and ET0-Pan (mm day−1) for the last five years (2017–2021).
Agronomy 12 02850 g005
Figure 6. Water balance estimation in modified paddy lysimeter.
Agronomy 12 02850 g006
Figure 7. Crop stagewise variation in actual, FAO-PM and pan-derived evapotranspiration (mm day−1).
Agronomy 12 02850 g007
Figure 8. Multiple linear regression analysis of actual, FAO-PM and pan evaporation (mm day−1) during crop period.
Agronomy 12 02850 g008
Figure 9. Stagewise multiple linear regression analysis of actual, FAO PM and pan evaporation crop evapotranspiration.
Agronomy 12 02850 g009aAgronomy 12 02850 g009b
Figure 10. Stagewise variation in actual Kc values, FAO-56 Kc values, and pan–crop coefficient values during DAT (days after transplanting).
Agronomy 12 02850 g010
Figure 11. Variation in actual stagewise Kc vs. FAO-56 Kc and pan–crop coefficient values (at 5 % level of significance).
Agronomy 12 02850 g011
Figure 12. Correlation plot between weather variables and evapotranspiration (ET0-PM, ET0-Pan and E T a ).
Agronomy 12 02850 g012
Table 1. Weekly average variability of weather parameters during crop season (after transplanting).
WeeksWeather Parameters
Minimum Temp. (°C)Maximum Temp. (°C)Relative Humidity (%)Wind Speed (km/h)Sunshine HoursPan Evaporation (mm)Weekly Total Rainfall (mm)
126.832.878.07.32.34.367.4
227.333.377.02.81.84.270.6
326.932.681.64.42.84.525.4
426.934.174.96.45.14.759.4
526.431.883.74.60.74.074.4
626.934.176.43.54.34.710.4
726.733.774.47.16.54.754.3
825.831.583.48.42.03.255.0
926.833.475.65.45.74.612.1
1025.330.879.99.22.83.934.4
1124.532.879.01.95.14.60.4
1225.433.874.43.54.24.41.2
1323.331.276.75.04.94.227.2
1422.430.477.02.60.63.80.0
Table 2. Soil physical properties of the experimental plot.
ParametersValuesMethods Employed for Estimation
Particle size distribution (%) Hydrometer method [55]
Sand54
Silt28
Clay18
Soil textureSandy loam
Hydraulic conductivity (cm/h)1.55Klute and Dirksen method [56]
Bulk density (g/cm3)1.52Core sampler [57]
pH (1:1 soil: water)7.87Elico pH meter [58]
Organic content (%)0.51Walkley and Black method [59]
Field capacity (%)18.42Pressure plate apparatus [60]
Permanent wilting point (%)8.42
Table 3. Stagewise variation in crop evapotranspiration throughout cropping season.
Crop Growth StagesETc-PM
(mm Day−1)
ETc-Pan
(mm Day−1)
E T a
(mm Day−1)
Initial3.59 ± 0.773.15 ± 0.693.86 ± 0.95
Crop development4.05 ± 1.163.59 ± 0.604.51 ± 1.41
Mid-season4.07 ± 1.263.61 ± 0.674.05 ± 1.28
End season2.50 ± 0.502.67 ± 0.262.52 ± 0.51
Overall3.84 ± 1.213.45 ± 0.694.02 ± 1.35
Note: All values are given in mean ± standard deviation (SD).
Table 4. Correlation coefficient (r) between measured average actual Kc, FAO-56 Kc and pan Kc values.
VariablesKc-ActualKc-PanFAO-Kc
Kc-actual 0.9330.972
Kc-Pan0.933 0.852
FAO-Kc0.9720.852
Table 5. Accumulated GDD (°C days), HTU (°C days hr), PTU (°C days day −1), and RTD (°C) during different phenophases of rice cultivar.
Agrometeorological IndicesTilleringPanicle InitiationFloweringPhysiological MaturityHarvesting
GDD6981117174820242321
HTU18813287567969758138
PTU920013,9292106323.9425,995
RTD17.919.1020.823.726.3
Note: GDD: growing degree days; HTU: heliothermal unit; PTU: photothermal unit; RTD: relative temperature disparity.
Table 6. HUE (kg ha−1 °C Day), HTUE (kg ha−1 °C Day hrs), and PTUE (kg ha−1 °C Day h) of rice for grain and dry matter production under different phenophases.
Agrometeorological IndicesGrain YieldDry Biomass
HUE2.408.50
HTUE0.622.41
PTUE0.210.75
Note: HUE (kg ha−1 °C day), HTUE (kg ha−1 °C day h), and PTUE (kg ha−1 °C day h) of rice for grain and dry matter production under different phenophases.
Publisher’s Note: MDPI stays neutral with regard to jurisdictional claims in published maps and institutional affiliations.

