Article

Physical, Chemical, and Biological Indicators of Soil Quality in Mediterranean Vineyards under Contrasting Farming Schemes

by
Pilar Andrés
1,*,
Enrique Doblas-Miranda
1,2,
Alex Silva-Sánchez
1,
Stefania Mattana
1,3 and
Francesc Font
4
1
CREAF, Edifici C, Campus UAB, 08193 Bellaterra, Barcelona, Spain
2
Department of Ecology, Universitat Autònoma de Barcelona, Edifici C, Campus UAB, 08193 Bellaterra, Barcelona, Spain
3
CSIC, Global Ecology CREAF-CSIC-UAB Group, Edifici C, Campus UAB, 08193 Bellaterra, Barcelona, Spain
4
Can Font, C/ Mar 5, 17493 Pedret i Marzà, Girona, Spain
*
Author to whom correspondence should be addressed.
Agronomy 2022, 12(11), 2643; https://doi.org/10.3390/agronomy12112643
Submission received: 25 August 2022 / Revised: 19 October 2022 / Accepted: 24 October 2022 / Published: 26 October 2022
(This article belongs to the Special Issue Bioindicators of Soil Quality for Agricultural Soil Use)

Abstract

:
The soil of most Spanish vineyards is strongly eroded and carbon depleted and is very poor in biodiversity. Growing evidence of the negative impacts of soil degradation on climate change mitigation, water quality, and plant production is pushing a shift from intensive viticulture to more sustainable management strategies of the vineyards. Among them, minimum impact and regenerative viticulture are gaining ground. However, field data are still necessary to assess the real effect of these new farming schemes on soil carbon stocks and soil functional biodiversity. We compared soil quality at three vineyards managed under intensive, regenerative, and minimum impact strategies using physical, chemical, and biological indicators. Soil carbon stocks were 2.3 and 3.4 times greater in the regenerative and the minimal impact vineyards than in the intensive vineyard, respectively. Soil biota was particularly favored by regenerative viticulture, with 26.2 times more protists, 3.1 times more nematodes, and 29.4 more microarthropods in the regenerative than in the intensive vineyard. Our results indicate that the ecological intensification of agricultural practices is highly promising to restore degraded agricultural soils under Mediterranean conditions. We also propose cost-effective soil bioindicators sensitive to agricultural management for their possible inclusion in soil monitoring programs.

1. Introduction

Soil contains the largest terrestrial organic carbon pool (2400 Pg C to 2 m depth), which is three times the amount of CO2 currently in the atmosphere [1]. It also provides most of the ecosystem services we rely upon, with soil biodiversity being the regulating agent behind this [2].
Soil ecological degradation can be defined as the disruption of the functions that support the net productivity on the ecosystem [3]. Across Europe, intensive agriculture is among the main drivers of soil physical and chemical degradation, erosion, and organic matter loss [4]. In turn, the decay of soil organic carbon (SOC), together with the use of agrochemicals, is at the root of the decline in the biomass and functional diversity of the soil biota [5]. However, belowground biodiversity is crucial for agricultural soils since it correlates with soil multifunctionality and with most soil functions that underpin plant production [6]. Intensive farming also lessens the resilience of the soil food web to climate change and, in particular, its ability to withstand drought [7]. It had been posited that the negative effects of intensive management on the soil biota are restricted to the largest belowground animals [8], but recent molecular analyses show that soil bacteria, fungi, and protists are even more affected than metazoans [9].
Vineyards are the form of agricultural use that causes the greatest rates of soil loss under Mediterranean climate, with measured values of 2.4 to 9.3 Mg ha−1 year−1 [10]. These high rates are attributable to frequent cultivation on steep slopes, tillage, mineral fertilization, and the absence of soil plant cover in inter-row spaces [11]. Tillage alters the soil carbon balance through negative effects on the methanotrophic microorganisms of the soil, thus lessening its CH4- oxidizing capacity [12] and its potential as a carbon sink. Due to erosion, limited organic inputs, and high mineralization rates, intensive vineyards often behave as net CO2 emitters [13]. However, when properly managed, they offer great potential for carbon sequestration in trees and soil [14]. In the latter, sequestration not only helps remove atmospheric CO2, but also improves the environment (e.g., soil structure, aggregate stability, pore space water retention capacity, etc.) on which the living soil community relies upon [4].
Several SOC-centered agricultural practices have been proposed to recarbonize agricultural soils, such as tillage cessation or reduction, mulching, cover and catch crop seeding, and organic fertilization [15,16]. No-tillage and reduced tillage can increase SOC in croplands, with sequestration potentials of 0.1 to 1.0 t C ha−1 year−1 [17], due to the larger amount of SOC physically protected inside the microaggregates of no-tilled soils, which reduces SOC turnover [18,19]. However, neutral or even negative effects of tillage cessation on SOC stocks have been described under specific environmental conditions [20,21,22]. With a few reported exceptions [23,24], cover crops enhance SOC content, due to increasing plant inputs from above and below ground. The size of this effect varies with soil properties and climate [16] and is sensitive to crop type and agricultural management (e.g., plant cover composition and diversity) [25,26]. Organic fertilization also increases SOC stocks in woody crops [27,28], with different results depending on the supplied biomass. Green compost is the best option, while manure might have little or no effect unless combined with cover crops [29,30].
Besides enhancing SOC content, the above-mentioned practices are meant to increase soil biodiversity [31], with varying success for different groups of soil inhabitants [32]. Tillage cessation and reduction favor belowground invertebrates and mycorrhiza [33]. When plant residues are left to decompose on the ground, they benefit generalist predators and contribute to pest control [34]. Organically managed soils with high SOC content show high levels of microbial biomass and diversity [35], two key drivers of the resistance of soil microbial communities to disturbance [36].
When applied alone, many of these agricultural practices regarded as “sustainable” often generate little benefit compared with intensive methods. In fact, restoring the multifunctionality of degraded agricultural soils requires implementing integrated management schemes that wisely combine complementary actions [27,37]. Minimum impact (also known as “low-input”) and regenerative farming are among these alternative schemes. “Minimum impact” farming refers to those systems managed with limited use of external inputs (including fossil fuels, agrochemicals, or mineral fertilizers), and that generally rely on the improved management of on-farm resources. “Regenerative agriculture” is a farming approach that seeks to close nutrient cycles and to increase farm biodiversity and resilience, which applies locally tailored combinations of practices that contribute to sequestering carbon, to building soil fertility and health, and to improving the hydrological cycle [38]. A combination of tillage cessation (or significant reduction), cover and catch crops, enhanced plant diversity, and integration between animal raising and cropping are the main principles of this strategy [39]. There is abundant information about the effects of each of the main sustainable agricultural practices in isolation on soil carbon stocks. However, the effect of their joint application under integrated agricultural schemes on carbon sequestration and soil biodiversity are much less studied [40,41]. More field data are necessary to inform agricultural planning at the landscape scale.
Physical and chemical indicators that provide information about soil fertility are commonplace [42] but, despite increasing appeals for action [43,44,45], there is a striking absence of indicators addressing the effects of agricultural management on the soil biota [46]. An important drawback for implementing bioindicator systems useful for policy making is the scarcity of soil biodiversity data at the management scale, which impedes setting reference values and defining desired trajectories and rates of change [47,48].
The aim of this work is (a) to provide indicators of soil carbon stocks and soil biodiversity that are appropriate to evaluate farming schemes in Mediterranean vineyards, and (b) to compare vineyards managed under intensive and sustainable schemes based on these indicators. We hypothesize that (i) the effects of management on soil biodiversity can be measured by sensitive bioindicators that are affordable in terms of cost and work effort and that (ii) both minimum impact and regenerative viticulture contribute to improve soil biodiversity by increasing soil C stocks and by reversing soil physical and chemical deterioration.

2. Materials and Methods

2.1. Study Site

This study was conducted in an agricultural zone of the Girona province, in Catalonia, Spain. The topography is smooth, and the climate is typically Mediterranean, with 15.2 °C of mean annual temperature, 703 mm of annual precipitation, and dry summers characterized by soil water deficit.
We selected three adjacent vineyards that occupy a homogeneous spot of well drained Haplic Regosols developed on silty, clay, and sandy sediments from the Pliocene. The three fields are totally comparable in terms of climate, topography, geological substrate, and soil type. After a long-lasting shared history of intensive viticulture, the three fields currently undergo contrasting management strategies: intensive management (INT), regenerative management (REG), and minimum impact management (MIN).
In the intensive vineyard (42°19′06.6″ N, 3°04′42.2″ E, 27 m.a.s.l., 7100 m2 area) (Figure 1a), the vine trees are 30 years old, and the management has always been intensive: soil is tilled at 20 cm five times a year. Soil is fertilized with 150 kg ha−1 of NPK. Weeds are eliminated with glyphosate, and plant pests are controlled with chemical pesticides and systemic fungicides. In the regenerative vineyard (42°19′09.0″ N 3°04′41.8″ E, 27 m.a.s.l., 8300 m2 area) (Figure 1b), the vine trees are 30 years old. The management had been intensive until 2015. Since then, under regenerative principles, cultivation entails no tillage, cation regulation, and permanent cover crops made of a mixture of Lolium rigidum, Dactylis glomerata, Festuca arundinacea, Onobrychis viciifolia, Vicia sativa, Trifolium alexandrinum, and Sinapis alba. The soil is fertilized with calf manure (6 t ha−1). In spring and summer, the herbs growing in the inter-rows are smashed with a crop roller, and the space between vines in the same row is cleared up to minimize competition. The soil is decompacted in winter with air injectors, and humic acids are added. Microbial teas that are locally produced [49] are applied. Fungal attacks are prevented with copper and sulfur, and insect pests are controlled with pheromones. In the minimum impact vineyard (42°19′01.5″ N 3°04′36.5″ E, 27 m.a.s.l, 6700 m2 area) (Figure 1c), the vines are 50 years old. The field was intensively managed until 2007, when tillage was suppressed and the vegetation was allowed to grow wild between vines. The herbaceous cover is mown yearly with a lightweight mower, and plant residues are allowed to decompose in situ. Pruning remains are removed from the field and burnt. Bordeaux broth and sulfur are regularly applied to prevent fungal attacks.
All three vineyards are rainfed, and the vines are planted 1.5 m away from each other in rows separated by 2.5 m wide inter-rows. The vine trees are trellised in the intensive and regenerative vineyards but are allowed to develop their natural shape in the minimum management vineyard.

2.2. Sampling Design

Real replication is often impossible in farming and grazing field studies. Due to the spatial soil variability of the region, to the nature of the farming activity, and to the predominance of intensive agriculture, we were not able to replicate our three vineyards. Although the samples collected within each field were, strictly speaking, pseudo-replicates, the inter-sample distance was large enough to consider them independent from each other [50,51].
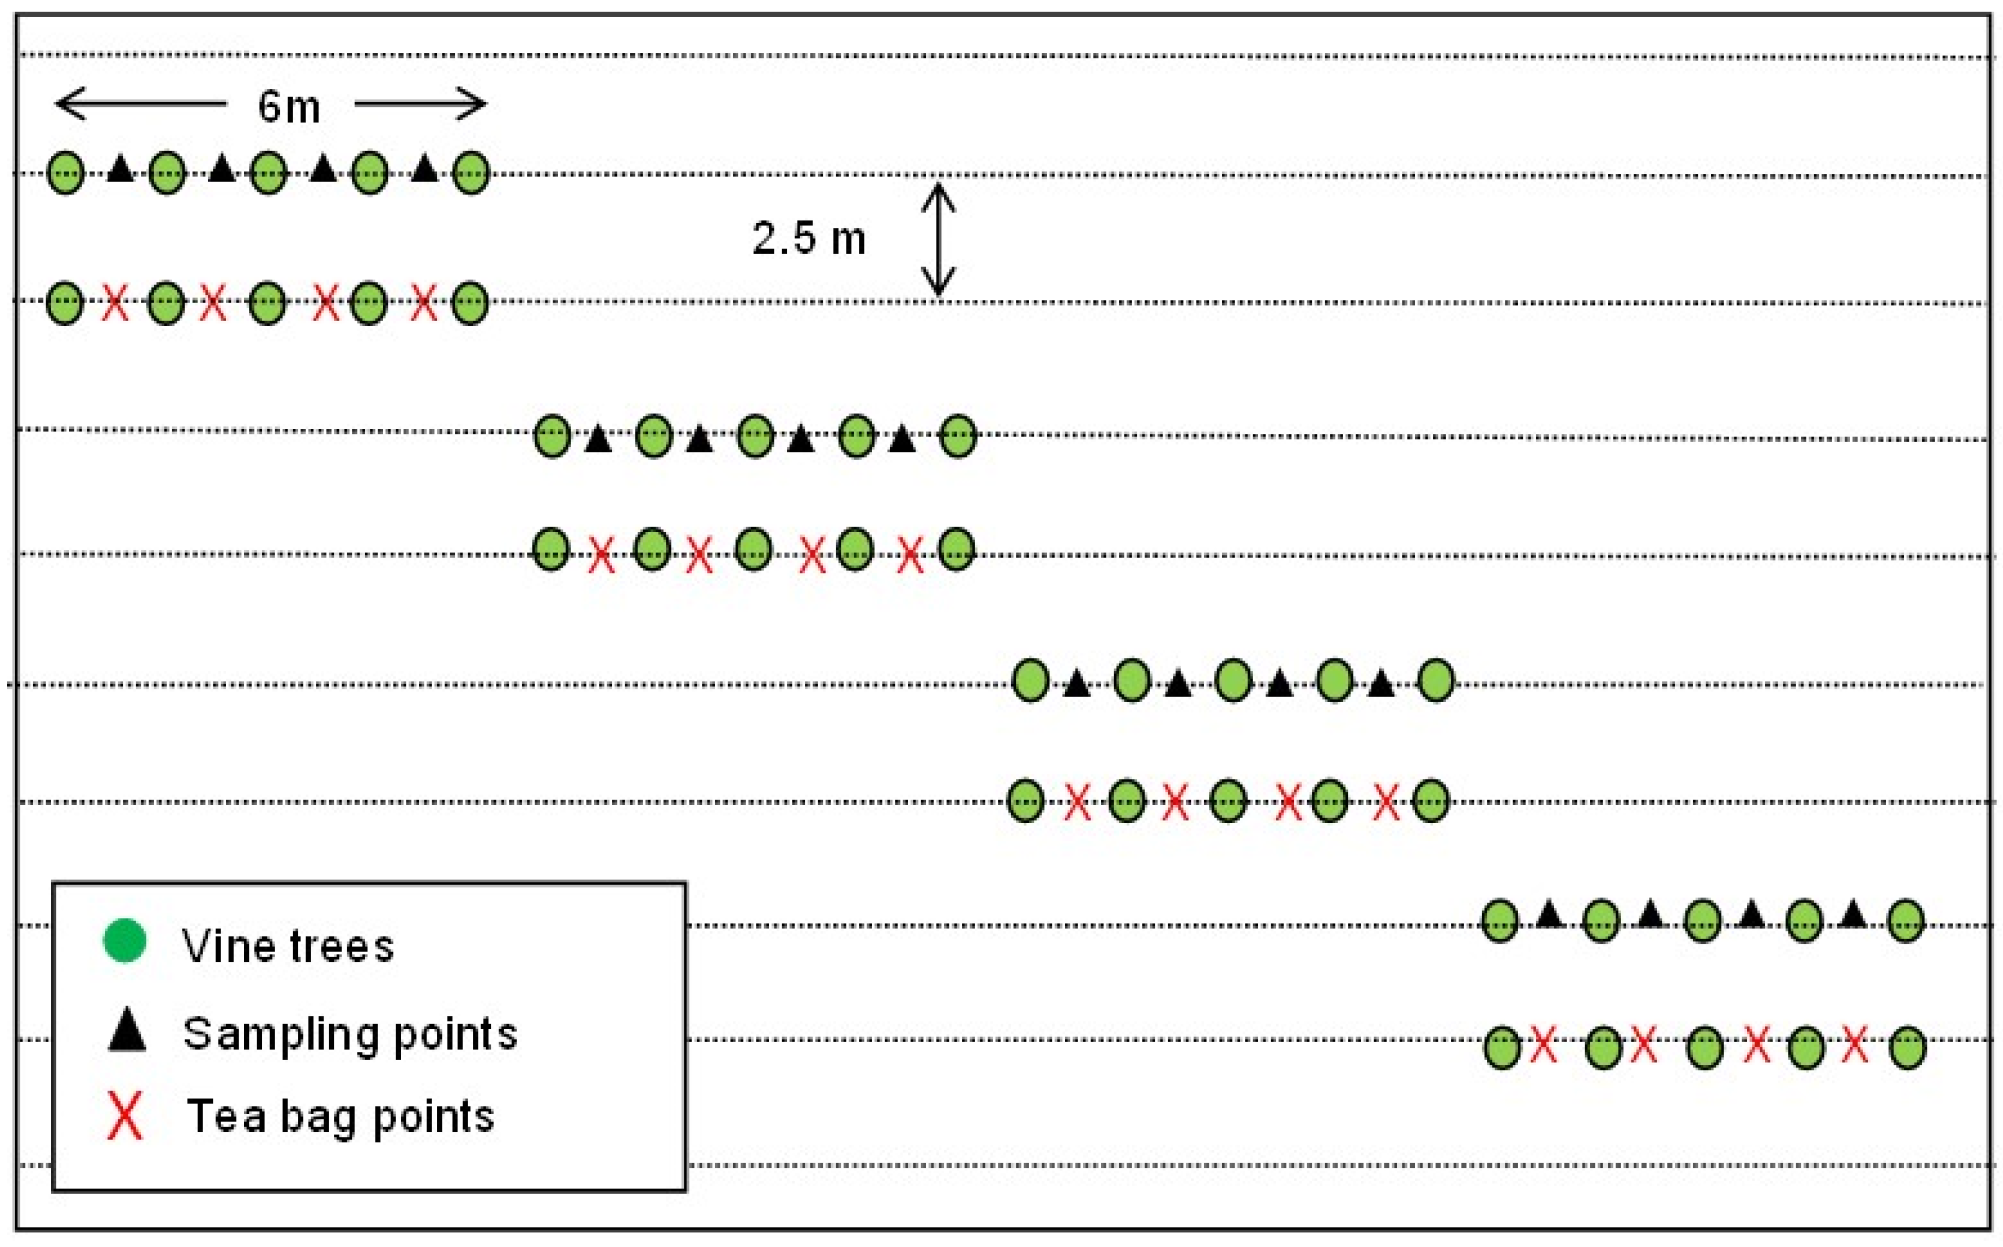
We used a systematic line transect sampling design, with transects placed in a zigzag fashion. At the center of each vineyard, we delimited a 30 × 30 m area containing 10 vine rows. At each area, following a diagonal direction, we established 16 pairs of sampling points, with all points placed in the space between two vine trees (Figure 2). The diagonal distribution of the sampling points and their location beneath the trees was intended to hedge the spatial variability at each field while avoiding uncontrollable disturbances due to the passing of machinery between trellises.
In May 2019, we visited the vineyards and buried one pair of tea bags (one rooibos and one green tea bag (16 pairs of bags per vineyard) at the “tea bag” sampling points (Figure 2). All bags were buried at a depth of 8 to 10 cm and allowed to decompose belowground for 85 days.
In July 2019, we revisited the fields for sampling. We took three soil cores (25 cm2 section and 15 cm long) at each of the 16 sampling points of each vineyard (Figure 2). The first sample was allocated to soil physical and chemical analyses; the second to soil microarthropods analyses; and the third to soil nematode analyses, soil incubation, extraction of soil protists, and soil microbial community profiling. A fourth core (5 cm Ø and 5 cm long cylindrical probes) was taken for a bulk density measurement. All samples were transported to the CREAF labs in coolers for immediate processing.

2.3. Lab Analyses

Dry soil samples sieved at 2 mm were analyzed for water content, texture (gravimetric method), pH (water, 1:2.5), electric conductivity (extract 1:5), carbonates, nitrogen (Kjeldahl), available phosphorus (Olsen), and cations (Ca, Na, K and Mg) (ICP-OES Plasma-Mass inductively coupled plasma-atomic emission spectrometry). Aggregate stability was measured by the Mean Weight Diameter (MWD), obtained by the wet sieving method [52,53]. Total organic carbon (TOC) content was assessed in a Thermo Scientific FLASH 2000 CHNS analyzer after removing the carbonates by acidification. The size of the labile and recalcitrant C pools was obtained by incubation of 50 g soil samples (sieved at 2 mm) in sealed Mason jars (25 °C, 60% WHC, in the dark) for 275 days. The CO2 evolved was measured in the atmosphere of the headspace of the jars at increasing time intervals by infrared absorption spectrometry. We estimated the size of the active C pool by fitting the curve of the CO2-C evolved per unit time to a two-pool first-order equation. The size of the recalcitrant C pool was estimated from the difference between TOC and labile C.
A community-level physiological profiling of the soil microbes was done with MicroResp™ [54] using the following substrates: two simple sugars (D-glucose, D-fructose), one disaccharide (sucrose), one polysaccharide (cellulose), three amino acids (γ-aminobutyric acid, L-proline, L-arginine), three carboxylic acids (α-ketoglutarate, citric acid, L-malic acid), one aromatic carboxylic acid (protocatechuic acid), one polymer (a-cyclodextrin), one chiral (mannitol), one polyol (glycerol), and a sugar alcohol (meso-erythritol). We used original MicroResp™ plates (https://www.microresp.com/), and the substrates were purchased from Sigma Aldrich. Plate reading was performed with a microplate reader spectrophotometer at 570 nm. Due to budgetary limitations, the microbial physiological profiling was only performed in half of the 16 soil samples taken at each vineyard. We estimated the abundance of soil bacteria (bacterial cells/m2) and fungi (mm3 hyphae/m2) by direct counting in slides under an epifluorescence microscope and divided the resulting fungal biomass by 10 to assess only its live fraction, since the epifluorescence method estimates not only living bacteria, but also both the dead and living fungi [55].
We estimated the abundance of the three main groups of protists (ciliates, amoebas, and flagellates) by the most probable number method [56]. We extracted the nematodes from the soil samples with Baermann funnels for 72 h and sorted them into feeding groups. We extracted the microarthropods in Berlese funnels for 7 days and sorted them into functional groups based on common trophic positions and life traits. We calculated the carbon abundance of every group of the soil biota by multiplying its abundance by one-half of the individual body weight attributed to the group (see Table A1 in Appendix A), assuming that 50% of the dry weight of the living biomass is made of carbon.
We used the “Tea Bag” method to compare our vineyards for the effectiveness of their soil in decomposing plant residues. The method is based on the differential in decomposition between the fast-decomposing leaves of Camellia sinensis (green tea) and the slow-decomposing leaves of Aspalathus linearis (rooibos tea) for about three months. Following the original protocol of the test [57], we used Lipton rooibos tea (EAN: 87 22700 18843 8) and Lipton green tea (EAN: 87 22700 05552 5) as proxies of low- and high-quality litter, respectively, based on differences in their chemical quality and recalcitrance to biological decomposition. We oven-dried a set of 20 bags of each type for five days at 40 °C and weighed their dry tea content. After 85 days of incubation in the soil of the vineyards, we retrieved the bags, let them dry in the oven, and weighed the tea they contained. From these data, we calculated the decomposition rate constant of the labile fraction of the bags’ content as follows [58]:
K r = LN   X r 1 a r a r / t
where Xr is the fraction of rooibos tea remaining after incubation, ar is the predicted labile fraction of rooibos tea, and t is the incubation time expressed in days.

2.4. Data Treatment

Soil microbial functional diversity (H′) and evenness (E′) were calculated based on the relative utilization of all substrates used in the MicroResp test, as follows [59]:
H = i = 1 S p i   LN p i  
E = 1 i = 1 S p i 2
where pi is the relative respiration induced by the ith substrate relative to the sum of all respiration rates.
We compared the three vineyards for differences in soil physical, chemical, and biological properties with a univariate linear model (ANOVA, SPSS Statistics, v23.0) after log transformation when data did not meet the normality conditions. Differences in soil community and microbial physiological profile between vineyards were tested with non-parametric multivariate analyses of variance (PERMANOVA). When differences were significant, we calculated the contribution to dissimilarity of each trophic group or MicroResp substrate by means of similarity percentage analyses (SIMPER).
We used distance-based linear models (DistLMs) [60] to identify soil properties influencing the configuration of the soil community and of its microbial physiological profile. Soil properties included SOC, electrical conductivity, clay content, pH, P, Na K, Ca, Mg, and the decomposition constant Kr. To visualize the models in the multivariate space, we drew dbRDA plots using only the variables selected by the best model (PERMANOVA + for PRIMER package, v.7).
We used the V Index [61] to graphically explain the effect of regenerative and minimum impact management on soil properties relative to intensive management. We calculated the index as follows:
M R E G = 2 M REG M REG + M INT 1   and   M M I N = 2 M MIN M MIN + M INT 1
with MINT representing the value of a given soil property under intensive management, and MREG and MMIN representing its value under regenerative and minimum impact management, respectively.

3. Results

3.1. Physical and Chemical Soil Properties under Contrasting Management

We found significant differences between vineyards for all physical and chemical properties except for Mg content (Table 1).
The proportion of fine particles (silt and clay) was significantly lower under intensive than under any alternative management (r2 = 0.744, df = 2, F = 13.089, p = 0.02; REG > INT, p = 0.002; MIN > INT, p = 0.01). Soil bulk density was very high under intensive management and significantly higher than under the two alternative management types (r2 = 0.639; df = 2; F = 13.271; p < 0.0001; INT > REG, p = 0.033; INT > MIN, p < 0.0001). Soil aggregate stability was the lowest under regenerative management and the highest under minimum impact management, with the intensively managed vineyard showing intermediate values (r2 = 0.397, df = 2; F = 6.917, p = 0.005; MIN > REG, p = 0.004).
Electrical conductivity was lower under intensive than under alternative managements (r2 = 0.613, df = 2, F = 7.119, p = 0.014; REG > INT, p = 0.018). Soil pH was significantly higher under regenerative management than under intensive or minimum impact management (r2 = 0.757, df = 2, F = 14.043, p = 0.002; REG > INT, p = 0.004; REG > MIN, p = 0.004). The vineyards with regenerative and minimum impact management showed higher levels of soil N (r2 = 0.711, df = 2, F = 11.083, p = 0.004; REG > INT, p = 0.007; MIN > INT, p = 0.007), available p (r2 = 0.723, df = 2, F = 11.738, p = 0.003; ECO > INT, p = 0.002; MIN > INT, p = 0.043), and cations (for Ca: r2 = 0.599, df = 2, F = 6.711, p = 0.016; REG > INT, p = 0.02; for K: r2 = 0.922, df = 2, F = 53.217, p < 0.0001; REG > INT, p < 0.001; MIN > INT, p < 0.0001; for Na: r2 = 0.658, df = 2, F = 8.672, p = 0.008; REG > INT, p = 0.008; MIN > INT, p = 0.037) than the intensively managed vineyard. Total SOC content (r2 = 0.736, df = 2, F = 12.56, p = 0.002; REG > INT, p = 0.028; MIN > INT, p = 0.002) and the proportion of labile organic carbon relative to total SOC (r2 = 0.845, df = 2, F = 22.554, p < 0.0001; REG > INT, p = 0.001; MIN > INT, p < 0.0001) were significantly lower under intensive management than under any of the alternative management regimes.

3.2. Abundance of Soil Groups under Diverse Management Strategies

We did not find differences between vineyards in the C abundance of fungi and bacteria or in the fungal-to-bacterial ratio (Table 1), but total C microbial abundance was significantly higher under minimum impact management than under intensive management (r2 = 0.192, df = 2, F = 5.113, p = 0.01; REG > INT, p = 0.008; MIN > INT, p = 0.008), with intermediate values in the regenerative vineyard. Contrastingly, vineyards significantly differed in the C abundance of all soil invertebrates, except in the cases of the order Poduromorpha (collembolans) and omnivorous nematodes.
The C abundance of flagellates (r2 = 0.488, df = 2, F = 21.454, p < 0.0001; REG > INT, p < 0.0001; REG > MIN, p < 0.0001), amoeba (r2 = 0.225, df = 2, F = 6.338, p = 0.004; REG > INT, p < 0.004; REG > MIN, p < 0.004), total protists (r2 = 0.575, df = 2, F = 30.419, p < 0.0001; REG > INT, p < 0.0001; REG > MIN, p < 0.0001), total collembolans (r2 = 0.470, df = 2, F = 16.399, p < 0.0001; REG > INT, p < 0.0001; REG > MIN, p = 0.001), Entomobryomorpha (collembolans) (r2 = 0.631, df = 2, F = 18.785, p < 0.0001; REG > INT, p < 0.0001; REG > MIN, p = 0.003), predatory mites (r2 = 0.503, df = 2, F = 20.221, p < 0.0001; REG > INT, p < 0.0001; REG > MIN, p < 0.0001), fungivorous oribatid mites (r2 = 0.691, df = 2, F = 42.479, p < 0.0001; REG > INT, p < 0.0001; REG > MIN, p < 0.0001), and total arthropods (r2 = 0.539, df = 2, F = 25.757, p < 0.0001; REG > INT, p < 0.0001; REG > MIN, p < 0.0001) was significantly higher in the regenerative vineyard than in the two other vineyards.
The C abundance of the bacteriophagous (r2 = 0.141, df = 2, F = 3.570, p = 0.037; REG > INT, p = 0.053), plant-associated nematodes (r2 = 0.193, df = 2, F = 4.905, p = 0.012; MIN > INT, p = 0.010), and total nematodes (r2 = 0.185, df = 2, F = 5.008, p = 0.011; REG > INT, p = 0.028; MIN > INT, p = 0.023) was similar in the regenerative and minimum impact vineyards, and significantly higher in both of them than in the intensively managed vineyard. The C abundance of the fungivorous nematodes was significantly higher in the vineyard under minimum impact management than in the intensive and regenerative vineyards (r2 = 0.224, df = 2, F = 6.21, p = 0.004; MIN > INT, p = 0.003). All groups were significantly less abundant under intensive management than under any alternative type of management (Table 1). PERMANOVA did not reveal significant differences between vineyards in the functional structure of the soil community.

3.3. Soil Microbial Properties under Contrasting Management

Total microbial substrate utilization (Table 1) was the lowest under intensive management (r2 = 0.480, df = 2, F = 9.709, p = 0.001; REG > INT, p = 0.002; MIN > INT, p = 0.005). Microbial functional diversity (H’) was the highest in the regenerative vineyard and the lowest in the intensive vineyard (r2 = 0.316, df = 2, F = 4.846, p = 0.019; REG > INT, p = 0.019), and evenness (E′) was higher under intensive than under regenerative management (r2 = 0.329, df = 2, F = 5.154, p = 0.015; INT > REG, p = 0.014).
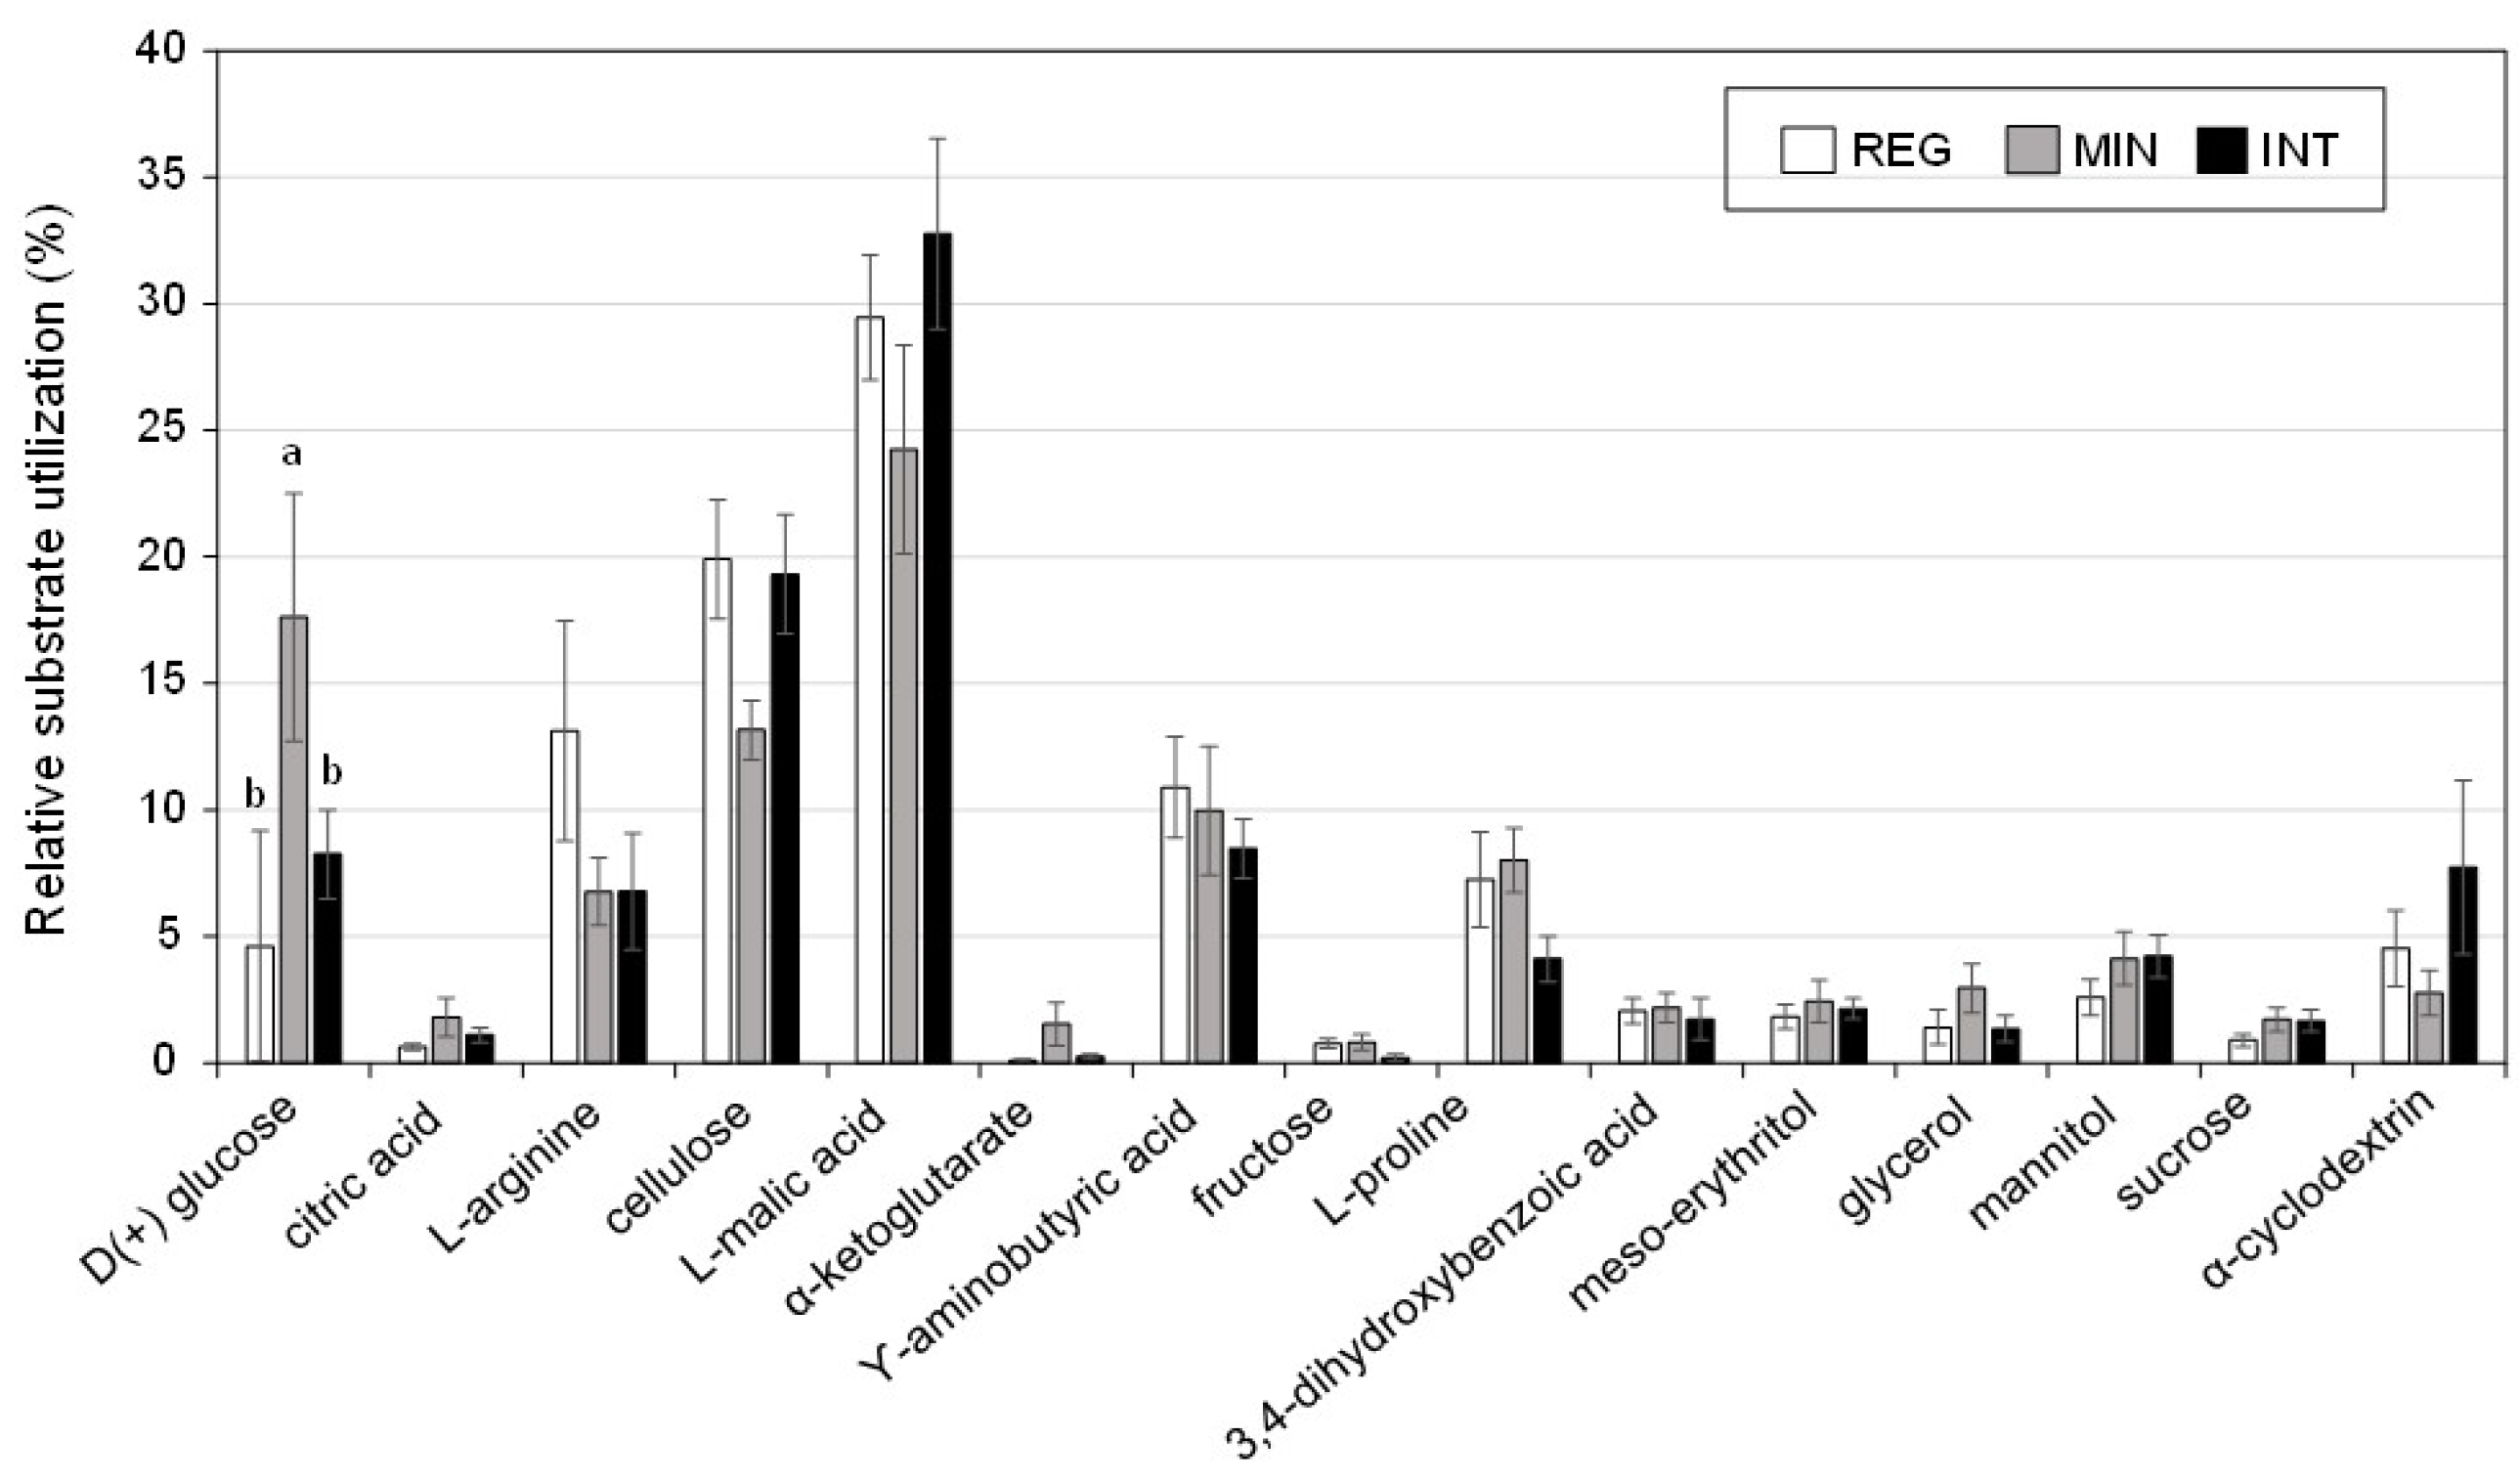
The most exploited carbon substrate in all plots was L-malic acid. In terms of the contribution of each substrate to total inducted microbial respiration, we only found significant differences between the three vineyards for D(+) glucose (Figure 3), which was relatively more exploited in the vineyard under minimum impact management than in the other two (r2 = 0.384, df = 2, F = 6.546, p = 0.006; MIN > REG, p = 0.007; INT > REG, p = 0.049). The regenerative and the intensive vineyards also differed significantly in the exploitation of citric acid, L-arginine, cellulose, L-malic acid, α-ketoglutarate, ϒ-aminobutyric acid, and fructose. The vineyards under regenerative and minimum management only differed in the exploitation of D(+) glucose and L-arginine.
PERMANOVA indicated significant differences between the microbial physiological profiles of the three vineyards (p = 0.0002). Specifically, the intensively managed vineyard differed from the regenerative (p = 0.002) and from the minimally managed vineyards (p = 0.0003). The SIMPER analysis showed that D(+) glucose (13.4%) and L-malic acid (12.04%) were the main contributors to the difference between the intensive and minimum impact vineyards (the two of them were more exploited in the minimum impact plot), and L-malic acid (15.2%), cellulose (11.1%), g-aminobutyric acid (11.1%), and L-proline (10.2%) were the main contributors to the difference between the intensive and the regenerative vineyards.
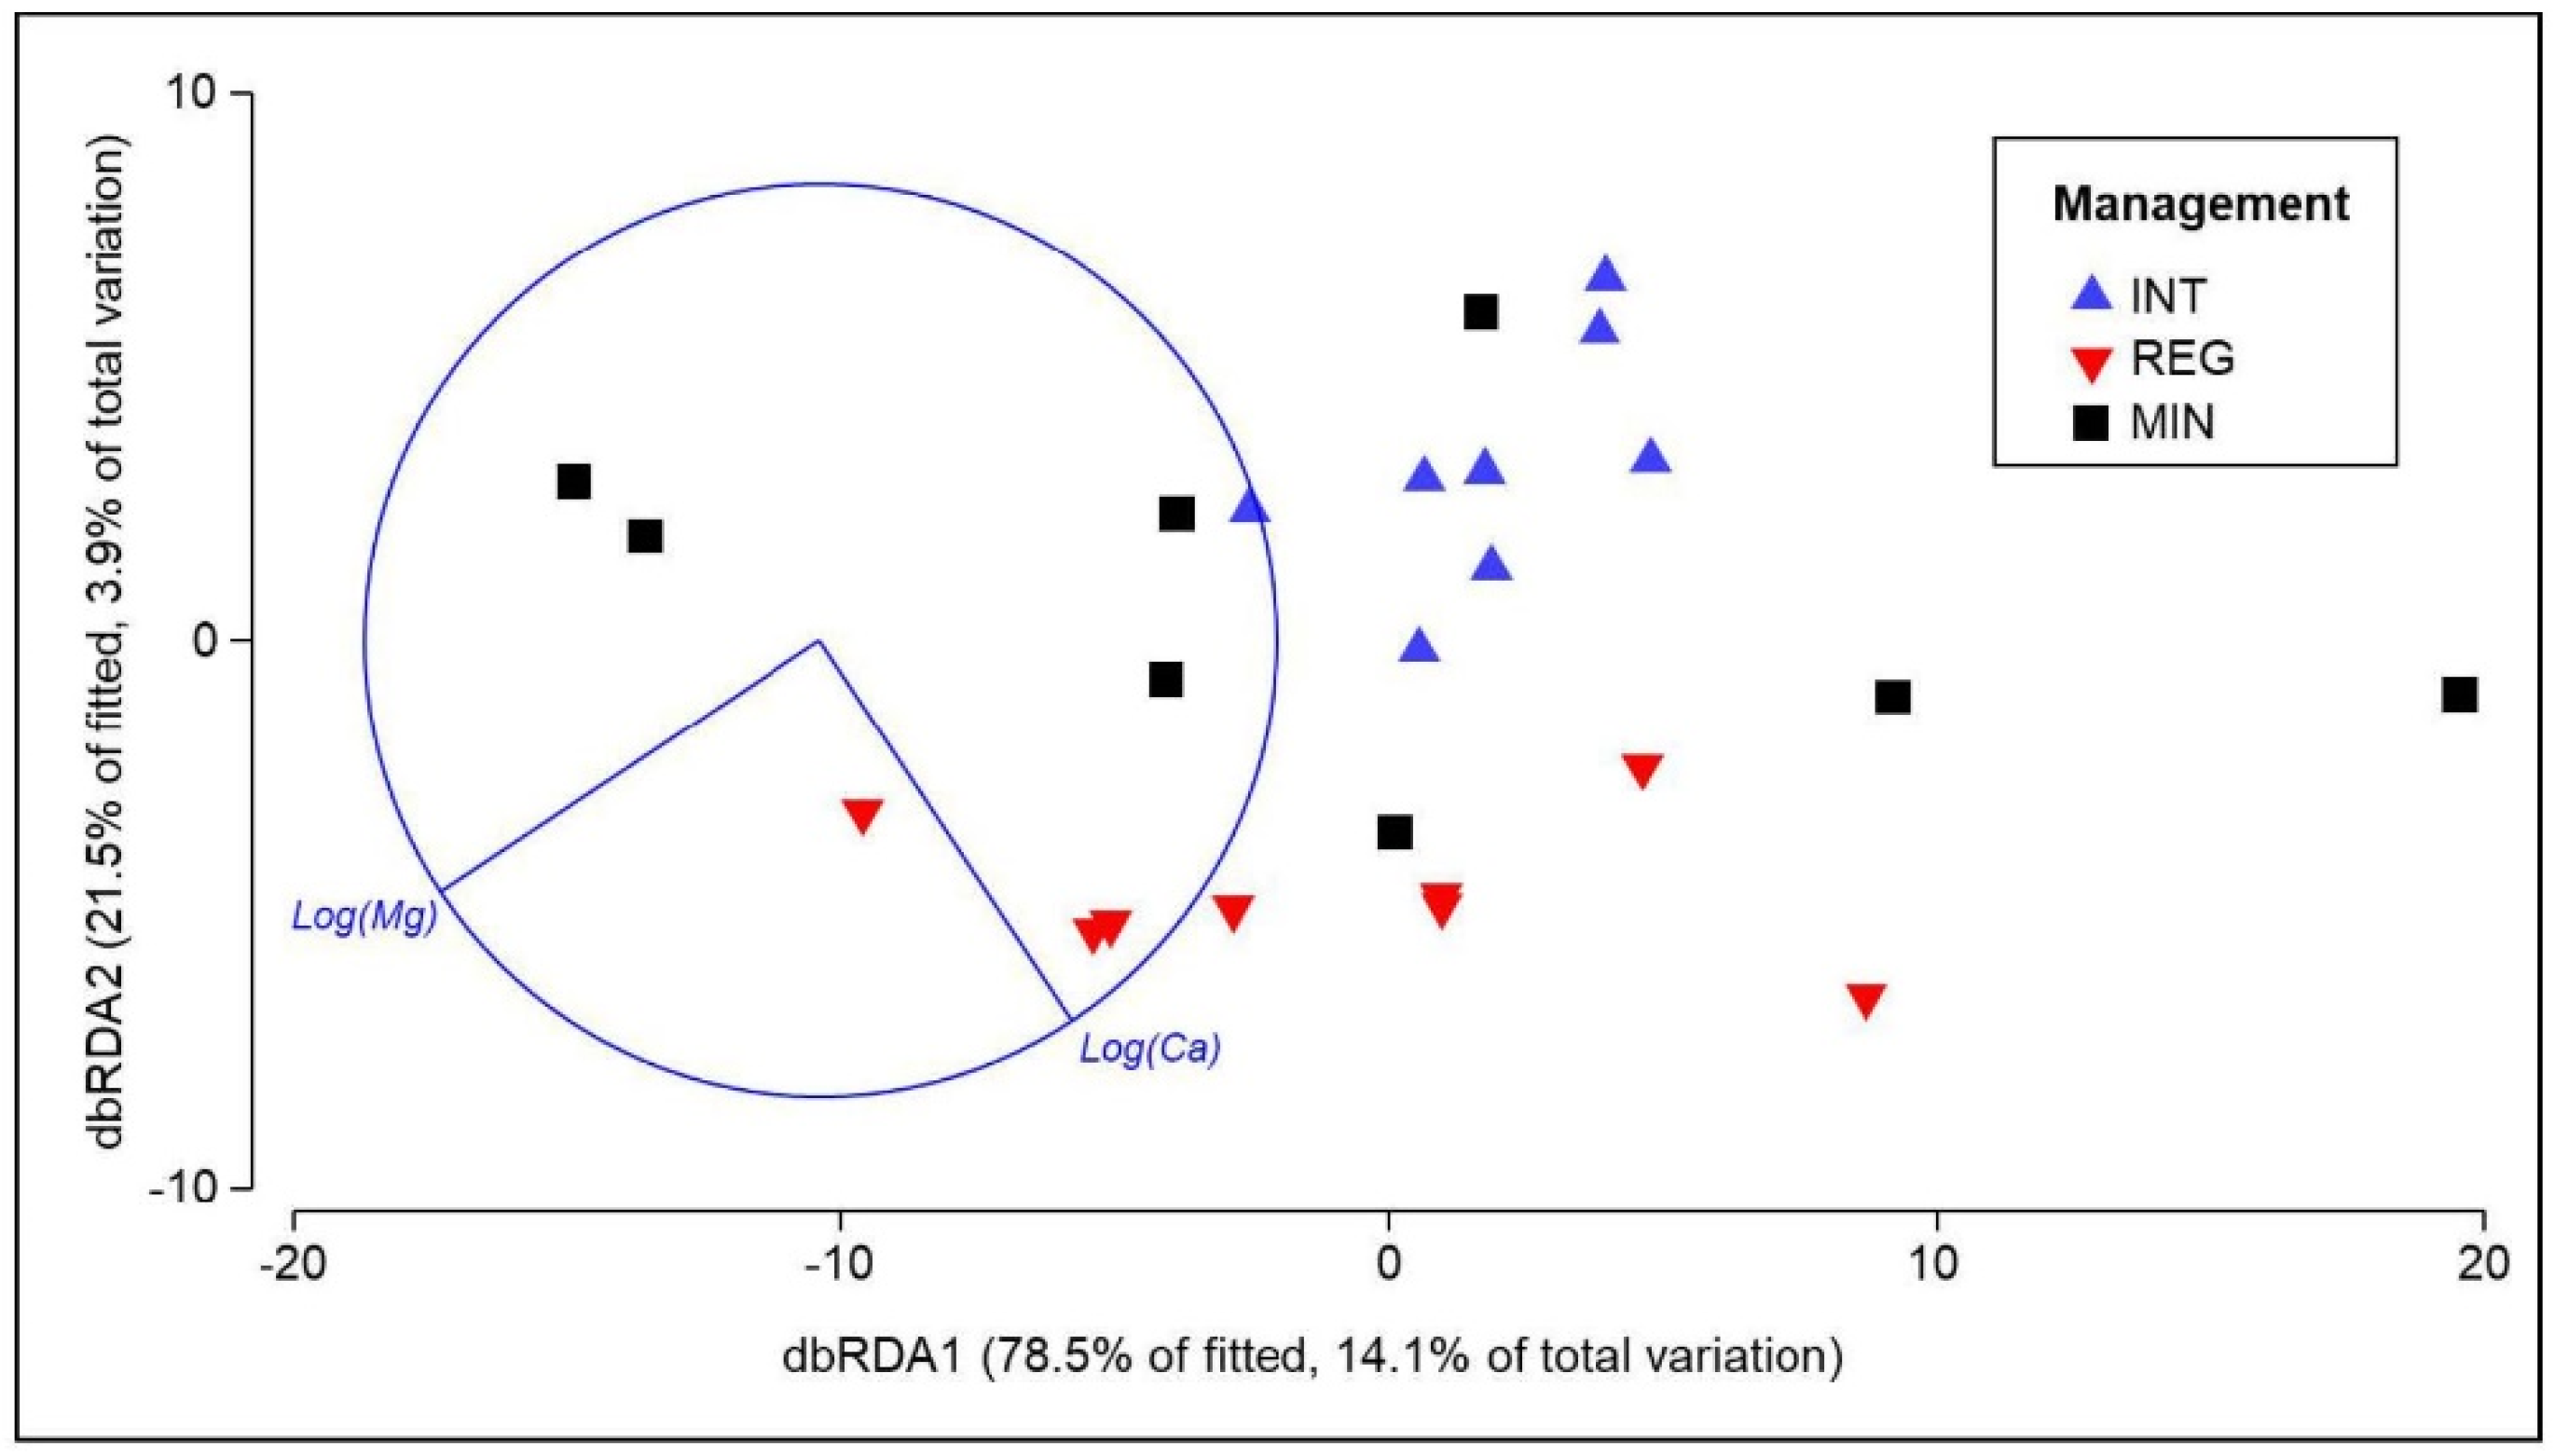
According to the DistLM analysis, when considered alone, none of the variables have a significant relationship with the multivariate data cloud defined by the exploitation of the MicroResp substrates. The soil microbial physiological profile is best explained by combining the concentration of calcium and the concentration of magnesium (Figure 4).

3.4. Response of Soil Properties to Agricultural Management

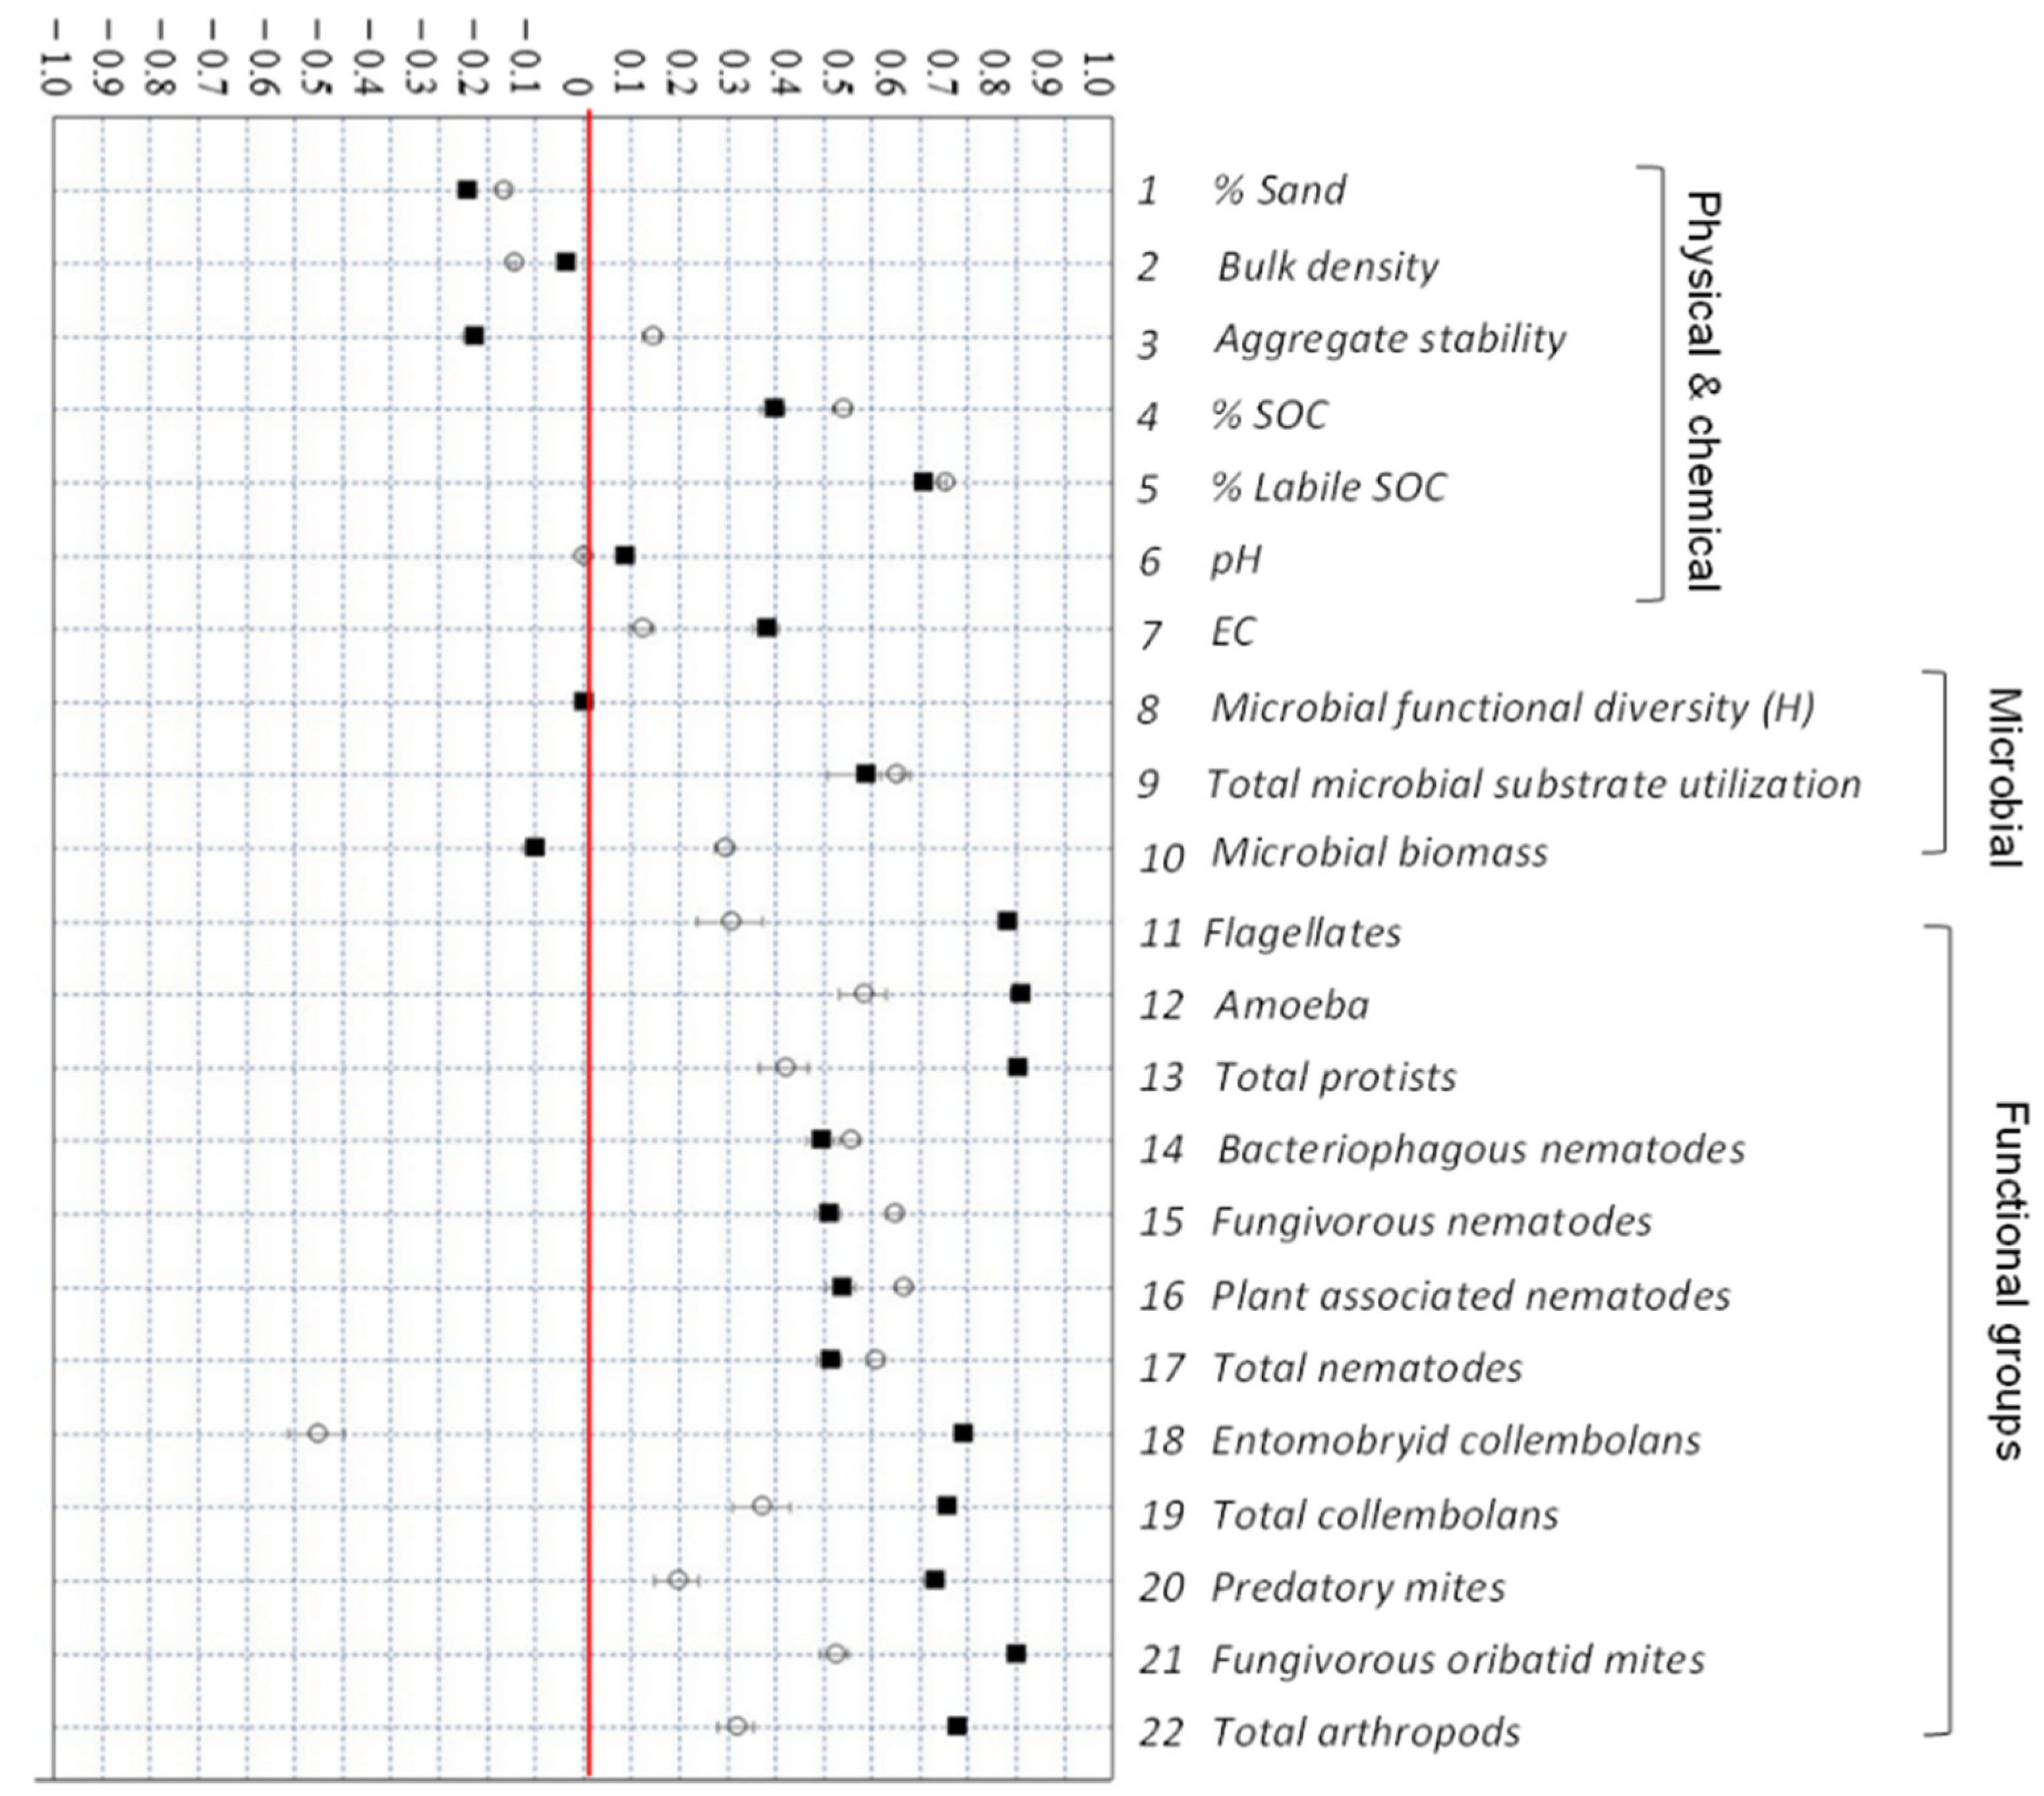
The V Index showed that the soil characteristics more responsive to our three types of management are the abundance of amoeba (VREG = 0.935, VMIN = 0.577), total protists (VREG = 0.905, VMIN = 0.414), oribatid mites (VREG = 0.898, VMIN = 0.532), and flagellates (VREG = 0.881, VMIN = 0.313), followed by the abundance of entomobryid collembola (VREG = 0.801, VMIN = −0.524), total arthropods (VREG = 0.776, VMIN = 0.331), total collembolans (VREG = 0.753, VMIN = 0.424), and predatory mites (VREG = 0.732, VMIN = 0.189), as well as the proportion of labile carbon relative to total soil organic carbon (VREG = 0.711, VMIN = 0.752) (Figure 5). The percent difference between pairs of treatments for the mean value of each indicator is shown in Table 2.
Therefore, the soil response to management was more apparent when using biological properties than when using physical and chemical characteristics.
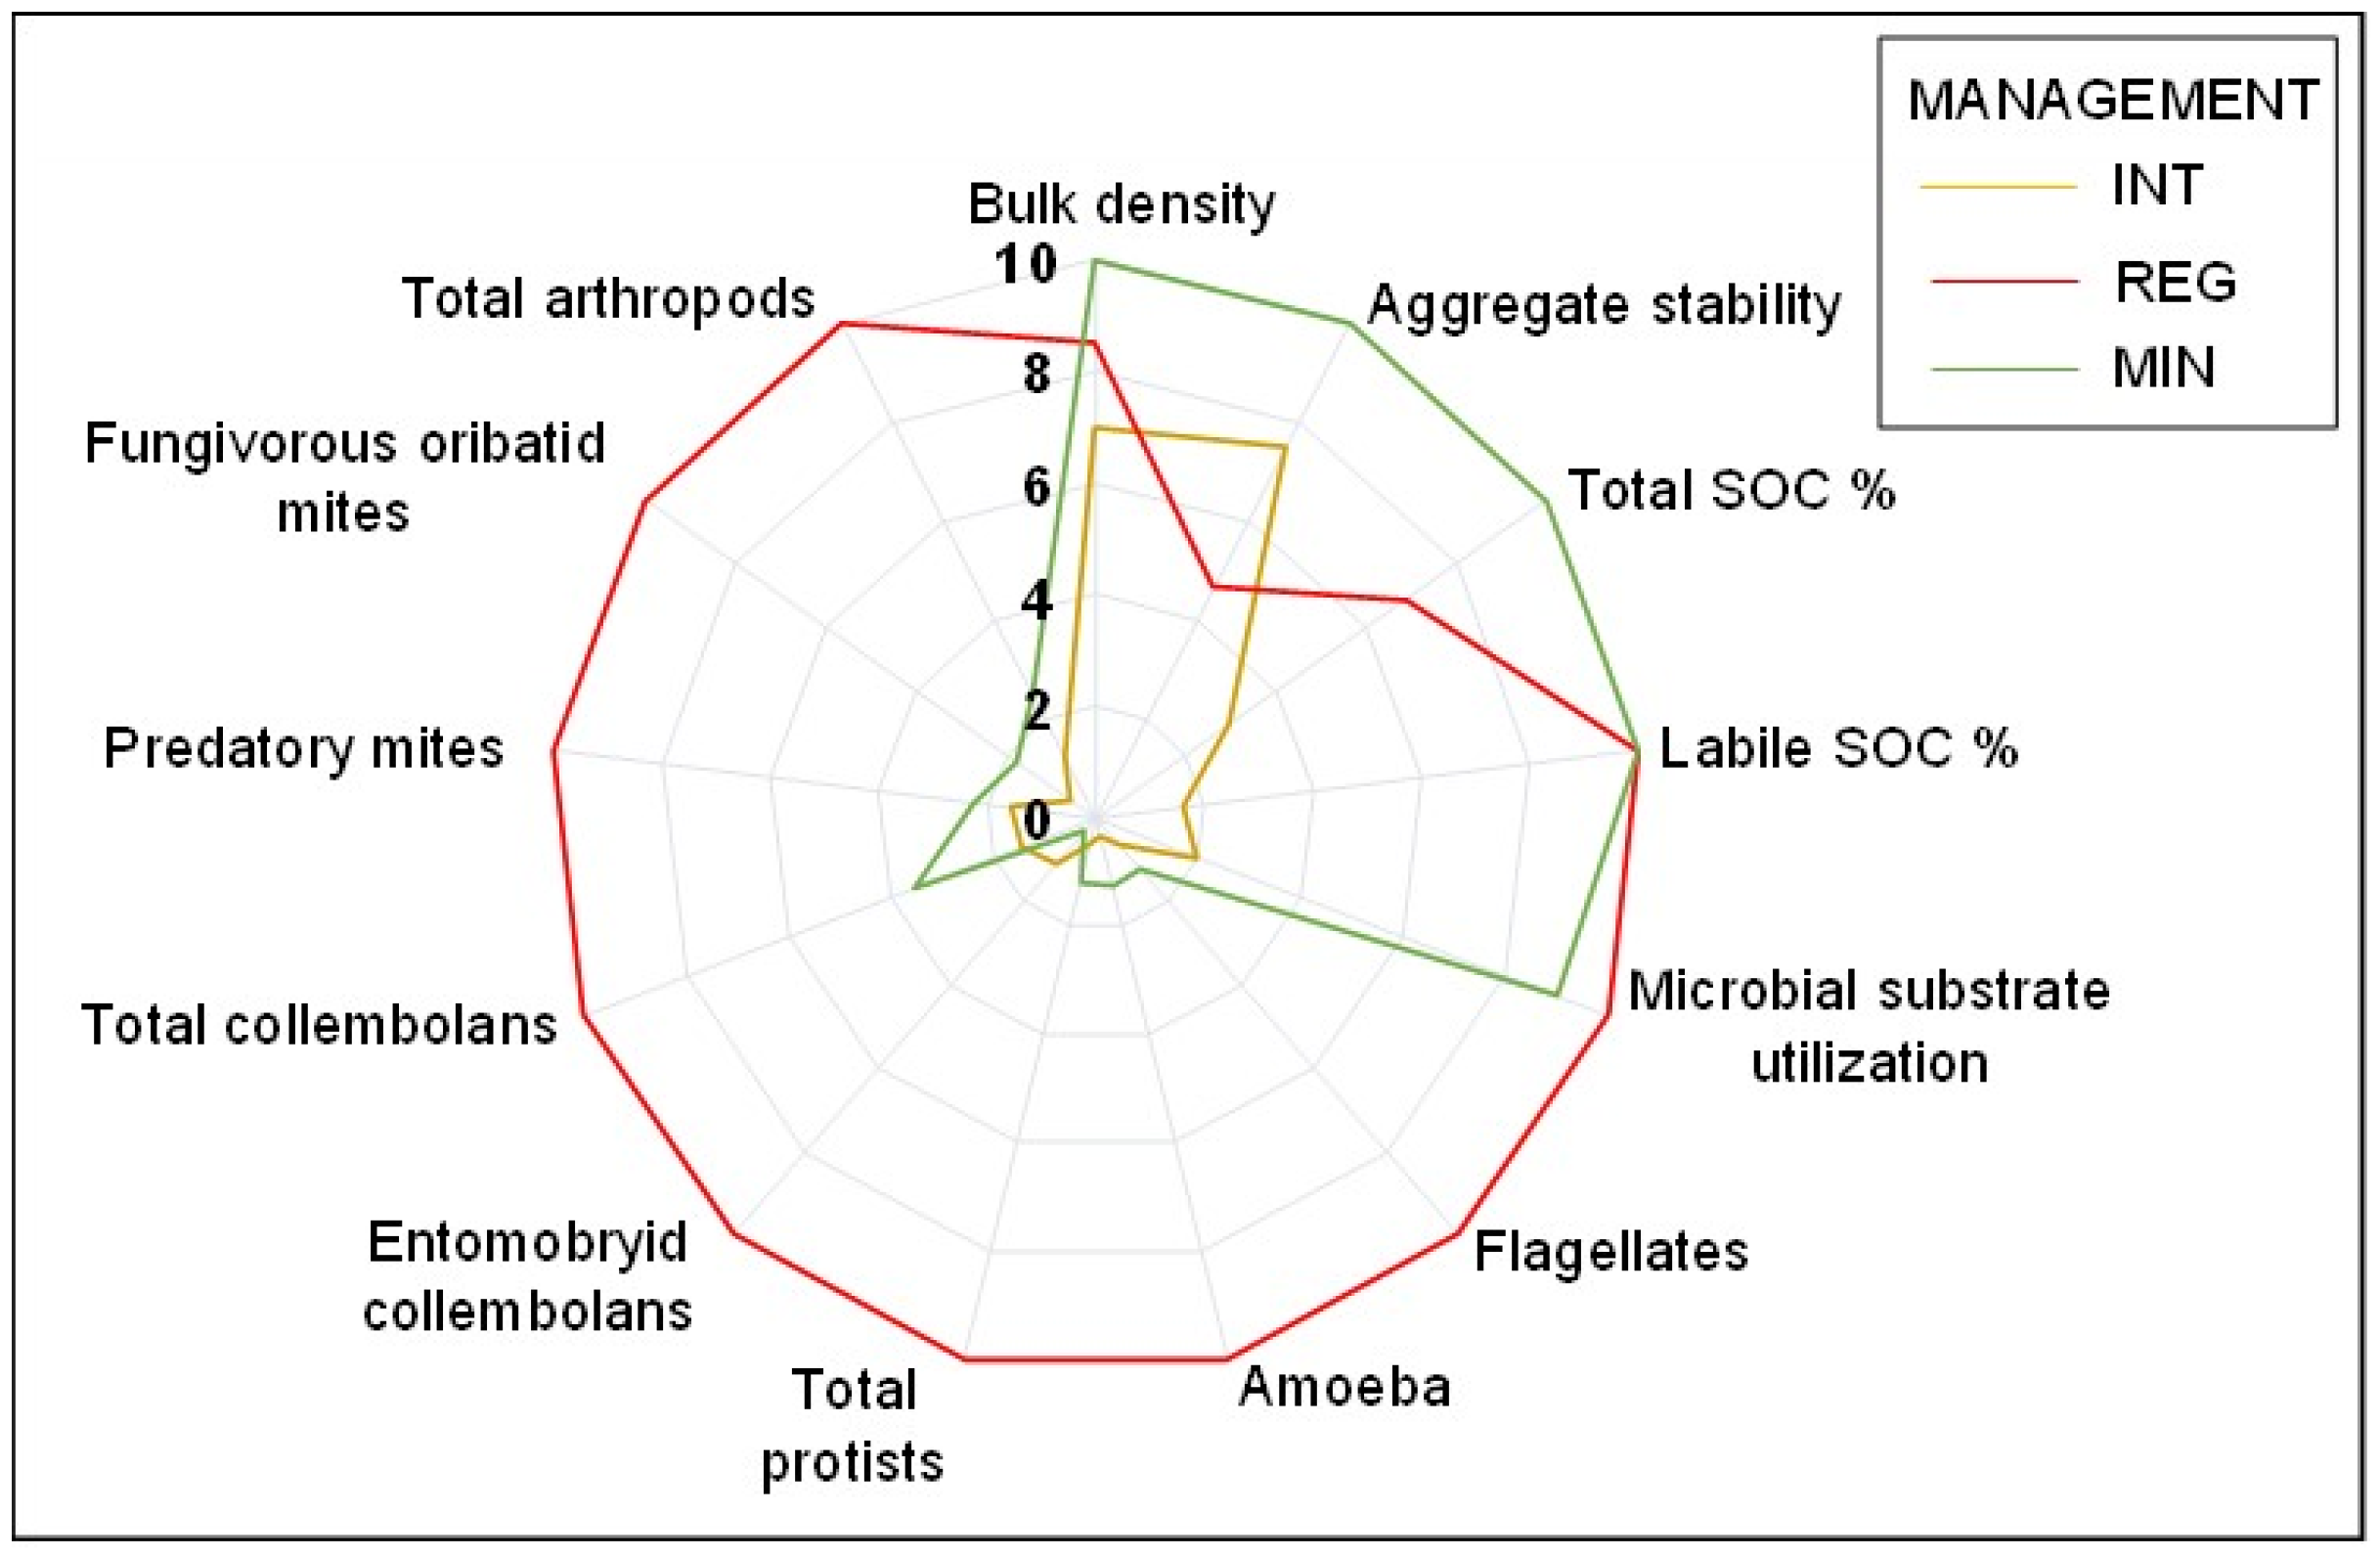
The regenerative vineyard got the best marks for all biological properties, while the minimum impact vineyard showed the best values for physical properties and soil organic carbon content. The soil of the intensive vineyard showed the lowest quality for all biological indicators, carbon content, and all physical properties, except soil aggregate stability (Figure 6).

4. Discussion

Among the studied soil physical and chemical properties, texture, bulk density, aggregate stability, pH, electric conductivity, cation content, and total and labile organic carbon content were responsive to changes in agricultural management.
Texture is often considered an inherent and immutable soil characteristic, but it can be altered by practices causing erosion, due to preferential removal of fine particles by runoff [62]. In agreement with previous works [63], we found the proportion of fine particles about twice as high in the soil of the regenerative and minimal impact vineyards than in the soil of the intensive vineyard. By protecting soil clay, which is fundamental in stabilizing soil organic matter, regenerative and minimum impact management would thus contribute to increase the capacity of soil to stock carbon [64].
With some exceptions [25], most studies suggest that cover crops combined with no-tillage lessen soil bulk density [65], with positive effects on soil water holding capacity, water dynamics, and root development. This effect has also been found in the present work, with bulk densities significantly lower in soils under regenerative and minimum impact management than in intensively managed soils. Soil decompaction in the absence of tillage can be achieved by fostering the development of a natural or introduced herbaceous cover with a dense root system and can be helped by injecting air below ground. The situation of our intensive vineyard, with bulk density above the degradation threshold for sandy loam soils (1.58 g cm−3) [66], is representative of the condition of many Mediterranean vineyards, and regenerative and minimum impact management appear as promising strategies to reverse soil physical deterioration in the region.
Cover crops are also believed to benefit aggregate stability in Mediterranean woody crops [67,68] by increasing carbon content and microbial and plant root activity [69]. In the present work, we expected to find the stability of soil aggregates improved under both management strategies including cover crops relative to intensive management. Surprisingly, we found the lowest aggregate stability in the regenerative vineyard, and we posit that this effect is due to the higher soil pH in this field, since soil aggregate stability and pH correlate inversely [70]. The relatively high pH found in the regenerative vineyard as compared to the two other studied fields can be explained by the soil cation balance, that has been managed in the regenerative vineyard to approach a 65%:15%:4%:1–3% Ca:Mg:K:Na ratio, following the “Base Cation Saturation Ratio” (or “soil balancing”), which is assumed to provide the best soil structure and oxygenation, while guaranteeing nutrient availability to plants. This concept is widely accepted by organic farmers despite being generally disregarded by the scientific community [71].
As is often the case in Mediterranean woody crops, the soil of our intensive vineyard was carbon depleted, while the SOC content in the regenerative and minimum management vineyards was about two and three times higher, respectively. Assuming a constant rate of carbon sequestration in soil over time, the efficiency of the regenerative strategy in increasing soil C stocks has been particularly remarkable compared to the minimum impact strategy, since the abandonment of the intensive management occurred 4 years before our sampling campaign in the regenerative vineyard and 12 years before in the minimum impact vineyard. In both cases, this high effectiveness reinforces the idea that integrated management strategies are more efficient in restoring agricultural soils than isolated practices such as tillage suppression, which has been found to have zero effects during the two first years of implementation [72]. However, our results must be interpreted with caution since, due to economic constraints, we only sampled the top 15 cm of the soil profile, instead of the whole soil layer occupied by roots, as would be advisable, since the estimates of soil carbon stocks are deeply influenced by sampling depth [73].
An important proportion of the soil biological properties considered in this work were sensitive to agricultural management. With the aim to propose soil analyses that are affordable for farmers, we addressed the effects of agricultural management on soil microbial functions by means of two low-cost and user-friendly methods: the Tea Bag test and the MicroResp test. The Tea Bag test [59] measures the ability of soil to decompose plant debris and was promising a priori for its use in soil surveys involving farmers. Unfortunately, as anticipated in previous works [74,75,76], this test was not sensitive to the management types considered in this study.
The MicroResp test provides information about the ability of soil microbes to exploit carbon sources of varied chemistry and recalcitrance. As expected, our data confirmed that the regenerative and minimum impact strategies contribute to restoring the catabolic capacity of the microbial community in soils previously managed intensively. Surprisingly [77], we found the highest catabolic diversity and evenness in the soil of the intensive vineyard. This might be explained by the fact that the microorganisms living in oligotrophic soil environments are adapted to exploit a wider spectrum of carbon sources than those living in more fertile soils, as those promoted by regenerative and minimum impact management [78].
In line with previous works, our results indicate that agricultural management affects the dietary preferences of soil microbes [79]. In particular, amino acids, sugars, and L-malic acid are relatively more exploited in our regenerative and minimum impact vineyards than in the intensive vineyard, which can be attributed to the presence of microbes adapted to utilize the labile carbon provided by the roots of the cover crops [80]. Regenerative and minimum impact management also contributed to the recovery of soil microbial biomass, as was expected based on previous data [81]. However, contrary to what some authors sustain [82], we could not find any effect of management on the soil fungi-to-bacteria ratio. The insensitivity of this indicator might be due to conflicting effects of diverse practices combined under our integrated agricultural strategies on the soil microbiota. On the one side, tillage cessation might have favored fungi by reducing physical disturbance to soil hyphal networks while, on the other hand, cover crops might have fostered soil bacteria [83,84].
Our results add to the growing evidence that regenerative viticulture and low-impact management improve soil biodiversity in vineyards that have been previously managed intensively, and that this improvement affects all elements of the soil food web [85]. Overall, and as we expected based on the available literature, we found that both the regenerative and the minimum impact options have positive effects on soil invertebrates relative to the intensive option, although this effect is dramatically higher for the regenerative management option. Organic management and cover crops are known to favor soil protists and nematodes at different trophic levels of the soil trophic web [86]. The great abundance of nematodes in the regenerative and minimum impact vineyards can be explained by the rich offering of bacterial and plant root resources in their soils.
There is little information about the response of soil microarthropods to agricultural management, and the available data are often conflicting. The abundance and species richness of soil collembolans and mites are known to be much higher in organic than in intensive vineyards [87,88]. Negative effects of tillage, as a component of the intensive management, on collembolans and oribatid and mesostigmatic mites have been frequently reported [89,90]. Consistent with these authors, we found the regenerative management especially favorable to microarthropods and, in particular, to predatory and fungivorous mites and entomobryid collembola. Since high abundances of these groups are indicative of carbon-rich and productive soils [91,92], we were expecting to find the highest abundance of microarthropods associated with the minimal impact management, but instead we found it in the regenerative vineyard, which is less rich in soil carbon. This fact can be explained by a favorable stoichiometry in the soil of the regenerative vineyard, with the lowest C:Ca, C:N, and C:P ratios. Calcium is a crucial element in the construction and hardening of the exoskeleton of soil arthropods. In the same sense, high nitrogen content has been found to favor soil predators, since high C:N ratios in the body tissues of their preys can be limiting for assimilation. Finally, the C:P ratio is a key regulator of the density of the soil food web at all trophic levels [93]. In this sense, it is worth mentioning that, in the studied vineyards, the soil microbial catabolism is greatly influenced by cations and particularly by Ca and Mg concentrations. From these results, it appears that soil stoichiometry and soil cations are key drivers of soil biodiversity in agricultural soils.
Protists and nematodes are important regulators of the abundance of soil bacteria and key actors in the availability of nitrogen to plants in agricultural soils [94]. Directly (by bioturbation, comminution of plant residues, and production of feces) or indirectly (as top-down controllers of soil microbes), soil microarthropods regulate the soil carbon cycle [95]. Therefore, any management strategy promoting these elements of the soil food web should be considered valuable in restoring the environmental services provided by degraded soils in winegrowing regions.
From the above points, it can be seen that, to evaluate the effect of agricultural management on soil environmental quality, biological indicators should be used together with soil physical and chemical properties. To be useful at the farm scale, soil indicators must be easy to measure, understandable and meaningful, and cost-effective in terms of monetary costs and workload [96]. Bioindicators have often been considered inappropriate for this purpose due to high costs in terms of expertise, equipment, and workload. When describing the composition and structure of the soil microbial community, molecular analyses are still too expensive [97] and, in practice, total soil microbial biomass is the most frequently used bioindicator in monitoring programs [98]. Earthworms and collembolans are the most widely studied elements of the soil biota, together with nematodes [99,100] and microarthropods [101]. With all this in mind and based on our results, we propose soil protists, collembolans, and mites as highly appropriate indicators of the effects of agricultural management on soil biodiversity in vineyards. Extracting and counting soil microarthropods and protists demand basic laboratory equipment, and technicians may be easily trained to classify soil microfauna into functional groups. In very degraded soils, microarthropods are often very scarce and, in these cases, the use of the more pervasive protists may be more appropriate. To approach soil microbial functionality, community-level microbial physiological profiling is advisable as a low-cost tool. SOC content is a key indicator of the fertility and environmental quality of agricultural soils, and soil labile carbon is a small but very dynamic fraction of total SOC. Its value, in combination with total SOC and aggregate stability can provide important clues about the ability of soil to stabilize organic carbon under diverse management types.

5. Conclusions

Regenerative and minimum impact management of Mediterranean vineyards are promising strategies to restore the environmental quality of degraded agricultural soils. In this work, we found that vineyards managed under regenerative and minimum impact strategies for 5 and 12 years, respectively, after a long history of intensive farming, contain significantly more organic carbon and support significantly more soil invertebrates than a comparable vineyard that is managed intensively. Regenerative viticulture particularly benefits functional groups of the soil food web that are key players in regulating soil microbial populations and in stabilizing organic carbon in the soil.
These strategies should be soundly evaluated for their possible incorporation into European environmental policies. Moreover, by contributing to increase soil carbon stocks and to foster soil biological diversity, regenerative and minimum impact viticulture will help to attain the UN development goals number 13 (Climate Action) and 15 (Protecting Life on Land) while contributing to achieve food security (Zero Hunger objective). Biological indicators must be included, together with basic physical and chemical indicators, in any soil monitoring program intended to evaluate effects of management on agricultural sustainability

Author Contributions

Conceptualization, P.A. and F.F.; methodology, P.A.; soil analyses, E.D.-M., S.M., A.S.-S.; writing, P.A.; review and editing, E.D.-M.; All authors have read and agreed to the published version of the manuscript.

Funding

This research received no external funding.

Acknowledgments

We warmly thank the owners of the three studied vineyards for their availability and generous contribution to this work.

Conflicts of Interest

The authors declare no conflict of interest.

Appendix A

Table A1. Individual body weight of the trophic groups found in the soil of the three vineyards.
Individual Body Weight (g, d.w.)
Chilopoda (Geophilomorpha)2.59 × 10⁻³
Pseudoescorpionida0.00 × 10−5
Predaceous diplurans3.40 × 10−5
Predaceous mites7.70 × 10−6
Nematophagous mites1.00 × 10−6
Predaceous nematodes1.04 × 10−6
Omnivorous nematodes9.00 × 10−7
Phytophagous nematodes6.00 × 10−8
Bacteriophagous nematodes7.40 × 10−8
Fungivorous nematodes1.10 × 10−7
Ciliates1.00 × 10−9
Amoeba1.20 × 10−9
Flagellates1.90 × 10−11
Fungivorous Cryptostigmata2.70 × 10−6
Fungivorous Prostigmata1.00 × 10−6
Symphyla6.60 × 10−6
Collembolans2.70 × 10−6
Bacteria6.65 × 10−13
Fungi2.30 × 10−6

References

  1. Paustian, K.; Lehmann, J.; Ogle, S.; Reay, D.; Robertson, G.P.; Smith, P. Climate-smart soils. Nature 2016, 532, 49–57. [Google Scholar] [CrossRef] [PubMed] [Green Version]
  2. Wagg, C.; Bender, S.F.; Widmer, F.; Van Der Heijden, M.G.A. Soil biodiversity and soil community composition determine ecosystem multifunctionality. Proc. Natl. Acad. Sci. USA 2014, 111, 5266–5270. [Google Scholar] [CrossRef] [Green Version]
  3. Baritz, R.; Amelung, W.; Antoni, V.; Boardman, J.; Horn, R.; Prokop, G.; Römbke, J.; Romkens, P.; Steinhoff-Knopp, B.; Swartjes, F.; et al. Soil Monitoring in Europe. Indicators and Thresholds for Soil Quality Assessments; European Environmental Agency and ETC/ULS, Publications Office of the European Union: Luxembourg, 2021. [Google Scholar]
  4. Virto, I.; Imaz, M.J.; Fernández-Ugalde, O.; Urrutia, I.; Enrique, A.; Bescansa, P. Soil quality evaluation following the implementation of permanent cover crops in semi-arid vineyards. Organic matter, physical and biological soil properties. Span. J. Agric. Res. 2012, 4, 1121–1132. [Google Scholar] [CrossRef] [Green Version]
  5. Tsiafouli, M.A.; Thébault, E.; Sgardelis, S.P.; de Ruiter, P.C.; van der Putten, W.H.; Birkhofer, K.; Hemerik, L.; de Vries, F.T.; Bardgett, R.D.; Brady, M.V.; et al. Intensive agriculture reduces soil biodiversity across Europe. Glob. Chang. Biol. 2015, 21, 973–985. [Google Scholar] [CrossRef] [PubMed] [Green Version]
  6. Li, K.; Zhang, H.; Li, X.; Wang, C.; Zhang, J.; Jiang, R.; Feng, G.; Liu, X.; Zuo, Y.; Yuan, H.; et al. Field management practices drive ecosystem multifunctionality in a smallholder-dominated agricultural system. Agric. Ecosyst. Environ. 2021, 313, 107389. [Google Scholar] [CrossRef]
  7. de Vries, F.T.; Liiri, M.E.; Bjørnlund, L.; Bowker, M.A.; Christensen, S.; Setälä, H.M.; Bardgett, R.D. Land use alters the resistance and resilience of soil food webs to drought. Nat. Clim. Chang. 2012, 2, 276–280. [Google Scholar] [CrossRef]
  8. Postma-Blaauw, M.B.; De Goede, R.G.M.; Bloem, J.; Faber, J.H.; Brussaard, L. Soil biota community structure and abundance under agricultural intensification and extensification. Ecology 2010, 91, 460–473. [Google Scholar] [CrossRef]
  9. Harkes, P.; Suleiman, A.K.A.; van den Elsen, S.J.J.; de Haan, J.J.; Holterman, M.; Kuramae, E.E.; Helder, J. Conventional and organic soil management as divergent drivers of resident and active fractions of major soil food web constituents. Sci. Rep. 2019, 9, 13521. [Google Scholar] [CrossRef] [Green Version]
  10. Prosdocimi, M.; Cerdà, A.; Tarolli, P. Soil water erosion on Mediterranean vineyards: A review. Catena 2016, 141, 1–21. [Google Scholar] [CrossRef]
  11. García-Ruiz, J.M. The effects of land uses on soil erosion in Spain: A review. Catena 2010, 81, 1–11. [Google Scholar] [CrossRef]
  12. Hütsch, B.W. Methane oxidation in non-flooded soils as affected by crop production. Eur. J. Agron. 2001, 14, 237–260. [Google Scholar] [CrossRef]
  13. Novara, A.; Favara, V.; Novara, A.; Francesca, N.; Santangelo, T.; Columba, P.; Chironi, S.; Ingrassia, M.; Gristina, L. Soil carbon budget account for the sustainability improvement of a Mediterranean vineyard area. Agronomy 2020, 10, 336. [Google Scholar] [CrossRef] [Green Version]
  14. Payen, F.T.; Sykes, A.; Aitkenhead, M.; Alexander, P.; Moran, D.; MacLeod, M. Soil organic carbon sequestration rates in vineyard agroecosystems under different soil management practices: A meta-analysis. J. Clean. Prod. 2021, 290, 125736. [Google Scholar] [CrossRef]
  15. FAO; ITPS. Recarbonizing Global Soils: A Technical Manual of Recommended Management Practices. Vol. 3. Cropland, Grassland, Integrated Systems and Farming Approaches—Practices Overview; FAO: Rome, Italy, 2021. [Google Scholar] [CrossRef]
  16. Blanco-Canqui, H.; Shaver, T.M.; Lindquist, J.L.; Shapiro, C.A.; Elmore, R.W.; Francis, C.A.; Hergert, G.W. Cover crops and ecosystem services: Insights from studies in temperate soils. Agron. J. 2015, 107, 2449–2474. [Google Scholar] [CrossRef] [Green Version]
  17. Lal, R. Soil carbon sequestration impacts on global climate change and food security. Science 2004, 304, 1623–1627. [Google Scholar] [CrossRef] [Green Version]
  18. Six, J.; Paustian, K. Aggregate-associated soil organic matter as an ecosystem property and a measurement tool. Soil Biol. Biochem. 2014, 68, A4–A9. [Google Scholar] [CrossRef]
  19. Six, J.; Elliott, E.T.; Paustian, K. Soil macroaggregate turnover and microaggregate formation: A mechanism for C sequestration under no-tillage agriculture. Soil Biol. Biochem. 2000, 32, 2099–2103. [Google Scholar] [CrossRef]
  20. Powlson, D.S.; Stirling, C.M.; Jat, M.L.; Gerard, B.G.; Palm, C.A.; Sanchez, P.A.; Cassman, K.G. Limited potential of no-till agriculture for climate change mitigation. Nat. Clim. Chang. 2014, 4, 678–683. [Google Scholar] [CrossRef]
  21. Luo, Z.; Wang, E.; Sun, O.J. Can no-tillage stimulate carbon sequestration in agricultural soils? A meta-analysis of paired experiments. Agric. Ecosyst. Environ. 2010, 139, 224–231. [Google Scholar] [CrossRef]
  22. Palm, C.; Blanco-Canqui, H.; DeClerck, F.; Gatere, L.; Grace, P. Conservation agriculture and ecosystem services: An overview. Agric. Ecosyst. Environ. 2014, 187, 87–105. [Google Scholar] [CrossRef] [Green Version]
  23. Poulton, P.; Johnston, J.; Macdonald, A.; White, R.; Powlson, D. Major limitations to achieving “4 per 1000” increases in soil organic carbon stock in temperate regions: Evidence from long-term experiments at Rothamsted Research, United Kingdom. Glob. Chang. Biol. 2018, 24, 2563–2584. [Google Scholar] [CrossRef] [PubMed] [Green Version]
  24. Morlat, R.; Jacquet, A. Grapevine root system and soil characteristics in a vineyard maintained long-term with or without interrow sward. Am. J. Enol. Vitic. 2003, 54, 1–7. [Google Scholar]
  25. Guzmán, G.; Cabezas, J.M.; Sánchez-Cuesta, R.; Lora, A.; Bauer, T.; Strauss, P.; Winter, S.; Zallere, J.G.; Gómeza, J.A. A field evaluation of the impact of temporary cover crops on soil properties and vegetation communities in southern Spain vineyards. Agric. Ecosyst. Environ. 2019, 272, 135–145. [Google Scholar] [CrossRef]
  26. Messiga, A.J.; Sharifi, M.; Hammermeister, A.; Gallant, K.; Fuller, K.; Tango, M. Soil quality response to cover crops and amendments in a vineyard in Nova Scotia, Canada. Sci. Hortic. 2015, 188, 6–14. [Google Scholar] [CrossRef]
  27. Vicente-Vicente, J.L.; García-Ruiz, R.; Francaviglia, R.; Aguilera, E.; Smith, P. Soil carbon sequestration rates under Mediterranean woody crops using recommended management practices: A meta-analysis. Agric. Ecosyst. Environ. 2016, 235, 204–214. [Google Scholar] [CrossRef] [Green Version]
  28. Morugán-Coronado, A.; Linares, C.; Gómez-López, M.D.; Faz, Á.; Zornoza, R. The impact of intercropping, tillage and fertilizer type on soil and crop yield in fruit orchards under Mediterranean conditions: A meta-analysis of field studies. Agric. Syst. 2020, 178, 102736. [Google Scholar] [CrossRef]
  29. Aguilera, E.; Lassaletta, L.; Gattinger, A.; Gimeno, B.S. Managing soil carbon for climate change mitigation and adaptation in Mediterranean cropping systems: A meta-analysis. Agric. Ecosyst. Environ. 2013, 168, 25–36. [Google Scholar] [CrossRef]
  30. Soto, R.L.; Martínez-Mena, M.; Cuéllar Padilla, M.; de Vente, J. Restoring soil quality of woody agroecosystems in Mediterranean drylands through regenerative agriculture. Agric. Ecosyst. Environ. 2021, 306, 107191. [Google Scholar] [CrossRef]
  31. Costantini, E.; Agnelli, A.E.; Fabiani, A.; Gagnarli, E.; Mocali, S.; Priori, S.; Simoni, S.; Valboa, G. Short-term recovery of soil physical, chemical, micro- and mesobiological functions in a new vineyard under organic farming. Soil 2015, 1, 443–457. [Google Scholar] [CrossRef] [Green Version]
  32. Nielsen, U.N.; Wall, D.H.; Six, J. Soil Biodiversity and the Environment. Annu. Rev. Environ. Resour. 2015, 40, 63–90. [Google Scholar] [CrossRef]
  33. El Titi, A. Effects of tillage on invertebrates in soil ecosystems. In Soil Tillage in Agroecosystems; El Titi, A., Ed.; CRC Press: Boca Raton, FL, USA, 2003; pp. 261–296. [Google Scholar]
  34. Roger-Estrade, J.; Anger, C.; Bertrand, M.; Richard, G. Tillage and soil ecology: Partners for sustainable agriculture. Soil Tillage Res. 2010, 111, 33–40. [Google Scholar] [CrossRef]
  35. Hartmann, M.; Frey, B.; Mayer, J.; Mäder, P.; Widmer, F. Distinct soil microbial diversity under long-term organic and conventional farming. ISME J. 2015, 9, 1177–1194. [Google Scholar] [CrossRef] [PubMed] [Green Version]
  36. Bardgett, R.D.; Caruso, T. Soil microbial community responses to climate extremes: Resistance, resilience and transitions to alternative states. Philos. Trans. R. Soc. B Biol. Sci. 2020, 375, 20190112. [Google Scholar] [CrossRef] [PubMed] [Green Version]
  37. Andrés, P.; Doblas-Miranda, E.; Rovira, P.; Bonmatí, A.; Ribas, À.; Mattana, S.; Romanyà, J. Research for AGRI Committee—Agricultural Potential in Carbon Sequestration-Humus Content of Land Used for Agriculture and CO2 Storage; European Parliament, Policy Department for Structural and Cohesion Policies: Brussels, Belgium, 2022. [Google Scholar]
  38. LaCanne, C.E.; Lundgren, J.G. Regenerative agriculture: Merging farming and natural resource conservation profitably. PeerJ 2018, 6, e4428. [Google Scholar] [CrossRef] [PubMed]
  39. Elevitch, C.R.; Mazaroli, D.N.; Ragone, D. Agroforestry standards for regenerative agriculture. Sustainability 2018, 10, 3337. [Google Scholar] [CrossRef] [Green Version]
  40. Ranganathan, J.; Waite, R.; Searchinger, T.; Zionts, J. Regenerative Agriculture: Good for Soil Health, but Limited Potential to Mitigate Climate Change; World Resources Institute: Washington, DC, USA, 2020; Available online: https://www.wri.org/insights/regenerative-agriculture-good-soil-health-limited-potential-mitigate-climate-change (accessed on 15 May 2022).
  41. Jordon, M.W.; Smith, P.; Long, P.R.; Bürkner, P.C.; Petrokofsky, G.; Willis, K.J. Can regenerative agriculture increase national soil carbon stocks? Simulated country-scale adoption of reduced tillage, cover cropping, and ley-arable integration using RothC. Sci. Total Environ. 2022, 825, 153955. [Google Scholar] [CrossRef]
  42. Arias, M.E.; González-Pérez, J.A.; González-Vila, F.J.; Ball, A.S. Soil health: A new challenge for microbiologists and chemists. Int. Microbiol. 2005, 8, 13–21. [Google Scholar] [CrossRef]
  43. Köninger, J.; Panagos, P.; Jones, A.; Briones, M.J.I.; Orgiazzi, A. In defence of soil biodiversity: Towards an inclusive protection in the European Union. Biol. Conserv. 2022, 268, 109475. [Google Scholar] [CrossRef]
  44. Zeiss, R.; Eisenhauer, N.; Orgiazzi, A.; Rillig, M.; Buscot, F.; Jones, A.; Lehmann, A.; Reitz, T.; Smith, L.; Guerra, C.A. Challenges of and opportunities for protecting European soil biodiversity. Conserv. Biol. 2022, 36, e13930. [Google Scholar] [CrossRef]
  45. FAO. Keep Soil Alive, Protect Soil Biodiversity. Global Symposium on Soil Biodiversity; Outcome document; Agriculture Organization of the United Nations: Rome, Italy, 22 April 2021. [Google Scholar]
  46. Luján, R.; Cuéllar Padilla, M.; de Vente, J. Participatory selection of soil quality indicators for monitoring the impacts of regenerative agriculture on ecosystem services. Ecosyst. Serv. 2020, 45, 101157. [Google Scholar] [CrossRef]
  47. Cameron, E.K.; Martins, I.S.; Lavelle, P.; Mathieu, J.; Tedersoo, L.; Gottschall, F.; Guerra, C.A.; Hines, J.; Patoine, G.; Siebert, J.; et al. Global gaps in soil biodiversity data. Nat. Ecol. Evol. 2018, 2, 1042–1043. [Google Scholar] [CrossRef] [PubMed]
  48. Arshad, M.A.; Martin, S. Identifying critical limits for soil quality indicators in agro-ecosystems. Agric. Ecosyst. Environ. 2002, 88, 153–160. [Google Scholar] [CrossRef]
  49. Cho, Y. JADAM Organic Farming: ULTRA Powerful Pest and Disease Control Solution, Make all-Natural Pesticide. The Way to Ultra-Low-Cost Agriculture; JADAM: Daejeon, Korea, 2016. [Google Scholar]
  50. Bardgett, R.D.; Jones, A.C.; Jones, D.L.; Kemmitt, S.J.; Cook, R.; Hobbs, P.J. Soil microbial community patterns related to the history and intensity of grazing in sub-montane ecosystems. Soil Biol. Biochem. 2001, 33, 1653–1664. [Google Scholar] [CrossRef]
  51. de Fátima Tavares, L.; de Carvalho, A.M.X.; Machado, L.G. An evaluation of the Use of statistical procedures in soil science. Rev. Bras. Cienc. Solo 2016, 40, 1–17. [Google Scholar] [CrossRef] [Green Version]
  52. Kemper, W.D. Aggregate stability. In Methods of Soil Analysis; Black, C.A., Evans, D.D., White, J.L., Ensminger, L.E., Eds.; American Society of Agronomy: Madison, WI, USA, 1965; pp. 511–519. [Google Scholar]
  53. Kemper, W.D.; Chepil, W.S. Size distribution of aggregates. In Methods of Soil Analysis; Black, C.A., Evans, D.D., White, J.L., Ensminger, L.E., Eds.; American Society of Agronomy: Madison, WI, USA, 1965; pp. 499–510. [Google Scholar]
  54. Campbell, C.D.; Grayston, S.J.; Hirst, D.J. Use of rhizosphere carbon sources in sole carbon source tests to discriminate soil microbial communities. J. Microbiol. Methods. 1997, 30, 33–41. [Google Scholar] [CrossRef]
  55. Hunt, H.W.; Coleman, D.C.; Ingham, E.R.; Ingham, R.E.; Elliott, E.T.; Moore, J.C.; Rose, S.L.; Reid, C.P.P.; Morley, C.R. The detrital food web in a shortgrass prairie. Biol. Fertil. Soils 1987, 3, 57–68. [Google Scholar] [CrossRef]
  56. Darbyshire, J.F.; Wheatley, R.E.; Greaves, M.P.; Inkson, R.H.E. A rapid micromethod for estimating bacterial and protozoan populations. Soil. Rev. Ecol. Biol. Sol. 1974, 11, 465–475. [Google Scholar]
  57. Keuskamp, J.A.; Dingemans, B.J.J.; Lehtinen, T.; Sarneel, J.M.; Hefting, M.M. Tea Bag Index: A novel approach to collect uniform decomposition data across ecosystems. Methods Ecol. Evol. 2013, 4, 1070–1075. [Google Scholar] [CrossRef]
  58. Petraglia, A.; Cacciatori, C.; Chelli, S.; Fenu, G.; Calderisi, G.; Gargano, D.; Abeli, T.; Orsenigo, S.; Carbognan, M. Litter decomposition: Effects of temperature driven by soil moisture and vegetation type. Plant Soil. 2019, 435, 187–200. [Google Scholar] [CrossRef]
  59. Shannon, C.E. A mathematical theory of communication. Bell Syst. Tech. J. 1948, 27, 379–423. [Google Scholar] [CrossRef] [Green Version]
  60. Legendre, P.; Andersson, M.J. Distance-based redundancy analysis: Testing multispecies responses in multifactorial ecological experiments. Ecol. Monogr. 1999, 69, 1–24. [Google Scholar] [CrossRef]
  61. Wardle, D.A.; Parkinson, D. Analysis of co-occurrence in a fungal community. Mycol. Res. 1991, 95, 504–507. [Google Scholar] [CrossRef]
  62. Starr, G.C.; Lal, R.; Malone, R.; Hothem, D.; Owens, L.; Kimble, J. Modeling soil carbon transported by water erosion processes. Land Degrad. Dev. 2000, 11, 83–91. [Google Scholar] [CrossRef]
  63. Jilling, A.; Kane, D.; Williams, A.; Yannarell, A.C.; Davis, A.; Jordan, N.R.; Koide, R.T.; Mortensen, D.A.; Smith, R.G.; Snapp, S.S.; et al. Rapid and distinct responses of particulate and mineral-associated organic nitrogen to conservation tillage and cover crops. Geoderma 2020, 359, 114001. [Google Scholar] [CrossRef]
  64. Blanco-Canqui, H.; Lal, R. Mechanisms of carbon sequestration in soil aggregates. Crit. Rev. Plant Sci. 2004, 23, 481–504. [Google Scholar] [CrossRef]
  65. Haruna, S.I.; Anderson, S.H.; Udawatta, R.P.; Gantzer, C.J.; Phillips, N.C.; Cui, S.; Gao, Y. Improving soil physical properties through the use of cover crops: A review. Agrosyst. Geosci. Environ. 2020, 3, e20105. [Google Scholar] [CrossRef]
  66. USDA. Soil Quality Test Kit Guide; Soil Quality Institute, National Resources Conservation Service, US Department of Agriculture: Auburn, AL, USA, 1999. Available online: https://efotg.sc.egov.usda.gov/references/public/WI/Soil_Quality_Test_Kit_Guide.pdf (accessed on 8 May 2022).
  67. Gómez, J.A.; Álvarez, S.; Soriano, M.A. Development of a soil degradation assessment tool for organic olive groves in southern Spain. Catena 2009, 79, 9–17. [Google Scholar] [CrossRef]
  68. López-Vicente, M.; Gómez, J.A.; Guzmán, G.; Calero, J.; García-Ruiz, R. The role of cover crops in the loss of protected and non-protected soil organic carbon fractions due to water erosion in a Mediterranean olive grove. Soil Tillage Res. 2021, 213, 105119. [Google Scholar] [CrossRef]
  69. Tisdall, J.M.; Oades, J.M. Organic matter and water-stable aggregates in soils. J. Soil Sci. 1982, 33, 141–163. [Google Scholar] [CrossRef]
  70. Wu, X.; Wei, Y.; Wang, J.; Wang, D.; She, L.; Wang, J.; Cai, C. Effects of soil physicochemical properties on aggregate stability along a weathering gradient. Catena 2017, 156, 205–215. [Google Scholar] [CrossRef]
  71. Kopittke, P.M.; Menzies, N.W. A Review of the Use of the Basic Cation Saturation Ratio and the “Ideal” Soil. Soil Sci. Soc. Am. J. 2007, 71, 259–265. [Google Scholar] [CrossRef]
  72. West, T.O.; Post, W.M. Soil organic carbon sequestration rates by tillage and crop rotation. Soil Sci. Soc. Am. J. 2002, 66, 1930–1946. [Google Scholar] [CrossRef] [Green Version]
  73. Baker, J.M.; Ochsner, T.E.; Venterea, R.T.; Griffis, T.J. Tillage and soil carbon sequestration-What do we really know? Agric. Ecosyst. Environ. 2007, 118, 1–5. [Google Scholar] [CrossRef]
  74. Costantini, E.; Priori, S.; Akca, E.; Castaldini, M.; D’Avino, L.; Fulchin, E.; Gagnarli, E.; Giffard, B.; Erdem Kiraz, M.; Lagomarsino, A.; et al. Effects of reduced soil functionality in European vineyards. In Proceedings of the EGU General Assembly Conference Abstracts, Vienna, Austria, 23–28 April 2017; p. 2296. [Google Scholar]
  75. Pingel, M.; Reineke, A.; Leyer, I. A 30-years vineyard trial: Plant communities, soil microbial communities and litter decomposition respond more to soil treatment than to N fertilization. Agric. Ecosyst. Environ. 2019, 272, 114–125. [Google Scholar] [CrossRef]
  76. Zaller, J.G.; Cantelmo, C.; Santos, G.D.; Muther, S.; Gruber, E.; Pallua, P.; Mandl, K.; Friedrich, B.; Hofstetter, I.; Schmuckenschlager, B.; et al. Herbicides in vineyards reduce grapevine root mycorrhization and alter soil microorganisms and the nutrient composition in grapevine roots, leaves, xylem sap and grape juice. Environ. Sci. Pollut. Res. 2018, 25, 23215–23226. [Google Scholar] [CrossRef] [Green Version]
  77. Mbuthia, L.W.; Acosta-Martínez, V.; DeBryun, J.; Schaeffer, S.; Tyler, D.; Odoi, E.; Mpheshea, M.; Walker, F.; Eash, N. Long term tillage, cover crop, and fertilization effects on microbial community structure, activity: Implications for soil quality. Soil Biol. Biochem. 2015, 89, 24–34. [Google Scholar] [CrossRef]
  78. Yu, J.; Unc, A.; Zhang, X.; Steinberger, Y. Responses of the soil microbial catabolic profile and diversity to vegetation rehabilitation in degraded semiarid grassland. Appl. Soil Ecol. 2016, 101, 124–131. [Google Scholar] [CrossRef]
  79. Bongiorno, G.; Bünemann, E.K.; Brussaard, L.; Mäder, P.; Oguejiofor, C.U.; de Goede, R.G.M. Soil management intensity shifts microbial catabolic profiles across a range of European long-term field experiments. Appl. Soil Ecol. 2020, 154, 103596. [Google Scholar] [CrossRef]
  80. Bardgett, R.D.; Shine, A. Linkages between plant litter diversity, soil microbial biomass and ecosystem function in temperate grasslands. Soil Biol. Biochem. 1999, 31, 317–321. [Google Scholar] [CrossRef]
  81. Coll, P.; Le Cadre, E.; Blanchart, E.; Hinsinger, P.; Villenave, C. Organic viticulture and soil quality: A long-term study in Southern France. Appl. Soil Ecol. 2011, 50, 37–44. [Google Scholar] [CrossRef] [Green Version]
  82. Bardgett, R.D.; Hobbs, P.J.; Frostegård, Å. Changes in soil fungal:bacterial biomass ratios following reductions in the intensity of management of an upland grassland. Biol. Fertil. Soils 1996, 22, 261–264. [Google Scholar] [CrossRef]
  83. Bailey, V.L.; Smith, J.L.; Bolton, H., Jr. Fungal-to-bacterial ratios in soils investigated for enhanced C sequestration. Soil Biol. Biochem. 2002, 34, 997–1007. [Google Scholar] [CrossRef]
  84. Schmidt, R.; Mitchell, J.; Scow, K. Cover cropping and no-till increase diversity and symbiotroph:saprotroph ratios of soil fungal communities. Soil Biol. Biochem. 2019, 129, 99–109. [Google Scholar] [CrossRef] [Green Version]
  85. Cluzeau, D.; Guernion, M.; Chaussod, R.; Martin-Laurent, F.; Villenave, C.; Cortet, J.; Ruiz-Camacho, N.; Pernin, C.; Mateille, T.; Philippot, L.; et al. Integration of biodiversity in soil quality monitoring: Baselines for microbial and soil fauna parameters for different land-use types. Eur. J. Soil Biol. 2012, 49, 63–72. [Google Scholar] [CrossRef]
  86. Finney, D.M.; Buyer, J.S.; Kaye, J.P. Living cover crops have immediate impacts on soil microbial community structure and function. J. Soil Water Conserv. 2017, 72, 361–373. [Google Scholar] [CrossRef] [Green Version]
  87. Gagnarli, E.; Goggioli, D.; Tarchi, F.; Guidi, S.; Nannelli, R.; Vignozzi, N. Case study of microarthropod communities to assess soil quality in different managed vineyards. Soil 2015, 1, 527–536. [Google Scholar] [CrossRef] [Green Version]
  88. Ghiglieno, I.; Simonetto, A.; Orlando, F.; Donna, P.; Tonni, M.; Valenti, L.; Gilioli, G. Response of the arthropod community to soil characteristics and management in the Franciacorta viticultural area (Lombardy, Italy). Agronomy 2020, 10, 740. [Google Scholar] [CrossRef]
  89. Bedano, J.C.; Domínguez, A.; Arolfo, R.A.; Wall, L.G. Effect of Good Agricultural Practices under no-till on litter and soil invertebrates in areas with different soil types. Soil Tillage Res. 2016, 158, 100–109. [Google Scholar] [CrossRef]
  90. Coulibaly, S.F.M.A.; Coudrain, V.A.; Hedde, M.; Brunet, N.; Mary, B.; Recous, S.; Chauvat, M. Effect of different crop management practices on soil Collembola assemblages: A 4-year follow-up. Appl. Soil Ecol. 2017, 119, 354–366. [Google Scholar] [CrossRef]
  91. Ghiglieno, I.; Simonetto, A.; Donna, P.; Tonni, M.; Valenti, L.; Bedussi, F.; Gilioli, G. Soil biological quality assessment to improve decision support in the wine sector. Agronomy 2019, 9, 593. [Google Scholar] [CrossRef] [Green Version]
  92. Mantoni, C.; Pellegrini, M.; Dapporto, L.; Del Gallo, M.M.; Pace, L.; Silveri, D.; Fattorini, S. Comparison of soil biology quality in organically and conventionally managed agro-ecosystems using microarthropods. Agriculture 2021, 11, 1022. [Google Scholar] [CrossRef]
  93. Ott, D.; Digel, C.; Klarner, B.; Maraun, M.; Pollierer, M.; Rall, B.C.; Scheu, S.; Seelig, G.; Brose, U. Litter elemental stoichiometry and biomass densities of forest soil invertebrates. Oikos 2014, 123, 1212–1223. [Google Scholar] [CrossRef]
  94. Bonkowski, M. Protozoa and plant growth: The microbial loop in soil revisited. New Phytol. 2004, 162, 617–631. [Google Scholar] [CrossRef]
  95. Fox, O.; Vetter, S.; Ekschmitt, K.; Wolters, V. Soil fauna modifies the recalcitrance-persistence relationship of soil carbon pools. Soil Biol. Biochem. 2006, 38, 1353–1363. [Google Scholar] [CrossRef]
  96. Doran, J.W.; Parkin, T.B. Defining and assessing soil quality. In Defining Soil Quality for a Sustainable Environment; Doran, J.W., Coleman, D.C., Bezdicek, D.F., Stewart, B.A., Eds.; SSSA Special Publications: Madison, WI, USA, 1994; Volume 35, pp. 1–21. [Google Scholar]
  97. Bastida, F.; Zsolnay, A.; Hernández, T.; García, C. Past, present and future of soil quality indices: A biological perspective. Geoderma 2008, 147, 159–171. [Google Scholar] [CrossRef]
  98. Fauci, M.F.; Dick, R.P. Microbial biomass as an indicator of soil quality: Effects of long-term management and recent soil amendments. In Defining Soil Quality for a Sustainable Environment; Doran, J.W., Coleman, D.C., Bezdicek, D.F., Stewart, B.A., Eds.; SSSA Special Publications: Madison, WI, USA, 1994; Volume 35, pp. 229–234. [Google Scholar]
  99. Neher, D.A. Role of nematodes in soil health and their use as indicators. J. Nematol. 2001, 33, 161–168. [Google Scholar]
  100. Yeates, G.W. Nematodes as soil indicators: Functional and biodiversity aspects. Biol. Fertil. Soils 2003, 37, 199–210. [Google Scholar] [CrossRef]
  101. Menta, C.; Conti, F.D.; Pinto, S.; Bodini, A. Soil Biological Quality index (QBS-ar): 15 years of application at global scale. Ecol. Indic. 2018, 85, 773–780. [Google Scholar] [CrossRef]
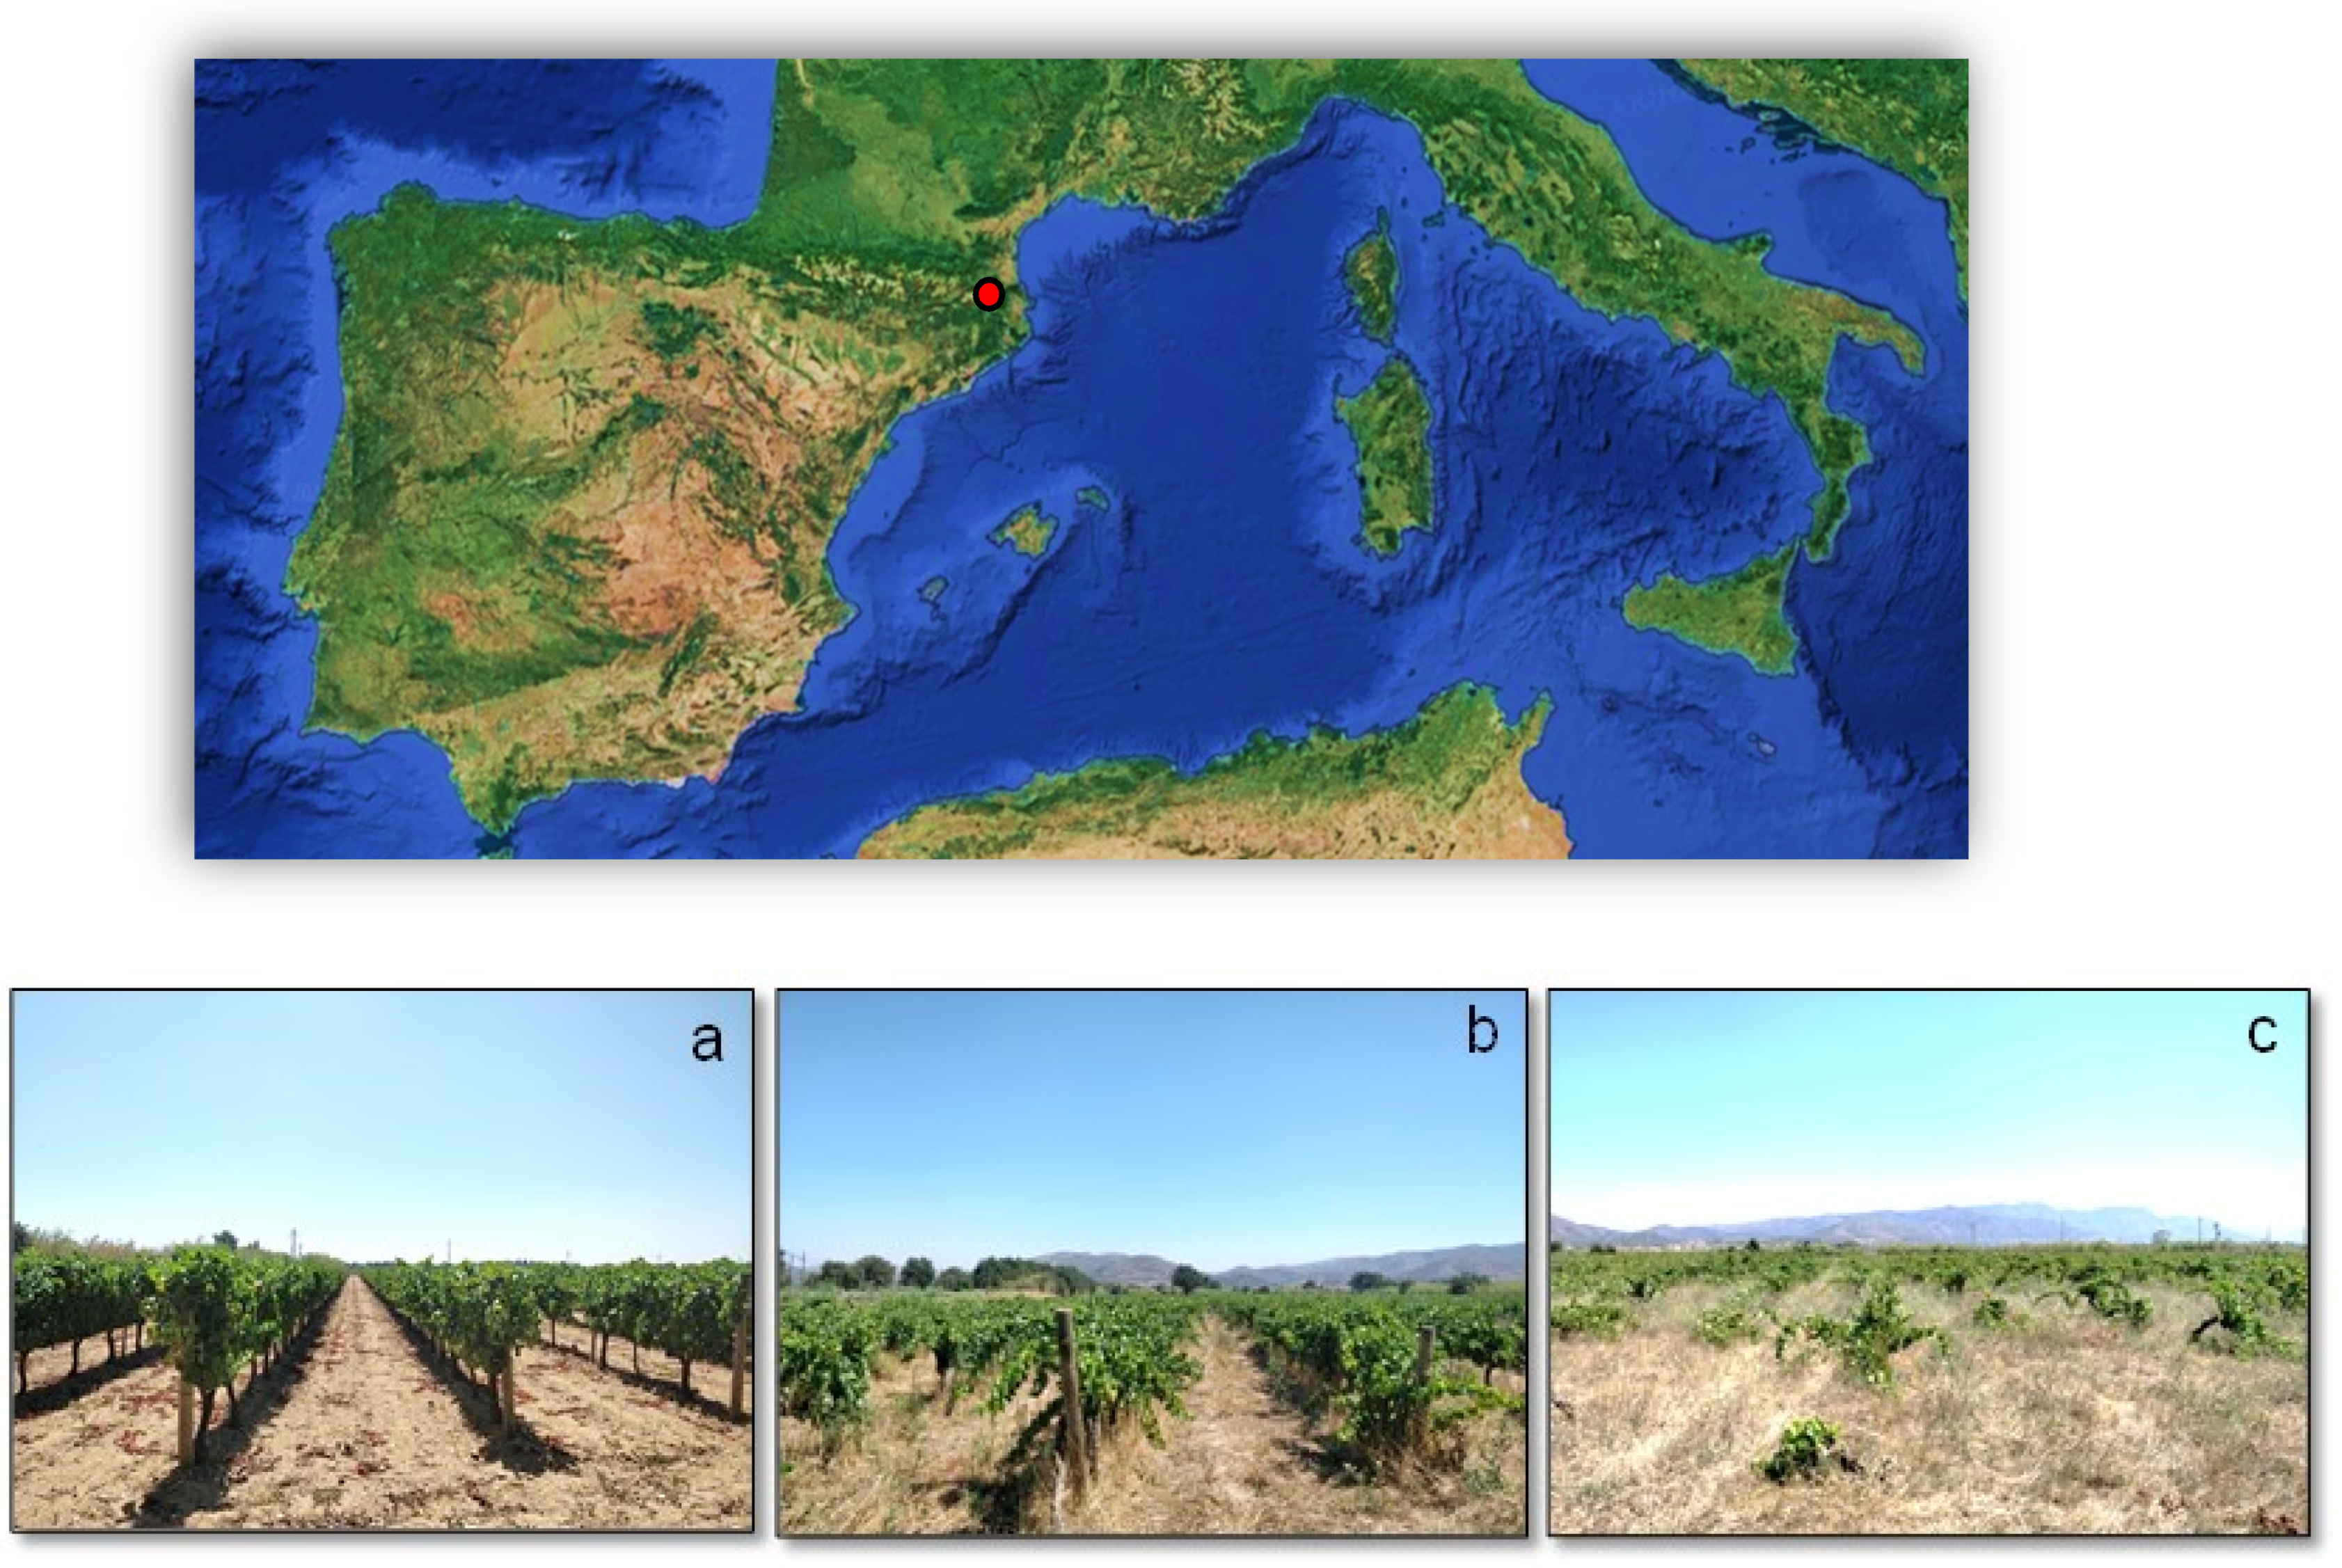
Figure 1. Geographical localization of the study area in the Girona province (Catalonia, Spain), and view of the three vineyards under (a) intensive management, (b) regenerative management, and (c) minimum impact management, respectively.
Agronomy 12 02643 g001
Figure 2. Sampling design at each vineyard.
Agronomy 12 02643 g002
Figure 3. Respiration profiles of the soil microbial communities in the three vineyards studied in this work under intensive management (INT), regenerative management (REG), and minimum impact management (MIN). Mean ± standard error for n = 8. Different letters (a, b) indicate significant differences between treatments after ANOVA.
Agronomy 12 02643 g003
Figure 4. Distance-based redundancy analysis (dbRDA) plot of the DistLM using the two explanatory variables included in the best model. Vectors indicate the direction of the parameter effect in the ordination plot.
Agronomy 12 02643 g004
Figure 5. Value of the V Index (mean ± standard error) for differences between the regenerative and intensive vineyards (black squares) and between the minimum impact and intensive vineyards (empty circles). The greater the distance to the reference red line, the greater the difference between treatments. The red line represents the reference value of each soil property in the intensive vineyard.
Agronomy 12 02643 g005
Figure 6. Spider graph showing the performance of the three vineyards for the most discriminating indicators. The value of each indicator is standardized relative to its maximal value in the three vineyards. For bulk density that is inversely related to soil quality, standardization was done based on the lowest value in the three vineyards. (INT) intensive vineyard; (REG) regenerative vineyard; (MIN) minimum impact vineyard.
Agronomy 12 02643 g006
Table 1. Physical, chemical, and biological properties of the soils of the three vineyards studied in this work under contrasting management. Mean ± standard error, with n = 16 samples, except for microbial substrate utilization, microbial functional diversity, and microbial functional evenness, with n = 8. The abundance of the soil functional groups is expressed in g C m−2. All data correspond to the upper 15 cm of the soil. MWD: Mean Weight Diameter; For each line, different letters (a, b) indicate significant differences between treatments after ANOVA; ns: non-significant difference.
UnitIntensive Management
(INT)
Regenerative Management
(REG)
Minimal Management
(MIN)
p
Physical and chemical properties
Silt + clay %24.3 ± 2.3 b53.7 ± 6.7 a45.6 ± 4.9 a0.002
Bulk density g cm−31.64 ± 0.05 a1.36 ± 0.10 b1.15 ± 0.02 b<0.0001
Aggregate stability (MWD)mm0.87 ± 0.14 ab0.54 ± 0.06 b1.16 ± 0.13 a0.005
pH 5.97 ± 0.25 b7.1 ± 0.09 a5.97 ± 0.08 b0.002
ECdS m−10.06 ± 0.01 b0.14 ± 0.05 a0.08 ± 0.01 ab0.014
Total SOC%0.54 ± 0.08 b1.27 ± 0.20 a1.84 ± 0.32 a0.002
Labile SOC%0.007 ± 0.001 b0.043 ± 0.007 a0.052 ± 0.052 a<0.0001
Nitrogen %0.056 ± 0.006 b0.121 ± 0.017 a0.121 ± 0.009 a0.004
Available Pmg kg−17.27 ± 0.75 b39.07 ± 11.19 a19.85 ± 3.81 ab0.003
Camg kg−1739.5 ± 86.4 b1498.5 ± 174.9 a904.7 ± 162.1 ab0.016
Kmg kg−169.5 ± 4.4 b251.2 ± 27.6 a202.7 ± 18.7 a<0.0001
Mgmg kg−1130.5 ± 14.9228.2 ± 30.8167.5 ± 24.4ns
Namg kg−130.5 ± 1.9 b42.5 ± 2.5 a39.0 ± 2.1 a0.008
Microbial properties
Microbial substrate utilization µg CO2-C g−1 h−10.382 ± 0.067 b2.032 ± 0.718 a1.82 ± 0.406 a0.001
Microbial functional diversity (H′) 2.772 ± 0.0002 a2.764 ± 0.002 b2.766 ± 0.0024 ab0.019
Microbial functional evenness (E′) 0.999 ± 0.0002 a0.991 ± 0.002 b0.994 ± 0.0024 b0.014
Decomposition rate (Kr)−year0.010 ± 0.0010.011 ± 0.0020.014 ± 0.003ns
Soil functional groups’ properties
Bacterial biomass Cg C m−27.31 ± 2.6812.78 ± 3.9812.73 ± 2.63ns
Fungal biomass Cg C m−28.33 ± 1.0713.90 ± 2.4216.65 ± 2.61ns
Total microbial biomass Cg C m−215.64 ± 4.16 b26.68 ± 5.68 ab29.38 ± 7.59 a0.01
Fungal-to-bacterial biomass Cunitless0.595 ± 0.0570.593 ± 0.0640.564 ± 0.056ns
Flagellates g C m−20.0006 ± 0.0002 b0.009 ± 0.002 a0.001 ± 0.0004 b<0.0001
Amoebag C m−20.016 ± 0.007 b0.423 ± 0.193 a0.057 ± 0.027 b0.004
Ciliatesg C m−20.0006 ± 0.00020.013 ± 0.0090.0003 ± 0.0001ns
All protistsg C m−20.017 ± 0.007 b0.445 ± 0.034 a0.059 ± 0.027 b<0.0001
Bacteriophagous nematodesg C m−22.703 ± 0.699 b8.243 ± 2.028 a9.439 ± 2.632 a0.037
Fungivorous nematodes g C m−20.82 ± 0.14 b2.70 ± 0.83 b3.87 ± 0.98 a0.004
Plant associated nematodesg C m−20.90 ± 0.23 b3.24 ± 0.24 a4.48 ± 1.18 a0.012
Omnivorous nematodesg C m−21.148 ± 0.4833.102 ± 1.0527.945 ± 2.10ns
All nematodesg C m−25.57 ± 1.32 b17.29 ± 4.03 a26.22 ± 5.95 a0.011
Poduromorpha (collembola)g C m−22.19 ± 1.1311.62 ± 3.537.37 ± 2.12ns
Entomobryomorpha (collembola)g C m−20.0007 ± 0.0002 b0.006 ± 0.001 a0.0002 ± 0.0001 b<0.0001
All collembolag C m−20.002 ± 0.001 b0.015 ± 0.002 a0.005 ± 0.001 b<0.0001
Predatory mites g C m−20.0001 ± 0.0001 b0.0006 ± 0.0004 a0.0004 ± 0.545 b<0.0001
Fungivorous oribatid mitesg C m−20.001 ± 0.0003 c0.02 ± 0.003 a0.003 ± 0.001 b<0.0001
All microarthropodsg C m−20.023 ± 0.005 b0.676 ± 0.183 a0.122 ± 0.082 b<0.0001
Table 2. Percentage difference (% Δ) between pairs of vineyards for all the selected indicators. INT: intensive vineyard; REG: regenerative vineyard; MIN: minimum impact vineyard. .
REG-INT
% Δ
MIN-INT
% Δ
MIN-REG
% Δ
% Sand−63.5−39.214.9
Bulk density −20.6−42.6−18.3
Aggregate stability −61.125.053.4
% SOC57.570.731.0
% Labile SOC83.786.517.3
pH15.90.0−18.9
EC57.125.0−75.0
Microbial functional diversity (H’)−0.3−0.20.1
Total microbial substrate utilization 81.279.0−11.6
Microbial biomass41.446.89.2
Flagellates 93.747.7−728.2
Amoeba96.773.1−703.1
Total protists95.058.6−727.4
Bacteriophagous nematodes67.271.412.7
Fungivorous nematodes 69.778.830.2
Plant associated nematodes72.179.927.8
Total nematodes68.875.621.6
Entomobryid collembolans89.0−222.6−2822.6
Total collembolans85.759.5−183.1
Predatory mites 84.631.9−341.9
Fungivorous oribatid mites94.669.6−465.3
Total arthropods87.449.7−297.9
Publisher’s Note: MDPI stays neutral with regard to jurisdictional claims in published maps and institutional affiliations.