Article

The Effect of Phosphogypsum and Turkey Litter Application on the Properties of Eroded Agrochernozem in the South Ural Region (Russia)

1
Ufa Institute of Biology UFRC RAS, Pr. Oktyabrya 69, 450054 Ufa, Russia
2
Department of Geodesy, Cartography and Geographic Information Systems, Bashkir State University, Zaki Validi 32, 450076 Ufa, Russia
*
Author to whom correspondence should be addressed.
Agronomy 2022, 12(11), 2594; https://doi.org/10.3390/agronomy12112594
Submission received: 31 August 2022 / Revised: 19 October 2022 / Accepted: 20 October 2022 / Published: 22 October 2022
(This article belongs to the Special Issue Application of Organic Amendments in Agricultural Production)

Abstract

:
The possibility of using industrial and poultry wastes as an ameliorant/fertilizer for erosion-prone soils was investigated. We studied the impact of phosphogypsum (PG) and turkey litter (TL) application on the physicochemical properties of weakly eroded agrochernozem in conditions of a 5-year field experiment in the South Ural region, Russia. In particular, we examined the effect of treatments on the soil moisture reserves, soil structure, microaggregate composition and particle size distribution, aggregate stability (water resistance), organic carbon content (Corg), ammonium, nitrate and alkaline hydrolysable nitrogen, available phosphorus (Pav), exchange potassium (Kex), and potato productivity/ecological quality. Treatments included the application of the PG at 5, 10, and 20 t ha–1, the TL at 40 and 60 t ha–1; and in mixes of PG and TL at ratios of 1:10, 1:5, and 1:2. The obtained results indicated that the introduction of PG and TL increased (compared to control) the moisture reserves (by 10–17%), resistance of soil aggregates to water (8–15%), the content of Corg (6–10%), available nitrogen (two orders of magnitude), Pav (3–6 times) and Kex (2–3 times), and improved, as well, soil structure. In general, years factor had a significant effect on soil water-physical properties; its influence was 44–67%, while the effect of treatments was 21–30%. The agrochemical properties (Corg and Pav) were dependent on treatments factor (77 and 95%, respectively), while the content of all forms of nitrogen depended on the year factor (34–57%). The obtained results suggest the application of PG and TL to improve agrochernozem fertility status and minimize its erodibility without soil and plant contamination.

1. Introduction

Water erosion is one of the principal factors of soil loss and reducing fertility of agricultural lands, worldwide [1,2,3] and especially, in the South Ural region of Russia [4,5]. The introduction of soil ameliorants and fertilizers, in particular, of substances having a complex effect on physicochemical and biological soil properties is important for restoring and improving the fertility of eroded soils.
One of the soil amendments/conditioners is phosphogypsum (PG), that consists mainly of CaSO4·2H2O, and is an industrial byproduct of phosphoric acid and other chemicals derived from apatite and sulfuric pyrites. The production of one ton of phosphoric acid generates up to 5 tons of PG, which is frequently stocked near the production units [6]. The global production of PG, according to various authors [7,8], ranges from 100 to 280 million tons per year. For example, in a country as small as Tunisia, more than 10 million tons of PG are produced annually [9]; near the city of Huelva (Spain) about 100 million tons of PG are stored in stacks on salt marshes near the mouth of the Tinto River, covering an area of about 1000 hectares [10]. Almost over 40 million tons of PG is produced in China [11], and in Russia about 15 million tons of PG is formed annually at the enterprises producing mineral fertilizers. It is noteworthy that the storage duration of PG in dumps and accumulators exceeds 50 years [12]. In this regard, there arises the problem of its utilization and rational use, in agriculture as well, especially on saline and alkaline/sodic soil [13,14,15,16,17,18] and solonized soils [19,20,21,22].
In addition, it is advisable to use the PG for the reclamation of technologically salinized and solonized soils [23,24,25,26,27]. Besides, as PG is able to dissolve better in soil solution, it does not require reprocessing, thus, it is cheaper and more effective than gypsum.
Many research works showed that PG can be used as an ameliorant to improve a number of soil properties, especially in conditions of moisture deficiency. The PG introduction resulted a significant improvement of soil chemical [18] and water-physical properties in the arid southern regions of the African continent, in the countries such as South Africa, Botswana, Namibia, Swaziland, Zimbabwe, and Ethiopia [28]. A decrease of the bulk density and the structuring of soil horizons was also noted in response to PG application [29,30].
The practice of using PG together with carbon-containing wastes of the agro-industrial complex such as manure, litter, various plant residues, is widespread in many countries [31,32,33,34], including the production of nutrients-enriched biochar [35]. In the South Ural region, where poultry farming is rapidly developing, thousands of tons of litter are formed annually and there exists a problem of its utilization [36,37]. To date, the volume of PG in the dumps of South Ural region is more than 10 million tons, and its related using is small. Such a situation enforces to research the impact of industrial and agricultural wastes, required for their disposal, on possible ecological recycling and improving of degraded soils properties. Moreover, no similar research was conducted earlier in the South Ural region. Thus, the purpose of this study is to consider using PG and turkey litter (TL) as an ameliorant and organomineral fertilizer for improving soil fertility and increasing erosion resistance of agrochernozem. Specifically, the work will investigate the following: i) the effect of various ratios (1:10, 1:5, 1:2) and application doses of PG (3.6–20 t ha−1) and TL (33–60 t ha−1) on water-physical properties and erosion resistance of the soil; and ii) the effect of the same ratios and doses of PG and TL application on the dynamics of soil nutrients content and potato yields.

2. Materials and Methods

2.1. Study Site Description

The research was carried out at the experimental farm “Water-Balance Station” (54° 50′ 23′′ N, 55° 44′ 55′′ E; 170 m a.s.l.), located in the Ufimsky district, Republic of Bashkortostan, Russia (Figure 1). According to the natural zonal climatic characteristics, the study area belongs to the South Ural region. The climate of the study area is characterized as moderate continental with average humidity or as warm-summer humid continental (Dfb) according to the Köppen climate classification [38]. According to the long-term meteorological data obtained by employers of the Water-Balance Station [39] and from automatic weather station WXT530 (Vaisala, Vantaa, Finland) installed in 2000 at the study site, the average annual air temperature is +3.8 °С; and the mean annual precipitation is 590 mm, about 1/3 of which falls in the form of snow. The total annual precipitation during the 5-year (2015–2019) field experiment was determined at 461−606 mm, and the average monthly air temperature was 3.4–5.1 °C. The vegetation period (May–August) of 2016 was extremely arid with only 120 mm of precipitation. That was almost two times lower than the average annual values (227 mm). The average temperature during the same time was 19.1 °C, while in other years of research it was 16.1–17.2 °C (Table 1).
The soil at the study area and experimental plots are represented by weakly eroded leached agrochernozem (Luvic Chernozem (Clayic, Aric, Pachic) [40]). The water-physical and agrochemical properties of the soil are given in detail at “Section 3 and Section 4”.

2.2. The Description of Field Experiment and Laboratory Analyzes

The field experiment was established to test the effect of PG, TL, or in combination at different ratios on soil characteristics. The PG was taken from the dumps of a mineral fertilizer factory (Meleuzovsky District, Republic of Bashkortostan, Russia). The compositions of PG in terms of oxides were the following: CaO – 30.9%; SO3 – 48.12%; P2O5 – 2.05%; Al2O3 – 0.05%; K2O – 0.04%; Fe2O3 – 0.09%; TiO2 – 0.08%; MgO – 0.01%; and traces of other elements. The TL before its application into the soil was treated with a microbial substance according to the technology patented by Chetverikov et al. [41]. Details of the application rate of each treatment are provided in Table 2.
At the spring 2015, the PG and TL were applied on soil surface of experimental plots and to ensure uniform mixing, the soil was plowed to a depth of 20 cm with a 2-wheel tractor. Then, the potato seeds (“Snegir” sort) were planted by a traditional method (20 tubers about 5–8 cm deep and 40–50 cm apart) on each experimental plot. The area of each plot was 6 m2 (2×3 m), with three field replicates for each treatment. The potato was cultivated for the first three years (2015–2017); before each planting potatoes, the soil was plowed to a depth of 20 cm. In 2018, the mixture of perennial grasses (27 kg h−1) alfalfa (Medicago sativa) – 25%, fescue (Festuca arundinacea) – 40%, and timothy grass (Phleum pretense) – 35% was sown.
Soil samples were taken from each plot using a JMC hand-driven core sampler (Clements Associates Inc., Newton, MA, USA; inner diameter: 4.5 cm) a month after the beginning of the experiment—in the spring of and autumn 2015, as well in 2016 from topsoil layer (0–20 cm), then sampling was carried out annually in the autumn. The soil samples were dried (at 90 °C) in oven to constant weight, then grounded in a mortar, and passed through a 2 mm sieve for further laboratory analyses. The water-physical properties in soil samples were determined according to the methods described in Vadyunina and Korchagina [42]. In particular, the soil moisture was determined by the gravimetric method; the particle size distribution and microaggregate composition (for fractions <0.25 mm) were measured by standard sedimentation (pipette) method; the aggregate composition (dry sieving) and soil aggregate stability (SAS) (wet sieving) were determined using a 0.25-, 0.5-, 1-, 3-, 5-, 7-, and 10-mm sieves. The microaggregate analysis was used for an agronomic assessment of soil microstructure, the indicator of which is the Kachinsky dispersion coefficient (Equation (1)):
Kd = (Pm / Pt) ×100%,
where, Kd – Kachinsky dispersion coefficient, Pm and Pt – clay content under microaggregate and soil texture analysis proceeding. Remark: decreasing of Kd value means the improving of soil microstructure.
The SAS coefficient was calculated from the Equation (2):
Ksas= Σw / Σd,
where Σw – sum of aggregates > 0.25 mm under wet sieving (water-stable aggregates), Σd – sum of aggregates > 0.25 mm under dry sieving.
The content of agronomically valuable aggregates (AVA) Σ (0.25–10 mm) and the structural coefficient (Ks) as the main indicators in assessment/quality of soil aggregate composition was estimated according to the Equation (3):
Ks = Σ (0.25–10 mm) / Σ (>10, <0.25 mm)
The agrochemical properties in soil samples were determined according to methods described in Sokolov [43]. The soil pH was determined in 1 mol L−1 KCl suspension (1:2.5 soil/solution); the organic carbon content (Corg), with wet combustion by the Orlov and Grindel method, available phosphorus (Pav) and exchangeable potassium (Kex) were extracted in 0.5 mol L−1 CH3COOH at a 1:2.5 soil/solution ratio by Chirikov method; the degree of phosphorus mobility was measured in 0.015 mol L−1 K2SO4 suspension (1:5 soil/solution) by Karpinsky and Zamyatina method; and the ammonium nitrogen content (NH4+-N) and nitrate nitrogen (NO3-N) were extracted 1 mol L−1 KCl (1:2.5 soil/solution) and alkaline hydrolysable nitrogen (AH-N) according to Cornfield method. The content of nitrates in potato tubers was measured with ionometric method using Anion 4100 (Infraspack-Analit, Novosibirsk, Russia), cadmium and plumbum (strontium in soil), with atomic absorption method using the analyzer Spectrum-5-4 (Soyuztsvetmetavtomatika, Moscow, Russia).
Soil penetration was measured from the soil surface to a depth of 20 cm with 2.5 cm intervals by using soil compaction meter FieldScout SC 900 (Spectrum technologies, Aurora, CO, USA), equipped with a metal rod with a cone (size 1/2 inch).
The PG composition was determined using an Elan-6100 inductively coupled plasma mass spectrometer, an Optima-4300 DV atomic emission plasma coupled spectrometer (Perkin Elmer, Waltham, MA, USA). The strontium concentration in the soil was determined on a S1 Titan portable X-ray fluorescence analyzer (Bruker, Billerica, MA, USA).

2.3. Statistical Analysis

The results discussed here, and the values provided in the tables and figures, represent the mean values obtained from three replicates. The significance of differences between treatments (Student’s t-test) and correlation coefficients was determined using Microsoft Excel 2019 (Microsoft Corporation, Redmond, WA, USA), two-way analysis of variance (ANOVA) and Tukey's honestly significant difference (HSD)—Statistica 8.0 (TIBCO Software Inc., Palo Alto, CA, USA).

3. Results

3.1. Physical Properties

The soil penetration resistance on all variants increased with depth, and was in the optimum range for plants (average value for 0–20 cm layer not exceeding 2000 kPa) (Table 3). In 2015, only PG10 was not significantly lower than the control variant, while in 2016 only PG5 had a significant difference.
At the beginning of the plant growing season, the soil moisture reserves varied in the range of 120–180 mm in the 50-cm soil layer (Table 4). The moisture reserves in the dry 2016 were significantly lower than in all other years (tstat ranged from 7.8 to 40.3, p < 0.01). In 2017 and 2019, the moisture reserves were higher than in the first year of the experiment (tstat 4.2 and 2.9, p < 0.05).
The soil texture was characterized as clay loam for all treatments at the beginning and end of the experiment (Figure 2A).
According to Kd, the soil of all variants belonged to the best category (Kd < 15), i.e., had a “high microstructure” (Figure 3). Here and hereafter the gradation of water-physical and agrochemical properties of soil on the following categories: “low”, “medium”, “elevated”, “high”, “very high”, and “excessively high” are made according to the Russian classification [44].
SAS in the experimental area was categorized as “excellent”, the Ksas range was 0.6–0.8 (Table 5).
During the entire experiment, the soil at all variants had the “excellent aggregation”, i.e., Ks > 1.5 (Table 6).
The statistical summarizing of soil water-physical properties data are presented in Table 7.

3.2. Agrochemical Properties

The soils of the experimental plots were characterized by a moderately acidic pH (Table 8).
The Corg content was categorized as “low” for chernozems and equaled ~ 3.8% in the control plot (Table 9).
In the experiment, the content of NH4+-N (Table 10) changed by 1–2 orders of magnitude during the first year.
The dynamics of NO3-N was similar with NH4+-N (Table 11).
At the same time, the soil enrichment with AH-N, the nearest reserve of nitrogen supply to agricultural plants, remained at a high level (Table 12).
The studied soil was characterized by low phosphate reserves, which increased with any applied treatment (Table 13).
The content of Kex was ranged from 135–500 mg kg–1 and categorized as “high” for all years of the experiment (Table 14).
The statistical summarizing of soil agrochemical properties data are presented in Table 15.

3.3. Potato Yield and Quality

Potato was cultivated in the experimental plots for the first three years (2015–2017), and over the years, the harvest declined (Table 16). Chemical analysis of potato tubers showed that the content of Pb and Cd was significantly lower than the maximum permissible concentration (MPC) defined by the Russian government (Table 16).

4. Discussion

4.1. Physical Properties

In the first year, 2015, the significant reduction in soil penetration resistance was observed for most experimental plots with amendments (Table 3). The maximum reduction occurred in the treatments with the joint application of PG and TL, where it amounted for 759–622 kPa, while it was 1114 kPa in the control variant. In 2016, the difference between the variants of the experiment with control became not significant. A decrease in soil penetration with the introduction of both PG and poultry litter was also noted in the works [45,46]. The similar tendency, that the penetration resistance is lower in the top layer and increases in the deep layer, gradually was found in a laboratory test by Tang et al. [47].
At the beginning of the experiment, the introduction of only PG in doses from 5 to 20 t ha–1 did not affect soil moisture reserves significantly (Table 4 and Table 7), although some researchers [48,49] have noted that PG treatments increased the moisture storage in the plant root zone. However, a significant increase of soil moisture reserves (by 10–17%) was observed with the introduction of TL and PG+TL. In all these variants, the soil moisture reserves were significantly higher than only PG treatment. The effectiveness of TL was especially notable in the arid 2016, with the aftereffect also observed in 2017. The differences between the treatments in soil moisture reserves decreased in the 4th and 5th years of the experiment. In these years, the variants with high doses of TL (PG5.5TL54.5, PG20TL40, TL40, TL60) were significantly higher than the variants with PG only. In general, weather conditions had a greater influence on the soil moisture reserves than treatments. The two-way ANOVA showed that the influence of years factor was 54, the treatments factor – 30, and the interaction effect (years-treatments) – 15%.
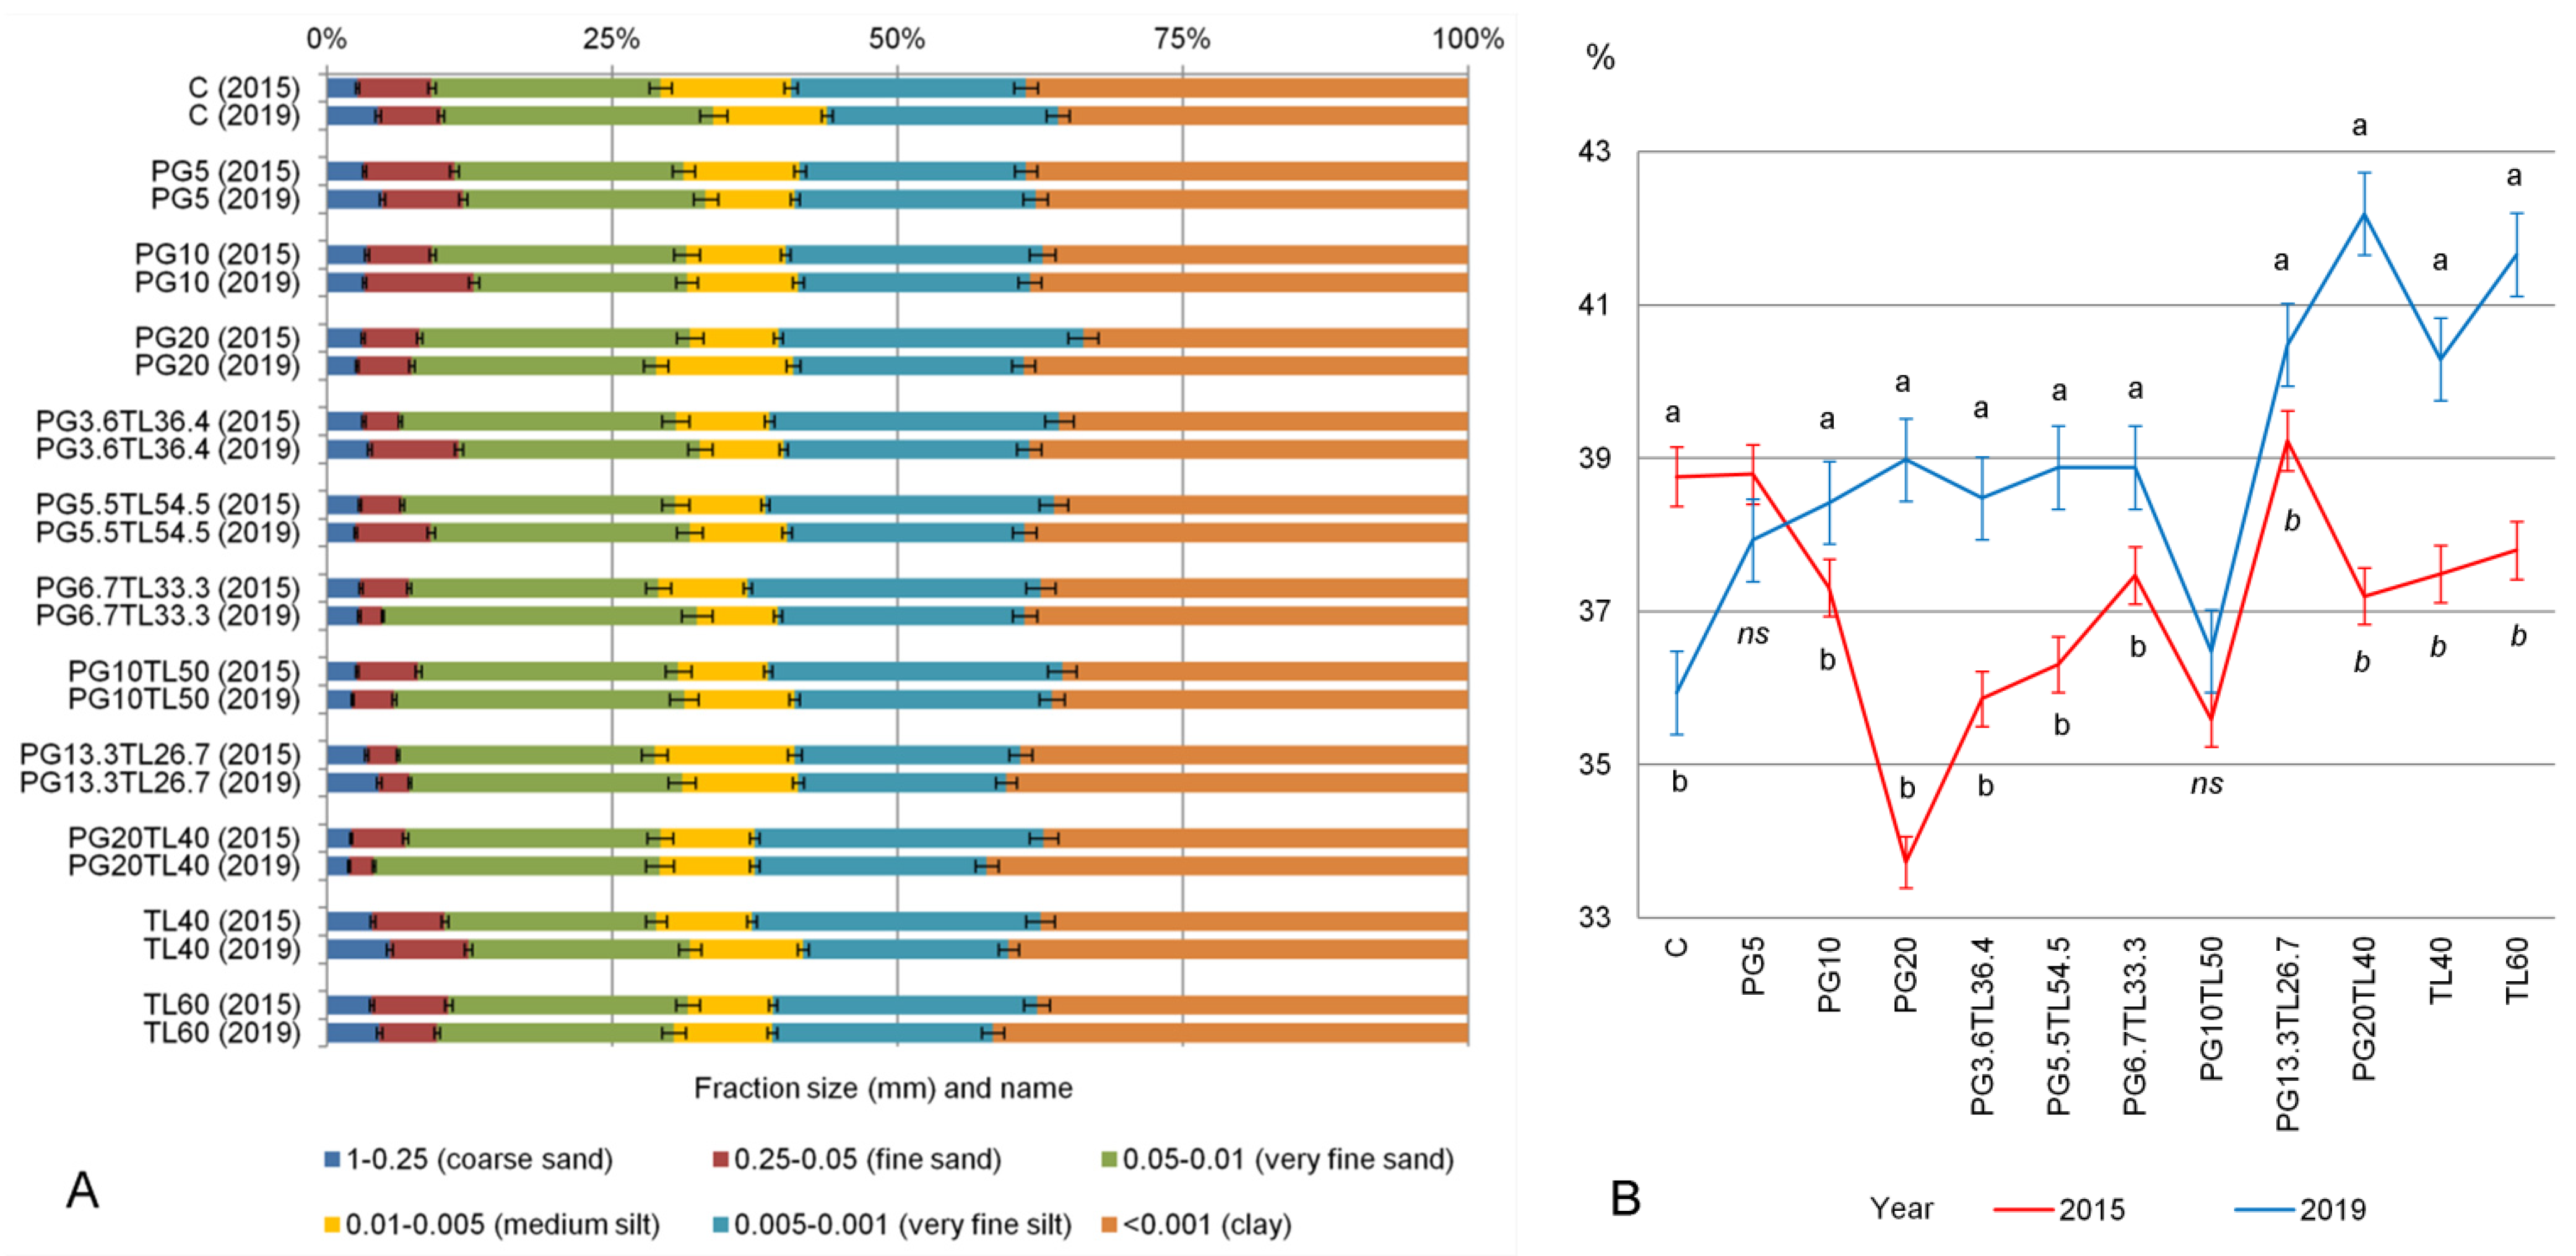
The particle size distribution of the agrochernozem changed in the first year after the addition of the PG. A tendency towards the decreasing of clay (<0.001 mm) fraction content was observed, with a significant (p ˂ 0.05) decrease only after the largest dose – PG20 (Figure 2B). However, there were not-so-noticeable changes in clay fraction content after the joint application of PG+TL. After 5 years, clay fraction content in the soil of the control variant fell from 39 to 36% (tstat = 3.84, p ˂ 0.05), and the sand (0.01–1 mm) content increased from 29 to 34% (tstat = 5.58, p ˂ 0.01). It is well known that clay and silt particles are preferentially transported by overland flow [50,51]. On the site of the experiment, a washout of fine particles from topsoil and an increase of silt+clay fraction in the sediments were found during snowmelt, rainfalls, or sprinkling irrigation [52,53]. The introduction of amendments resulted in the significant increase of clay (< 0.001 mm) fraction content in 2019 when compared to 2015 (tstat = 4.23, p ˂ 0.01). This fact indicates the increase of soil resistance to water erosion.
The introduction of PG5 and PG10 in the first three years did not lead to a significant change in SAS, and only at the highest dose (PG20) was there a significant increase of SAS in comparison with the control. The water resistance of the soil aggregates increased significantly (by 8–15%) with the addition of high doses of TL (≥ 36.4 t ha–1) with PG as well as TL60 (tstat from 3.70 to 5.67, p ˂ 0.05). In general, the introduction of amendments led to the change of SAS from “excellent” (2015) to “excessively high” gradation by 2019, i.e., Ksas became more than 0.8 (tstat = 6.01, p ˂ 0.01) (Table 5 and Table 7). The increasing of SAS and soil resistance to water erosion under the introduction of PG [54,55] and manure [56,57] or broiler litter [46] has also been noted for other soil types.
Ksas depended not only on treatments but also on meteorological conditions. The influence of years and treatments factors on SAS were 45 and 24%, respectively, and the interaction effect was – 29%. The increase in SAS for all the treatments of the experiment in the last two years (tstat = 7.24, p ˂ 0.01) was apparently associated with the cessation of plowing practice [58] and cultivation of perennial herbs [59,60].
The use of amendments has a considerable impact on the microaggregate composition of the soil. Kd decreased after the introduction of PG, in accordance with the increase of its dose. This fact indicated an improvement in soil microstructure. Similar results were reported in the investigations by Semendyaeva and Elizarov [61] and Efremova et al. [49]. The addition of TL did not lead to significant changes in Kd in 2015, but it significantly decreased by 2019 (tstat = 13.46 p ˂ 0.01). On the contrary, the efficiency of PG worsened by the end of the experiment, but compared to the control it was significantly better even in 2019 at PG10 and PG20 doses. This is due to the washouting (by surface erosional runoff and/or lessivage process) of the clay fraction and the concomitant deterioration of the soil microstructure. The aftereffect of PG without introduction of organic additives was not prolonged.
The effect of PG on soil structure is controversial. A positive effect of PG appears for alkaline soils [62,63]. According to Vyshpolsky et al. [48] the effect of PG in irrigated areas was negative. The separate application of PG and TL during the entire experiment did not have a significant effect on the content of AVA. At the same time, their joint application led to a significant improvement of soil structure in comparison with the control (tstat from 4.49 to 9.92, p ˂ 0.05). An increase in the content of the 1–2 mm fraction with the introduction of PG and poultry manure is also shown in the work by Xue et al. [64]. It is interesting to note that this fact was most clearly manifested in the second year of the experiment after the severely arid growing season. In general, meteorological conditions had a higher influence on the AVA content than treatments and their interaction effect (51%, 22% and 23%, respectively).
On average throughout the five years, the content of AVA correlated closely (r = 0.84) with the Ks. Wherein, the higher effect on Ks was revealed with the introduction of the increased dose of TL (Table 6 and Table 7). The effect of the years factor was 67, while treatments –19 and their interaction – 11%.
Thus, the introduction of TL, both separately and together with PG, improves the water-physical properties and anti-erosion resistance of eroded agrochernozem, especially in arid year. The two-way ANOVA showed that years had a significant effect on the water-physical properties of the soil; the influence of this factor was 44–67, while the effect of treatments was 21–30%.

4.2. Agrochemical Properties

In the first year after the introduction of the PG+TL, alkalization from “moderately acidic” to a “slightly acidic” and “neutral” categories was observed (Table 8 and Table 15). This increase in pHKCl was due to high NH4+-N content in TL; since PG, when applied separately, did not have a significant effect on soil acidity at any doses. The impact of PG on pH depends on the initial soil acidity. The addition of PG to alkaline soils contributed to their acidification, for example, pH was reduced from 7.9 in the control to 5.1 in the treatment with 20% PG [65]. In our earlier studies [23,24], the neutralization of the alkalinity of technogenic solonized soils was shown. At the same time, the addition of PG to the strongly acidic Rhodic Ferralsol (pHCaCl2 in the 0–15 cm layer was 4.0–4.7) at a dose of 2100 kg ha–1 contributed to the neutralization of acidity to 4.2–5.1 [66]. In the subsequent years of the experiment, some acidification occurred, but the pHKCl values remained in the “slightly acidic” category. The percentage of treatments effect was 43, years – 20, interaction effect – 31%. Similar results were obtained when high doses (40–120 t ha-1) of chicken manure were applied into the same soil [36].
The introduction of PG did not contribute to an increase of Corg [67,68], although it could affect the carbon of microbial biomass [69], the content of various carbon fractions [70], and organic carbon concentrations in soil aggregates [71]. In contrast to PG, the TL application produced significant increasing trends in Corg [72]. In the present study, the application of sole PG did not significantly impact the Corg content, however, its significant increase was observed in all the treatments that included TL (Table 9 and Table 15). Corg content in the variants with the highest TL doses (54-60 t ha–1) was significantly higher than in PG treatments. The maximum Corg content was noted in the 2nd year after the application of TL at 60 t ha–1, where the content of Corg was higher by 0.37%, when compared with the control. In PG+TL treatments, the greatest increases in Corg were at the dose of 60 t ha–1 in all the ratios. In the fifth year of the experiment, the maximum Corg content was also preserved in these treatments. This indicates the deposition of TL carbon in the composition of soil organic matter, and not mineralization with the release of CO2 into the atmosphere. The t-test showed a significant increase in the Corg content compared to the control when TL was applied (tstat from 8.16 to 18.45, p ˂ 0.01). The influence of treatments factor was 77%, and the factor of years and interaction effect did not have a significant impact (1% and 6%).
Significant changes occurred in the soil nitrogen content, primarily in all the treatments that included TL (spring 2015). The NH4+-N increased by two orders of magnitude depending on the dose of TL (Table 10 and Table 15). However, by the autumn of 2015, NH4+-N significantly declined, as follows: i) 6–8 times with the application of PG+TL at a dose of 60 t ha–1, ii) 10–12 times with a dose of 40 t ha–1 PG+TL, and iii) 31–35 times with TL only. This change in NH4+-N indicates the ability of PG to fix NH4+-N and reduce its loss. PG ability to reduce significantly total nitrogen loss was shown by Lim et al. [73] and Li et al. [74]. In 2016, there was a further reduction in NH4+-N, but only after the 3rd year the leveling and stabilization of NH4+-N took place. The influence of years factor on the NH4+-N dynamics was 34, treatments – 17, interaction effect – 49% (only the autumn season was taken into account, as well in calculations for NO3-N, AH-N, and Pav).
The content of NO3-N also significantly increased up to ten times with the introduction of TL, either separately or together with the PG (Table 11 and Table 15). The NO3-N dynamics generally corresponded to NH4+-N, as the NO3-N amount decreased with time but to a lesser extent. The two-way ANOVA showed that years had a significant effect; the influence of this factor was 52, while effect of treatments −16, interaction effect −32%.
The dynamics of the content of AH-N (Table 12 and Table 15) correlated (p ˂ 0.001) with the dynamics of NH4+-N (r = 0.98) and NO3-N (r = 0.71). The content of AH-N greatly increased immediately after the TL addition into the soil (from 168 to 1148 mg kg–1). Later, the AH-N decreased to the control level possibly as a result of the plant nutrition and intensive development of denitrification. The years effect was 57, while treatments −20, and their interaction −16%.
The introduction of PG contributed to the increase in the Pav content (Table 13 and Table 15), however, even with the highest dose (20 t ha–1) the Pav enrichment did not exceed the “medium” category. Obviously, this is due both to the low content of phosphorus in PG and its difficult solubility. One of the effective ways to release the phosphorus from PG is using of phosphate-solubilizing fungi [75]. A slight increase in the content of mobile phosphorus was observed in the chernozems of Northern Kazakhstan [76]. In other soil types, the authors [77,78,79,80] noted a more noticeable increase in the content of Pav. The addition of TL, either alone or together with PG, in all the ratios, led to an increase in the Pav content to a “very high” category. However, in the 2nd and 3rd years, the Pav amount in the soil of these treatments gradually lessened, but the enrichment of soil with Pav remained high until the end of experiment in 2019. With the introduction of TL, the content of Pav was higher in all variants than of PG alone. It should be noted that the degree of phosphorus mobility with the addition of PG5 and PG10 increased but remained in the “low” category, and only with the addition of PG20 it became “medium”. On the other hand, the addition of PG+TL and TL contributed to a significant increase in the degree of phosphorus mobility (“elevated” and “high” categories), which persisted throughout the experiment. The t-test showed a significant increase in Pav content compared to the control in all variants of the experiment (tstat from 6.17 to 50.87, p ˂ 0.01). The percentage of treatment effect was 95, while years −1, their interaction −2%.
The content of Kex did not change significantly with the addition of all doses of PG (Table 14 and Table 15). The similar results were obtained by Nayak et al. [65]. The addition of PG+TL contributed to an increase of the enrichment of Kex by one level (to a “very high” category – 450–500 mg kg–1). By the autumn of the 3rd year, the content of Kex slightly changed, especially in PG+TL and TL treatments. The maximum concentrations remained at the level of 250–275 mg kg–1. In the subsequent years, the enrichment of Kex remained “high” and “very high”, although the degree of potassium mobility did not exceed the “medium” category (20 mg L–1). The percentage of treatments effect was 56, while years −16, their interaction −26%.

4.3. Potato Yield and Ecological Quality

The first year of the experiment (2015) was an average in terms of meteorological conditions of this natural-climatic zone, with a sufficient level of heat and moisture supply. Potato yields increased with the application of amendments up to 3.2 times, as the maximum increase, after the application of TL40 (Table 16). The application of PG increased the potato yield, growing gradually with increasing the dose. Joint application of PG and TL at any ratio also had a significant (p < 0.01) effect on potato productivity, especially at a dose of 60 t ha–1 where the yield was higher. In all variants with TL introduction, the potato yield was significantly higher than with PG. The 2nd year of the study turned out to be arid, which had a strong negative impact on potato yield, but the main patterns were the same as in 2015. However, it should be noted that with a high dose of PG, potato yield was almost same with control variant in 2016–2017. In all other variants, the increase in yield was significant (p < 0.01). The meteorological conditions had a higher influence on the potato yield than treatments and their interaction effect (55%, 30%, and 14%, respectively). The applying of PG into other soils contributed to an increase in the yield of potato [6] and various other crops [66,76,81] and depended both on dose and weather conditions during plant development.
Being able to cause negative environmental consequences, the addition of PG into soil in order to improve its properties must be done with caution. Many heavy metals (HMs) are present as impurities in the PG composition, thus, the content of HMs total and soluble forms in the soil can increase due to PG application. In some cases, the addition of PG was reported to result in a dangerous increase in the activity of the Pb2+ in the soil solution [82]. Nevertheless, mobile and water-soluble forms of Ca, Ba, Sr, S, and Na increases soil toxicity [83]. One of the most important indicators of soil pollution when using PG is Sr content, since its ions are capable of replacing Ca2+ in the tissues of living organisms. According to the Russian guidelines, the concentration of more than 600 mg kg–1 of Sr in the soil is considered dangerous [84]. Taking this element into account, the permissible PG application should not exceed 6.8% for agricultural land [85]. When soil bulk density is 1.1 g cm–3 and at a layer of 20 cm, the PG dose should be not more than 150 t ha–1. In the composition of PG used in the experiment, Sr concentration was 14691 mg kg–1; while Sr in the untreated control soil was 130 mg kg–1. Thus, in the highest dose (PG20TL40), the Sr concentration was 260 mg kg–1, indicating that the applied doses of PG are environmentally safe. Moreover, organic additives could reduce the risk of Sr contamination [86]. Despite a slight increase in the content of water-soluble salts immediately after the addition of PG, the soil remained in the category “non-saline”. Al-Hwaiti and Al-Khashman [87] found that concentrations of Cd, Cr, Pb, and Zn were below what are considered as acceptable limits for food production in soil and vegetables (tomatoes and green peppers) under PG applying in Jordan.
An important indicator of the ecological quality of agricultural crops is the assessment of content of HMs and nitrates in their composition. Chemical analysis of potato tubers showed that the content of Pb and Cd was significantly lower than the MPC defined by the Russian government (Table 16). However, the addition of high doses of TL, either alone or jointly with PG, in the first year, caused an increase in the content of nitrates in potato tubers to 1.5—the MPC guidelines adopted in Russia [88]—however, in the 2nd year, nitrate content in tubers gradually decreased and did not exceed the MPC. The correlation between potato yield and nitrates content was strong both for two years (r = 0.72) and separately (r = 0.75 at 2015, r = 0.82 at 2016). Obviously, in the first year it is more advisable to cultivate industrial crops.
In the 4th year, the experimental plots were seeded with perennial herbs, a mixture of alfalfa, fescue, and timothy grass; their hay productivity in the 5th year ranged 2.5–3.9 t ha–1. The maximum increases were observed in the treatments with the joint addition of PG+TL at a ratio of 1:5.

5. Conclusions

A 5-year long field experiment (in South Ural, Russia) demonstrates that the joint application of phosphogypsum (PG) and turkey litter (TL) to weakly eroded agrochernozem improves water-physical properties, as follows: significantly increases soil moisture reserves, especially in the dry years, and the content of clay fraction and agronomically valuable aggregates; and improves aggregate stability and soil microstructure. These factors contribute to the increasing of soil resistance to water erosion. The statistical analyses show that weather conditions of different years have a significant effect on soil water-physical properties; the influence of this factor was 44–67%, while the effect of treatments was 21–30%.
The application of amendments also leads to the improvement of the soil agrochemical properties. The content of soil organic carbon (Corg) increases with the introduction of TL and remains stable until the end of the experiment. The ammonium nitrogen (NH4+-N) and nitrate nitrogen (NO3-N) content increases sharply at the beginning of the experiment according to the dose of the TL, but then in the autumn, it noticeably decreases. The use of PG helps to fix NH4+-N, and reduces its loss by leaching from soil. The dynamics and the content of NO3-N and alkaline hydrolysable nitrogen in general corresponds to NH4+-N, with time their amount decreases but to a lesser extent. The introduction of PG helps to increase the content of available phosphorus (Pav) from a “low” to a “medium” level, and the addition of TL to a “very high” Pav level, which gradually decreases but remains in this category until the end of the experiment. The soil of the control plot is characterized by a “high” content of exchangeable potassium, which increases less noticeably than other nutrients and does not change significantly in subsequent years. The content of Corg and Pav is more dependent on treatments factor (77 and 95%, respectively), and the content of all nitrogen forms depend on the year factor (34–57%).
The amendments, especially TL increase potato yields in two to three times compared to control. The high doses of PG only at years with a lack of soil moisture do not lead to an increase in potato yield. Only in the first year an excess in the maximum permissible concentration of nitrate was observed in some cases, but with no presence of Pb and Cd.
Thus, the wastes from the phosphorus fertilizers production (PG) and poultry farming (TL) are advisable to use not only to increase fertility, but also for soil anti-erosion resistance. The wider use of these amendments will lead to an improvement of the ecological situation and will give an economic benefit for the agriculture in the region. The proposed techniques can also be useful on other soil types and climatic conditions.

Author Contributions

Conceptualization, I.G.; methodology, I.G.; software, M.K.; validation, M.K. and T.G.; formal analysis, M.K., T.G. and L.S.; investigation, M.K., I.G., T.G., R.S. and L.S.; resources, I.G.; data curation, M.K., T.G., R.S. and L.S.; writing—original draft preparation, M.K., I.G. and T.G.; writing—review and editing, M.K.; visualization, M.K.; supervision, I.G.; project administration, I.G.; funding acquisition, M.K. and I.G. All authors have read and agreed to the published version of the manuscript.

Funding

This work was carried out within the framework of the Russian Federation Government task № 075-00326-19-00, research project № АААА-А18-118022190102-3. The study was partly and financially supported by a grant from the President of the Republic of Bashkortostan “Assessment of the state of degraded lands of the Republic of Bashkortostan by the radiocesium method and the development of organomineral fertilizers to increase soil fertility”. A part of the results was obtained using equipment of the “Agidel” Collective Use Center.

Data Availability Statement

Not applicable.

Acknowledgments

The authors are grateful to Irik Saifullin for his fieldwork help, and Fliza Nazyrova and Guldar Gimaletdinova for their support in the laboratory analyses.

Conflicts of Interest

The authors declare no conflict of interest.

References

  1. Mishra, P.K.; Rai, A.; Abdelrahman, K.; Rai, S.C.; Tiwari, A. Land degradation, overland flow, soil erosion, and nutrient loss in the Eastern Himalayas, India. Land 2022, 11, 179. [Google Scholar] [CrossRef]
  2. Niacsu, L.; Bucur, D.; Ionita, I.; Codru, I.-C. Soil conservation measures on degraded land in the hilly region of Eastern Romania: A case study from Puriceni-Bahnari catchment. Water 2022, 14, 525. [Google Scholar] [CrossRef]
  3. Gebremedhin, M.; Coyne, M.S.; Sistani, K.R. How much margin is left for degrading agricultural soils? The coming soil crises. Soil Syst. 2022, 6, 22. [Google Scholar] [CrossRef]
  4. Sobol, N.V.; Gabbasova, I.M.; Komissarov, M.A. Impact of climate changes on erosion processes in Republic of Bashkortostan. Arid Ecosyst. 2015, 5, 216–221. [Google Scholar] [CrossRef]
  5. Gabbasova, I.M.; Suleimanov, R.R.; Khabirov, I.K.; Komissarov, M.A.; Frühauf, M.; Liebelt, P.; Garipov, T.T.; Sidorova, L.V.; Khaziev, F.H. Temporal changes of eroded soils depending on their agricultural use in the southern Cis-Ural region. Eurasian Soil Sci. 2016, 49, 1204–1210. [Google Scholar] [CrossRef]
  6. Kammoun, M.; Ghorbel, I.; Charfeddine, S.; Kamoun, L.; Gargouri-Bouzid, R.; Nouri-Ellouz, O. The positive effect of phosphogypsum-supplemented composts on potato plant growth in the field and tuber yield. J. Environ. Manag. 2017, 200, 475–483. [Google Scholar] [CrossRef]
  7. Saadaoui, E.; Ghazel, N.; Ben Romdhane, C.; Massoudi, N. Phosphogypsum: Potential uses and problems–a review. Int. J. Env. Stud. 2017, 74, 558–567. [Google Scholar] [CrossRef]
  8. Hassoune, H.; Lahhit, M.; Khalid, A.; Lachehab, A. Application of leaching tests on phosphogypsum by infiltration-percolation. Water Sci. Technol. 2017, 76, 1844–1851. [Google Scholar] [CrossRef]
  9. Jalali, J.; Gaudin, P.; Capiaux, H.; Ammar, E.; Lebeau, T. Fate and transport of metal trace elements from phosphogypsum piles in Tunisia and their impact on soil bacteria and wild plants. Ecotoxicol. Environ. Saf. 2019, 174, 12–25. [Google Scholar] [CrossRef]
  10. Guerrero, J.L.; Gutiérrez-Álvarez, I.; Mosqueda, F.; Olías, M.; García-Tenorio, R.; Bolívar, J.P. Pollution evaluation on the salt-marshes under the phosphogypsum stacks of Huelva due to deep leachates. Chemosphere 2019, 230, 219–229. [Google Scholar] [CrossRef]
  11. Zhao, H.; Li, H.; Bao, W.; Wang, C.; Li, S.; Lin, W. Experimental study of enhanced phosphogypsum carbonation with ammonia under increased CO2 pressure. J. CO2 Util. 2015, 11, 10–19. [Google Scholar] [CrossRef]
  12. Mescheryakov, Y.G.; Fedorov, S.V. Problems of industrial phosphogypsum processing in Russia, state and prospects. Fundam. Res. 2015, 6–2, 273–276. (In Russian) [Google Scholar]
  13. Gharaibeh, M.A.; Rusan, M.J.; Eltaif, N.I.; Shunnar, O.F. Reclamation of highly calcareous saline-sodic soil using low quality water and phosphogypsum. Appl. Water Sci. 2014, 4, 223–230. [Google Scholar] [CrossRef] [Green Version]
  14. Quintero, J.M.; Enamorado, S.; Mas, J.L.; Abril, J.M.; Polvillo, O.; Delgado, A. Phosphogypsum amendments and irrigation with acidulated water affect tomato nutrition in reclaimed marsh soils from SW Spain. Span. J. Agric. Res. 2014, 12, 809–819. [Google Scholar] [CrossRef] [Green Version]
  15. Abdel-Fattah, M.K.; EL-Naka, E.S. Empirical approach of leaching curves for determining the efficiency of reclaiming saline-sodic soils in Sahl El-Tina, Sinai, Egypt. Int. J. Plant Sci. 2015, 8, 13–15. [Google Scholar] [CrossRef]
  16. Prochnow, L.; Caires, E.; Rodrigues, E.C. Phosphogypsum use to improve subsoil acidity: The Brazilian experience. Better Crops 2016, 100, 13–15. [Google Scholar]
  17. Borges, R.C.; Ferreira, A.A.; de Souza, W.F.L.; Berned, A.V.B. The geochemistry of natural radionuclides in saline soils from Brazil treated with phosphogypsum Imbituba. Water Air Soil Pollut. 2017, 228, 59. [Google Scholar] [CrossRef]
  18. Haile, H.; Sheleme, B.; Alemayehu, K.; Selamyihun, K. Effect of phosphogypsum amendment on chemical properties of sodic soils at different incubation periods. Appl. Environ. Soil Sci. 2022, 2022, 9097994. [Google Scholar] [CrossRef]
  19. Petrović, S.; Dimitrijević, M.; Belić, M.; Banjac, B.; Bošković, J.; Zečević, V.; Pejić, B. The variation of yield components in wheat (Triticum aestivum L.) in response to stressful growing conditions of alkaline soil. Genetika 2010, 42, 545–555. [Google Scholar] [CrossRef]
  20. Voropaeva, Z.I.; Trotsenko, I.A.; Parfenov, A.I. Changes in the properties of a crusty solonetz with soda salinization after single and repeated amelioration with phosphogypsum. Eurasian Soil Sci. 2011, 44, 314–325. [Google Scholar] [CrossRef]
  21. Scipin, L.; Scipin, D.; Petukhova, V.; Monakhova, Z. Efficiency of chemical ameliorants for reclamation of bore mud and solonetzic soils of Siberia and Ural. IOP Conf. Ser. Earth Environ. Sci. 2019, 337, 012030. [Google Scholar] [CrossRef]
  22. Scipin, L.; Scipin, D.; Zakharova, E.; Kustysheva, I. Effectiveness of use of phosphogypsum on the solonetzic soils of Siberia and Ural. IOP Conf. Ser. Earth Environ. Sci. 2019, 337, 012029. [Google Scholar] [CrossRef]
  23. Gabbasova, I.M.; Suleimanov, R.R. Transformation of gray forest soils upon technogenic salinization and alkalization and subsequent rehabilitation in oil-producing regions of the Southern Urals. Eurasian Soil Sci. 2007, 40, 1000–1007. [Google Scholar] [CrossRef]
  24. Gabbasova, I.M.; Suleymanov, R.R.; Garipov, T.T. Degradation and remediation of soils polluted with oil-field wastewater. Eurasian Soil Sci. 2013, 46, 204–211. [Google Scholar] [CrossRef]
  25. Smaoui-Jardak, M.; Kriaa, W.; Maalej, M.; Zouari, M.; Kamoun, L.; Trabelsi, W.; Ben Abdallah, F.; Elloumi, N. Effect of the phosphogypsum amendment of saline and agricultural soils on growth, productivity and antioxidant enzyme activities of tomato (Solanum lycopersicum L.). Ecotoxicology 2017, 26, 1089–1104. [Google Scholar] [CrossRef] [PubMed]
  26. Al-Enazy, A.-A.; Al-Barakah, F.; Al-Oud, S.; Usman, A. Effect of phosphogypsum application and bacteria co-inoculation on biochemical properties and nutrient availability to maize plants in a saline soil. Arch. Agron. Soil Sci. 2018, 64, 1394–1406. [Google Scholar] [CrossRef]
  27. Karpenko, N.P.; Egemberdiev, D.K.; Glazunova, I.V. Biomeliorant for the restoration of saline and degraded soils in the arid zone. IOP Conf. Ser.: Earth Environ. Sci. 2022, 1010, 012044. [Google Scholar] [CrossRef]
  28. Laker, M.C.; Nortje, G.P. Review of existing knowledge on soil crusting in South Africa. Adv. Agron. 2019, 55, 189–242. [Google Scholar] [CrossRef]
  29. Belyuchenko, I.S.; Antonenko, D.A. The influence of complex compost on the aggregate composition and water and air properties of an ordinary chernozem. Eurasian Soil Sci. 2015, 48, 748–753. [Google Scholar] [CrossRef]
  30. James, J.; Pandian, P.K. Plasticity, swell-shrink, and microstructure of phosphogypsum admixed lime stabilized expansive soil. Adv. Civ. Eng. 2016, 2016, 9798456. [Google Scholar] [CrossRef]
  31. Belic, M.; Nesic, L.; Dimitrijevic, M.; Petrovic, S.; Ciric, V.; Pekec, S.; Vasin, J. Impact of reclamation practices on the content and qualitative composition of exchangeable base cations of the solonetz soil. Aust. J. Crop Sci. 2012, 6, 1471–1480. [Google Scholar]
  32. Irshad, M.; Saleem, A.; Faridullah; Hassan, A.; Pervez, A.; Eneji, A.E. Phosphorus solubility and bioavailability from poultry litter supplemented with gypsum and lime. Canad. J. Soil Sci. 2012, 92, 893–900. [Google Scholar] [CrossRef] [Green Version]
  33. Samet, M.; Charfeddine, M.; Kamoun, L.; Nouri-Ellouze, O.; Gargouri-Bouzid, R. Effect of compost tea containing phosphogypsum on potato plant growth and protection against Fusarium solani infection. Environ. Sci. Pollut. Res. 2018, 25, 18921–18937. [Google Scholar] [CrossRef] [PubMed]
  34. Samet, M.; Karray, F.; Mhiri, N.; Kamoun, L.; Sayadi, S.; Gargouri-Bouzid, R. Effect of phosphogypsum addition in the composting process on the physico-chemical proprieties and the microbial diversity of the resulting compost tea. Environ. Sci. Pollut. Res. 2019, 26, 21404–21415. [Google Scholar] [CrossRef] [PubMed]
  35. Vimal, V.; Karim, A.A.; Kumar, M.; Ray, A.; Biswas, K.; Maurya, S.; Subudhi, D.; Dhal, N.K. Nutrients enriched biochar production through Co-Pyrolysis of poultry litter with banana peduncle and phosphogypsum waste. Chemosphere 2022, 300, 134512. [Google Scholar] [CrossRef] [PubMed]
  36. Gabbasova, I.M.; Garipov, T.T.; Sidorova, L.V.; Suleimanov, R.R.; Nazyrova, F.I.; Bayazitova, L.I.; Komissarov, A.V.; Yaubasarov, R.B. The using of chicken manure as fertilizers on agrochernozem of Southern Pre-Ural region. Agrochemistry 2016, 8, 30–35. (In Russian) [Google Scholar]
  37. Suleymanov, R.; Saifullin, I.; Komissarov, M.; Gabbasova, I.; Suleymanov, A.; Garipov, T. Effect of phosphogypsum and turkey litter on the erodibility of agrochernozems of the southern Cis-Ural (Russia) under artificial heavy rainfall. Soil Environ. 2019, 38, 81–89. [Google Scholar] [CrossRef]
  38. Beck, H.E.; Zimmermann, N.E.; McVicar, T.R.; Vergopolan, N.; Berg, A.; Wood, E.F. Present and future Köppen-Geiger climate classification maps at 1–km resolution. Sci. Data 2018, 5, 180–214. [Google Scholar] [CrossRef] [Green Version]
  39. Abdrakhmanov, R.F.; Batanov, B.N.; Gabbasova, I.M.; Komissarov, A.V.; Maslov, V.V.; Yunusov, S.A. Water Balance Station; BSAU: Ufa, Russia, 2002; p. 82. (In Russian) [Google Scholar]
  40. IUSS Working Group WRB. World Reference Base for Soil Resources 2014, update 2015. International soil classification system for naming soils and creating legends for soil maps. In World Soil Resources Reports; FAO: Rome, Italy, 2015; p. 182. [Google Scholar]
  41. Chetverikov, S.P.; Stolyarova, E.A.; Sultanov, I.M.; Rafikova, G.F.; Loginov, O.N. Microbial composition for processing organic waste of human life, livestock and poultry. RU Patent No. 2609654, 2 February 2017. (In Russian). [Google Scholar]
  42. Vadyunina, A.F.; Korchagina, Z.A. Methods of Studying the Physical Properties of Soils; Agropromizdat: Moscow, Russia, 1986; p. 416. (In Russian) [Google Scholar]
  43. Sokolov, A.V. Agrochemical Methods of the Researches of Soils; Nauka: Moscow, Russia, 1975; p. 656. (In Russian) [Google Scholar]
  44. Kiryushin, V.I. Ecological Basis of Agriculture; Kolos: Moscow, Russia, 1996; p. 366. (In Russian) [Google Scholar]
  45. Carmeis Filho, A.C.; Crusciol, C.A.; Guimaraes, T.M.; Calonego, J.C.; Mooney, S.J. Impact of amendments on the physical properties of soil under tropical long-term no till conditions. PLoS ONE 2016, 11, e0167564. [Google Scholar] [CrossRef] [Green Version]
  46. Adeli, A.; Dabney, S.M.; Tewolde, H.; Jenkins, J.N. Effects of tillage and broiler litter on crop productions in an eroded soil. Soil Till. Res. 2017, 165, 198–209. [Google Scholar] [CrossRef]
  47. Tang, C.S.; Gong, X.P.; Shen, Z.; Cheng, Q.; Inyang, H.; Lv, C.; Shi, B. Soil micro-penetration resistance as an index of its infiltration processes during rainfall. J. Rock Mech. Geotech. Eng. 2022, 14, 1580–1587. [Google Scholar] [CrossRef]
  48. Vyshpolsky, F.; Mukhamedjanov, K.; Bekbaev, U.; Ibatullin, S.; Yuldashev, T.; Noble, A.D.; Mirzabaev, A.; Aw-Hassan, A.; Qadir, M. Optimizing the rate and timing of phosphogypsum application to magnesium-affected soil for crop yield and water productivity enhancement. Agric. Water Manag. 2010, 97, 1277–1286. [Google Scholar] [CrossRef]
  49. Efremova, S.Y.; Akanova, N.I.; Sharkov, T.A.; Yakhkind, M.I. Efficiency of the use of neutralized phosphogypsum, phosphorite processing waste, in agriculture. Environ. Qual. Manag. 2020, 30, 5–11. [Google Scholar] [CrossRef]
  50. Slattery, M.C.; Burt, T.P. Particle size characteristics of suspended sediment in hillslope runoff and stream flow. Earth Surf. Proc. Land 1997, 22, 705–719. [Google Scholar] [CrossRef]
  51. Leguédois, S.; Bissonnais, Y.L. Size fractions resulting from an aggregate stability test, interrill detachment and transport. Earth Surf. Process. Landf. 2004, 29, 1117–1129. [Google Scholar] [CrossRef]
  52. Komissarov, M.A.; Gabbasova, I.M. Snowmelt-induced soil erosion on gentle slopes in the southern Cis-Ural region. Eurasian Soil Sci. 2014, 47, 598–607. [Google Scholar] [CrossRef]
  53. Komissarov, M.A.; Gabbasova, I.M. Erosion of agrochernozems under sprinkler irrigation and rainfall simulation in the southern forest-steppe of Bashkir Cis-Ural region. Eurasian Soil Sci. 2017, 50, 253–261. [Google Scholar] [CrossRef]
  54. Cochrane, B.H.W.; Eltz, F.L.F.; Norton, L.D.; Reichert, J.M. Controlling soil erosion and runoff with polyacrylamide and phosphogypsum on subtropical soil. Trans ASAE 2005, 48, 149–154. [Google Scholar] [CrossRef]
  55. Mamedov, A.I.; Shainberg, I.; Wagner, L.E.; Warrington, D.N.; Levy, G.J. Infiltration and erosion in soils treated with dry PAM, of two molecular weights, and phosphogypsum. Aust. J. Soil Res. 2010, 47, 788–795. [Google Scholar] [CrossRef]
  56. Bottinelli, N.; Angers, D.A.; Hallaire, V.; Michot, D.; Le Guillou, C.; Cluzeau, D.; Heddadj, D.; Menasseri-Aubry, S. Tillage and fertilization practices affect soil aggregate stability in a Humic Cambisol of Northwest France. Soil Till. Res. 2017, 170, 14–17. [Google Scholar] [CrossRef]
  57. Are, M.; Kaart, T.; Selge, A.; Astover, A.; Reintam, E. The interaction of soil aggregate stability with other soil properties as influenced by manure and nitrogen fertilization. Zemdir. Agric. 2018, 105, 195–202. [Google Scholar] [CrossRef] [Green Version]
  58. Komissarov, M.A.; Klik, A. Impact of no-till, conservation and conventional tillage on erosion and soil properties in Lower Austria. Eurasian Soil Sci. 2020, 53, 503–511. [Google Scholar] [CrossRef]
  59. Dou, Y.; Yang, Y.; An, S.; Zhu, Z. Effects of different vegetation restoration measures on soil aggregate stability and erodibility on the Loess Plateau, China. Catena 2020, 185, 104294. [Google Scholar] [CrossRef]
  60. Sher, Y.; Baker, N.R.; Herman, D.; Fossum, C.; Hale, L.; Zhang, X.-X.; Nuccio, E.; Saha, M.; Zhou, J.; Pett-Ridge, J.; et al. Microbial extracellular polysaccharide production and aggregate stability controlled by Switchgrass (Panicum virgatum) root biomass and soil water potential. Soil Biol. Biochem. 2020, 143, 107742. [Google Scholar] [CrossRef]
  61. Semendyaeva, N.V.; Elizarov, N.V. Salt composition of groundwater and reclaimed solonetzes in the Baraba Lowland. Eurasian Soil Sci. 2017, 50, 1177–1185. [Google Scholar] [CrossRef]
  62. Beretka, J. The current state of utilization of phosphogypsum in Australia. In Proceedings of the Third International Symposium on Phosphogypsum, Bartow, FL, USA, 4–7 December 1990. [Google Scholar]
  63. Zhang, T.; Li, S.; Sun, X.; Wang, Z.; Zhang, Y.; Zhang, L.; Gong, X.; Zhao, X.; Xie, Z.; Song, G. Effect of amendments of phosphogypsum and brown sugar on earthworms ameliorating coastal saline soil. Acta Pedol. Sin. 2017, 54, 255–264. [Google Scholar] [CrossRef]
  64. Xue, S.; Ke, W.; Zhu, F.; Ye, Y.; Liu, Z.; Fan, J.; Hartley, W. Effect of phosphogypsum and poultry manure on aggregate-associated alkaline characteristics in bauxite residue. J. Environ. Manag. 2020, 256, 109981. [Google Scholar] [CrossRef]
  65. Nayak, S.; Mishra, C.S.; Guru, B.C.; Rath, M. Effect of phosphogypsum amendment on soil physico-chemical properties, microbial load and enzyme activities. J. Environ. Biol. 2011, 32, 613–617. [Google Scholar]
  66. da Costa, C.H.M.; Crusciol, C.A.C. Long-term effects of lime and phosphogypsum application on tropical no-till soybean–oat–sorghum rotation and soil chemical properties. Eur. J. Agron. 2016, 74, 119–132. [Google Scholar] [CrossRef] [Green Version]
  67. Carmeis Filho, A.C.; Penn, C.J.; Crusciol, C.A.; Calonego, J.C. Lime and phosphogypsum impacts on soil organic matter pools in a tropical Oxisol under long-term no-till conditions. Agric. Ecosyst. Environ. 2017, 241, 11–23. [Google Scholar] [CrossRef] [Green Version]
  68. da Costa, C.H.M.; Wander, M.M.; Crusciol, C.A.C.; Ugarte, C.; Rigon, J.P.G.; Soratto, R.P.; Calonego, J.C. Long-term effects of lime and phosphogypsum on soil carbon and nitrogen and physical attributes under tropical no-till. Soil Sci. Soc. Am. J. 2020, 85, 328–339. [Google Scholar] [CrossRef]
  69. Lee, C.H.; Ha, B.Y.; Lee, Y.B.; Kim, P.J. Effect of alkalized PG on soil chemical and biological properties. Comm. Soil Sci. Plant Anal. 2009, 40, 2072–2086. [Google Scholar] [CrossRef]
  70. Bossolani, J.W.; Crusciol, C.A.C.; Leite, M.F.A.; Merloti, L.F.; Moretti, L.G.; Pascoaloto, I.M.; Kuramae, E.E. Modulation of the soil microbiome by long-term Ca-based soil amendments boosts soil organic carbon and physicochemical quality in a tropical no-till crop rotation system. Soil Biol. Biochem. 2021, 156, 108188. [Google Scholar] [CrossRef]
  71. Michalovicz, L.; Tormena, C.A.; Müller, M.M.L.; Dick, W.A.; Cervi, E.K. Residual effects of phosphogypsum rates and machinery traffic on soil attributes and common-bean (Phaseolus vulgaris) yield in a no-tillage system. Soil Till. Res. 2021, 213, 105152. [Google Scholar] [CrossRef]
  72. Harmel, R.D.; Haney, R.L.; Smith, D.R. Effects of annual Turkey litter application on surface soil quality of a Texas Blackland Vertisol. Soil Sci. 2011, 176, 227–236. [Google Scholar] [CrossRef]
  73. Lim, S.S.; Park, H.J.; Hao, X.; Lee, S.I.; Jeon, B.J.; Kwak, J.H.; Choi, W.J. Nitrogen, carbon, and dry matter losses during composting of livestock manure with two bulking agents as affected by co-amendments of phosphogypsum and zeolite. Ecol. Eng. 2017, 102, 280–290. [Google Scholar] [CrossRef]
  74. Li, S.; Li, J.; Shi, L.; Li, Y.; Wang, Y. Role of phosphorous additives on nitrogen conservation and maturity during pig manure composting. Environ. Sci. Pollut. Res. 2021, 28, 17981–17991. [Google Scholar] [CrossRef]
  75. Tian, D.; Xia, J.; Zhou, N.; Xu, M.; Li, X.; Zhang, L.; Du, S.; Gao, H. The utilization of phosphogypsum as a sustainable phosphate-based fertilizer by Aspergillus Niger. Agron. 2022, 12, 646. [Google Scholar] [CrossRef]
  76. Rakhimova, A.; Khussainov, A.; Grinfelde, I. Impact of coal ash and phosphogypsum application on soil fertility of Chernozem soils of North Kazakhstan. In Proceedings of the 16th International Scientific Conference “Engineering for Rural Development”, Jelgava, Latvia, 24–26 May 2017. [Google Scholar] [CrossRef]
  77. Vyshpolsky, F.; Qadir, M.; Karimov, A.; Mukhamedjanov, K.; Bekbaev, U.; Paroda, R.; Aw-Hassan, A.; Karajeh, F. Enhancing the productivity of high-magnesium soil and water resources through the application of phosphogypsum in Central Asia. Land Degrad. Dev. 2008, 19, 45–56. [Google Scholar] [CrossRef]
  78. Elloumi, N.; Zouari, M.; Chaari, L.; Ben Abdallah, F.; Woodward, S.; Kallel, M. Effect of phosphogypsum on growth, physiology, and the antioxidative defense system in sunflower seedlings. Environ. Sci. Pollut. Res. 2015, 22, 14829–14840. [Google Scholar] [CrossRef]
  79. Hentati, O.; Abrantes, N.; Caetano, A.L.; Bouguerra, S.; Gonçalves, F.; Römbke, J.; Pereira, R. Phosphogypsum as a soil fertilizer: Ecotoxicity of amended soil and elutriates to bacteria, invertebrates, algae and plants. J. Hazard. Mater. 2015, 294, 80–89. [Google Scholar] [CrossRef]
  80. Bouray, M.; Moir, J.; Condron, L.; Lehto, N. Impacts of phosphogypsum, soluble fertilizer and lime amendment of acid soils on the bioavailability of phosphorus and sulphur under lucerne (Medicago sativa). Plants 2020, 9, 883. [Google Scholar] [CrossRef] [PubMed]
  81. Fageria, N.K.; Moreira, A.; Moraes, L.A.C.; Moraes, M.F. Influence of lime and gypsum on yield and yield components of soybean and changes in soil chemical properties. Comm. Soil Sci. Plant Anal. 2014, 45, 271–283. [Google Scholar] [CrossRef]
  82. Endovitsky, A.P.; Batukaev, A.A.; Minkina, T.M.; Kalinitchenko, V.P.; Mandzhieva, S.S.; Sushkova, S.N.; Mischenko, N.A.; Bakoyev, S.Y.; Zarmaev, A.A.; Jusupov, V.U. Ions association in soil solution as the cause of lead mobility and availability after application of phosphogypsum to chernozem. J. Geochem. Explor. 2017, 182, 185–192. [Google Scholar] [CrossRef]
  83. Pukalchik, M.A.; Katrutsa, A.M.; Shadrin, D.; Terekhova, V.A.; Oseledets, I.V. Machine learning methods for estimation the indicators of phosphogypsum influence in soil. J. Soils Sediments 2019, 19, 2265–2276. [Google Scholar] [CrossRef]
  84. Lyubimova, I.N.; Borisochkina, T.I. The Effect of Potentially Hazardous Chemical Elements Contained in Phosphogypsum on the Environment; V.V. Dokuchaev Soil Science Institute: Moscow, Russia, 2007; p. 48. (In Russian) [Google Scholar]
  85. Yakovlev, A.S.; Kaniskin, M.A.; Terekhova, V.A. Ecological evaluation of artificial soils treated with phosphogypsum. Eurasian Soil Sci. 2013, 46, 697–703. [Google Scholar] [CrossRef]
  86. Matveeva, V.A.; Smirnov, Y.D.; Suchkov, D.V. Industrial processing of phosphogypsum into organomineral fertilizer. Environ. Geochem. Health 2022, 44, 1605–1618. [Google Scholar] [CrossRef] [PubMed]
  87. Al-Hawati, M.; Al-Khashman, O. Health risk assessment of heavy metals contamination in tomato and green pepper plants grown in soils amended with phosphogypsum waste materials. Environ. Geochem. Health 2015, 37, 287–304. [Google Scholar] [CrossRef]
  88. Kuznetsov, A.V.; Fesyun, A.P.; Samokhvalov, S.G.; Makhonko, E.P. Guidelines for the Determination of Heavy Metals in Farmland Soils and Crop Production; CSRIASA: Moscow, Russia, 1992; p. 61. (In Russian) [Google Scholar]
Figure 1. Location of the study site (red point) on the Eurasian continent.
Agronomy 12 02594 g001
Figure 2. Effect of treatments and years on the particle size distribution (A) and the content (%) of clay fraction (<0.001 mm) (B) at the 0–20 cm soil layer. Various letters denote significant differences at p < 0.01, ns – not significant.
Agronomy 12 02594 g002
Figure 3. Effect of treatments and years on the Kachinsky dispersion coefficient (Kd) at the beginning and end of the experiment (0–20 cm soil layer). Various letters denote significant differences at p < 0.01, ns – not significant.
Agronomy 12 02594 g003
Table 1. Meteorological data in study area during research period.
YearsJan.Feb.Mar.Apr.MayJuneJulyAug.Sept.Oct.Nov.Dec.Avg. (Jan.–Dec.)
Average monthly air temperature, °C
2015–12.1–7.7–4.64.914.721.217.515.513.82.4–2.5–5.04.8
2016–12.0–4.5–1.29.114.317.821.023.212.32.9–6.1–15.25.1
2017–12.4–11.6–3.84.111.515.419.118.711.83.7–0.2–6.94.1
2018–12.5–11.6–104.212.715.921.417.712.55.7–4.6–10.13.4
2019–12.1–9.8–0.55.914.617.519.215.99.47.2–3.9–6.64.7
Average annual–12.3–11.8–5.15.213.218.119.717.211.34.6–4.2–10.73.8
Average monthly precipitation, mm
20152924204810721494436977457606
2016504130452558181962377449507
201778602233541661041262784526740
2018222546486243165147464015461
201950425067540397667531443553
Average annual483932334767555851585251590
Table 2. The different treatments with PG, TL, and their combined application ratio.
TreatmentDescription
1CControl—without PG or TL
2PG55 t PG ha−1
3PG1010 t PG ha−1
4PG2020 t PG ha−1
5PG3.6TL36.4PG+TL, 1:10, 40 t ha−1
6PG5.5TL54.5PG+TL, 1:10, 60 t ha−1
7PG6.7TL33.3PG+TL, 1:5, 40 t ha−1
8PG10TL50PG+TL, 1:5, 60 t ha−1
9PG13.3TL26.7PG+TL, 1:2, 40 t ha−1
10PG20TL40PG+TL, 1:2, 60 t ha−1
11TL40TL, 40 t ha−1
12TL60TL, 60 t ha−1
Table 3. Effect of treatments and years on the soil penetration resistance, kPa.
TreatmentYearDepth, cmt-test
02.55.07.510.012.515.017.520.0Average20152016
C201520437780392692612381448160525001114
2016175295288498667912134713762435888
PG520155520149154157771780779210985864.05 ** 1
20161052252607721312132614531776266910992.55 *
PG1020153019565287889811391309152416349182.29 ns
20161682384705476386531029131919517791.58 ns
PG2020151202111007431637717662106812337673.07 *
20161051471973515478841179140328988560.48 ns
PG3.6TL36.420151001904116064865064515817424523.76 **
20161471902814639279751081133315657731.09 ns
PG5.5TL54.520151452913864814364265417879424924.01 **
20163013653869419339331207127017699000.12 ns
PG6.7TL33.32015251763714314213313365265863554.09 **
2016175267295470779110215242955301111751.66 ns
PG10TL502015201153213213264214816878033884.80 **
201688105123322789782829155712996541.78 ns
PG13.3TL26.7201515911612523714424676788833735.27 **
2016701333375761229145317482070243511162.13 ns
PG20TL4020155901513213565115616927323794.83 **
20166364198361637980975142123817872.23 ns
TL402015545436792897917927167420758633.91 **
2016991341947131450173621072157236812172.21 ns
TL60201557547976999211371388141515428662.53 *
20167110520531064310291480178425799110.36 ns
1 * – significant (p < 0.05), ** – significant (p < 0.01), ns – not significant.
Table 4. Effect of treatments and years on the soil moisture reserves (mm) in 0–50 cm layer.
Treatment/Year20152016201720182019
C145 e 1 I129 e155 e III148 d153 bc
PG5146 de124 f149 e IV150 cd V154 bc
PG10145 e I118 ef142 f150 cd V152 c
PG20143 e127 e152 de149 d159 b VI
PG3.6TL36.4156 bc133 cd158 d II153 cd157 bc
PG5.5TL54.5160 ab135 cd I162 cd160 a168 a
PG6.7TL33.3164 a150 a180 a156 bc I159 b VI
PG10TL50159 ab I152 a182 a156 bc I158 bc
PG13.3TL26.7160 ab148 a II178 a157 b155 bc
PG20TL40157 bc137 c164 bc162 a166 a
TL40152 cd142 b170 b163 a167 a
TL60155 bc141 bc165 bc165 a169 a
Significance** 2********
1 Means followed by the same letters within same column are not statistically different (p < 0.05), by the various letters – statistically different. 2 **: effect significant at p < 0.01 and of pairs: I – TL40; II – TL60; III – PG5.5TL54.5; IV – PG10; V – PG13.3TL26.7; VI – PG20TL40 at p < 0.05.
Table 5. Effect of treatments and years on the soil aggregate stability coefficients (Ksas, 0–20 cm).
Treatment/Year2015201620172019
C0.79 b 10.78 c0.78 b0.83 b
PG50.85 a0.79 c0.79 b0.86 b
PG100.85 a0.82 bc0.78 b0.87 ab
PG200.84 a0.83 bc0.83 ab0.85 b
PG3.6TL36.40.82 ab0.84 b0.81 ab0.88 ab
PG5.5TL54.50.82 ab0.86 a0.82 a0.87 ab
PG6.7TL33.30.83 ab0.84 b0.78 b0.91 a
PG10TL500.84 a0.89 a0.84 a0.87 ab
PG13.3TL26.70.81 ab0.89 a0.78 b0.86 b
PG20TL400.83 ab0.85 a0.81 ab0.85 b
TL400.81 ab0.87 a0.81 ab0.87 ab
TL600.85 a0.9 a0.83 ab0.88 ab
Significance* 2***
1 Means followed by the same letters within same column are not statistically different (p < 0.05), by the various letters – statistically different. 2 *: effect significant at p < 0.05.
Table 6. Effect of treatments and years on the soil structural coefficients (Ks, 0–20 cm).
Treatment/Year2015201620172019
C2.5 b 13.1 d2.6 c1.7 c
PG52.6 b3.2 d3.1 b1.9 c
PG102.8 b4.5 b2.9 bc2.0 bc
PG202.5 b5.7 a2.7 bc2.2 bc
PG3.6TL36.42.9 b3.7 c2.7 bc1.8 c
PG5.5TL54.52.8 b4.2 bc3.2 b2.3 bc
PG6.7TL33.33.2 ab4.6 b3.8 a1.8 c
PG10TL503.6 a5.5 a4.0 a2.8 ab
PG13.3TL26.73.4 a5.3 a3.8 a3.2 a
PG20TL403.2 ab4.4 b3.3 b2.7 ab
TL403.1 ab4.3 b2.8 bc2.6 b
TL603.3 ab4.6 b2.9 b2.7 ab
Significance* 2***
1 Means followed by the same letters within same column are not statistically different (p < 0.05), by the various letters – statistically different. 2 *: effect significant at p < 0.05.
Table 7. Effect of treatments and years on soil water-physical properties/characteristics.
Treatment/Characteristic (Average in all Years)Soil Moisture ReservesSoil Aggregate Stability CoefficientsSoil Structural Coefficients
C146.0 c 10.80 b2.5 c
PG5144.6 c0.82 b2.7 c
PG10141.4 c0.83 ab3.1 bc
PG20146.0 c0.84 ab3.3 b
PG3.6TL36.4151.4 bc0.84 ab2.8 bc
PG5.5TL54.5157.0 ab0.84 ab3.1 bc
PG6.7TL33.3161.8 a0.84 ab3.4 ab
PG10TL50161.4 a0.86 a4.0 a
PG13.3TL26.7159.6 a0.84 ab3.9 a
PG20TL40157.2 ab0.84 ab3.4 ab
TL40158.8 a0.84 ab3.2 b
TL60159.0 a0.87 a3.4 ab
Significance* 2**
Years (Average of all Treatments)
2015153.5 b0.83 ab3.0 b
2016136.3 c0.85 ab4.4 a
2017163.1 a0.81 b3.2 b
2018155.8 abND 3ND
2019159.8 a0.87 a2.3 c
Significance*****
1 Means followed by the same letters within same column are not statistically different (p < 0.05), by the various letters – statistically different. 2 *, **: effect significant at p < 0.05, and p < 0.01, respectively. 3 ND – not defined.
Table 8. Effect of treatments and years on the soil pHKCl at 0–20 cm layer.
Treatment/Year and Season20152016201720182019
SpringAutumnSpringAutumnAutumn
C4.8 b 15.1 b4.9 b5.0 b5.1 ab5.1 b5.1 b
PG54.9 b5.1 b4.9 b5.0 b5.0 b5.2 b5.1 b
PG105.0 b5.0 b4.8 b5.0 b4.9 b5.2 b5.1 b
PG204.9 b5.0 b4.8 b4.9 b4.8 b5.2 b5.1 b
PG3.6TL36.45.4 ab5.4 ab5.1 ab5.2 ab5.2 ab5.2 b5.2 b
PG5.5TL54.55.5 ab5.2 b5.1 ab5.2 ab5.2 ab5.2 b5.4 ab
PG6.7TL33.35.8 a5.2 b5.2 ab5.0 b5.0 b5.2 b5.0 b
PG10TL506.2 a5.9 a5.5 a5.0 b5.1 ab5.7 ab5.7 a
PG13.3TL26.75.9 a5.7 ab5.4 a5.1 ab5.2 ab5.9 a5.8 a
PG20TL406.1 a5.8 a5.6 a5.6 a5.7 a5.4 ab5.2 b
TL406.1 a5.5 ab5.4 a5.0 b5.1 ab5.3 ab5.1 b
TL606.2 a5.5 ab5.3 a5.1 ab5.1 ab5.2 ab5.2 b
Significance* 2******
1 Means followed by the same letters within same column are not statistically different (p < 0.05), by the various letters – statistically different. 2 *: effect significant at p < 0.05.
Table 9. Effect of treatments and years on the content of organic carbon (Corg, %) at 0–20 cm soil layer.
Treatment/Year20152016201720182019
C3.83 c 1 I3.81 b3.84 b I, VI3.79 b3.82 b
PG53.79 c II3.81 b3.85 b I, VI3.83 b3.85 b V, VII
PG103.90 bc3.90 b V3.85 b I, VI3.85 b3.86 b V, VII
PG203.92 bc3.88 b3.87 b I, VI3.85 b3.85 b V, VII
PG3.6TL36.43.99 ab4.02 ab3.97 ab3.95 b IV3.92 ab
PG5.5TL54.54.12 a III4.15 a4.09 a4.07 ab4.00 a
PG6.7TL33.33.97 bc IV3.99 ab4.01 ab4.02 ab4.00 a
PG10TL504.03 ab4.03 ab4.07 a4.05 ab4.01 a
PG13.3TL26.73.92 bc3.96 b IV3.98 ab4.01 ab3.98 ab
PG20TL404.01ab4.04 ab4.05 ab4.07 ab4.06 a
TL404.09 ab4.11 ab4.07 a4.08 ab4.01 a
TL604.18 a4.18 a4.12 a4.15 a4.05 a
Significance** 2********
1 Means followed by the same letters within same column are not statistically different (p < 0.05), by the various letters– statistically different. 2 **: effect significant at p < 0.01 and of pairs: I – PG10TL50; II – PG3.6TL36.4; III – PG13.3TL26.7; IV – TL60; V – PG5.5TL54.5; VI –TL40; VII – PG6.7TL33.3 at p < 0.05.
Table 10. Effect of treatments and years on the content of ammonium nitrogen (NH4+-N, mg kg–1) at 0–20 cm soil layer.
Treatment/Year and Season20152016201720182019
SpringAutumnSpringAutumnAutumn
C4.20 i 11.50 c I, II2.00 c1.50 c2.20 b1.20 bc3.70 a
PG54.50 i1.60 c I, II4.20 b1.00 c III1.70 b0.40 c4.00 a
PG105.20 i1.50 c I, II3.00 bc0.30 d1.10 b0.90 bc3.10 a
PG205.10 i1.60 c I, II3.50 bc0.60 cd1.60 ab1.80 b2.90 a
PG3.6TL36.4145.50 g13.00 b4.50 b2.30 bc2.50 ab1.90 b2.50 a
PG5.5TL54.5361.90 e56.50 a8.30 a2.40 bc4.70 a1.80 b3.50 a
PG6.7TL33.3159.80 f13.70 b5.80 b2.40 bc2.50 ab2.00 ab2.90 a
PG10TL50418.80 c53.90 a5.00 b3.50 b4.30 a2.60 ab3.20 a
PG13.3TL26.7117.60 h11.40 b4.10 b3.10 b2.80 ab1.90 b2.70 a
PG20TL40379.90 d56.80 a7.20 ab5.20 ab4.90 a4.00 a3.50 a
TL40468.10 b13.30 b9.10 a7.70 a4.10 a4.20 a4.00 a
TL60565.90 a18.10 b9.30 a8.30 a5.10 a4.00 a4.10 a
Significance** 2************
1 Means followed by the same letters within same column are not statistically different (p < 0.05), by the various letters – statistically different. 2 **: effect significant at p < 0.01 and of pairs: I – PG3.6TL36.4; II – TL40; III – PG10 at p < 0.05.
Table 11. Effect of treatments and years on the content of nitrate nitrogen (NO3-N, mg kg–1) at 0–20 cm soil layer.
Treatment/Year and Season20152016201720182019
SpringAutumnSpringAutumnAutumn
C10.5 i 14.2 f8.6 e10.1 d7.8 ab5.5 b VI4.1 c
PG514.8 h4.8 f10.5 e11.1 d7.5 ab3.9 b2.4 c
PG1021.2 g7.6 f II9.4 e13.1 d6.9 ab4.1 b3.1 c
PG2023.4 g12.4 e8.1 e8.9 d4.9 b3.7 b5.6 c
PG3.6TL36.4109.8 c54.1 d20 d19.8 c4.8 b4.9 ab7.0 bc
PG5.5TL54.5123.5 a111.8 a43.1 ab27.0 bc10.0 a I, II6.4 ab11.3 a I
PG6.7TL33.377.8 f64.1 c22.5 d23.5 c9.1 a5.0 ab6.7 bc
PG10TL50117.2 b108.8 a40.1 b III36.3 a9.8 a I, II9.1 ab9.3 ab
PG13.3TL26.788.3 e62.6 c18.8 d14.8 d I10.5 a9.2 ab11.9 a
PG20TL40117.1 b98.7 b45.1 a30.2 b IV, V7.2 ab3.9 b5.1 c
TL4096.4 d I61.2 c33 c30.3 b IV, V10.6 a9.6 a5.3 c
TL60104.6 c63.9 c38.8 b36.4 a11.6 a8.8 ab10.1 ab
Significance** 2************
1 Means followed by the same letters within same column are not statistically different (p < 0.05), by the various letters – statistically different. 2 **: effect significant at p < 0.01 and of pairs: I – PG3.6TL36.4; II – PG20; III – PG20TL40; IV – PG10TL50; V – TL60; VI – TL40 at p < 0.05.
Table 12. Effect of treatments and years on the content of alkaline hydrolysable nitrogen (AH-N, mg kg–1) at 0–20 cm soil layer.
Treatment/Year and Season20152016201720182019
SpringAutumnSpringAutumnAutumn
C168 g 1168 b168 b119 b120 b168 ab154 ab
PG5168 g168 b154 b154 a154 ab154 ab147 b
PG10154 g196 ab140 b168 a154 ab140 b147 b
PG20154 g196 ab147 b154 a152 ab168 ab154 ab
PG3.6TL36.4448 f196 ab224 a147 ab150 ab175 a161 ab
PG5.5TL54.5560 d224 a224 a154 a152 ab168 ab168 ab
PG6.7TL33.3504 e196 ab196 a161 a154 ab182 a175 ab
PG10TL501064 b224 a196 a154 a152 ab182 a182 a
PG13.3TL26.7420 f196 ab196 a154 a151 ab168 ab168 ab
PG20TL40896 c192 ab196 a154 a154 ab168 ab168 ab
TL401092 b210 a196 a161 a160 a168 ab168 ab
TL601148 a224 a224 a175 a172 a168 ab175 ab
Significance* 2******
1 Means followed by the same letters within same column are not statistically different (p < 0.05), by the various letters – statistically different. 2 *: effect significant at p < 0.05.
Table 13. Effect of treatments and years on the content of available phosphorus (Pav, mg kg–1) at 0–20 cm soil layer.
Treatment/Year and Season20152016201720182019
SpringAutumnSpringAutumnAutumn
C50 f 1 I44 d39 e I49 e I50 d53 f III50 e
PG574 e52 d53 de60 de60 d74 e72 d
PG1070 e57 d62 d70 d65 d80 e75 d
PG2096 d94 c89 c100 c99 c106 d103 c
PG3.6TL36.4217 c179 b181 a159 a II154 ab154 c IV159 b
PG5.5TL54.5267 b195 ab190 a164 a162 a168 bc165 b
PG6.7TL33.3204 c176 b172 a159 a II160 a I174 b V180 ab
PG10TL50281 ab193 ab177 a172 a172 a179 ab175 b VI
PG13.3TL26.7280 ab177 b193 a169 a170 a173 b168 b
PG20TL40291 a II206 a181 a169 a171 a182 ab195 a
TL40270 b179 b148 b139 b140 b164 bc158 b
TL60282 ab212 a174 b175 a172 a195 a184 ab
Significance** 2************
1 Means followed by the same letters within same column are not statistically different (p < 0.05), by the various letters – statistically different. 2 **: effect significant at p < 0.01 and of pairs: I – PG10; II – TL40; III – PG5; IV – PG6.7TL33.3; V – TL60; VI – PG20TL40 at p < 0.05.
Table 14. Effect of treatments and years on the content of exchangeable potassium (Kex, mg kg–1) at 0–20 cm soil layer.
Treatment/Year201620172019
C150 f 1155 d165 d
PG5170 f175 cd170 d
PG10135 f160 d160 d
PG20150 f160 d155 d
PG3.6TL36.4255 e210 b165 d
PG5.5TL54.5310 d200 b I210 bc
PG6.7TL33.3225 e200 b I160 d
PG10TL50440 b235 ab275 a
PG13.3TL26.7360 c270 a280 a
PG20TL40500 a250 a190 cd
TL40225 e200 b I185 cd
TL60300 d275 a235 b
Significance** 2****
1 Means followed by the same letters within same column are not statistically different (p < 0.05), by the various letters – statistically different. 2 **: effect significant at p < 0.01 and of pair: I – PG5 at p < 0.05
Table 15. Effect of treatments and years on soil agrochemical properties/characteristics.
Treatment/Characteristic (Average in all Years (Seasons))pHKClCorgNH4+-NNO3-NAH-NPavKex
C5.0 b 13.82 c2.3 e7.3 c152 f48 e157 f
PG55.0 b3.83 c2.5 e7.9 c157 f64 d172 e
PG105.0 b3.87 bc2.2 e9.3 c157 f68 d152 f
PG205.0 b3.87 bc2.4 e9.6 c161 f98 c155 f
PG3.6TL36.45.2 ab3.97 b24.6 d31.5 b214 e172 b210 d
PG5.5TL54.55.3 ab4.09 ab62.7 c47.6 a236 d187 a240 c
PG6.7TL33.35.2 ab4.00 ab27.0 d29.8 b224 de175 b195 d
PG10TL505.6 a4.04 ab70.2 b47.2 a308 b193 a317 a
PG13.3TL26.75.6 a3.97 b20.5 d30.9 b208 e190 a303 a
PG20TL405.6 a4.05 ab65.9 c43.9 a275 c199 a313 a
TL405.4 a4.07 ab72.9 b35.2 b308 b171 b203 d
TL605.4 a4.14 a87.8 a39.2 ab327 a199 a270 b
Significance**********
Year (Season) (Average of all Treatments)
2015 (spring)5.6 aND3219.7 a75.4 a565 a199 aND
2015 (autumn)5.4 ab3.9820.2 b54.5 b199 b147 bND
2016 (spring)5.2 bND5.5 c24.8 c188 b138 bND
2016 (autumn)5.1 b3.993.2 c21.8 c155 c132 b268
20175.1 b3.983.1 c8.4 d152 c131 b208
20185.3 ab3.982.2 c6.2 d167 bc142 bND
20195.3 ab3.953.3 c6.8 d164 bc140 b196
Significance* 2ns********
1 Means followed by the same letters within same column are not statistically different (p < 0.05), by the various letters – statistically different. 2 ns, *, **: effect not significant or significant at p < 0.05 and p < 0.01, respectively. 3 ND – not defined.
Table 16. Effect of treatments and years on potato yield (t ha–1); content of nitrates, lead and cadmium in potato tubers (mgˑkg–1 dry weight).
Treatment/Parameter and YearPotato YieldNitrates (NO3)Lead (Pb)Cadmium (Cd)
2015201620172015201620152015
C13.3 f 211.9 c8.4 c29.2 g30.0 e0.060.018
PG515.5 f13.3 bc9.8 c29.2 g30.0 e0.040.018
PG1016.0 f12.1 c9.8 c42.0 f32.8 de0.060.020
PG2023.0 e11.7 c8.2 c68.5 e40.5 d0.060.017
PG3.6TL36.427.0 d15.2 bc15.8 a119.0 d91.2 c0.040.016
PG5.5TL54.538.0 b18.3 a16.5 a182.0 c140.0 b0.070.014
PG6.7TL33.332.7 c17.5 ab16.4 a222.0 b160.9 b0.070.015
PG10TL5036.8 b20.4 a16.0 a368.0 a220.3 a0.070.020
PG13.3TL26.729.0 d14.2 bc14.1 ab372.5 a220.3 a0.060.020
PG20TL4034.8 bc18.8 a13.0 b377.0 a220.3 a0.070.026
TL4043.2 a17.7 ab15.8 a191.0 bc142.2 b0.070.024
TL6039.5 b18.3 a16.3 a367.0 a218.4 a0.070.018
MPC 1 2500.50.03
Significance* 3******nsns
1 MPC: maximum permissible concentration. 2 Means followed by the same letters within same column are not statistically different (p < 0.05), by the various letters – statistically different. 3 ns, *, **: effect not significant or significant at p < 0.05 and p < 0.01, respectively.
Publisher’s Note: MDPI stays neutral with regard to jurisdictional claims in published maps and institutional affiliations.

