Article

Soil Enzyme Activities Affect SOC and TN in Aggregate Fractions in Sodic-Alkali Soils, Northeast of China

1
Northeast Agricultural Research Center of China, Jilin Academy of Agricultural Sciences, Changchun 130033, China
2
Institute of Agricultural Economy and Information, Jilin Academy of Agricultural Sciences, Changchun 130033, China
3
Institute of Agricultural Resources and Environment, Jilin Academy of Agricultural Sciences, Changchun 130033, China
4
Institute of Grassland and Ecology, Jilin Academy of Agricultural Sciences, Changchun 130033, China
*
Authors to whom correspondence should be addressed.
Agronomy 2022, 12(10), 2549; https://doi.org/10.3390/agronomy12102549
Submission received: 11 August 2022 / Revised: 2 October 2022 / Accepted: 14 October 2022 / Published: 18 October 2022

Abstract

:
Soil enzymes strongly affect soil organic carbon (SOC) and nitrogen (TN) storage. However, few studies have focused on their relationships in aggregates, especially in sodic-alkali agricultural fields. In the current study, we hypothesized that the impact of soil enzymes on SOC and TN were different within aggregates for their heterogeneous distribution. Soils collected from the surface (0–20 cm) and subsurface (20–40 cm) layers of sodic-alkali agricultural fields in the northeast of China were separated via the dry sieve method into macro-aggregates (>2000 μm), meso-aggregates (250–2000 μm), and micro-aggregates (<250 μm). SOC, TN, microbial biomass carbon (MBC) and nitrogen (MBN), and C- and N-cycling enzymes, namely amylase (AMY), invertase (INV), β-glucosidase (GLU), catalase (CAT), β-N-acetylglucosaminidase (NAG), and urease (URE) in soil aggregates were tested and analyzed. High content of SOC and TN were observed in macro- and meso-aggregates in both layers, with the largest amount detected in meso-aggregates. The highest values of MBC and MBN were observed in meso-aggregates, followed by micro-aggregates for MBC and macro-aggregates for MBN. Soil enzymes were distributed heterogeneously in soil aggregates, where the activities of AMY, INV, and URE in both layers were in the order of meso-aggregates > macro-aggregates > micro-aggregates. The same trend was followed by NAG of surface soils, while in the subsurface soils, NAG activities increased with the increasing aggregate sizes. NAG activities in both layers decreased with decreasing aggregate sizes. The GLU activity rose with the decreasing aggregate sizes in both layers, contrary to CAT. Enzyme activities affect SOC and TN in soil aggregates, for NAG, INV, GLU, and URE are closely related to SOC and TN across aggregate sizes. The test indices mentioned above in the surface layer were higher than those in the subsurface layer. These results indicate that biophysical processes associated with C- and N-cycling enzymes may be vital to the SOC and TN sequestration within soil aggregates in sodic-alkali agricultural fields.

1. Introduction

Soils are receiving increasing global concern for their vital role in guaranteeing grain yields and mitigating global climate change [1]. Soil is the largest and most sensitive carbon (C) reservoir with a storage of 2500 Gt in the terrestrial ecosystem [2]. The tiny C alteration in soils would place a heavy budget on the global C cycling [3]. Soil C loss, such as CO2 emitted via soil C mineralization or soil respiration, is induced by soil micro-organisms, whose growth and reproduction are influenced by soil nitrogen (TN) status [4,5]. Hence, soil organic C (SOC) and TN are critical in balancing soil C storage and mineralization, even to help alleviate global warming [6].
Salt-affected soils, a more extensive degraded soil [7,8], affect approximately 932 million ha of land globally [9,10]. Sodic soils, grouped with alkali, are a crucial category of salt-affected soils with an excess of exchangeable sodium and low soluble salt content [11,12,13]. Sodic soils exhibit unique structural problems because of the physical processes (slaking, swelling, and dispersion of clay) and specific conditions (surface crusting and hard setting) [12,14]. At the same time, they are valuable resources for crop production to meet the challenge of global food security.
Soil aggregates are essential units of soil structure, storing 90% of SOC in the surface soils and offering physical protection to SOC from being decomposed and utilized by soil micro-organism [6,15,16]. Soil aggregates are mainly divided into macro-aggregates (>250 μm) and micro-aggregates (<250 μm) by size, for aggregate sizes are associated with the heterogeneous distribution of SOC [6,17]. Some researchers proposed that macro-aggregates occluded more SOC than micro-aggregates [5,18,19], whereas the opposite result was observed as Mao et al. reported that micro-aggregates contained significantly more SOC and TN than macro-aggregates [20,21]. Both biotic and abiotic factors may be related to the inconsistent findings. Soil aggregates provide micro-organisms with microscopic habitats to live in [22], in which the internal constraints, i.e., substrate availability, water, and gas movement, and soil properties, etc., affect the biophysical and biochemical processes and drive microbial decomposition and utilization of SOM within aggregates [23,24,25].
Soil enzymes, synthetized and secreted by soil micro-organisms and plant roots [26,27,28], are the primary medium regulating the biochemical processes participating in the metabolism of SOC and catalyzing its accumulation and mineralization [29,30]. A range of soil enzymes are linked to SOC, TN cycling, and their turnover processes [31]. For instance, amylase (AMY) hydrolyzes soil carbohydrates into glucose, providing absorbable nutrient elements for plants and micro-organisms [7]. Invertase (INV) plays a critical role in the release of low molecular weight C compounds [6,20]. The β-glucosidase (BG) enzyme involves the degradation of cellulose chains into smaller units, closely related to SOC mineralization [32,33]. Catalase (CAT) can prevent its toxic effects on organisms by enabling the peroxide produced during metabolism to decompose [34]. Urease (URE) and N-acetyl-β-D-glucosaminidase (NAG) are closely related to TN cycling in soil ecosystems [31,35]. Urease promotes the hydrolysis of nitrogen-containing organic carbon into ammonium [36], while NAG is a catalyst for hydrolysis of N-acetyl-β-D-glucosamine residue from the terminal nonreducing ends of chitooligosaccharides and amino sugar of organic nitrogen in soils [37]. Soil enzyme activities regulate the decomposition and storage of SOC. However, few studies have focused on the effects of enzymes on SOC and TN in soil aggregates from sodic-alkali fields [38].
Our previous studies have found that maize cultivation in sodic-alkali soils has significantly improved soil physical-chemical properties, enriching SOC content and increasing enzyme activities [39]. Soil enzymes showed positive relationships with SOC storage, where INV and CAT were closely related to SOC in the studied areas [39]. Aggregates are a major residence of micro-organisms and store large amounts of SOC and TN in soil, which means most biochemical reactions, including reactions between SOC, TN, and enzymes, take place inside of aggregates. Thus, gaining insight into relationships between SOC, TN, and enzymes within aggregate fractions in sodic-alkali soils will contribute to understanding the mechanisms of SOC and TN cycling in sodic-alkali soils. In the present study, the responses of six soil enzymes, including AMY, INV, BG, CAT, URE, and NAG, catalyzing the decomposition of SOC and TN were determined within different aggregate fractions in sodic-alkali soils. We hypothesized that the function of soil enzymes on SOC and TN would differ with soil aggregate sizes in sodic-alkali soils for their heterogeneous distribution. The specific objectives of the study were (i) to determine the spatial distributions of SOC, TN, and enzymes within the three aggregate-sizes in sodic-alkali soils, (ii) to assess the major enzymes driving SOC and TN in different aggregate-size fractions.

2. Materials and Methods

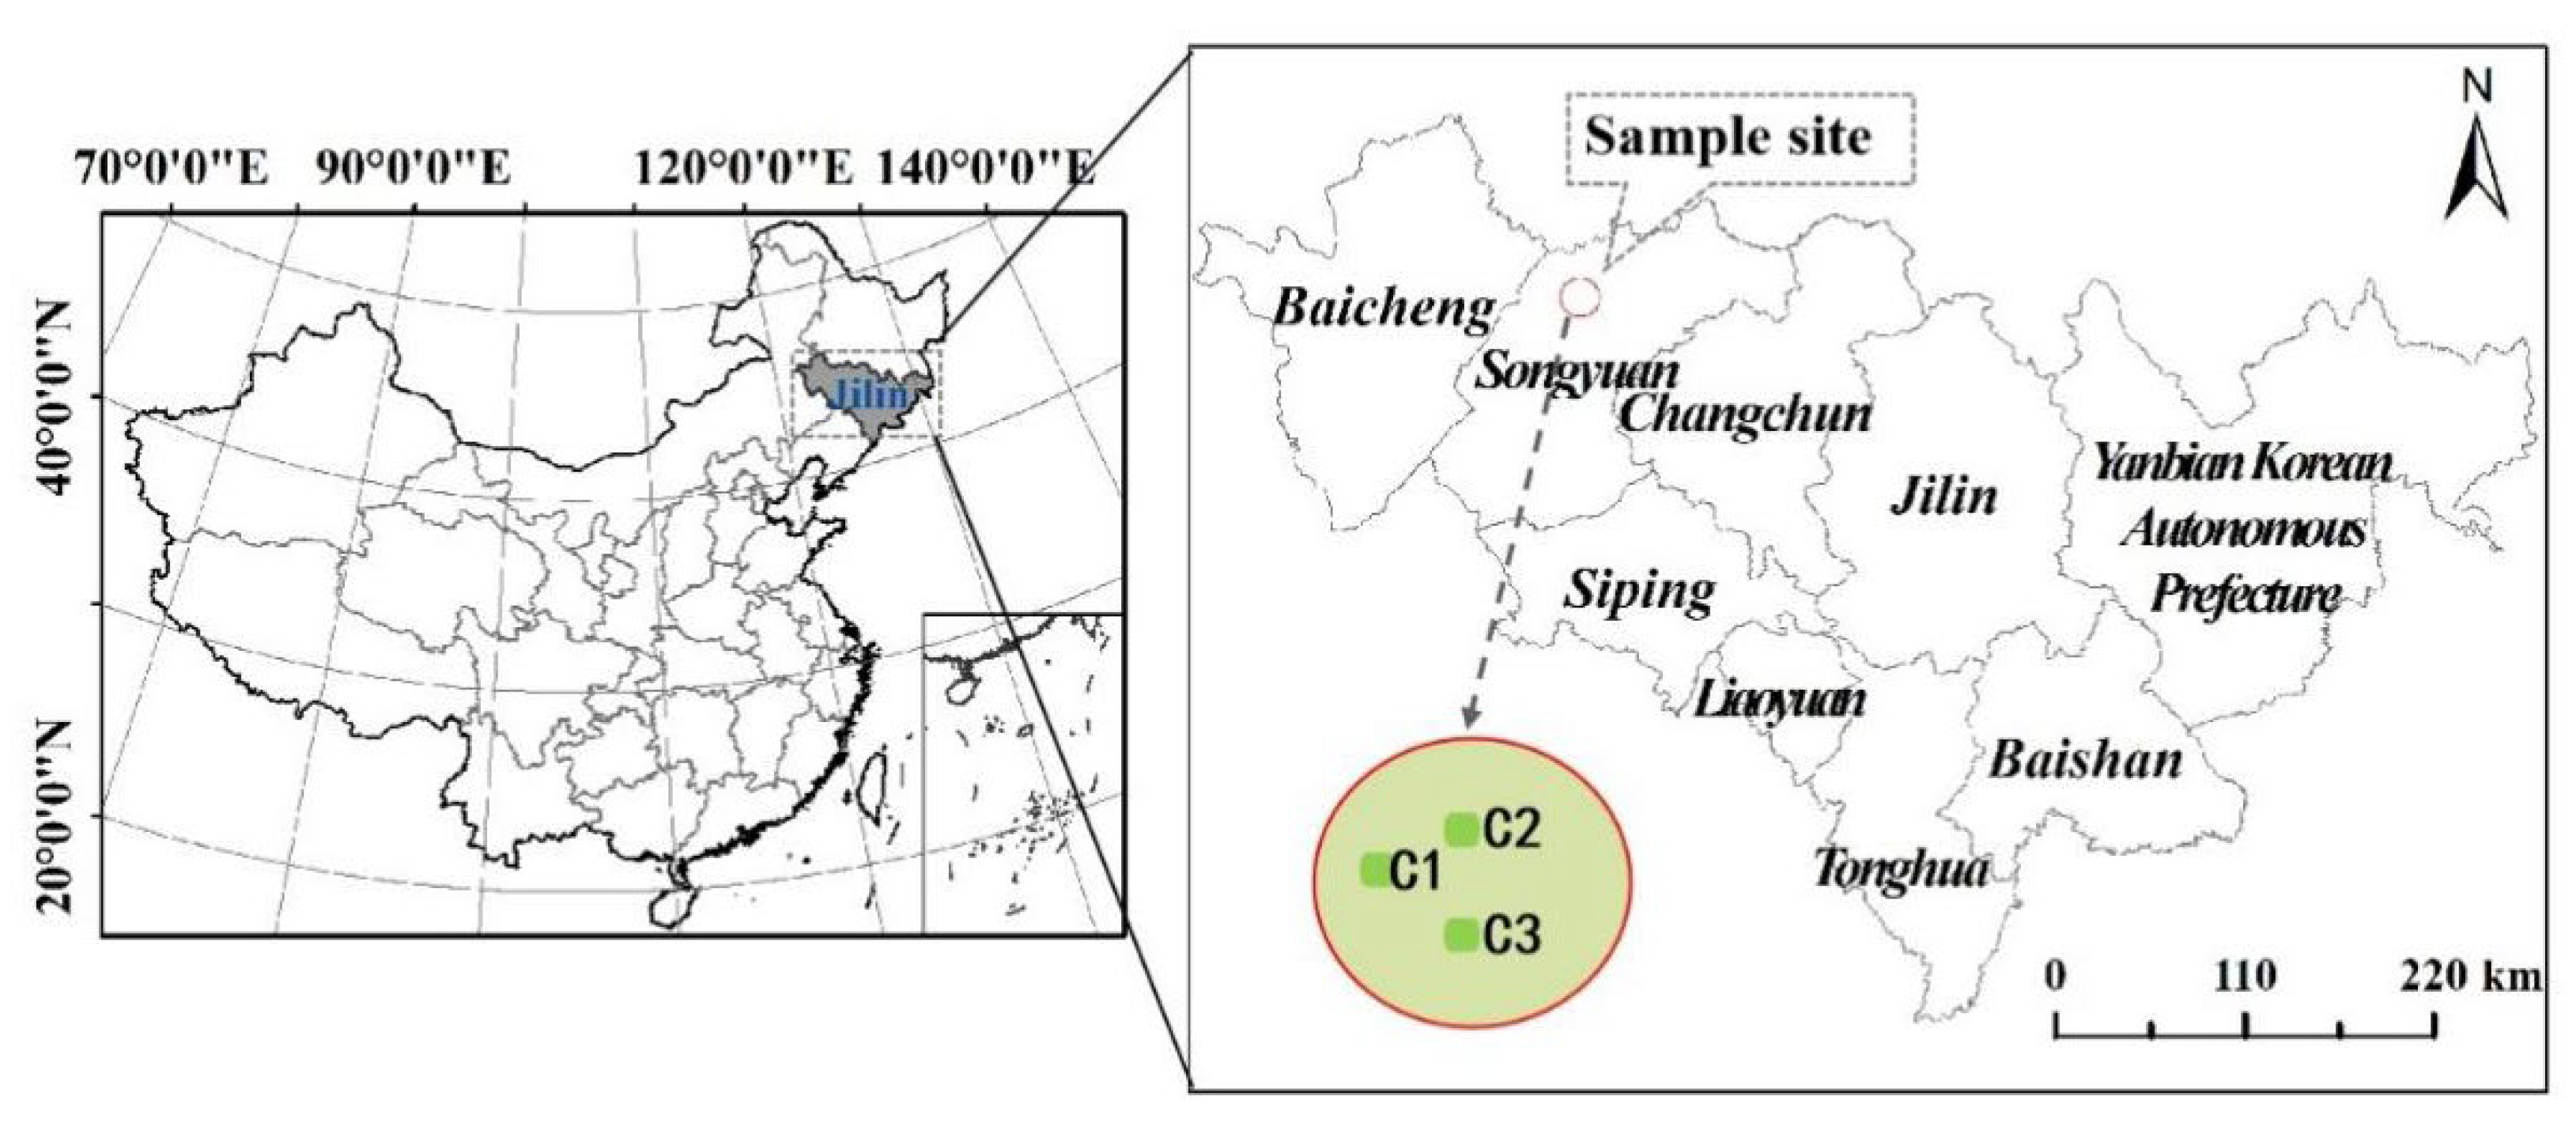
2.1. Sites and Soil Sampling

Songnen Plain, an immense plain in northeast of China, is the central agricultural region and the essential production base of cereal crops [40,41]. However, one-third of the land in Songnen plain is saline-sodic [42]. The field experiment was conducted in Songyuan city of Jilin Province (124°17’55″ E, 45°00’39″ N) (Figure 1), a city in the south of Songnen Plain, where sodic-alkali soils were massively spread. It is a typical semi-arid and semi-humid monsoon climate with July as the hottest month of the year with a mean temperature of 23 °C, while December is the coldest month, with a mean temperature of −14.5 °C. The mean annual temperature is 6.7 °C and the annual rainfall is 513.6 mm. Maize (Zea mays L.) is the primary monoculture of cereal crops of the study area. Seeds are mechanically sown in early May, and they are harvested in October every year. Fields are always plowed to the depth of 30 cm at late April, one week before seedling. Base fertilization (16% N–16% P2O5–16% K2O), with a rate of 200 kg ha−1, is applied using combined seed and fertilizer drill during sowing. Urea as a supplement is added into soil in June with a rate of 180 kg ha−1. After mechanical harvest, the above-ground crops are removed from the field, leaving the stubbles and roots in fields mixed into soils via tillage of the next year.
Low, moderate, and high sodic-alkali soils from maize fields, with exchangeable sodium percentage (ESP) of 6.31%, 15.17%, and 24.00% (Table 1), were sampled on 26 July 2017. They were sand-loam texture with 67.04–73.76% sand, 22.89–28.57% silt, and 3.35–4.39% clay. The SOC content in bulk soils of the three fields were 25.19 g kg−1, 22.87 g kg−1, and 16.46 g kg−1; TN in bulk soils were 1.68 g kg−1, 1.67 g kg−1, and 1.24 g kg−1, respectively. Soils in depths of 0–20 cm and 20–40 cm in each field were randomly collected by the metal auger with a diameter of 76 mm. Samples were sent to the lab packed in containers separately. The soils with stones, visible plant roots and residues removed by naked eyes, were sieved to 7-mm and then air-dried at room temperature in preparation for further analysis.

2.2. Aggregate Separation

Aggregates were isolated by the dry sieve method in the experiment [22]. Briefly, 500.0 g air-dried soil fragments were put on a nest of sieves (2 mm and 0.25 mm) to shake horizontally for 2 min at a rate of 30 rpm. Aggregates on 2 mm sieve were macro-aggregates (>2000 μm); aggregates passing through 2 mm sieve but still on 0.25 mm sieve were meso-aggregates (250–2000 μm); other soils passing through 0.25 mm sieve were micro-aggregates (<250 μm). The mass of each aggregate was weighed, and the mean weight diameter (MWD) was calculated using Rahman et al.’s method [3].
MWD = i = 1 3 X i × W i
where Xi (mm) is the average size of two sieves; Wi (%) is the mass proportion of each aggregate soils.

2.3. Soil Analysis

SOC was analyzed with a total organic carbon analyzer (Shimadzu TOC-V, Japan). TN analysis was performed using Kjeldahl digestion method. Soil microbial biomass C (MBC) and N (MBN) were determined with the fumigation-extraction method [43]. Briefly, 20 g refreshed soil were weighed into a 50 mL centrifuge tube, which was fumigated with chloroform (ethanol-free) for 24 h at the temperature of 25 °C and 60% of WHC. Meanwhile, another 20 g nonfumigated soil, as control, was incubated in the same condition. After that, soils were extracted using K2SO4 (80 mL, 0.5 mol L−1), which were shaken for 30 min at 300 rpm, filtered, and then analyzed by TOC Analyzer (Shimadzu TOC-V, Japan). MBC and MBN were calculated as the difference between fumigated and nonfumigated samples, with the efficiency factors of 0.45 and 0.54 for C and N, respectively [3].

2.4. Enzyme Assays

2.4.1. AMY Assay

AMY activity was estimated using 3,5-dinitrosalicylic acid (DNS) colorimetry method [44]. Briefly, 5.0 g air-drying soil mixing with the substrate of 10.0 mL starch solution (1%) and 10 mL phosphate buffer (pH = 5.5) were incubated in dark at 37 °C for 24 h, and then filtrated. The filtrate (1 mL) was reacted with 2 mL DNS for 5 min heating in water-bath and then cooled under tap water. The solution was diluted to 50 mL before analyzing at 508 nm using a spectrophotometer (UV-2100, UNICO, Shanghai, China). Solutions without starch or soils were also processed to determine AMY activity, which was expressed as μg glucose g−1 soil h−1.

2.4.2. INV Assay

INV activity was determined as described for AMY activity except that the substrate was 15 mL sucrose solution (8%), and the volumes of phosphate buffer and DNS were 5 mL and 3 mL, respectively. The activity was expressed as μg glucose g−1 soil h−1.

2.4.3. GLU Assay

GLU activity was determined by the colorimetry of p-nitrophenol released by β-glucosidase [45]. Briefly, 1.0 g soil was adequately mixed with 0.25 mL toluene, 4 mL modified universal buffer (pH = 6.0), and 1 mL p-nitrophenyl-β-D-glucopyranoside (PNPG, 0.25 mmol L−1), incubated at 37 °C for 1 h. After that, 1.0 mL CaCl2 (0.5 mol L−1) and 4 mL trishydroxymethyl aminomethane NaOH (pH = 12.0) were added into the solution, respectively. Controls without PNPG or soils were both used. GLU activity was determined at 400 nm in a spectrophotometer and was expressed as μg p-nitrophenol g−1 soil h−1.

2.4.4. CAT Assay

CAT activity was assayed following the method developed by Ren et al. [46]. Briefly, 2 g air-dried soil mixed with 40.0 mL deionized water and 5 mL H2O2 (0.3%) were shaken for 20 min at the speed of 150 rpm. After that, 5 mL H2SO4 (1.5 mol L−1) was added as a stopping reagent and the mixture was filtered and then titrated with KMnO4 (0.02 mol L−1). CAT activity was expressed as mL KMnO4 g−1 soil h−1.

2.4.5. NAG Assay

NAG activity was determined using the method of Parham and Deng [47]. Briefly, 1.0 g soil was mixed with 4.0 mL acetate buffer (100 mmol L−1, pH = 5.5) and 1.0 mL p-Nitrophenyl-N-acetyl-β-D- glucosaminide (pNNAG, 10 mmol L−1), and incubated at 37 °C for 1 h. After that, 1.0 mL CaCl2 (0.5 mol L−1) and 4.0 mL NaOH (0.5 mol L−1) were added into the solution to stop the reaction. The mixture was filtered and measured at 405 nm in a spectrophotometer. Controls without pNNAG or soil were also performed. NAG activity was expressed as μg p-nitrophenol g−1 soil h−1.

2.4.6. URE Assay

URE activity was determined by the sodium phenolate method [48]. Briefly, 5 g soil was mixed with 10 mL urea (10%) and 20.0 mL citrate buffer (C6H8O7 + KOH, pH = 6.7), and incubated for 24 h at 38 °C. Then, the mixture was diluted to 100 mL with distilled water (38 °C). After filtering, 1 mL solution was mixed homogeneously with 9 mL distilled water, 4 mL sodium phenolate (1.35 mol L−1), and 3 mL sodium hypochlorite solution (0.9%). After 20 min, URE activity was determined using a spectrophotometer at 578 nm and was expressed as μg NH4+-N g−1 soil h−1.

2.5. Statistical Analysis

Statistical analysis was performed with SPSS 19.0 software package (SPSS Inc., Chicago, IL, USA). One-way analysis of variance (ANOVA) using a least significant difference (LSD) test at p < 0.05 was performed to ascertain the effect of aggregate sizes (or sample plots) on soil components and enzyme activities. A t-test (p < 0.05) was used to assess the effect of soil depths on soil components and enzyme activities. The redundancy analysis (RDA) was conducted via CANOCO 5 software (Microcomputer Power, Inc., Ithaca, NY, USA) to assess the relative influences of soil enzyme activities on soil components in soil aggregate fractions. Figures were drawn with OriginPro 2017C (OriginLab Corporation, Northampton, MA 01060, USA).

3. Results

3.1. Soil Aggregate Distribution

Micro-aggregates dominated in the soil samples, accounting for the largest proportion (42.75–54.76%) of soil aggregates in the surface layer (0–20 cm) followed by meso-aggregates (32.78–42.45%). In the subsurface layer (20–40 cm), the proportion of micro-aggregates was the least ranging from 11.49 to 20.66% (Figure 2a). The MWD in surface soil ranged from 1 to 1.25 mm significantly lower than that in the subsurface layer (1.77–2.81 mm) (Figure 2b).

3.2. SOC, TN, MBC, and MBN Content in Aggregates

The contents of SOC and TN in macro- and meso-aggregates were larger than those in micro-aggregates (Table 2). The largest SOC was observed in meso-aggregates (12.01–28.28 g kg−1 soil) in the surface layer, while in the subsurface layer the largest SOC amount was detected in micro-aggregates. TN concentration in meso-aggregates was the largest, followed by macro-aggregates and micro-aggregates in both layers. The ratio of C/N ranged from 9.42 to 17.09 in the surface layer, where the largest value was detected in meso-aggregates, while it was from 10.86 to 16.50 in the subsurface layer, as macro-aggregates held the largest ratio. MBC and MBN in meso-aggregates were significantly larger than in other aggregates in both layers, although MBC in micro-aggregates in the surface layer was larger than in macro-aggregates, contrary to MBN. The MBC accounted for 0.2–1.14% of SOC. The ratio of MBC/SOC was in the order of meso-aggregates > macro-aggregates > micro-aggregates in both layers. Aggregate-associated SOC, TN, MBC, and MBN decreased with increasing soil depths.

3.3. Soil Enzyme Activities in Aggregates

High enzyme activities (AMY, INV, CAT, NAG, and URE) were observed in macro- and meso-aggregates (Figure 3), as the activities of AMY, INV, and URE were lower in macro-aggregates than in meso-aggregates. Similar to AMY, the highest enzyme activity of NAG was detected in meso-aggregates in the surface layer, whereas macro-aggregates carried the most NAG in the subsurface layer (Figure 3e). GLU activities, ranging from 113.68 to 183.28 μg p-nitrophenol g−1 soil h−1 in the surface layer, and increased with decreasing aggregate sizes (Figure 3c). Contrarily, the highest activity for CAT was observed in macro-aggregates in both soil layers, ranging from 1.26 to 2.10 mL KMnO4 g−1 soil h−1 (Figure 3d). Soil depths affected enzyme activities for they were significantly higher in the surface soils than those in the subsurface soils (excluding CAT in meso-aggregates, C3 plot), regardless of sample plots and aggregate sizes.

3.4. Redundancy Analysis between Soil Enzyme Activities and SOC, TN in Aggregates

RDA was used to explain SOC and TN using soil enzyme activities (AMY, INV, BG, CAT, NAG, and URE) in different aggregate-size soils (Figure 4). In macro-aggregates (Figure 4a), the first two axes accounted for 96.31% of the variance for axis 1 and 2 explained a variance of 96.23% and 0.08%, respectively. Significantly positive correlation between SOC and NAG, and TN and GLU were detected in macro-aggregates. In meso-aggregates (Figure 4b), axis 1 and 2 explained 94.99% and 0.06% of the total variance. Significantly positive relationships were observed between SOC and NAG, TN and URE in meso-aggregates. In micro-aggregates (Figure 4c), the first two axes explained 95.7% and 0.06% of the variance. SOC and NAG, TN, and URE showed significantly positive relationships in micro-aggregates.
The importance and significance levels of soil enzyme activities in soil aggregates are shown in Table 3. In macro-aggregates, the importance of soil enzymes in the order of NAG > INV > GLU > CAT > AMY. NAG, INV, GLU, and URE significantly explained 82.7%, 66.5%, 43.9%, and 31.3% of the variance in SOC and TN. In meso-aggregates and micro-aggregates, NAG, GLU, INV, and URE had significant effects on SOC and TN (p < 0.05). NAG and GLU carried the largest explanation, for they explained 87% and 72.6% of the variance in SOC and TN in meso-aggregates, and explained 85.7% and 66.3% of the variance in SOC and TN in micro-aggregates. NAG, INV, GLU, and URE were the most important enzymes in soil aggregates affecting SOC and TN in the current study.

4. Discussion

4.1. Soil Aggregate Distribution and Stability

Soil aggregates are physical structures of soil, and their distribution and stability play crucial roles in maintaining soil functions and cycling and storage of SOC and TN [49]. In the current study, the proportion of the aggregates (>250 μm), including macro-aggregates and meso-aggregates, was larger than micro-aggregates in both the surface and subsurface soils (Figure 2), which was consistent with previous studies [22,50]. Okolo et al. had reported that the proportion of dry macro- and meso-aggregates were dominant in cultivated land [51].
Tisdall and Oades proposed that primary particles (<20 μm) are firstly bound into micro-aggregates, which were combined into macro-aggregates and meso-aggregates by connecting materials [52]. Root exudates and the SOC derived from the decomposition of dead, and shoot residues, and hyphae are crucial cementing agents, mitigating soil aggregation [53,54,55]. In our study, the macro- and meso-aggregates in the surface soil were higher in C1 than in C2 and C3, which may be associated with SOC (Figure 2a, Table 1). In contrast, macro-aggregates in the subsurface layer of C3 accounted for the largest portion. This might be a result of the high content of carbonate, as Boix-Fayxos et al. documented that macro-aggregates are strongly related to carbonates at low SOC concentration [56].
MWD has been widely used to assess the structural stability of soils [57]. In our study, MWD in the surface layer was less than in the subsurface soils (Figure 2b), suggesting a lack of strong mechanical cohesion in the surface layer. The weak soil structure and aggregate stability are attributed to the disturbing practices originating from tillage operations, root growth, and raindrops [51,58].

4.2. SOC, TN, and Microbial Biomass in Soil Aggregates

SOC and TN were heterogeneously distributed in aggregate fractions in our study. They showed similar trends that SOC and TN accumulated in macro- and meso-aggregate fractions in both layers (Table 2). According to the hierarchy [52], the reason was attributed to the formation process of macro- and meso-aggregates, which combined micro-aggregates with organic binding agents derived from plant residues, fungal hyphae or fresh SOC input [19,24,59]. Additionally, the contribution of macro-aggregate mass to to highest SOC and TN content was consistent with previous findings [6]. Mustafa et al. observed large TN content in macro-aggregates [60], and Jiang et al. detected the highest OC content in meso-aggregates [61]. Similarly, the largest C/N ratio was observed in meso-aggregates, which demonstrated that younger and more labile organic matter is stored in meso-aggregates [62], in which the microbial biomass and activities were much higher than in other fractions.
Soil microbial biomass, including MBC and MBN is the most active component of SOC in regulating biogeochemical processes in terrestrial ecosystems [63]. In the current study, the large content of MBC and MBN in macro-aggregates and meso-aggregates indicated higher microbial biomass accumulation in the aggregates (>250 μm) than that in the micro-aggregates. This is in line with the highest content of SOC and TN in meso-aggregates, suggesting MBC and MBN content are positively correlated with SOC and TN concentration [64]. Six et al. [24] argued that the incorporation of fresh materials in soil provided soil fungi and other micro-organisms more easily available C to utilize, resulting in the formation of aggregates larger than 250 μm. On the other hand, the initial structures of aggregates affect soil biomass by influencing gaseous composition and transport, water flow, and aerobic or anaerobic status [65,66]. With high content of SOC, TN, and great heterogeneity in intra-aggregate pore distribution, meso-aggregates serve as “hotspots” for microorganisms to occupy [15].
Sodic-alkali status is a limited factor affecting SOC dynamics [9]. In the current study, we observed that SOC content decreased with increasing soil sodic-alkali condition across aggregate fractions. It could be related to the saline and alkali conditions, which had adverse effects on maize growth, including aboveground plants and belowground roots. Less developed roots-system plus poor soil structure in more sodic soils input less SOC into soils. The lower productivity of the more sodic soils would provide less biomass input to the soils. However, no similar trends were detected in TN, MBC, and MBN in aggregates, which needs to be further studied.

4.3. C- and N-Cycling Enzymes in Soil Aggregates

Soil aggregates are the primary habitats for soil micro-organisms [22]. Soil micro-organism activities, plant roots, and SOC content are major factors associated with soil enzyme activities [67]. Prior studies have reported that soil enzyme activities were unevenly distributed in aggregates, due to the variance in soil structure, environmental condition, and soil nutrient concentration [3,4,6]. Similar to the previous studies, in the current study, soil enzyme activities in macro-aggregates and meso-aggregates were higher than those in micro-aggregates (excluding GLU) (Figure 3). The macro- and meso-aggregates (>250 μm) wrapped more “new” SOC, which provides a sufficient material source for the enzymatic reaction and stimulates enzyme activity in aggregates [19]. Additionally, high enzyme activities are also associated with microbial biomass, MBC, and MBN, in macro- and meso-aggregates, as they are mainly produced by them. Therefore, high enzyme activities were observed in both macro- and meso-aggregates.
The hydrolases, such as INV, AMY, URE, and NAG, are closely related to the transformation and circulation of SOC [20,31]. INV and AMY play critical roles in the hydrolysis of sucrose and starch, while URE is associated with the hydrolysis of peptide bonds in SOC and NAG is associated with the decomposition of chitin and peptidoglycan [6,7,36,37]. In the current study, these hydrolases exhibited a similar distribution as their activities were in the order of meso-aggregates > macro-aggregates > micro-aggregates (NAG in the subsurface layer excluded), inferring a potential influence of macro- and meso-aggregates on enzymes. The larger aggregate particle size, together with a higher proportion of macro-pores and lower stability, may be one of the reasons why a higher hydrolase activity was detected in the meso-aggregates rather than macro-aggregates [19]. High SOC and MBC content in meso-aggregates is also a possible explanation for the high hydrolase activity in meso-aggregates. Marx et al. reported a significantly positive correlation between hydrolase activity and SOC content [68]. GLU is a kind of hydrolase generated by soil bacteria and fungi and is responsible for catalyzing cellulose hydrolysis. Different from the hydrolases mentioned above, GLU activities decreased with increasing soil aggregate sizes, and a high enzyme activity was detected in micro-aggregates (Figure 3) [69,70]. Since the decomposition and conversion of inert SOC require more GLU, the high content of inert SOC in micro-aggregates may be responsible, which needs to be investigated in future studies. As an oxidoreductase participating in the transformation of soil material and energy [34], CAT was positively correlated with aggregate sizes in the current study, which inferred potential impacts on macro- and meso-aggregates. The larger the aggregate size is, the faster the turnover rate of SOC is [19]. The newer SOC provides sufficient available substrates for enzymatic reactions, thus, enhancing CAT activities in macro-aggregates.
Soil enzymes exhibited vertical distribution such that in the surface layer, enzyme activities in soil aggregates were higher than in the subsurface layer. It was consistent with previous studies, which detected an obviously vertical distribution of soil enzymes, that is, CAT, URE, INV, and GLU activities decreased with increasing soil depth [20,46]. On the one hand, the metabolites of soil micro-organisms and soil animals are critical sources of soil enzymes [28]. There was richer SOC, better soil temperature, and greater porosity in the surface layer, where the suitable soil environment was beneficial to improve soil microbial activities and produce more enzymes. On the other hand, this might be attributed to the developed maize root system in the surface soil, for it releases large amounts of enzymes via metabolism [3]. In our previous studies, we have observed decreasing enzyme activities followed by increasing soil alkaline status and long-term maize cultivation [39]. However, no obvious relationships or significant increases or decreases in enzyme activity in aggregates following oil sodic-alkali status were detected among fields. This inferred soil sodic-alkali status may have a less direct influence on aggregate enzymes than SOC.
As a major media involved in the metabolism of SOC by catalyzing the accumulation and mineralization of soil nutrients, soil enzymes could reduce the reaction activation energy of polymers, such as cellulose, hemicellulose, and lignin, and break them down into monomers [71]. Soil enzymes play critical roles in the biological cycle of SOC and TN [30]. Large amounts of enzymes would be absorbed, and enzyme activities in different aggregates are heterogeneous as we hypothesized. RDA analysis showed that of the six C- and N-cycling enzymes, NAG, INV, GLU, and URE were the major enzymes affecting SOC and TN across aggregates, with NAG the most important (Table 3).

5. Conclusions

(1)
SOC, TN, MBC, and MBN were heterogeneously distributed in soil aggregates. SOC, TN, and MBN in aggregates were in the order of meso-aggregates > macro-aggregates > micro-aggregates. MBC in aggregates was in the order of meso-aggregates > micro-aggregates > macro-aggregates.
(2)
Soil activities of AMY, INV, CAT, NAG, and URE in macro- and meso-aggregates were more active than in micro-aggregates, while GLU activities increased with decreasing aggregate sizes in the studied sodic-alkali soils.
(3)
Soil enzyme activities affected SOC and TN, for NAG, INV, GLU, and URE were closely related to SOC and TN across aggregates in the current study.

Author Contributions

Conceptualization, J.W., H.C. and Z.L.; methodology, J.W.; software, K.S. and Y.F.; validation, J.W. and S.W.; formal analysis, J.W. and M.G.; investigation, C.Z.; data curation, J.W.; writing—original draft preparation, J.W.; writing—review and editing, J.W., H.C. and S.W.; project administration, H.C.; funding acquisition, J.W. All authors have read and agreed to the published version of the manuscript.

Funding

This research was funded by the Innovation Project of Jilin Academy of Agricultural Sciences, grant numbers E22010603 and CXGC2022RCB006.

Data Availability Statement

Not applicable.

Acknowledgments

We acknowledge Tang Jie and her students, Gong Zhiyu and Dai Yindong, for the technical support.

Conflicts of Interest

The authors declare no conflict of interest.

References

  1. Zhu, M.; Yang, S.; Ai, S.; Ai, X.; Jiang, X.; Chen, J.; Li, R.; Ai, Y. Artificial Soil Nutrient, Aggregate Stability and Soil Quality Index of Restored Cut Slopes along Altitude Gradient in Southwest China. Chemosphere 2020, 246, 125687. [Google Scholar] [CrossRef]
  2. Song, Y.; Yao, Y.; Qin, X.; Wei, X.; Jia, X.; Shao, M. Response of Carbon and Nitrogen to Afforestation from 0 to 5 m Depth on Two Semiarid Cropland Soils with Contrasting Inorganic Carbon Concentrations. Geoderma 2020, 357, 113940. [Google Scholar] [CrossRef]
  3. Kumar, A.; Dorodnikov, M.; Splettstößer, T.; Kuzyakov, Y.; Pausch, J. Effects of Maize Roots on Aggregate Stability and Enzyme Activities in Soil. Geoderma 2017, 306, 50–57. [Google Scholar] [CrossRef]
  4. Feng, J.; Wu, J.; Zhang, Q.; Zhang, D.; Li, Q.; Long, C.; Yang, F.; Chen, Q.; Cheng, X. Stimulation of Nitrogen-Hydrolyzing Enzymes in Soil Aggregates Mitigates Nitrogen Constraint for Carbon Sequestration Following Afforestation in Subtropical China. Soil Biol. Biochem. 2018, 123, 136–144. [Google Scholar] [CrossRef]
  5. Piazza, G.; Pellegrino, E.; Moscatelli, M.C.; Ercoli, L. Long-Term Conservation Tillage and Nitrogen Fertilization Effects on Soil Aggregate Distribution, Nutrient Stocks and Enzymatic Activities in Bulk Soil and Occluded Microaggregates. Soil Tillage Res. 2020, 196, 104482. [Google Scholar] [CrossRef]
  6. Wang, S.; Li, T.; Zheng, Z. Effects of Tea Plantation Age on Soil Aggregate-Associated C- and N-Cycling Enzyme Activities in the Hilly Areas of Western Sichuan, China. CATENA 2018, 171, 145–153. [Google Scholar] [CrossRef]
  7. Xie, X.; Pu, L.; Wang, Q.; Zhu, M.; Xu, Y.; Zhang, M. Response of Soil Physicochemical Properties and Enzyme Activities to Long-Term Reclamation of Coastal Saline Soil, Eastern China. Sci. Total Environ. 2017, 607–608, 1419–1427. [Google Scholar] [CrossRef]
  8. Wang, S.; Sun, L.; Ling, N.; Zhu, C.; Chi, F.; Li, W.; Hao, X.; Zhang, W.; Bian, J.; Chen, L.; et al. Exploring Soil Factors Determining Composition and Structure of the Bacterial Communities in Saline-Alkali Soils of Songnen Plain. Front. Microbiol. 2020, 10, 2902. [Google Scholar] [CrossRef] [Green Version]
  9. Wong, V.N.L.; Greene, R.S.B.; Dalal, R.C.; Murphy, B.W. Soil Carbon Dynamics in Saline and Sodic Soils: A Review: Soil Carbon Dynamics in Saline and Sodic Soils. Soil Use Manag. 2010, 26, 2–11. [Google Scholar] [CrossRef]
  10. Machado, R.; Serralheiro, R. Soil Salinity: Effect on Vegetable Crop Growth. Management Practices to Prevent and Mitigate Soil Salinization. Horticulturae 2017, 3, 30. [Google Scholar] [CrossRef]
  11. Paz, A.M.; Castanheira, N.; Farzamian, M.; Paz, M.C.; Gonçalves, M.C.; Monteiro Santos, F.A.; Triantafilis, J. Prediction of Soil Salinity and Sodicity Using Electromagnetic Conductivity Imaging. Geoderma 2020, 361, 114086. [Google Scholar] [CrossRef]
  12. Qadir, M.; Noble, A.D.; Schubert, S.; Thomas, R.J.; Arslan, A. Sodicity-Induced Land Degradation and Its Sustainable Management: Problems and Prospects. Land Degrad. Dev. 2006, 17, 661–676. [Google Scholar] [CrossRef]
  13. Rengasamy, P. Soil Processes Affecting Crop Production in Salt-Affected Soils. Funct. Plant Biol. 2010, 37, 613. [Google Scholar] [CrossRef]
  14. Qadir, M.; Oster, J.D.; Schubert, S.; Noble, A.D.; Sahrawat, K.L. Phytoremediation of Sodic and Saline-Sodic Soils. In Advances in Agronomy; Elsevier: Amsterdam, The Netherlands, 2007; Volume 96, pp. 197–247. ISBN 978-0-12-374206-3. [Google Scholar]
  15. Ananyeva, K.; Wang, W.; Smucker, A.J.M.; Rivers, M.L.; Kravchenko, A.N. Can Intra-Aggregate Pore Structures Affect the Aggregate’s Effectiveness in Protecting Carbon? Soil Biol. Biochem. 2013, 57, 868–875. [Google Scholar] [CrossRef]
  16. Jiang, Y.; Qian, H.; Wang, X.; Chen, L.; Liu, M.; Li, H.; Sun, B. Nematodes and Microbial Community Affect the Sizes and Turnover Rates of Organic Carbon Pools in Soil Aggregates. Soil Biol. Biochem. 2018, 119, 22–31. [Google Scholar] [CrossRef]
  17. Six, J.; Elliott, E.T.; Paustian, K. Aggregate and Soil Organic Matter Dynamics under Conventional and No-Tillage Systems. Soil Sci. Soc. Am. J. 1999, 63, 1350–1358. [Google Scholar] [CrossRef] [Green Version]
  18. Kushwaha, C.P.; Tripathi, S.K.; Singh, K.P. Soil Organic Matter and Water-Stable Aggregates under Different Tillage and Residue Conditions in a Tropical Dryland Agroecosystem. Appl. Soil Ecol. 2001, 16, 229–241. [Google Scholar] [CrossRef]
  19. Six, J.; Elliott, E.T.; Paustian, K. Soil Macroaggregate Turnover and Microaggregate Formation: A Mechanism for C Sequestration under No-Tillage Agriculture. Soil Biol. Biochem. 2000, 32, 2099–2103. [Google Scholar] [CrossRef]
  20. Miao, F.; Li, Y.; Cui, S.; Jagadamma, S.; Yang, G.; Zhang, Q. Soil Extracellular Enzyme Activities under Long-Term Fertilization Management in the Croplands of China: A Meta-Analysis. Nutr. Cycl. Agroecosyst. 2019, 114, 125–138. [Google Scholar] [CrossRef]
  21. Sainju, U.M.; Terrill, T.H.; Gelaye, S.; Singh, B.P. Soil Aggregation and Carbon and Nitrogen Pools under Rhizoma Peanut and Perennial Weeds. Soil Sci. Soc. Am. J. 2003, 67, 10. [Google Scholar] [CrossRef]
  22. Bach, E.M.; Hofmockel, K.S. Soil Aggregate Isolation Method Affects Measures of Intra-Aggregate Extracellular Enzyme Activity. Soil Biol. Biochem. 2014, 69, 54–62. [Google Scholar] [CrossRef]
  23. Sinsabaugh, R.L.; Lauber, C.L.; Weintraub, M.N.; Ahmed, B.; Allison, S.D.; Crenshaw, C.; Contosta, A.R.; Cusack, D.; Frey, S.; Gallo, M.E.; et al. Stoichiometry of Soil Enzyme Activity at Global Scale: Stoichiometry of Soil Enzyme Activity. Ecol. Lett. 2008, 11, 1252–1264. [Google Scholar] [CrossRef] [PubMed]
  24. Six, J.; Bossuyt, H.; Degryze, S.; Denef, K. A History of Research on the Link between (Micro)Aggregates, Soil Biota, and Soil Organic Matter Dynamics. Soil Tillage Res. 2004, 79, 7–31. [Google Scholar] [CrossRef]
  25. Wiesmeier, M.; Urbanski, L.; Hobley, E.; Lang, B.; von Lützow, M.; Marin-Spiotta, E.; van Wesemael, B.; Rabot, E.; Ließ, M.; Garcia-Franco, N.; et al. Soil Organic Carbon Storage as a Key Function of Soils—A Review of Drivers and Indicators at Various Scales. Geoderma 2019, 333, 149–162. [Google Scholar] [CrossRef]
  26. Akhtar, K.; Wang, W.; Ren, G.; Khan, A.; Feng, Y.; Yang, G. Changes in Soil Enzymes, Soil Properties, and Maize Crop Productivity under Wheat Straw Mulching in Guanzhong, China. Soil Tillage Res. 2018, 182, 94–102. [Google Scholar] [CrossRef]
  27. Katsalirou, E.; Deng, S.; Nofziger, D.L.; Gerakis, A. Long-Term Management Effects on Organic C and N Pools and Activities of C-Transforming Enzymes in Prairie Soils. Eur. J. Soil Biol. 2010, 46, 335–341. [Google Scholar] [CrossRef]
  28. Fernandes, S.A.P.; Bettiol, W.; Cerri, C.C. Effect of Sewage Sludge on Microbial Biomass, Basal Respiration, Metabolic Quotient and Soil Enzymatic Activity. Appl. Soil Ecol. 2005, 30, 65–77. [Google Scholar] [CrossRef]
  29. Huang, L.; Hu, W.; Tao, J.; Liu, Y.; Kong, Z.; Wu, L. Soil Bacterial Community Structure and Extracellular Enzyme Activities under Different Land Use Types in a Long-Term Reclaimed Wetland. J. Soils Sediments 2019, 19, 2543–2557. [Google Scholar] [CrossRef]
  30. Kim, H.; Nunan, N.; Dechesne, A.; Juarez, S.; Grundmann, G. The Spatial Distribution of Exoenzyme Activities across the Soil Micro-Landscape, as Measured in Micro- and Macro-Aggregates, and Ecosystem Processes. Soil Biol. Biochem. 2015, 91, 258–267. [Google Scholar] [CrossRef]
  31. Jian, S.; Li, J.; Chen, J.; Wang, G.; Mayes, M.A.; Dzantor, K.E.; Hui, D.; Luo, Y. Soil Extracellular Enzyme Activities, Soil Carbon and Nitrogen Storage under Nitrogen Fertilization: A Meta-Analysis. Soil Biol. Biochem. 2016, 101, 32–43. [Google Scholar] [CrossRef]
  32. Saiya-Cork, K.R.; Sinsabaugh, R.L.; Zak, D.R. The Effects of Long Term Nitrogen Deposition on Extracellular Enzyme Activity in an Acer Saccharum Forest Soil. Soil Biol. Biochem. 2002, 34, 1309–1315. [Google Scholar] [CrossRef]
  33. Turner, B.L.; Hopkins, D.W.; Haygarth, P.M.; Ostle, N. β-Glucosidase Activity in Pasture Soils. Appl. Soil Ecol. 2002, 6, 157–162. [Google Scholar] [CrossRef]
  34. Guangming, L.; Xuechen, Z.; Xiuping, W.; Hongbo, S.; Jingsong, Y.; Xiangping, W. Soil Enzymes as Indicators of Saline Soil Fertility under Various Soil Amendments. Agric. Ecosyst. Environ. 2017, 237, 274–279. [Google Scholar] [CrossRef]
  35. Trivedi, P.; Delgado-Baquerizo, M.; Trivedi, C.; Hu, H.; Anderson, I.C.; Jeffries, T.C.; Zhou, J.; Singh, B.K. Microbial Regulation of the Soil Carbon Cycle: Evidence from Gene–Enzyme Relationships. ISME J. 2016, 10, 2593–2604. [Google Scholar] [CrossRef] [PubMed] [Green Version]
  36. Liang, Y.; Yang, Y.; Yang, C.; Shen, Q.; Zhou, J.; Yang, L. Soil Enzymatic Activity and Growth of Rice and Barley as Influenced by Organic Manure in an Anthropogenic Soil. Geoderma 2003, 115, 149–160. [Google Scholar] [CrossRef]
  37. Ekenler, M. M., T. β-Glucosaminidase Activity of Soils: Effect of Cropping Systems and Its Relationship to Nitrogen Mineralization. Biol. Fertil. Soils 2002, 36, 367–376. [Google Scholar] [CrossRef]
  38. Chen, Q.; Wang, S.; Li, Y.; Zhang, N.; Zhao, B.; Zhuo, Y.; Chen, C. Influence of Flue Gas Desulfurization Gypsum Amendments on Heavy Metal Distribution in Reclaimed Sodic Soils. Environ. Eng. Sci. 2015, 32, 470–478. [Google Scholar] [CrossRef] [Green Version]
  39. Wang, J.; Tang, J.; Li, Z.; Yang, W.; Yang, P.; Qu, Y. Corn and Rice Cultivation Affect Soil Organic and Inorganic Carbon Storage through Altering Soil Properties in Alkali Sodic Soils, Northeast of China. Sustainability 2020, 12, 1627. [Google Scholar] [CrossRef] [Green Version]
  40. Liu, D.; Wang, Z.; Song, K.; Zhang, B.; Hu, L.; Huang, N.; Zhang, S.; Luo, L.; Zhang, C.; Jiang, G. Land Use/Cover Changes and Environmental Consequences in Songnen Plain, Northeast China. Chin. Geogr. Sci. 2009, 19, 299–305. [Google Scholar] [CrossRef]
  41. Tang, J.; Wang, J.; Li, Z.; Wang, S.; Qu, Y. Effects of Irrigation Regime and Nitrogen Fertilizer Management on CH4, N2O and CO2 Emissions from Saline–Alkaline Paddy Fields in Northeast China. Sustainability 2018, 10, 475. [Google Scholar] [CrossRef]
  42. Zhou, M.; Liu, X.; Meng, Q.; Zeng, X.; Zhang, J.; Li, D.; Wang, J.; Du, W.; Ma, X. Additional Application of Aluminum Sulfate with Different Fertilizers Ameliorates Saline-Sodic Soil of Songnen Plain in Northeast China. J. Soils Sediments 2019, 19, 3521–3533. [Google Scholar] [CrossRef]
  43. Brookes, P.C.; Landman, A.; Pruden, G.; Jenkinson, D.S. Chloroform Fumigation and the Release of Soil Nitrogen: A Rapid Direct Extraction Method to Measure Microbial Biomass Nitrogen in Soil. Soil Biol. Biochem. 1985, 17, 837–842. [Google Scholar] [CrossRef]
  44. Meruvu, H. Polyextremotolerant Amylase Produced from Novel Enterococcus with Potpourri of Applications. Int. J. Pept. Res. Ther. 2019, 25, 1669–1678. [Google Scholar] [CrossRef]
  45. Trasar-Cepeda, C.; Leirós, M.C.; Gil-Sotres, F. Hydrolytic Enzyme Activities in Agricultural and Forest Soils. Some Implications for Their Use as Indicators of Soil Quality. Soil Biol. Biochem. 2008, 40, 2146–2155. [Google Scholar] [CrossRef] [Green Version]
  46. Ren, C.; Kang, D.; Wu, J. ping; Zhao, F.; Yang, G.; Han, X.; Feng, Y.; Ren, G. Temporal Variation in Soil Enzyme Activities after Afforestation in the Loess Plateau, China. Geoderma 2016, 282, 103–111. [Google Scholar] [CrossRef]
  47. Parham, J.A.; Deng, S.P. Detection, Quanti®cation and Characterization of b- Glucosaminidase Activity in Soil. Soil Biol. 2000, 32, 1183–1190. [Google Scholar] [CrossRef]
  48. Ma, Y.; Fu, S.; Zhang, X.; Zhao, K.; Chen, H.Y.H. Intercropping Improves Soil Nutrient Availability, Soil Enzyme Activity and Tea Quantity and Quality. Appl. Soil Ecol. 2017, 119, 171–178. [Google Scholar] [CrossRef]
  49. Siebers, N.; Abdelrahman, H.; Krause, L.; Amelung, W. Bias in Aggregate Geometry and Properties after Disintegration and Drying Procedures. Geoderma 2018, 313, 163–171. [Google Scholar] [CrossRef]
  50. Hu, X.; Chen, J.; Zhu, L. Soil Aggregate Size Distribution and Stability of Farmland as Affected by Dry and Wet Sieving Methods. Zemdirb. -Agric. 2020, 107, 179–184. [Google Scholar] [CrossRef]
  51. Okolo, C.C.; Gebresamuel, G.; Zenebe, A.; Haile, M.; Eze, P.N. Accumulation of Organic Carbon in Various Soil Aggregate Sizes under Different Land Use Systems in a Semi-Arid Environment. Agric. Ecosyst. Environ. 2020, 297, 106924. [Google Scholar] [CrossRef]
  52. Tisdall, J.M.; Oades, J.M. Organic Matter and Water-Stable Aggregates in Soils. J. Soil Sci. 1982, 33, 141–163. [Google Scholar] [CrossRef]
  53. Bronick, C.J.; Lal, R. Soil Structure and Management: A Review. Geoderma 2005, 124, 3–22. [Google Scholar] [CrossRef]
  54. Gunina, A.; Ryzhova, I.; Dorodnikov, M.; Kuzyakov, Y. Effect of Plant Communities on Aggregate Composition and Organic Matter Stabilisation in Young Soils. Plant Soil 2015, 387, 265–275. [Google Scholar] [CrossRef]
  55. Zhang, P.; Zhang, Y.; Jia, J.; Cui, Y.; Wang, X.; Zhang, Y.; Zhang, X.; Wang, Y. Soil Aggregation and Aggregate-Associated Organic C and Total N as Affected by Revegetation Pattern at a Surface Mine on the Loess Plateau, China. Soil Sci. Soc. Am. J. 2019, 83, 388–397. [Google Scholar] [CrossRef]
  56. Boix-Fayos, C.; Calvo-Cases, A.; Imeson, A.C.; Soriano-Soto, M.D. Influence of Soil Properties on the Aggregation of Some Mediterranean Soils and the Use of Aggregate Size and Stability as Land Degradation Indicators. CATENA 2001, 44, 47–67. [Google Scholar] [CrossRef]
  57. Guo, Y.; Fan, R.; Zhang, X.; Zhang, Y.; Wu, D.; McLaughlin, N.; Zhang, S.; Chen, X.; Jia, S.; Liang, A. Tillage-Induced Effects on SOC through Changes in Aggregate Stability and Soil Pore Structure. Sci. Total Environ. 2020, 703, 134617. [Google Scholar] [CrossRef]
  58. Cheng, M.; Xiang, Y.; Xue, Z.; An, S.; Darboux, F. Soil Aggregation and Intra-Aggregate Carbon Fractions in Relation to Vegetation Succession on the Loess Plateau, China. CATENA 2015, 124, 77–84. [Google Scholar] [CrossRef]
  59. Denef, K.; Six, J. Contributions of Incorporated Residue and Living Roots to Aggregate-Associated and Microbial Carbon in Two Soils with Different Clay Mineralogy. Eur. J. Soil Sci. 2006, 57, 774–786. [Google Scholar] [CrossRef]
  60. Mustafa, A.; Minggang, X.; Ali Shah, S.A.; Abrar, M.M.; Nan, S.; Baoren, W.; Zejiang, C.; Saeed, Q.; Naveed, M.; Mehmood, K.; et al. Soil Aggregation and Soil Aggregate Stability Regulate Organic Carbon and Nitrogen Storage in a Red Soil of Southern China. J. Environ. Manag. 2020, 270, 110894. [Google Scholar] [CrossRef]
  61. Jiang, X.; Wright, A.L.; Wang, J.; Li, Z. Long-Term Tillage Effects on the Distribution Patterns of Microbial Biomass and Activities within Soil Aggregates. CATENA 2011, 87, 276–280. [Google Scholar] [CrossRef]
  62. Ayoubi, S.; Mokhtari Karchegani, P.; Mosaddeghi, M.R.; Honarjoo, N. Soil Aggregation and Organic Carbon as Affected by Topography and Land Use Change in Western Iran. Soil Tillage Res. 2012, 121, 18–26. [Google Scholar] [CrossRef]
  63. Iqbal, J.; Hu, R.; Feng, M.; Lin, S.; Malghani, S.; Ali, I.M. Microbial Biomass, and Dissolved Organic Carbon and Nitrogen Strongly Affect Soil Respiration in Different Land Uses: A Case Study at Three Gorges Reservoir Area, South China. Agric. Ecosyst. Environ. 2010, 137, 294–307. [Google Scholar] [CrossRef]
  64. Bhople, P.; Djukic, I.; Keiblinger, K.; Zehetner, F.; Liu, D.; Bierbaumer, M.; Zechmeister-Boltenstern, S.; Joergensen, R.G.; Murugan, R. Variations in Soil and Microbial Biomass C, N and Fungal Biomass Ergosterol along Elevation and Depth Gradients in Alpine Ecosystems. Geoderma 2019, 345, 93–103. [Google Scholar] [CrossRef]
  65. Kravchenko, A.; Chun, H.-C.; Mazer, M.; Wang, W.; Rose, J.B.; Smucker, A.; Rivers, M. Relationships between Intra-Aggregate Pore Structures and Distributions of Escherichia Coli within Soil Macro-Aggregates. Appl. Soil Ecol. 2013, 63, 134–142. [Google Scholar] [CrossRef]
  66. Mangalassery, S.; Sjögersten, S.; Sparkes, D.L.; Sturrock, C.J.; Mooney, S.J. The Effect of Soil Aggregate Size on Pore Structure and Its Consequence on Emission of Greenhouse Gases. Soil Tillage Res. 2013, 132, 39–46. [Google Scholar] [CrossRef]
  67. Bhattacharyya, R.; Rabbi, S.M.F.; Zhang, Y.; Young, I.M.; Jones, A.R.; Dennis, P.G.; Menzies, N.W.; Kopittke, P.M.; Dalal, R.C. Soil Organic Carbon Is Significantly Associated with the Pore Geometry, Microbial Diversity and Enzyme Activity of the Macro-Aggregates under Different Land Uses. Sci. Total Environ. 2021, 778, 146286. [Google Scholar] [CrossRef] [PubMed]
  68. Marx, M.-C.; Kandeler, E.; Wood, M.; Wermbter, N.; Jarvis, S.C. Exploring the Enzymatic Landscape: Distribution and Kinetics of Hydrolytic Enzymes in Soil Particle-Size Fractions. Soil Biol. Biochem. 2005, 37, 35–48. [Google Scholar] [CrossRef]
  69. Wang, J.; Hayes, F.; Turner, R.; Chadwick, D.R.; Mills, G.; Jones, D.L. Effects of Four Years of Elevated Ozone on Microbial Biomass and Extracellular Enzyme Activities in a Semi-Natural Grassland. Sci. Total Environ. 2019, 660, 260–268. [Google Scholar] [CrossRef] [PubMed]
  70. Wang, Y.; Hu, N.; Ge, T.; Kuzyakov, Y.; Wang, Z.-L.; Li, Z.; Tang, Z.; Chen, Y.; Wu, C.; Lou, Y. Soil Aggregation Regulates Distributions of Carbon, Microbial Community and Enzyme Activities after 23-Year Manure Amendment. Appl. Soil Ecol. 2017, 111, 65–72. [Google Scholar] [CrossRef]
  71. Meng, C.; Tian, D.; Zeng, H.; Li, Z.; Chen, H.Y.H.; Niu, S. Global Meta-Analysis on the Responses of Soil Extracellular Enzyme Activities to Warming. Sci. Total Environ. 2020, 705, 135992. [Google Scholar] [CrossRef]
Figure 1. The location of sample site in Songyuan city, northeast of China. C1, C2, and C3 refers to the cornfields sample plots with different soda-alkali status in the study.
Agronomy 12 02549 g001
Figure 2. (a) Soil aggregate distribution; (b) mean weight diameter (MWD) in depths of 0–20 cm and 20–40 cm (n = 4). Capital letters indicate significant differences among plots, while lower letters indicate significant difference between 0–20 cm and 20–40 cm soil depths (p < 0.05). C1, C2, and C3 were the sample plots in the study.
Agronomy 12 02549 g002
Figure 3. Soil enzyme activities in aggregate fractions with a depth of 0–20 cm and 20–40 cm (n = 3). Capital letters indicate significant differences among plots, while lower letters indicate significant differences among aggregate fractions (p < 0.05). C1, C2, and C3 were the sample plots in the study.
Agronomy 12 02549 g003
Figure 4. Redundancy analysis between SOC, TN, and soil enzyme activities in soil aggregates: (a) macro-aggregates; (b) meso-aggregates; and (c) micro-aggregates. RDA 1 and RDA 2 refer to the first and second axis in RDA ordination diagram, and their explanations to variables are shown in the parentheses. The length of the arrow indicates the relative variance explained by that factor. Correlations between SOC, TN, and soil enzyme activities are represented by the length and angle of lines.
Agronomy 12 02549 g004
Table 1. Soil physical-chemical properties.
Soil PropertySoil DepthC1C2C3
BD (g cm−3)0–20 cm1.15 ± 0.02 11.17 ± 0.021.22 ± 0.05
20–40 cm1.30 ± 0.041.31 ± 0.031.31 ± 0.03
SP (%)0–20 cm56.45 ± 0.6155.82 ± 0.7253.79 ± 2.05
20–40 cm51.08 ± 1.5750.72 ± 1.2350.72 ± 1.23
Sand (%)0–20 cm67.04 ± 1.5066.47 ± 1.3573.76 ± 0.59
20–40 cm63.96 ± 1.5253.40 ± 0.2954.93 ± 0.55
Silt (%)0–20 cm28.57 ± 1.1129.39 ± 1.1522.89 ± 0.51
20–40 cm31.31 ± 1.4139.41 ± 0.2437.37 ± 0.53
Clay (%)0–20 cm4.39 ± 0.414.14 ± 0.213.35 ± 0.11
20–40 cm4.74 ± 0.147.19 ± 0.387.69 ± 0.13
Soil texture Sand LoamSand LoamSand Loam
Soil pH0–20 cm8.93 ± 0.029.54 ± 0.029.90 ± 0.05
20–40 cm8.98 ± 0.059.72 ± 0.0310.14 ± 0.02
EC (ms cm−1)0–20 cm0.14 ± 0.020.18 ± 0.010.27 ± 0.01
20–40 cm0.15 ± 0.030.23 ± 0.020.32 ± 0.04
ESP (%)0–20 cm6.31 ± 2.2915.17 ± 0.4624.00 ± 1.85
20–40 cm6.49 ± 1.4222.11 ± 2.9738.98 ± 0.40
SOC (g kg−1)0–20 cm25.19 ± 0.3322.87 ± 0.5716.46 ± 0.68
20–40 cm14.19 ± 0.121.72 ± 1.0614.64 ± 0.53
TN (g kg−1)0–20 cm1.68 ± 0.031.67 ± 0.141.24 ± 0.08
20–40 cm0.55 ± 0.041.38 ± 0.200.97 ± 0.08
SIC (g kg−1)0–20 cm1.29 ± 0.046.31 ± 0.0712.18 ± 0.08
20–40 cm7.21 ± 0.0113.74 ± 0.2123.78 ± 0.47
1 Mean ± SD (n = 3). C1, C2, and C3 refers to the cornfields sample plots with different soda-alkali status in the study. BD: bulk density; SP: soil porosity; EC: electrical conductivity; ESP: exchangeable sodium percentage; SOC: soil organic carbon; TN: soil nitrogen; SIC: soil inorganic carbon.
Table 2. Soil organic carbon, total nitrogen, microbial biomass C and N in aggregates in depths of 0–20 cm and 20–40 cm.
SiteAggregates
(μm)
SOC (g kg−1 soil)TN (g kg−1 soil)C:NMBC (mg kg−1 soil)MBN
(mg kg−1 soil)
MBC:SOC (%)
0–20 cm
C1>200024.09 ± 2.54 Aa1.53 ± 0.03 Ab15.68 ± 1.36 Aa73.14 ± 15.79 Ab8.92 ± 1.66 Bb0.58 ± 0.10 Ab
250–200028.28 ± 0.41 Aa1.66 ± 0.06 Aa17.09 ± 0.49 Aa276.51 ± 77.89 Aa13.54 ± 1.65 Aa0.81 ± 0.07 Aa
<25022.50 ± 0.46 Aa1.37 ± 0.05 Ac16.41 ± 0.99 Aa150.80 ± 25.49 Bab6.66 ± 0.36 Ab0.48 ±0.02 Bb
C2>200023.02 ± 0.54 Aa1.66 ± 0.04 Ba13.87 ± 0.09 Aa88.91 ± 10.15 Aa11.39 ± 0.21 Aa0.69 ± 0.00 Aa
250–200025.90 ± 1.51 Aa1.74 ± 0.05 Aa14.85 ± 0.49 Aa119.15 ± 23.78 Aa13.23 ± 0.90 Aa0.76 ± 0.03 Aa
<25018.73 ± 1.91 Ab1.34 ± 0.06 Ab13.90 ± 0.92 Ba110.76 ± 4.58 Ba8.56 ± 1.00 Ab0.63 ± 0.05 Aa
C3>200012.01 ± 0.20 Bb1.27 ± 0.02 Cb9.42 ± 0.15 Ba102.59 ± 32.05 Ab4.34 ± 0.44 Ca0.34 ± 0.03 Ba
250–200016.98 ± 2.40 Ba1.51 ± 0.02 Ba11.27 ± 1.48 Ba197.28 ± 35.30 Aa5.07 ± 0.68 Ba0.34 ± 0.04 Ba
<25011.37 ± 0.56 Bb1.06 ± 0.01 Bc10.75 ± 0.48 Ca148.72 ± 9.47 Aab3.12 ± 0.15 Bb0.30 ± 0.01 Ca
20–40 cm
C1>2000 7.88 ± 0.27 Ca0.48 ± 0.01 Ca16.50 ± 0.22 Aa35.24 ± 5.11 Bb2.77 ± 0.87 Bb0.58 ± 0.16 Ab
250–20007.32 ± 0.15 Ca0.53 ± 0.02 Ba13.88 ± 0.18 Ab62.80 ± 10.49 Ba6.01 ± 0.76 Ba1.14 ± 0.11 Aa
<2507.31 ± 0.79 Ca0.46 ± 0.04 Cb16.05 ± 1.43 Aa24.29 ± 1.24 Bb0.64 ± 0.05 Cc0.14 ± 0.01 Bc
C2>200017.05 ± 0.32 Aa1.25 ± 0.05 Aa13.62 ± 0.31 Ba35.47 ± 2.44 Ba5.44 ± 0.27 Ab0.43 ± 0.00 ABb
250–200016.64 ± 0.10 Aa1.43 ± 0.09 Aa11.69 ± 0.69 Bb39.32 ± 1.55 Ba11.50 ± 0.06 Aa0.81 ± 0.05 Ba
<25014.91 ± 0.95 Ab1.21 ± 0.15 Aa12.430 ± 1.04 Bab32.71 ± 4.07 Ba3.02 ± 0.47 Ac0.25 ± 0.01 Ac
C3>200013.38 ± 0.48 Ba0.98 ± 0.02 Bb13.65 ± 0.26 Ba118.49 ± 10.30 Aa3.10 ± 0.55 Ba0.32 ± 0.05 Ba
250–200011.94 ± 0.20 Bb1.10 ± 0.01 Aa10.86 ± 0.13 Bb134.42 ± 19.83 Aa4.26 ± 0.51 Ba0.39 ± 0.04 Ca
<25010.37 ± 0.68 Bc0.89 ± 0.02 Bc11.66 ± 0.55 Bb106.56 ± 6.00 Aa1.79 ± 0.36 Bb0.20 ± 0.04 Ab
Mean ± SD (n = 3). Capital letters indicate significant differences among plots, while lower letters indicate significant differences among aggregate fractions (p < 0.05). C1, C2, and C3 were the sample plots in the study. MBC: microbial biomass carbon; MBN: microbial biomass nitrogen.
Table 3. Importance and significance levels of soil enzyme activities in soil aggregates.
Soil Aggregates (μm)Soil Enzyme ActivitiesExplanation of SOC and TN (%)p
>2000NAG82.70.002
INV66.50.002
GLU43.90.006
URE31.30.016
250–2000NAG87.00.002
GLU72.60.002
INV68.40.002
URE24.30.040
<250NAG85.70.002
GLU66.30.002
INV65.40.002
URE41.70.004
NAG: N-acetyl-β-D-glucosaminidase; INV: invertase; GLU: β-glucosidase; URE: urease.
Publisher’s Note: MDPI stays neutral with regard to jurisdictional claims in published maps and institutional affiliations.

