Article

Usability of the Weather Forecast for Tackling Climatic Variability and Its Effect on Maize Crop Yield in Northeastern Hill Region of India

by
Debasish Chakraborty
1,*,
Saurav Saha
2,
Bira Kishore Sethy
1,
Huidrom Dayananda Singh
1,
Naseeb Singh
1,
Romen Sharma
3,
Athokpam Nomita Chanu
4,
Imtisenla Walling
3,
Pashel Rolling Anal
1,
Samik Chowdhury
2,
Samarendra Hazarika
1,
Vinay Kumar Mishra
1,
Prakash Kumar Jha
5,* and
P. V. Vara Prasad
5,6
1
Indian Council of Agricultural Research, Research Complex for NEH Region (ICAR RC NEHR), Umiam 793 103, Meghalaya, India
2
ICAR RC NEHR, Mizoram Centre, Kolasib 796 081, Mizoram, India
3
ICAR RC NEHR, Nagaland Centre, Jharnapani 797 106, Nagaland, India
4
ICAR RC NEHR, Manipur Centre, Imphal 795 004, Manipur, India
5
Feed the Future Innovation Lab for Collaborative Research on Sustainable Intensification, Kansas State University, Manhattan, KS 66506, USA
6
Department of Agronomy, Kansas State University, Manhattan, KS 66506, USA
*
Authors to whom correspondence should be addressed.
Agronomy 2022, 12(10), 2529; https://doi.org/10.3390/agronomy12102529
Submission received: 31 August 2022 / Revised: 2 October 2022 / Accepted: 11 October 2022 / Published: 17 October 2022

Abstract

:
Weather forecasts are important for the planning of agricultural operations, especially during times of heightened climatic variability. This study analyzed and verified the medium-range weather forecast issued by the India Meteorological Department (IMD) for different weather parameters over four locations in the northeastern hill (NEH) region of India considering five years of daily datasets. Results revealed good overall accuracy of the forecast over the NEH region. The accuracy of relative humidity (>80%), rainfall (>79%), and wind speed (>70%) were good, and the accuracy of temperature was average, with the usability values for maximum temperatures (44.7–62.7%) comparatively better than for minimum temperatures (38.5–58.6%). The correlation coefficient between the observed and forecasted values was positive (0.24–0.70) and statistically significant for most of the cases, indicating that the forecast could capture variations. Field experiments for maize crops showed that a near-real-time weather forecast-based agro-advisory could manage the uncertainties related to the in-season weather and thereby help in its day-to-day management, which is depicted by the statistically significant (p < 0.05) improvements in the yield of maize. The accuracy of the minimum temperature was poor during winter and post-monsoon seasons, when it plays a crucial role in the determination of optimal growing conditions. Usability of the maximum temperature needs improvement during the pre-monsoon season, as crop cultivation over the region starts from this season due to the high probability of assured rainfall. Therefore, the forecasts were found to be useful but in need of improvement for minimum temperature, which is very crucial for the region.

1. Introduction

Climate is pivotal for determining the vegetation and crop types for a particular region. Weather conditions determine the growth, development, productivity, and management of a crop during its cultivation season. Hence, the success of agricultural production is highly dependent on the weather conditions during the crop season and especially during this era of changing climate and increased climate variability [1,2,3,4,5,6]. Weather cannot be modified to suit the agricultural production system, but agricultural management can be reoriented to minimize the impact of adverse weather conditions during the cropping season [7,8]. Further planning and management of different agricultural resources are presently gaining importance to formulate adaptation or mitigation strategies for a projected resource-scarce world in the near future, in which the climate extremes are projected to be more frequent and intense [9,10]. The northeastern hill (NEH) region of India is rich in natural resources such as water and biodiversity. This region receives bountiful rainfall, and its distribution is also different compared to the other parts of India [10,11]. Agriculture is mostly rainfed over the region. As the topography is hilly and crops are cultivated in the sloppy lands (in the Jhum lands, which are mostly in steep slopes >25%), the water received from rainfall is also lost from the effective root zone of the crops rapidly through the surface runoff as well as sub-surface drainage. Therefore, effective planning of agricultural management operations starting from land preparation, sowing/transplanting, intercultural operations, and plant protection to harvest depends on a priori knowledge about different weather parameters.
With the increase in climatic variability in the recent past, the weather has become more uncertain, thereby increasing the risk [10,11] to crop production. Medium-range weather forecasts provide the scope for proper planning and implementation of the strategies that not only maximize the yield/quality of the crop produce but also minimize the input loss, thereby increasing the resource use efficiency and profit to the farmers. This information is especially important to the resource-poor and risk-prone small and marginal farmers that are major food producers in the NEH region [12]. Though the NEH region has inherently low inter-annual variability in different weather variables, of late, this region has also been influenced by heightened climatic variability [11]. These variabilities increase the risk and therefore demand for an accurate quantitative forecast of weather parameters for devising proper management strategies. Based on these needs, the India Meteorological Department (IMD) started issuing quantitative medium-range weather forecasts (5 days forecast every Tuesday and Friday) of different weather parameters at the district scale, which forms the basis for the generation of the district-level agro-advisory bulletins (AAB). IMD considers five numerical weather prediction (NWP) models for the ensemble model: (i) the National Centre for Medium Range Weather Forecasting (NCMRWF) (which presently uses IMD GFS T-1534), (ii) the Japan Meteorological Agency (JMA T-959), (iii) the European Centre For Medium Range Weather Forecasting (ECMWF T-799), (iv) the National Centre for Environmental Prediction Global Forecast System (NCEP GFS), and (v) the United Kingdom Meteorological Office (UKMO) [13]. The quality and effectiveness of these AABs depend on the quality of the weather forecasts, thereby demanding the verification of weather forecasts for quantifying their accuracies along with improvement in future forecasts [13]. As the weather is highly variable and the forecasting model accuracies are not similar over a large and variable spatial extent, forecasts thus need to be verified at different local scales [14]. There are several studies regarding the verification of weather forecasts over various parts of India [1,7,8,13,14,15,16], but none of these studies have analyzed the weather forecast in the NEH region. Therefore, this study was undertaken to evaluate the accuracy and usability of the medium-range weather forecast for rainfall, temperature (maximum and minimum), relative humidity (RH) (morning and afternoon), and wind speed over the NEH region. Further, we have also studied the effect of weather forecast-based agro-advisories on the maize (Zea mays L.) crop yield, as weather parameters such as rainfall, temperature, and relative humidity play crucial roles in determining the crop-growing conditions under this rainfed humid region.

2. Materials and Methods

The NEH region of India is rich in natural resources, especially biodiversity, and has varied climatic conditions due to its location and topography. The hydro-thermal regime of the region is unique and different from other parts of the country [10,11]. In this study, meteorological data recorded at four different agrometeorological observatories from four hilly states of NEH, namely, Meghalaya (district: Ri-Bhoi, location: Umiam), Nagaland (district: Dimapur, location: Jharnapani), Manipur (District: Imphal West, Location: Imphal), and Mizoram (district: Kolasib, location: Kolasib) were used for the verification of the weather forecast. The locations of the agrometeorological observatories are shown in Table 1. The hilly terrain gives rise to different climatic conditions, and it does show large intra-annual and inter-annual variabilities [10]. Weather parameters such as rainfall, temperature (maximum and minimum), RH (morning and afternoon), and wind speed play a crucial role in the determination of the climate as suitable for crop growth. Hence, in this study, to obtain a holistic picture of the accuracy of the medium-range weather forecast, we have considered five years of daily data (2014 to 2018).
The value-added medium-range weather forecast data (forecast for five days received every Tuesday and Friday) was obtained from Regional Meteorological Centre (RMC), Guwahati (Assam State) of India Meteorological Department (IMD), New Delhi, India. IMD, New Delhi generates the five-day forecast using the multi-model ensemble (MME) technique involving five different numerical weather prediction (NWP) models [8,13]. Then, the zone-specific value addition is determined by the respective RMCs [16]. For the verification process, daily values were analyzed at the monthly and seasonal scale by adopting IMD’s standard seasonal duration, i.e., winter (Jan–Feb), pre-monsoon (Mar–May), monsoon (June–Sept), and post-monsoon (Oct–Dec). The seasonal values are presented in the main manuscript, and the monthly values are provided in Supplementary Figures S1–S7. In this study, six weather parameters, namely rainfall, temperature (maximum and minimum), RH (morning and afternoon), and wind speed were considered. The verification was performed based on the error structure presented in Table 2 [15,17].
The verification of rainfall was based on forecast and observed rainfall events, which are explained in the Table 2 (bottom portion). Here, the cumulative value of hits (H) and correct negatives (Z) provide the correct forecasts (H + Z), and the cumulative value of misses (M) and false alarms (F) provide the incorrect forecasts (M + F).
Further, we calculated the root mean square error (RMSE) to understand the difference between the values of the forecast and the observed parameter. Mean bias error (MBE) was also calculated to understand the bias between the forecast and observed parameters. The formulae used were as follows:
R M S E = i = 1 n O i F i 2 n
M B E = 1 n i = 1 n O i F i
where Oi and Fi denote the observed and forecasted values, respectively, and n denotes the total number of observations. RMSE and MBE were calculated based on forecast lead-time (Day-1, Day-2, Day-3, and Day-4) as well as on seasonal scale. The correlation coefficient between the forecasted and observed parameters was also calculated and evaluated for significance using the two-tailed Pearson test.
Further, to understand the effect of medium-range weather forecast-based agro-advisories on crop performance, a field experiment was conducted under mid-hill conditions at the ICAR Research Complex for NEH Region, Umiam, Meghalaya. The experiment compared the effect of the agro-advisory under both farmers’ practices and recommended practices. The maize crop was selected for the experiment, as it is one of the dominant crops in the region. Two varieties, namely RCM-1-76 (V1) and DA 61 A (V2), were grown under the upland terraced conditions (with each plot sized 12 sq. meter) during the kharif season (May–Aug) of 2018 and 2019. In the case of the recommended practices, the standard scientific recommendations for the region such as fertilizer dose (N:P2O5:K2O @ 80:60:40 kg/ha with FYM @ 5 tonnes/ha), cultural operations of line sowing, weeding, and pest management were followed on specific days after sowing (DAS) using recommended practices. For farmers’ practices, the sowing was executed through dibbling with four to five seeds at each point, and only FYM (@5 tonnes/ha) was applied with no inorganic fertilizer and chemical pest control. In the case of agro-advisory treatment, the cultivation was performed as per the weather forecast-based recommendations of the agro-advisory bulletins. Since these recommendations were based on the in-season weather forecast and prevailing crop conditions, the cultural operations over the cropping season therefore, varied as compared to the static recommended practices. After the harvest of maize, the grain yield (tonnes ha−1) was recorded for each of the treatments. Data generated in the field experiment were analyzed following a split-plot design (farming practices, i.e., farmers and recommended practices as the main plot and agro-advisory and without agro-advisory as sub-plots with three replications) with the help of SPSS software (SPSS 16.0). The least significant difference (LSD) at a 5% probability level was computed to compare the treatment means.

3. Results and Discussion
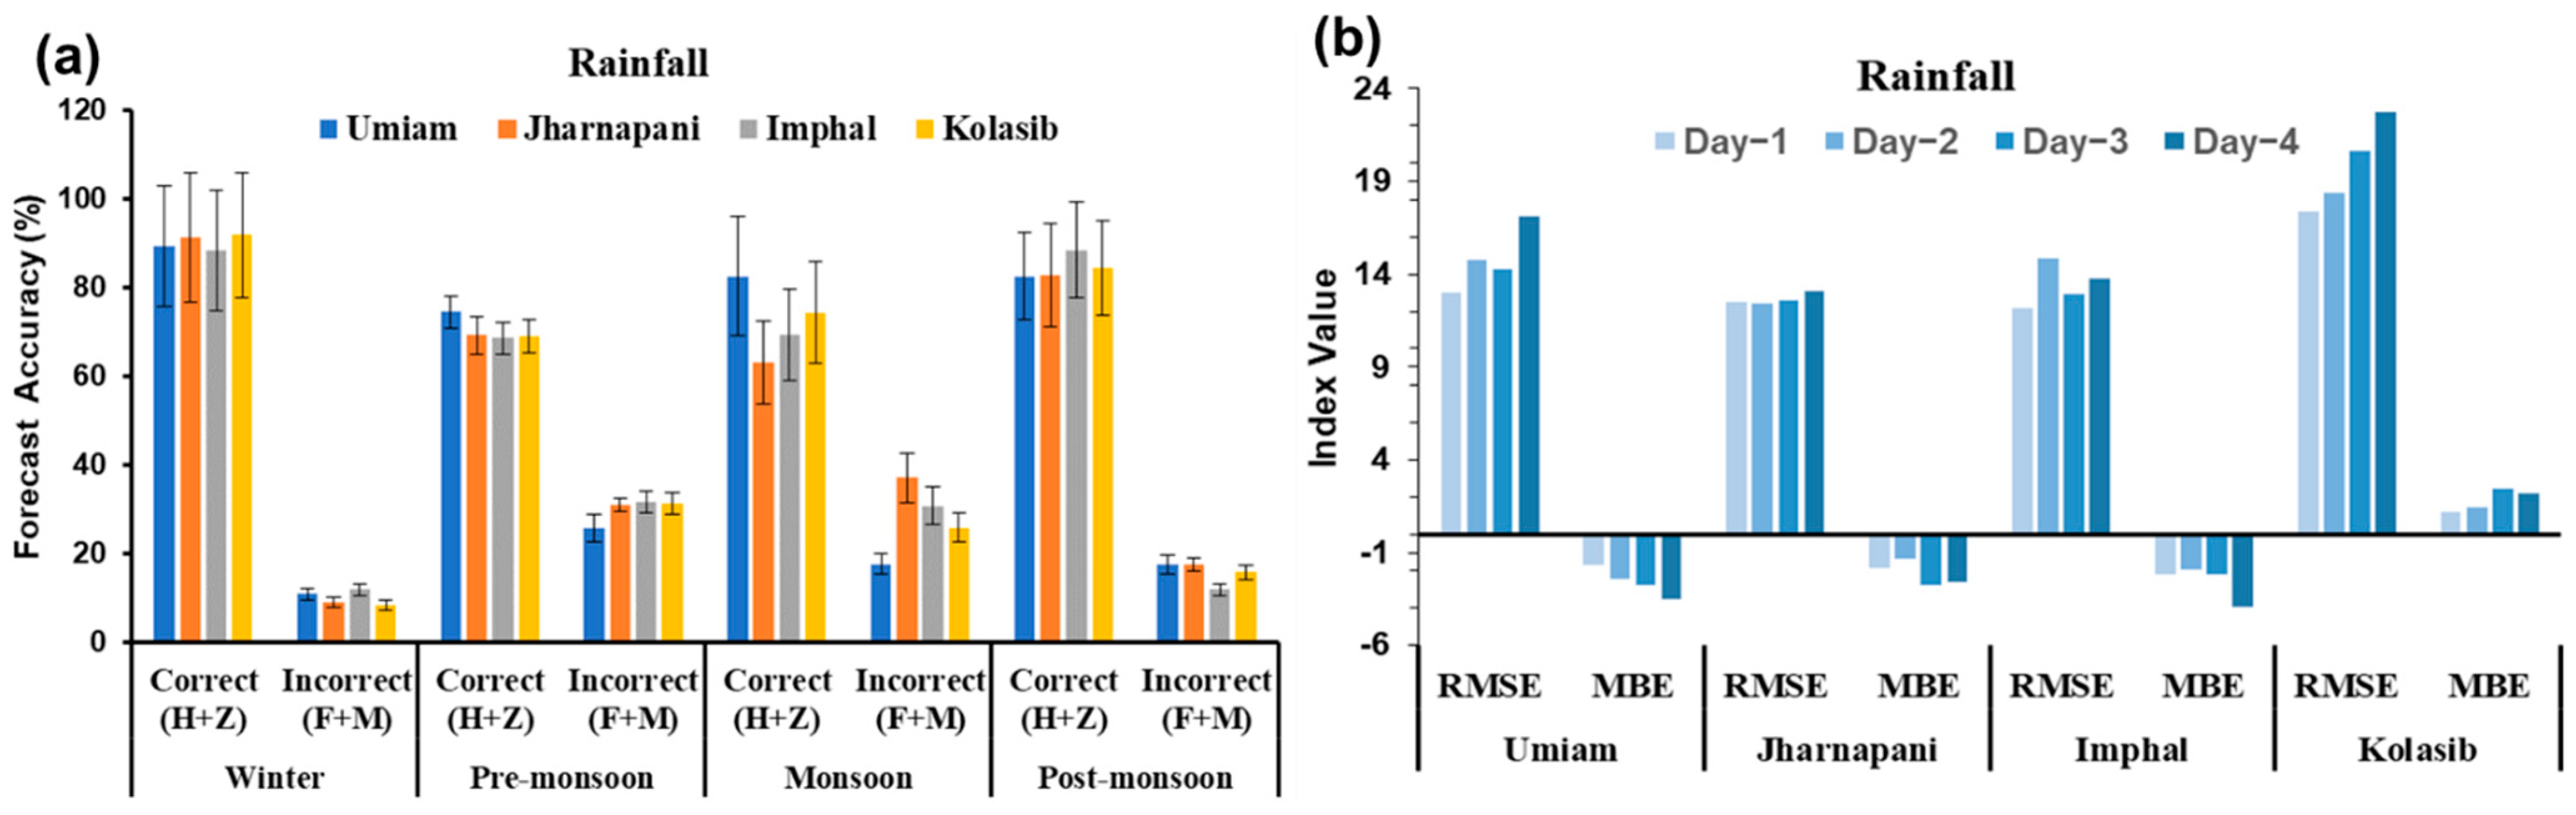
3.1. Rainfall

The rainfall forecast was evaluated using the criteria mentioned in Table 2, and the results are presented in Figure 1a (mean values of 2014–2018 are presented as bars and error bars indicate the standard error). Overall, the correct forecast occurred more than 79% of the time, considering all the seasons and locations of the NEH region. The accuracy was at maximum during the winter season (~90%), followed by the post-monsoon season (~84%), and it was almost similar during the pre-monsoon and monsoon (~>70%) seasons. Among different locations, the trend was almost similar during the winter, pre-monsoon, and post-monsoon seasons, but during the monsoon season, there were variations. During the monsoon season, the percentage of correct forecasts was at maximum in Umiam (~84), followed by Kolasib (~74%), Imphal (~69%), and Jharnapani (~63%). On the other hand, the year-to-year variation indicated by the standard error was also at maximum during the monsoon season, followed by the post-monsoon and winter season, and at minimum during the pre-monsoon season. The rainfall forecast evaluation at the monthly scale also showed a similar pattern (Supplementary Figure S1). These observations regarding the accuracy of the rainfall forecast during the monsoon season were similar to that of Rajavel et al. [16]. They reported an overall accuracy rate of 71% during the six years of study (2012–2017) in the Chhattisgarh state of India, whereas for this study, it varied from 63% to 84% among different locations of the NEH region, with an average value of 72.3%. The values of statistical indices were calculated based on forecast lead time as well as the seasonal basis (Figure 1b and Figure S2). It can be clearly seen that with the increase in time, the forecast accuracy decreases. The errors were similar in the case of Umiam, Jharnapani, and Imphal, whereas inaccuracy was higher in the case of Kolasib. Statistical evaluation at the seasonal scale also depicted the same pattern of accuracy (Figure S2). Among the seasons, winter had the lowest error, followed by the post-monsoon, pre-monsoon, and monsoon seasons. The average RMSE during the monsoon season was about 21 mm, with variation among the locations. It was the highest in Kolasib (~27 mm), followed by Umiam (~21 mm), Jharnapani (~19 mm), and Imphal (~17 mm). The pattern was similar to the amount of monsoon rainfall received by these locations, as Kolasib receives the highest amount of rain, followed by Umiam, Jharnapani, and Imphal [11]. The MBE also showed a similar pattern among the seasons, but among the places, it varied with negative values during the pre-monsoon and monsoon seasons. During both seasons, the MBE was negative in Umiam, Jharnapani, and Imphal, signifying that the forecasted values were higher than observed values, but it was otherwise for Kolasib. The RMSE results of this study, especially during the monsoon season, were similar to those of Rana et al. [1,7], Vashisth et al. [15], Sarmah et al. [8], and Saha et al. [18]. Therefore, the results clearly indicate that the accuracy of the rainfall forecast over the NEH region is good or on par with other parts of the country all throughout the year, as well as during the high-rainfall-receiving seasons such as the pre-monsoon and monsoon seasons.

3.2. Temperature (Maximum and Minimum)

The maximum and minimum temperature forecast was verified using criteria as depicted in Table 2. The overall usability (correct and usable) of the maximum temperature was about 57% considering five years of the dataset over four locations in the NEH region. The value was highest for Jharnapani (62.7%), followed by Imphal (61.2%) and Umiam (57.4%), and it was lowest at Kolasib (44.7%) (Figure 2a) (mean values of 2014–2018 are presented as bars, and error bars indicate the standard error). There were inter-seasonal variations, with the highest accuracy during the post-monsoon season, followed by winter, whereas during the pre-monsoon season, the accuracy was lowest. A similar pattern was revealed at the monthly scale, though there were clear variations in the accuracy among the locations (Figure S3). The RMSE also indicated a similar magnitude of errors among the four locations, with values varying from 1.5 to 3.5 (Figure 2b and Figure S2). The MBE clearly revealed that for Umiam, Imphal, and Kolasib, the bias was negative, whereas for Jharnapani, it was positive for all four seasons. This means for these three locations; the forecast values were always higher than the observed values. Both the RMSE and MBE were in a similar range from Day-1 to Day-4, though there was a trend of increasing error with time, and it was quite marked for Jharnapani. The correlation coefficient between the observed and forecasted maximum temperature was positive in all cases, and it was statistically significant most of the time, indicating that the forecast could capture the pattern of the variation in the Tmax (Table 3a,b). Gupta et al. [19], Vashisth et al. [15], and Sarmah et al. [8] also reported that usability was highest during the post-monsoon and lowest for the pre-monsoon season. The RMSE values of this study were mostly in a similar range, though Sarmah et al. [4] reported values as high as 6.3, which was not found in this case study.
Minimum temperature had an overall usability of about 49.6%, with the highest value at Imphal (58.6%), followed by Jharnapani (57.3%), Kolasib (44.2%), and Umiam (38.5%). Among the seasons, usability was highest during the monsoon season, followed by the pre-monsoon season, but it was lower during the post-monsoon and winter seasons (Figure 3a) (mean values of 2014–2018 are presented as bars, and error bars indicate the standard error). The monthly analysis also depicted similar patterns among the locations (Figure S4). The RMSE values mostly ranged from 2.0 to 4.0 (Figure 3b and Figure S2). Further, as per the forecast range, the error values were similar, with the presence of an increasing trend in the error with time (Figure 3b). In this case, however, the MBE was negative only for Umiam (with a similar bias value ranging between −2.3 and −2.6) (Figure S2). The results were in line with the report of Vashisth et al. [11], who found a lower usability of the minimum temperature as compared to the maximum temperature. The pattern of usability among the seasons for minimum temperature matches that of Gupta et al. [19] and Sarmah et al. [8], though there were differences in the values. The values of the correlation coefficient were positive and mostly statistically significant, depicting that the forecast could capture the broad variation in the observed minimum temperature (Table 3a,b). However, in most of the cases, the strength of correlation was lower as compared to the maximum temperature. The values of RMSE were variable among the seasons and the locations, but the ranges were in line with previous studies [8,15,20]. Results clearly indicate that there is a need to improve the accuracy of the minimum temperature forecast during the post-monsoon to winter months, as in hilly regions, there is often a chance of frost/low-temperature injury, and low temperature becomes the bottleneck for crop cultivation during these conditions.

3.3. Relative Humidity (Morning and Afternoon)

The overall usability of morning RH was good (85.3%) considering five years of data over four locations in the NEH region. The accuracy was at maximum for Imphal, followed by Umiam, Jharnapani, and Kolasib (Figure 4a and Figure S5). Alternately, from the seasonal perspective, the monsoon season showed the highest accuracy, followed by the post-monsoon, pre-monsoon, and winter seasons. The statistical evaluation clearly depicted a variation among the locations, with the lowest errors in the case of Imphal followed by Umiam (RMSE < 12), whereas for Jharnapani, RMSE was between 15 to 18, and for Kolasib, it was more than 20 (Figure 4b). At the seasonal scale, the RMSE values mostly ranged between 10–15 over all the locations (Figure S2). The error was comparatively higher over Kolasib compared to the other locations for all the seasons (Figure S2). The MBE showed varied patterns among the seasons as well as the locations. It was negative for Umiam, Imphal, and Kolasib, whereas it was positive for Jharnapani. During the monsoon season, it was negative in all four locations, indicating a forecast of higher-than-observed values in all cases. Related results were found for the post-monsoon season except for Jharnapani, where the values of MBE were positive. During the pre-monsoon season, the values were positive for Umiam and Jharnapani, but they were negative for Imphal and Kolasib. Alternately, for winter, an almost similar pattern of the pre-monsoon season was evident, with quite high (<−15) negative values over Kolasib. This may be due to the extremely high values of morning RH forecasted for Kolasib during the winter, but the area remains quite warmer during these times, with an almost negligible amount of rainfall, which creates the vapor pressure deficit and causes the RH to be comparatively lower. The correlation coefficient showed variations among the seasons as well as the locations (Table 3a,b). The values were mostly positive but statistically significant during monsoon season only. Sarmah et al. [8] also reported a similar pattern of accuracy in the morning RH among the seasons, but the values of RMSE were lower compared to this study. However, they also reported similar values of the correlation coefficient for this parameter.
RH during the afternoon showed an overall accuracy of 67.8%, with the highest values over Umiam, followed by Imphal, Jharnapani, and Kolasib (Figure 5a and Figure S6). Among the seasons, during monsoon, the accuracy was highest, followed by the post-monsoon season, whereas the winter and pre-monsoon seasons had similar values. The RMSE values were high (>15) for all cases. The MBE was also higher and positive for all cases (Figure 5b and Figure S2). These results indicate that the observed afternoon RH was higher than the forecasted values in all cases. This means that the forecast predicts the atmospheric condition to be much dryer during the afternoon time, but there remains a higher amount of moisture. This is especially true during the less rainy seasons such as the winter, pre-monsoon, and post-monsoon seasons. Sarmah et al. [8] also reported a lower accuracy in afternoon RH compared to the morning RH, with higher values of RMSE. The pattern of accuracy among the seasons also matched well with this study. The correlation coefficient for afternoon RH was positive and statistically significant for all the locations and years (Table 3a,b). This result clearly indicates that the forecast was able to capture the right pattern, though the forecasted values remained quite low as compared to the observed values as indicated by the MBE.

3.4. Wind Speed

The average accuracy of wind speed was good (74.5%) over the study period in the NEH region. The highest accuracy was for Umiam, followed by Imphal and Kolasib, and the lowest accuracy was at Jharnapani (Figure 6a and Figure S7). Among the seasons, the highest accuracy was during the monsoon season, followed by the pre-monsoon season, and it was similar during the winter and post-monsoon seasons. In all the locations except Jharnapani, especially during post-monsoon and winter, the accuracy was quite low. The RMSE values mostly varied between 2 to 3, with Jharnapani showing comparatively higher values (Figure 6b and Figure S2). The MBE values were negative for all the locations and seasons. Results indicate higher forecasted wind speed values than observed values, and the extent of this discrepancy was even higher for Jharnapani. The correlation coefficient between the forecast and the observed wind speed showed a varied pattern for the locations and the seasons. However, most of the time, it was positive, but negative values were also observed. Among the seasons, higher and statistically significant values were observed during the monsoon season. Related results were reported by other researchers regarding the high value of accuracy for the wind speed over various parts of India [8,15,17,20], but the values of this study were closer to those of Kaur and Singh [17]. The RMSE values of this study were also in a similar range to Vashisth et al. [15], but they were lower as compared to Sarmah et al. [8] and Kaur and Singh [17]. Other studies also reported negative as well as positive correlation coefficients for wind speed [8,15].

3.5. Effect of Weather Forecast-Based Agro-Advisory on Maize Crop

The field experiments clearly revealed the positive effects of weather forecast-based agro-advisories on maize crop performance under both farmers’ practices as well as recommended farming practices (Figure 7). The improvement in maize yield due to the agro-advisory was statistically significant (p < 0.05) for both farming practices. The results indicate that the adoption of recommended farming practices increased the yield by about 24% over farmers’ practices. The increase in yield was further accentuated due to the agro-advisory and was found to be further increased in the case of recommended practices (30%) as compared to farmers’ practices (10%). This indicates the increased efficiency of recommended management practices viz. line sowing, proper nutrient management, weed control, and pest management practices when they are performed at the appropriate time based on the in-season weather forecast. Therefore, the in-season, near-real-time weather forecast-based agro-advisory has lots of potential for minimizing the adverse climatic conditions arising due to climatic variability, along with increasing yields.

4. Conclusions

A comparison of daily observed and forecasted weather parameters of five years duration over four separate locations in the high-rainfall and humid northeastern region was evaluated and presented in this study. Results clearly indicate the usability of the medium-range weather forecast over the NEH region for the preparation of agro-advisories. The accuracy of RH and wind speed was good, whereas the accuracy of temperature was average. The usability values for maximum temperatures were better as compared to the minimum temperatures. The region being hilly, the temperature conditions are important for variations in the growth of crops. The usability of the maximum temperature needs improvement during the pre-monsoon season, as the crop cultivation over the region starts from this season due to the high probability of assured rainfall. The minimum temperature plays a crucial role in the determination of optimal growing conditions during the post-monsoon to winter months. Not only the minimum temperature itself, but also the change or drop in minimum temperatures is crucial for the crops for understanding the chance of frost damage. Although not evaluated in our study, this is crucial for the management of livestock such as poultry and piglets, as they are negatively affected by cold stress over the region. However, the accuracy of this parameter is quite low during these times of the year. Hence, there is a need to improve the accuracy of the minimum temperature, which is very crucial for the region. Overall, this study found the medium-range weather forecast for the NEH region to be useful. As the accuracy of the weather parameters during the Kharif season was better, the effect of agro-advisories could be important for crops grown in this season (as shown for maize crops in our study). Further research should be conducted for different seasonal crops grown in various parts of the northeastern hill region to understand the impacts of agro-advisories in detail. However, there remains scope for improvement in some of the crucial weather parameters such as temperature (especially minimum) during specific seasons to make the agro-advisories more specific, useful, and readily adopted by the farmers of the region.

Supplementary Materials

The following supporting information can be downloaded at: https://www.mdpi.com/article/10.3390/agronomy12102529/s1, Figure S1: Evaluation of rainfall forecast at monthly scale over different locations of the north-eastern hill region of India.; Figure S2: Statistical evaluation of different weather parameters forecast over different locations of the northeastern hill region of India; Figure S3: Quantitative evaluation of maximum temperature forecast at monthly scale over different locations of the northeastern hill region of India; Figure S4: Quantitative evaluation of minimum temperature forecast at monthly scale over different locations of the northeastern hill region of India; Figure S5: Quantitative evaluation of morning relative humidity forecast at monthly scale over different locations of the northeastern hill region of India; Figure S6: Quantitative evaluation of afternoon relative humidity forecast at monthly scale over different locations of the northeastern hill region of India; Figure S7: Quantitative evaluation of wind speed forecast at monthly scale over different locations of the northeastern hill region of India.

Author Contributions

Conceptualization—D.C.; data curation—A.N.C., I.W., P.R.A. and S.C.; formal analysis—D.C., S.S., H.D.S. and N.S.; writing—original draft preparation—D.C., S.S., R.S. and P.K.J.; writing—review and editing—V.K.M., S.H., B.K.S., P.K.J. and P.V.V.P. All authors have read and agreed to the published version of the manuscript.

Funding

The research is funded by ICAR (Indian Council of Agricultural Research) Research Complex for NEH (northeastern hill) Region, Umiam, Meghalaya, India under the in-house projects (IXX11363 and IXX14611).

Institutional Review Board Statement

Not applicable.

Informed Consent Statement

Not applicable.

Data Availability Statement

All datasets are included in the manuscript, and additional datasets are available on reasonable request.

Acknowledgments

This research work is a part of the institute projects of ICAR Research Complex for NEH Region entitled “Analysis of historical weather variables and accuracy assessment of the weather forecast for improving the agro advisory” (IXX11363) and “Understanding the rainfall anomalies and its impacts on agriculture of northeastern India” (IXX14611). The authors are thankful to the Director, ICAR Research Complex for the NEH Region for providing guidance and to all the Joint Directors of the regional centers for their support in smooth functioning and data sharing. The authors thank the India Meteorological Department for providing the weather forecast data.

Conflicts of Interest

The authors declare that they do not have any competing or conflict of interest.

References

  1. Rana, R.S.; Prasad, R.; Kumar, S. Reliability of medium range weather forecast in mid hill region of Himachal Pradesh. J. Agrometeorol. 2005, 7, 297–303. [Google Scholar] [CrossRef]
  2. Gao, J.; Shahid, R.; Ji, X.; Li, S. Climate change resilience and sustainable tropical agriculture: Farmers’ perceptions, reactive adaptations, and determinants of reactive adaptations in Hainan, China. Atmosphere 2022, 13, 955. [Google Scholar] [CrossRef]
  3. Osman, M.A.; Onono, J.O.; Olaka, L.A.; Elhag, M.M.; Abdel-Rahman, E.M. Climate Variability and Change Affect Crops Yield under Rainfed Conditions: A Case Study in Gedaref State, Sudan. Agronomy 2021, 11, 1680. [Google Scholar] [CrossRef]
  4. Chakraborty, D.; Sehgal, V.K.; Dhakar, R.; Ray, M.; Das, D.K. Spatio-temporal trend in heat waves over India and its impact assessment on wheat crop. Theor. Appl. Climatol. 2019, 138, 1925–1937. [Google Scholar] [CrossRef]
  5. Bhalerao, A.K.; Rasche, L.; Schneider, U.A. Preparing for a better future: Delphi forecasts on competency development to enhance climate-resilient farming in Northeastern India. Int. J. Sustain. Dev. World Ecol. 2021, 28, 255–266. [Google Scholar] [CrossRef]
  6. Saha, S.; Chakraborty, D.; Choudhury, B.U.; Singh, S.B.; Chinza, N.; Lalzarliana, C.; Dutta, S.K.; Chowdhury, S.; Boopathi, T.; Lungmuana; et al. Spatial variability in temporal trends of precipitation and its impact on the agricultural scenario of Mizoram. Curr. Sci. 2015, 109, 2278–2282. [Google Scholar] [CrossRef]
  7. Rana, R.S.; Sood, R.; Aditya, A.; Shekhar, J. Validation of medium range weather forecasts in sub-temperate and sub-humid climate of western Himalayas. Ind. J. Agric. Sci. 2013, 83, 1357–1363. [Google Scholar]
  8. Sarmah, K.; Neog, P.; Rajbongshi, R.; Sarma, A. Verification and usability of medium range weather forecast for north bank plain zone of Assam, India. Mausam 2015, 66, 585–594. [Google Scholar] [CrossRef]
  9. Pathak, H.; Pramanik, P.; Khanna, M.; Kumar, A. Climate change and water availability in Indian agriculture: Impacts and adaptation. Ind. J. Agric. Sci. 2014, 84, 671–679. [Google Scholar]
  10. Saha, S.; Chakraborty, D.; Paul, R.K.; Samanta, S.; Singh, S.B. Disparity in rainfall trend and patterns among different regions: Analysis of 158 years’ time series of rainfall dataset across India. Theor. Appl. Climatol. 2018, 134, 381–395. [Google Scholar] [CrossRef]
  11. Chakraborty, D.; Saha, S.; Singh, R.K.; Sethy, B.K.; Kumar, A.; Saikia, U.S.; Das, S.K.; Makdoh, B.; Borah, T.R.; Chanu, A.N.; et al. Spatio-temporal trends and change point detection in rainfall in different parts of North-eastern Indian states. J. Agrometeorol. 2017, 19, 160–163. [Google Scholar] [CrossRef]
  12. Gbangou, T.; Sarku, R.; Slobbe, E.V.; Ludwig, F.; Kranjac-Berisavljevic, G.; Paparrizos, S. Coproducing weather forecast information with and for smallholder farmers in Ghana: Evaluation and design principles. Atmosphere 2020, 11, 902. [Google Scholar] [CrossRef]
  13. Chattopadhyay, N.; Ghosh, K.; Malathi, K.; Bhowmik, S.R.; Singh, K. Verification of district level weather forecast. Mausam 2016, 67, 829–840. [Google Scholar] [CrossRef]
  14. Mandal, V.; De, U.K.; Basu, B.K. Precipitation forecast verification of the Indian summer monsoon with intercomparison of three diverse regions. Weather Forecast. 2007, 22, 428–443. [Google Scholar] [CrossRef]
  15. Vashisth, A.; Das, D.K.; Bhagawati, G.; Sharma, P.K. Accuracy of weather forecast for semiarid climate of Delhi for Agricultural management practices. J. Agric. Phys. 2008, 8, 51–58. [Google Scholar]
  16. Rajavel, M.; Khare, P.; Sahu, M.L.; Prasad, J.R. District level weather forecast verification in Chhattisgarh. Mausam 2019, 70, 841–852. [Google Scholar] [CrossRef]
  17. Kaur, N.; Singh, M.J. Verification of medium range weather forecast for the Kandi region of Punjab. Mausam 2019, 70, 825–832. [Google Scholar] [CrossRef]
  18. Saha, S.; Das, B.; Chakraborty, D.; Chawdhury, S.; Lalliansanga, S.; Saithantluanga, H. Quantitative Accuracy Assessment of District Level Rainfall Forecast in Mizoram. J. Agric. Phys. 2021, 21, 332–340. [Google Scholar]
  19. Gupta, V.K.; Agrawal, K.K.; Upadhyay, A.P.; Shanker, U. Reliability of medium-range weather forecast for Jabalpur region of Madhya Pradesh. Ind. J. Agric. Sci. 2013, 67, 120–123. [Google Scholar]
  20. Chauhan, V.S.; Chaudhari, G.B.; Pandey, V. Medium range weather forecast verification for middle Gujarat region. J. Agrometeorol. 2008, 10, 90–93. [Google Scholar]
Figure 1. Evaluation of rainfall forecast based on the accuracy (a) and statistical parameters (b) over distinct locations of the northeastern hill region of India.
Agronomy 12 02529 g001
Figure 2. Quantitative (a) and statistical evaluation (b) of maximum temperature forecast over distinct locations of the northeastern hill region of India.
Agronomy 12 02529 g002
Figure 3. Quantitative (a) and statistical evaluation (b) of minimum temperature forecast over various locations of the northeastern hill region of India.
Agronomy 12 02529 g003
Figure 4. Quantitative (a) and statistical evaluation (b) of RH (morning) forecast over distinct locations places of the northeastern hill region of India.
Agronomy 12 02529 g004
Figure 5. Quantitative (a) and statistical evaluation (b) of RH (afternoon) forecast over various locations of the northeastern hill region of India.
Agronomy 12 02529 g005
Figure 6. Quantitative (a) and statistical evaluation (b) of wind speed forecast over various locations of the northeastern hill region of India.
Agronomy 12 02529 g006
Figure 7. Effect of agro-advisory on maize crop yield under different farming practices. Means denoted by the same letters indicate no significant difference at p < 0.05 as evaluated by Tukey’s HSD test. V1 (RCM-1-76) and V2 (DA 61 A) are two maize crop varieties selected for this study.
Agronomy 12 02529 g007
Table 1. Detailed information about various locations of the meteorological observatories in the northeastern hill region of India.
StatePlaceLatitudeLongitudeAltitude (Meter)
MeghalayaUmiam25°41′ N91°55′ E1010
NagalandJharnapani25°45′ N93°50′ E250
ManipurImphal24°45′ N93°54′ E774
MizoramKolasib24°12′ N92°40′ E635
Table 2. Error structure for the verification of the accuracy of different weather parameters in this study in the northeastern hill region of India.
UsabilityTemperature
(Min. and Max.) (°C)
Relative Humidity (Morning and Afternoon) (%)Wind Speed
(km/h)
Correct<1<10<1
Usable1–210–201–3
Not Usable>2>20>3
Rainfall
Forecasted Observed
RainNo Rain
Rain Hits (H)False Alarms (F)
No Rain Misses (M)Correct Negatives (Z)
Note: All the values indicate the absolute difference between the observed and forecasted values.
Table 3. Correlation coefficient between the forecasted and observed weather parameters over various locations of the northeastern hill region of India.
(a)
Umiam Jharnapani
TmaxTminRHmorRHanoWS TmaxTminRHmorRHanoWS
2014Winter0.39 *0.58 *−0.190.47 *−0.01 0.65 **0.63 **0.070.33 *0.06
Pre-monsoon0.42 *0.29 *0.200.46 *0.34 * 0.36 *0.70 **0.36 *0.24 *0.29 *
Monsoon0.53 *0.36 *0.23 *0.24 *−0.02 0.25 *0.33 *−0.020.32 *0.19
Post monsoon0.70 **0.70 **0.190.32 *−0.16 0.69 **0.55 *0.010.45 *0.13
2015Winter0.59 *0.37 *−0.180.45 *−0.34 * 0.66 **0.43 *0.180.32 *−0.08
Pre-monsoon0.44 *0.39 *0.210.48 *0.10 0.30 *0.64 **0.060.06−0.17
Monsoon0.53 *0.46 *0.25 *0.28 *0.13 0.48 *0.31 *−0.090.28 *0.16
Post monsoon0.42 *0.54 *0.170.36 *0.13 0.61 **0.69 **0.130.41 *0.06
2016Winter0.62 **0.68 **0.180.04−0.24 * 0.50 *0.29 *0.130.42 *0.06
Pre-monsoon0.23 *0.180.120.180.17 0.41 *0.60 **0.140.120.24 *
Monsoon0.100.070.36 *0.180.00 0.190.130.050.090.13
Post monsoon0.34 *0.64 **−0.080.51 **−0.06 0.66 **0.48 *0.040.44 *0.07
2017Winter0.43 *0.42 *0.120.29 *−0.20 0.32 *0.170.050.51 *0.00
Pre-monsoon0.63 **0.210.120.180.17 0.44 *0.35 *−0.030.38 *0.11
Monsoon0.64 **0.27 *0.46 *0.23 *0.00 0.39 *0.29 *0.140.12−0.05
Post monsoon0.59 *0.63 **0.30 *0.58 *−0.06 0.42 *0.39 *−0.070.33 *0.20
2018Winter0.35 *0.27 *0.190.21−0.10 0.200.35 *−0.040.18−0.09
Pre-monsoon0.63 **0.46 *0.29 *0.030.10 0.41 *0.47 *0.25 *0.180.05
Monsoon0.32 *0.100.23 *0.26 *0.00 0.27 *0.26 *0.24 *0.110.23 *
Post monsoon0.39 *0.34 *0.24 *0.40 **0.08 0.35 *0.56 *−0.070.200.17
(b)
Imphal Kolasib
Tmax Tmin RHmor RHano WS Tmax Tmin RHmor RHano WS
2014Winter0.50 *0.52 *−0.160.29 *−0.05 0.61 **0.29 *0.140.33 *0.06
Pre-monsoon0.53 *0.39 *0.24 *0.34 *−0.19 0.28 *0.070.24 *0.040.17
Monsoon0.39 *0.06−0.090.27 *0.32 * 0.25 *0.36 *0.020.220.26 *
Post monsoon0.190.23 *0.120.48 *0.15 0.47 *0.53 *−0.04−0.040.03
2015Winter0.41 *0.16−0.060.30 *−0.35 * 0.44 *0.43 *0.65 **0.67 **0.18
Pre-monsoon0.110.26 *0.090.35 *−0.04 0.25 *0.190.26 *0.46 *0.07
Monsoon0.36 *0.070.190.24 *−0.03 0.25 *−0.03−0.070.090.28 *
Post monsoon0.100.83 **−0.060.46 *−0.07 0.53 *0.360.060.36 *0.07
2016Winter0.180.28 *−0.050.48 *−0.07 0.57 *0.56 *−0.160.27 *0.04
Pre-monsoon0.28 *0.26 *0.29 *0.31 *−0.02 0.35 *0.23 *0.190.32 *0.08
Monsoon0.16−0.03−0.060.080.00 −0.070.040.010.160.24 *
Post monsoon0.040.52 *0.160.45 *−0.01 0.25 *0.39 *0.170.58 **0.04
2017Winter0.37 *0.42 *−0.180.46 *−0.07 0.25 *0.30 *−0.140.51 *0.03
Pre-monsoon0.40 *0.32 *0.210.38 *−0.04 0.37 *0.31 *0.50 *0.32 *0.19
Monsoon0.110.05−0.050.160.12 0.28 *0.21−0.030.120.07
Post monsoon0.45 *0.57 *0.29 *0.33 *−0.08 0.180.48 *0.180.18−0.02
2018Winter0.190.41 *0.26 *0.34 *0.08 0.30 *0.49 *0.23 *0.220.24 *
Pre-monsoon0.42 *0.54 *0.30 *0.00−0.06 0.27 *0.200.36 *0.200.20
Monsoon0.070.200.24 *0.210.19 0.45 *0.29 *−0.040.190.37 *
Post monsoon0.25 *0.39 *0.31 *0.43 *−0.02 0.47 *0.70 **0.21 *0.57 *−0.01
Note: ** and * denote 1% and 5% significance level, respectively. RH (relative humidity) recorded during morning and afternoon is indicated as RHmor and RHano, respectively.
Publisher’s Note: MDPI stays neutral with regard to jurisdictional claims in published maps and institutional affiliations.

