Article

Effect of Arbuscular Mycorrhizal Fungal Seed Coating on Grain Protein and Mineral Composition of Old and Modern Bread Wheat Genotypes

by
Michele Andrea De Santis
1,
Marcella Michela Giuliani
1,
Zina Flagella
1,*,
Elisa Pellegrino
2,* and
Laura Ercoli
2
1
Department of Agriculture, Food, Natural Resources and Engineering (DAFNE), University of Foggia, Via Napoli 25, 71122 Foggia, Italy
2
Crop Science Research Center, Scuola Superiore Sant’Anna, Piazza Martiri della Libertà 33, 56127 Pisa, Italy
*
Authors to whom correspondence should be addressed.
Agronomy 2022, 12(10), 2418; https://doi.org/10.3390/agronomy12102418
Submission received: 7 September 2022 / Revised: 3 October 2022 / Accepted: 4 October 2022 / Published: 6 October 2022

Abstract

:
The effect of arbuscular mycorrhizal fungi (AMF) on yield and quality was investigated on a set of seven bread wheat genotypes with varying years of release, including five old genotypes and two modern varieties. A two-year field trial was conducted in central Italy under rainfed conditions. The effect of AM fungal seed coating was proved by assessing the AM fungal root colonization and studied on agronomic and quality traits, and in particular on gluten-forming proteins and grain mineral composition. AMF seed coating led to a general yield improvement in old genotypes (+24%). Concerning the effects on grain quality, while modern genotypes showed an increase in protein content (+16%), in the old ones an improvement of gluten quality was observed, with an increased proportion of HMW-GS from +17% to +92%. The gluten index results were mostly influenced by HMW-GS allelic configuration and amount, showing a significant correlation with gliadin-to-glutenin ratio and HMW-GS to LMW-GS. Concerning mineral uptake, AM fungal treatment determined a general increase in P content, which was more marked in the modern group (+44%). Furthermore, AMF significantly increased mean Fe concentration in Verna (+53%) and Bologna (+45%). Finally, phytate content did not increase with AMF, without affecting mineral bioavailability.

1. Introduction

Wheat (Triticum aestivum L.) is the major crop in the world, generally cultivated in temperate areas, and is a staple food in the human diet as a source of carbohydrates and proteins. Flour-based products include bread, noodles, and bakery products, with specific requirements for industry in terms of technological quality. Breeding activity across the 20th and 21st century led to the selection of genotypes with good adaptability, higher productivity and resistance to environmental stress (abiotic and biotic), and good grain quality. This selection, promoted in Italy by Nazareno Strampelli and developed by Norman Borlaug with the introduction of the Reduction of height genes (Rht), led to the release of varieties with shortened crop cycle, reduced plant size, and good resistance to biotic and abiotic stresses. A further target of the breeding was the improvement of end-use quality [1,2,3]. The quality of wheat mainly depends on protein content and on the composition of the storage proteins, also called gluten-forming proteins; these are constituted by monomeric gliadins (ω-, γ- and α- type) and polymeric glutenins (HMW-GS and LMW-GS), whose mixture determines the viscoelastic properties of dough [4]. Modern varieties have been selected for favourable alleles and a higher expression of glutenins [5,6,7]. Other wheat traits associated with nutritional and health quality, especially for wholemeal products, include dietary fibre, bioactive compounds, vitamins, and micronutrients [8,9].
Despite the strong commitment of genetic improvement to enhance the quantity and quality of crop production, agronomic management is developing new strategies and techniques to promote stability in a climate change scenario. The use of microorganisms as biofertilizers is a promising approach for their potential to reduce chemical inputs. Arbuscular mycorrhizal fungi (AMF, phylum Glomeromycota [10]) are known for their favourable interaction with plants and are associated with the promotion of plant growth, mineral uptake, and biotic/abiotic tolerance [11]. The resulting symbiosis may be associated with the increase of wheat grain yield and mineral uptake [12,13]; however, the effectiveness of the interaction is also subjected to environmental and plant genetic variability [14]. The genetic variability within the Mediterranean germplasm, especially for old landraces, is strongly influenced by the basin of origin with consequences for root and crop adaptation to the environmental factors, also affecting grain quality [15].
In a recent study, a variable effect was reported of the field AM fungal inoculation of Rhizophagus irregularis DAOM 197198 with old and modern wheat varieties in terms of increase in growth and micronutrient (Zn and Fe) uptake in shoots and grains, with modification in root AM fungal community [16]. However, no information is available on the effects of AM fungal inoculation on other major quality traits, such as grain protein composition.
To this aim, we selected the species R. irregularis since it is ubiquitous and colonizes the roots of wheat, with beneficial effects in grain and straw production [12]. The isolate MUCL43194 (also named DAOM 197198 and DAOM 181602) of R. irregularis was selected because it is easy to grow and reproduce in in vitro culture [17], which is a feature highly appreciated for large-scale production of biofertilizers [18]. Moreover, in previous studies, this isolate has been reported to produce a highly anastomized extraradical mycelium [19] able to increase host nutrient acquisition due to its spreading into the surrounding soil [20]. Finally, this isolate was successfully traced in field studies using an isolate-specific molecular probe and was reported to persist within the roots of the inoculated crop at its original abundance, after the first inoculation, or increased over time in different sites, although the abundance was very low in some cases [21]. In this study, the compatibility between R. irregularis MUCL 43194 and wheat varieties with varying years of release was explored in relation to both crop productivity and improvement of grain quality. Moreover, differences in protein content and technological quality due to biofertilization treatment were studied in relation to changes in storage protein composition. Finally, nutritional quality was evaluated in terms of Fe and Zn concentration and bioavailability.

2. Materials and Methods

2.1. Experimental Set-Up and Crop Management

The field experiment was carried out in 2014/2015 and 2015/2016, at the Centre of Agro-environmental Research (CIRAA) in San Piero a Grado (Pisa) on adjacent fields. The soil at the experimental site in 2014/2015 and 2015/2016 was classified as silty-clay-loam (sand, silt, and clay: 11.5%, 51.0%, 37.5%) and sandy-clay-loam (sand, silt, and clay: 49.7%, 20.8%, and 29.5%), respectively, according to the USDA soil taxonomy [22]. Soil pH in 2014/2015 was 7.5 and plant available Zn and Fe concentrations were 0.48 mg kg−1 (low availability) and 21 mg kg−1 (medium availability), respectively, whereas in 2015/2016 soil pH was 7.9 and available Zn and Fe were 0.83 mg kg−1 (low availability) and 20 mg kg−1 (medium availability), respectively [23]. The climate of the site is cold, humid Mediterranean (Csa), according to the Köppen–Geiger climate classification. The 10-year average (2009–2018) of mean annual maximum and minimum temperatures is 20.4 and 11.0 °C, respectively, and annual precipitation is 565 mm, with 367 mm during the wheat cropping cycle from November to June [16]. Rainfall at the experimental site was higher than the 10-year average, and varied over the two wheat cropping seasons: in 2014/2015 it was 763 mm and in 2015/2016 it was 622 mm (Figure 1). Conversely, temperature over the cropping cycles was similar to the 10-year average.
For each experiment, a three-factorial experimental design with genotype [seven bread wheat (Triticum aestivum L.) genotypes with different years of release (Table 1)], AM fungal inoculation (AM fungal inoculation, +M; mock-inoculated, -M), and year of cultivation (Y) was arranged as a split-plot design, with AM fungal inoculation as the main plot factor and genotype as the split-plot factor. Three replicate plots were set up. The area of each plot was 100 m2 (10 m × 10 m). AM fungal inoculation was carried out by coating the seeds with 0.55 g m−2 (5556 spore m−2) of Rhizophagus irregularis MUCL43194. Nitrogen fertilizer was applied, as urea, at tillering and at stem elongation at 40 and 40 kg N ha−1, respectively.

2.2. Arbuscular Mycorrhizal Fungal Root Colonization

At the end of tillering (GS26; 2nd April 2015 and 31st March 2016) and at booting growth stages (GS45; 28th May 2015 and 1st June 2016) [24], three plants, randomly selected in each replicate plot, were excavated with the root system (nine plants per treatment, a total of 126 root samples for each growth stage and year of cultivation). Roots were separated from soil by gently washing with tap water. AM fungal root colonization was assessed by clearing and staining using lactic acid instead of phenol [25], and using the gridline intersect method [26] under a stereomicroscope (Olympus SZX 9, Olympus Optics, Tokyo, Japan).

2.3. Determination of Grain Yield, Yield Components, and Grain Quality

At physiological maturity (GS90) [24], plants from a 1 m2 area for each replicate plot were manually cut at ground level and number of spikes was determined. Plants were then partitioned into straw, chaff, and grain. For yield determination (GY), plants from each plot were harvested by a plot combine. For dry weight determination, samples from all plant parts were oven dried at 65 °C, up to constant weight. Mean kernel dry weight (KW) and number of kernels per spike (K/S) were calculated. Grain protein content (GPC) and gluten index (GI) were assessed as reported by [3].

2.4. Analysis of Protein Composition and Quality

The analysis of gluten protein composition was performed according to [27]. Briefly, 100 mg of flour was suspended in 0.4 mL of KCl buffer (pH 7.8) and centrifuged to remove soluble proteins. The KCl-insoluble fraction was suspended by extraction solution (1-propanol 50% v/v, 1% DTT), after centrifugation at 10,000 g for 10 min (room temperature). Extracted glutenins and gliadins were quantified by the Bradford method. The storage proteins were separated by SDS-PAGE (T 12%, C 1.28%) at 25 mA (4 h at 10 °C) using an SE 600 apparatus (Hoefer, Inc., Holliston, MA, USA). Gels were stained with Coomassie Brilliant Blue G250 and digitally acquired (Epson Perfection V750pro). HMW-GS allelic configuration of the Glu1 Quality score was determined according to Payne and Lawrence (1983). Relative subunit expression was performed by densitometric analysis by software ImageQuantTL (GE Healthcare, Bio-sciences AB). Gels were subdivided into HMW-GS and B-type LMW-GS for glutenins, and ω-type (S-poor) and γ-type/α-type (S-rich) for gliadins. Storage protein composition was expressed as the ratios between gliadin-to-glutenin (glia/glut), HMW-GS to B-type LMW-GS (H/L), and S-poor to S-rich gliadin (S−/S+ glia).

2.5. Phytate and Mineral Determination

For phytate determination, 60 mg of samples was extracted with 10 mL of 0.2 N HCl at room temperature for 2 h under continuous shaking. All determinations were made in flour and bread. Phytate in the extract was determined by an indirect method as detailed by [28] on a UV−vis spectrophotometer (Lambda 35, PerkinElmer, Norwalk, CT, USA). For the determination of grain Fe and Zn concentration, 0.2 g of samples was digested in concentrated nitric acid (HNO3). Iron and Zn concentrations in the digest were measured by an atomic absorption spectrophotometer (model 373, PerkinElmer, Norwalk, CT, USA) [29].

2.6. Statistical Analysis

Data were subjected to analysis of variance (ANOVA), with genotype (G) and AM fungal inoculation (AMF) as fixed factors and year (Y) as random effect. A post-hoc Tukey B significant difference test was used for comparison among means (HSD, P ≤ 5%). Statistical analysis was performed by means of JMP software (Version 8.0.2, SAS Institute Inc., Cary, NC, USA, 2009). The Pearson correlation analyses between fungal, agronomic, and quality parameters were performed on square root and standardized data (standardization by the total values of the variables). This data matrix was also the input data for building a shade plot image, representing the studied quantity parameters in all treatments by the depth/colour of shading. The Pearson analyses and the shade plot representation were performed by PRIMER v7. For each group of genotypes, old and modern, differences between the AMF-treated samples (+M) and the untreated controls (−M) in percent changes were compared by unpaired Student’s t-test.

3. Results

3.1. AM Fungal Root Colonization

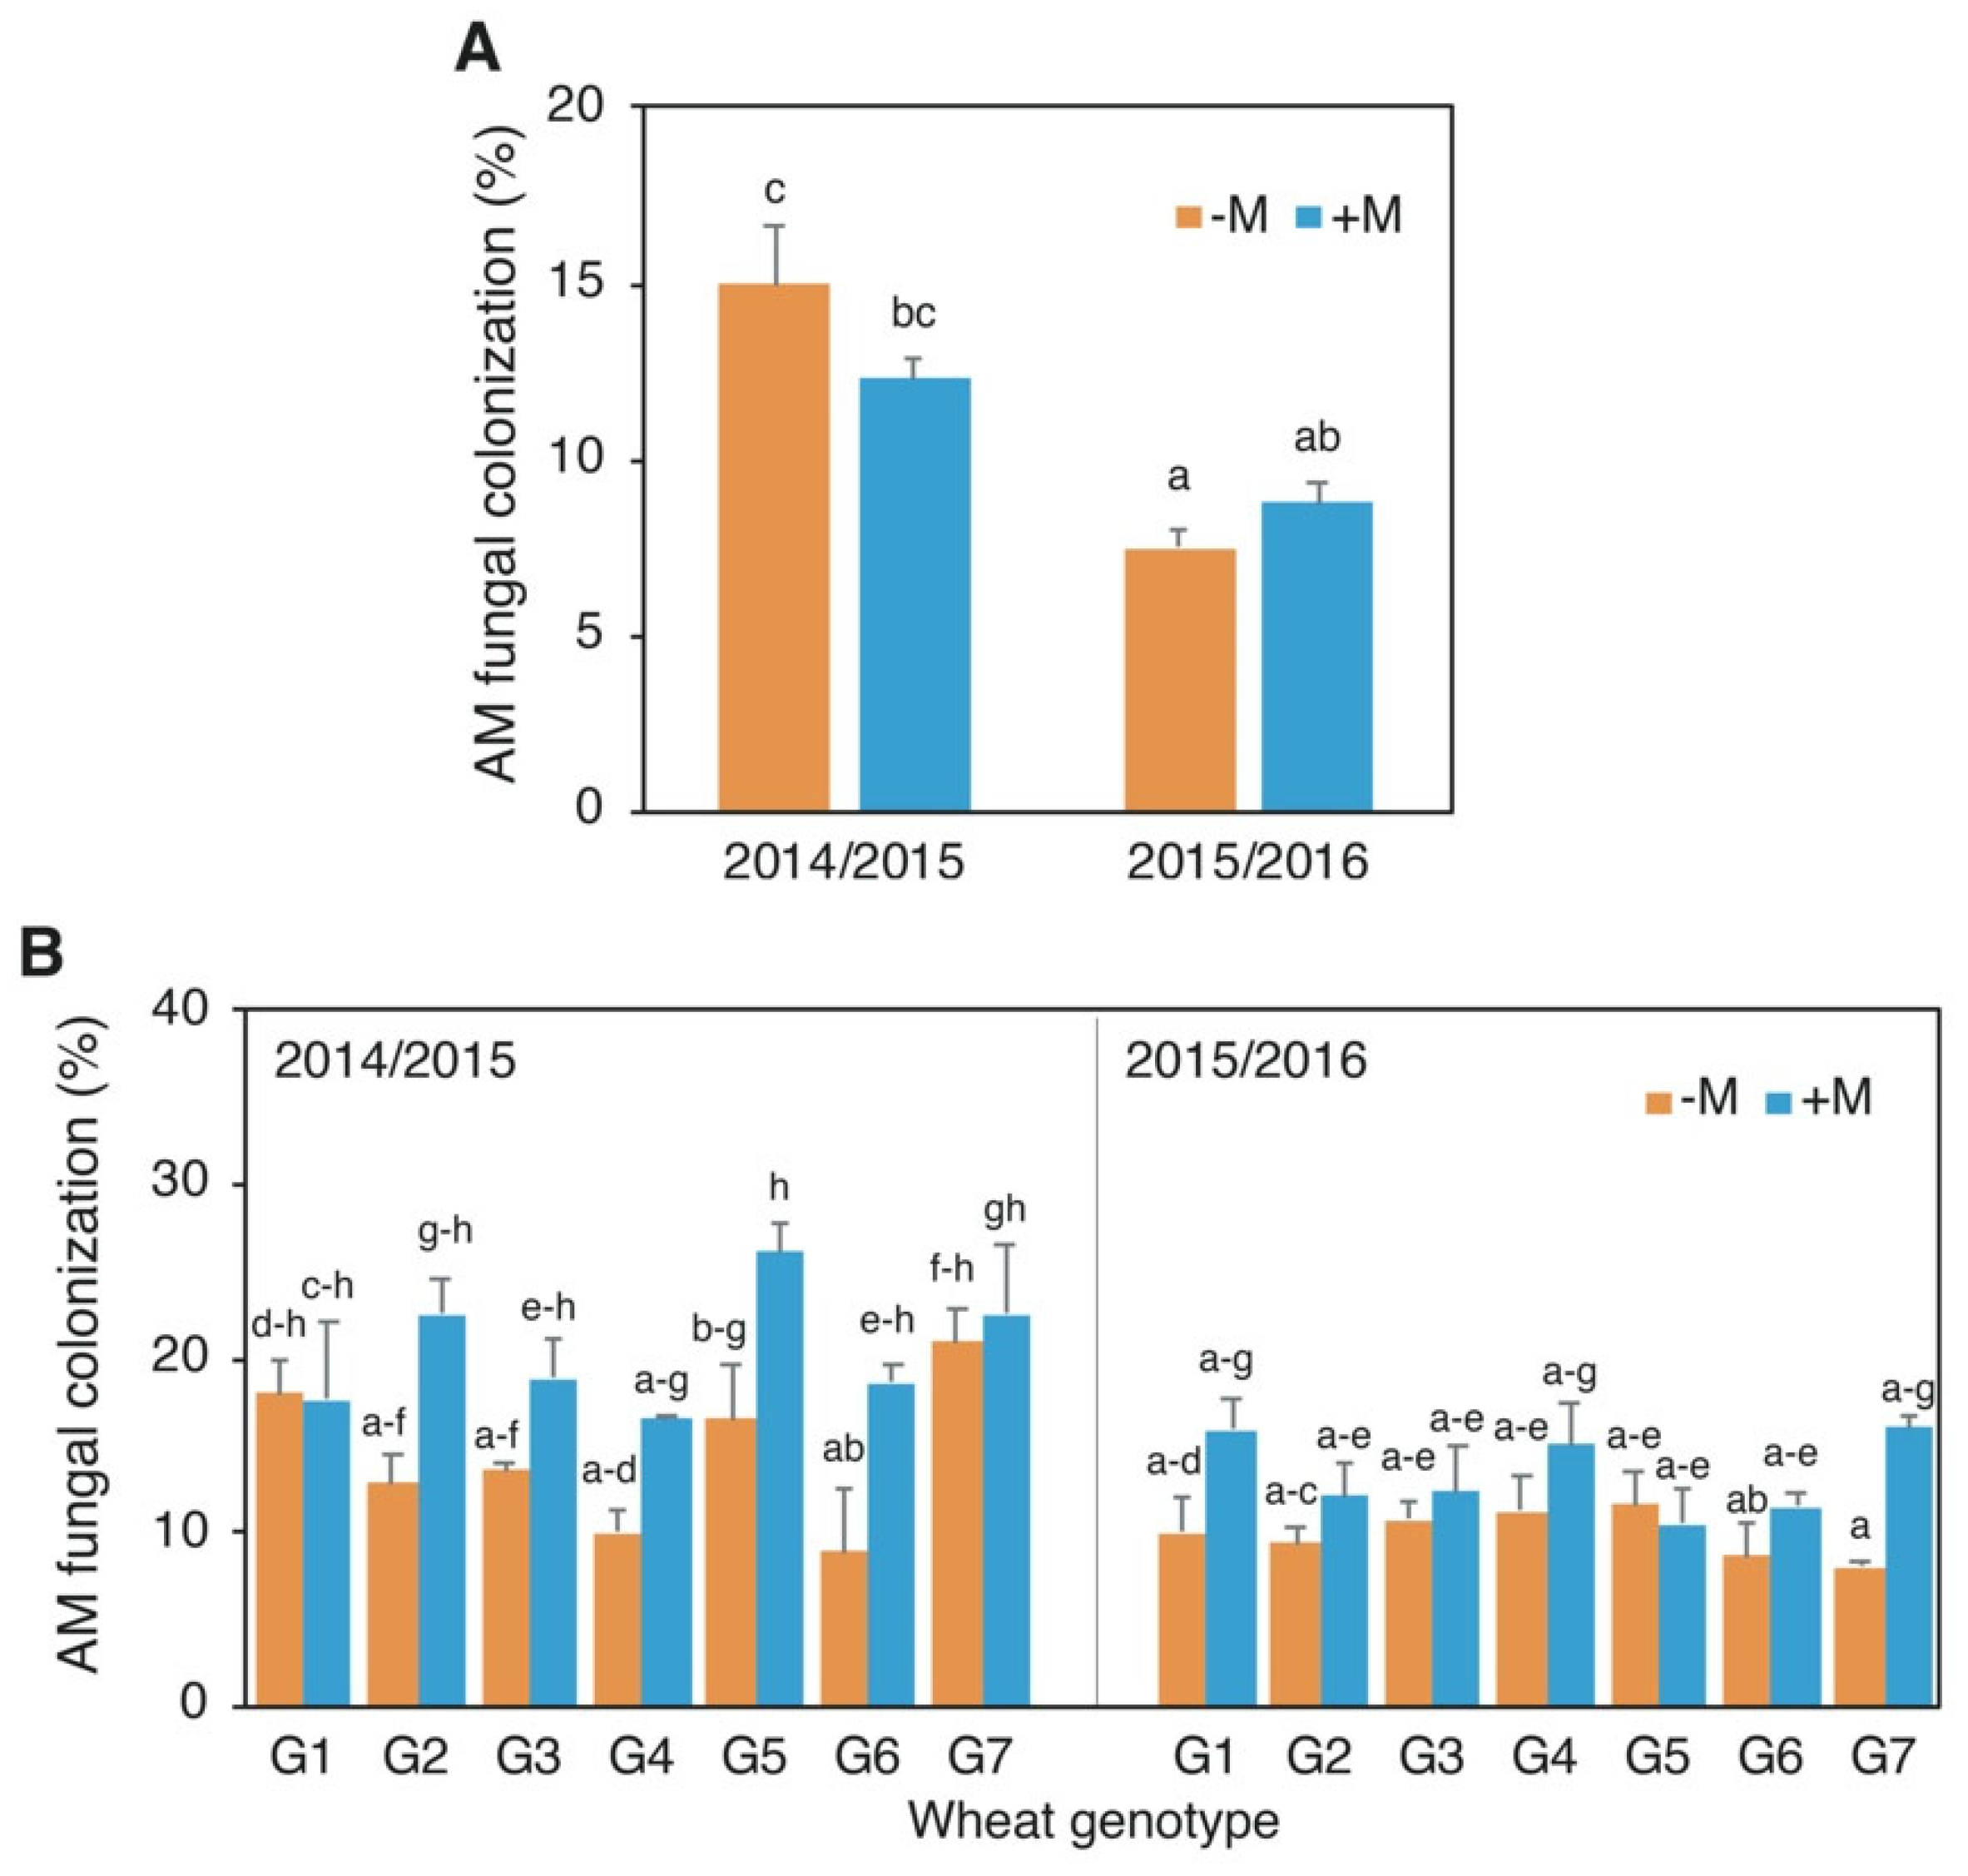
At GS26, AM fungal root colonization was affected by the interaction AM fungal inoculation and year of cultivation, while it was not affected by the interaction G × AMF × Y (Table 2). Arbuscular mycorrhizal fungal inoculation did not modify AM fungal root colonization in both years and values were higher in 2014/2015 than in 2015/2016 (Figure 2A). However, in 2015/2016 inoculation increased the AM fungal colonization up to values similar to the inoculated treatments in 2014/2015. By contrast, at GS45, AM fungal root colonization was affected by the interaction G × AMF × Y (Table 2). In 2014/2015, AM fungal root colonization was significantly increased by AM fungal inoculation in Risciola (G2), Verna (G5), and Blasco (G6), whereas in the other genotypes colonization was non modified (Figure 2B). In 2015/2016, AM fungal colonization was not modified by inoculation in any wheat genotype.

3.2. Grain Yield and Yield Components

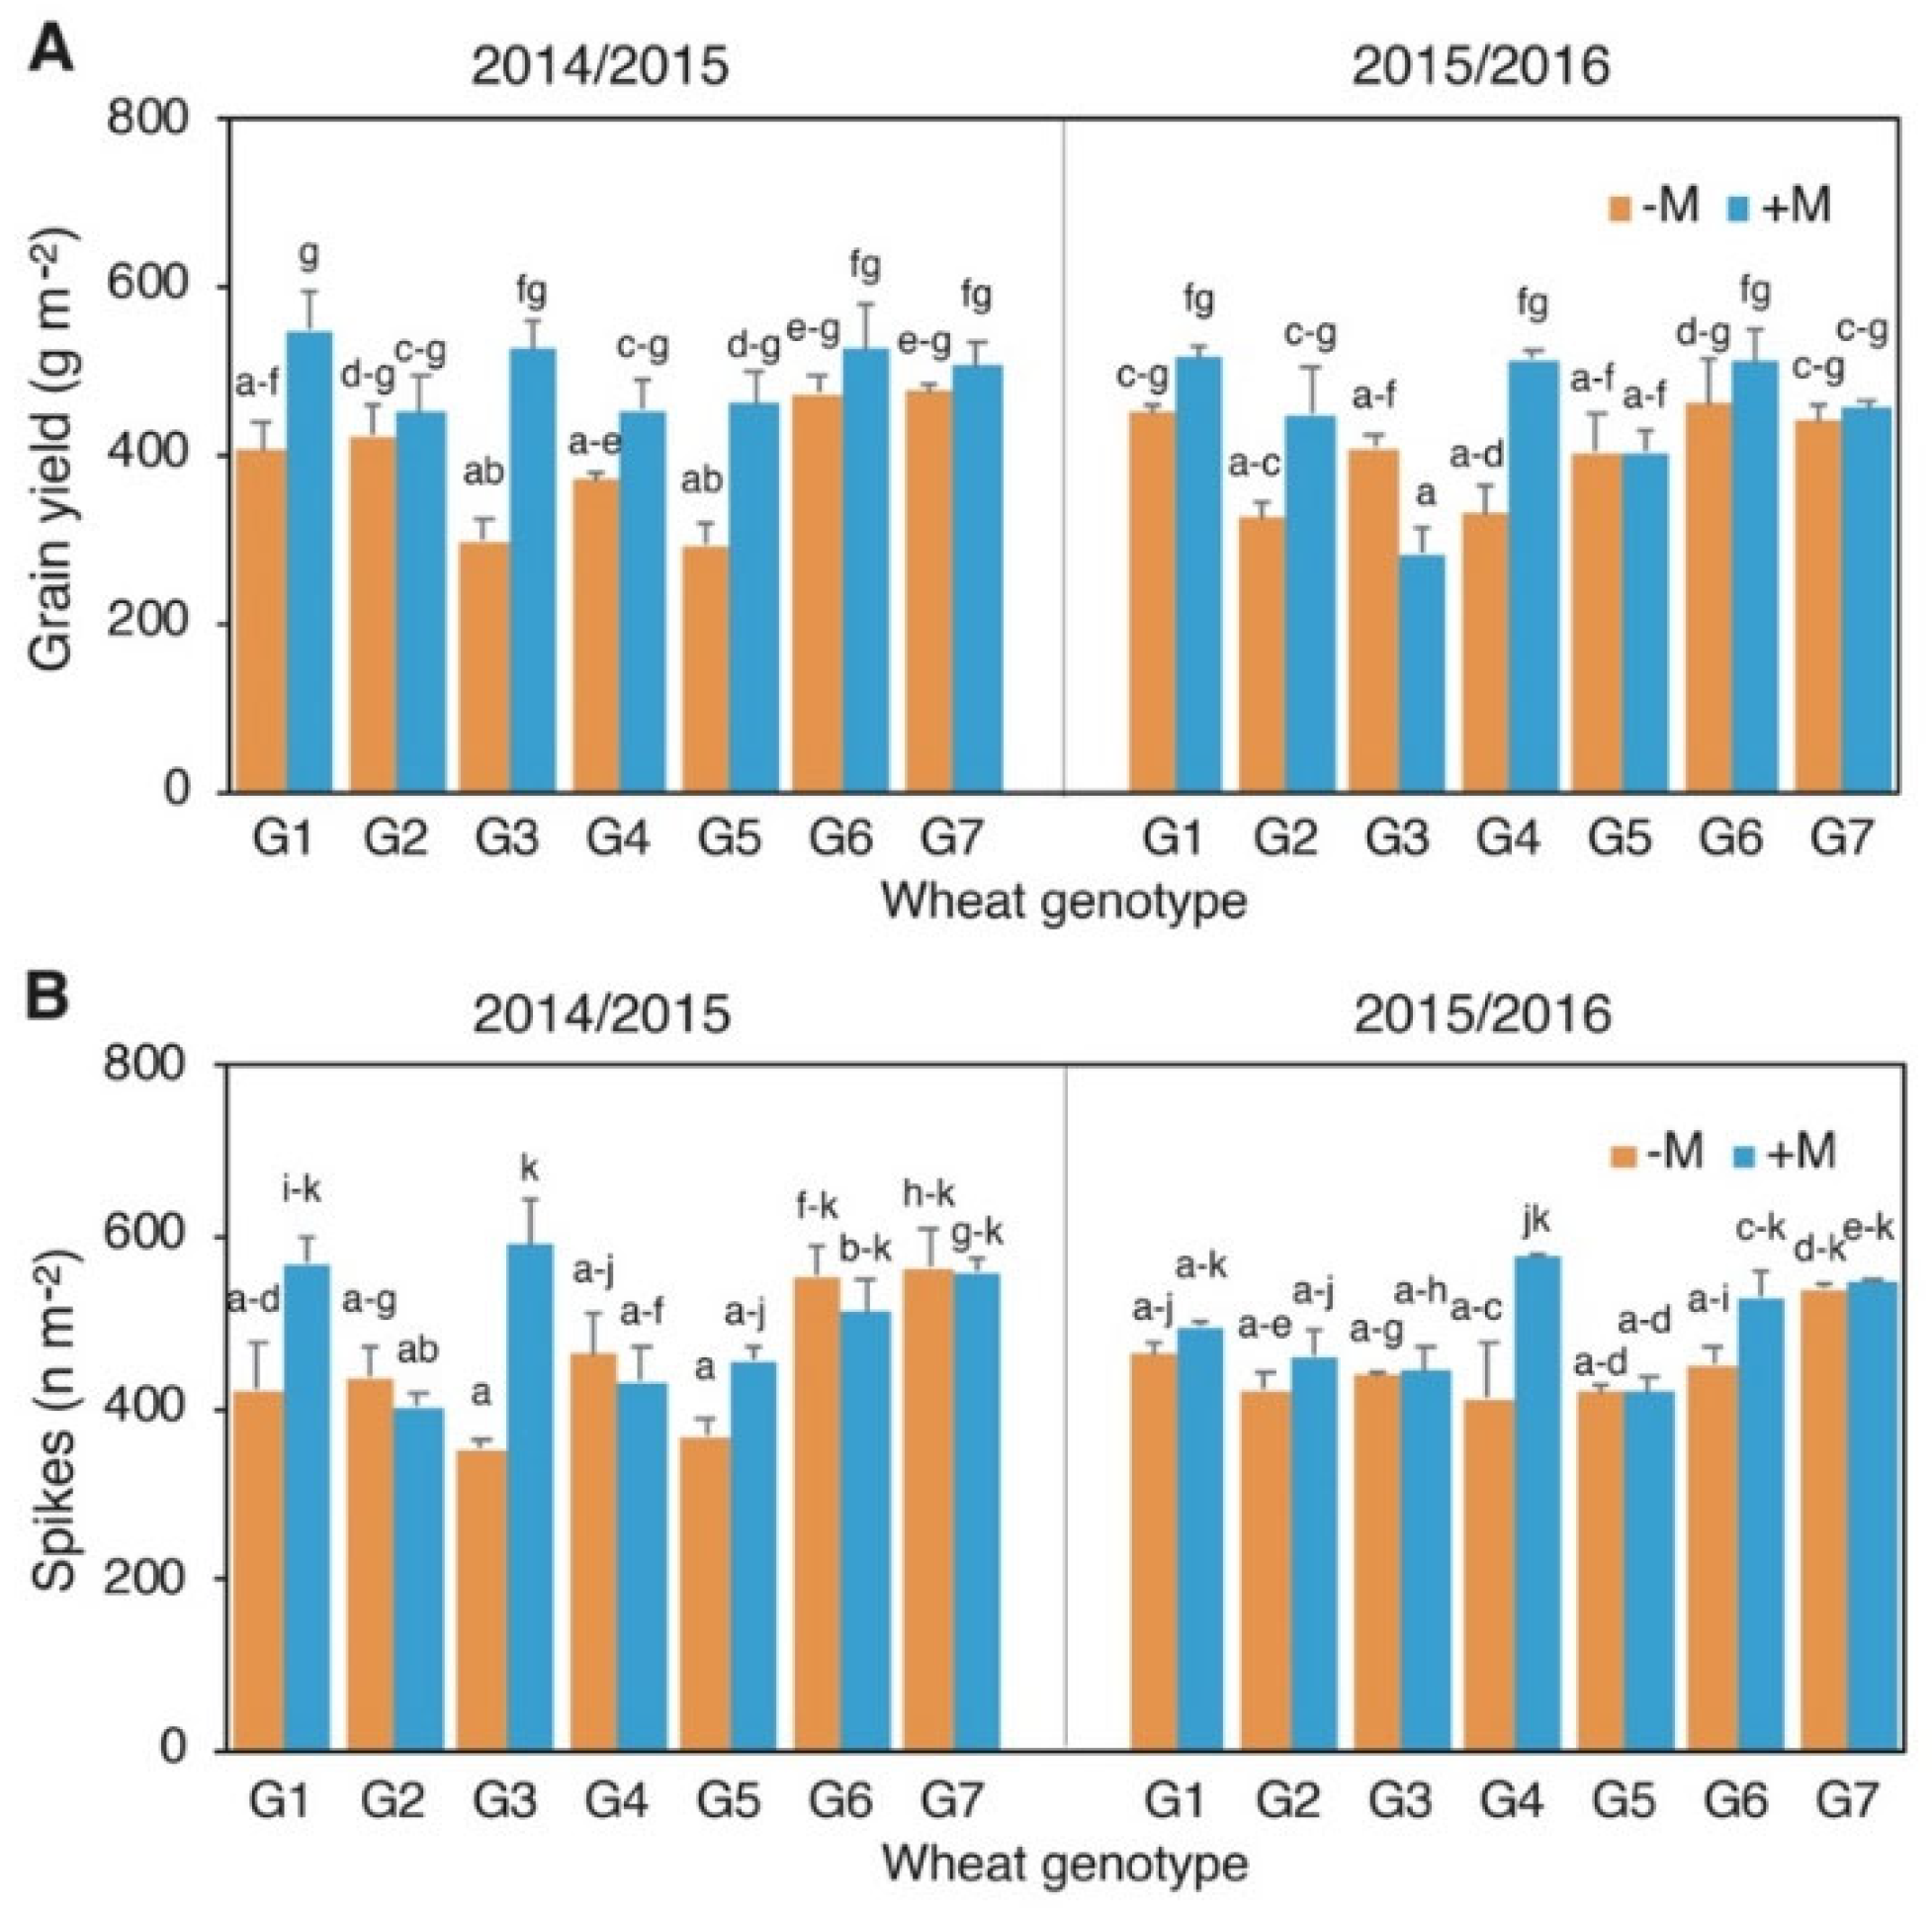
No significant differences in grain yield were observed between the two crop years. The interaction G × AMF × Y showed a significant increase in GY only for the old genotypes Gentil Rosso (G1, +35%), Frassineto (G3, +76%), and Verna (G5, +58%) in 2014/2015, and for Autonomia B (G4, +55%) in 2015/2016 (Figure 3A) due to AMF fungal treatment. This productive improvement was mainly associated with a significant increase of spikes per unit area (Figure 3B) while no relation was observed with the number of kernels per spike (K/S) and with MKW. These results were also confirmed by the analysis of correlations (Table 3). The main values relative to the two groups of genotypes showed a significant increase in yield due to AMF only in the old group (+24%, Table 4).

3.3. Protein Content and Composition

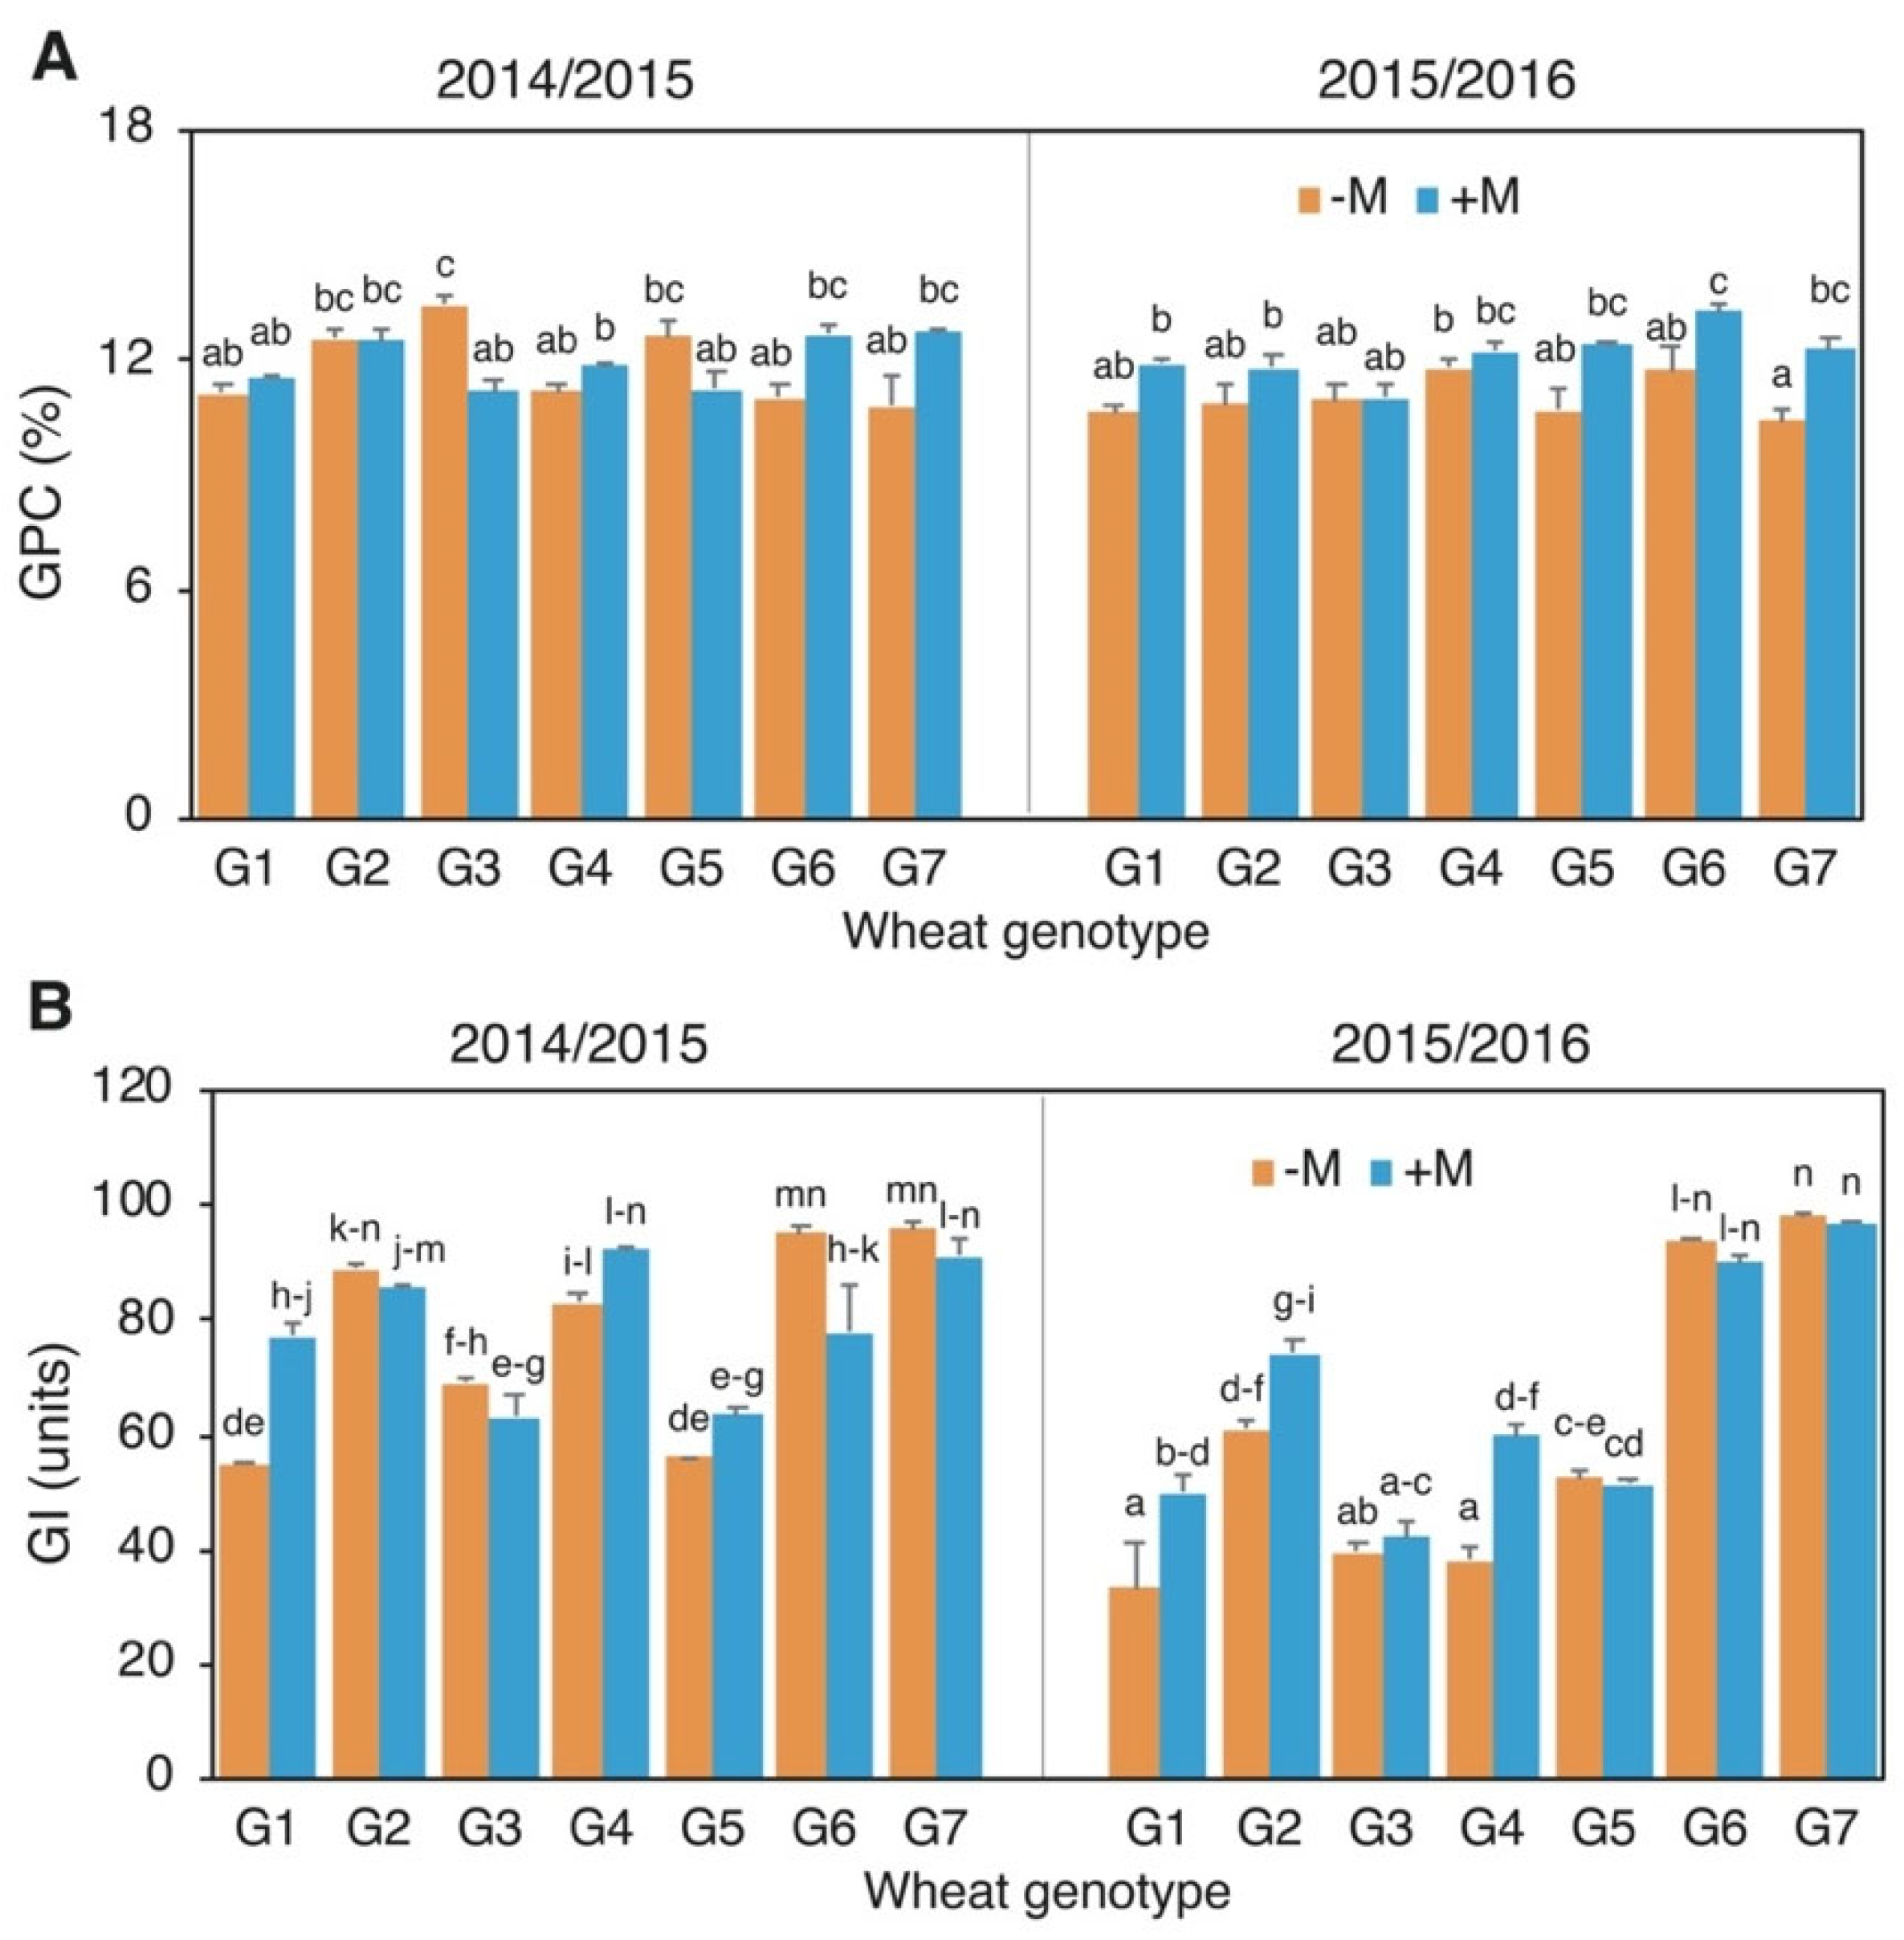
The significant interaction G × AMF × Y determined a contrasting response of genotypes to the AMF treatment. In particular, only modern Bologna (G7) showed, in both crop years, an increase of GPC (+18%) with seed coating mycorrhization, while Blasco (G6) only in 2014/2015 (+15%) and Verna in 2015/2016 (+16%) (Figure 4A). In general, GPC showed a significant increase with AMF treatment only in the modern group (+16%), as reported in Table 4.
Th gluten index (GI) was mainly dependent on genetic structure. Indeed, HMW-GS allelic configuration influences the quality of gluten technological quality, as confirmed by a different quality score (Table 1). The two modern genotypes, Blasco and Bologna, showed the highest GI values, while Gentil Rosso and Verna showed the lowest quality score and GI. Secondarily, environmental differences, in terms of crop season variability, were observed with higher mean GI in 2014/2015 than in 2015/2016 (Figure 4B). As for the effect of the AM fungal treatment on gluten technological properties, a significant mean increase in GI was observed in +M with respect to –M (Table 2). In particular, this resulted in a higher GI in old Gentil Rosso (G1) +M in both years (+45%) and Risciola (G2 +M) and Autonomia B (G4 +M, +58%) in 2015/2016 (Figure 4). The modern group of genotypes was not markedly affected (Figure 4B). This is possibly due to the high values already achieved on the basis of their favourable HMW-GS configuration, especially for Glu-B1 7 + 8 and Glu-D1 5 + 10 (Table 1).
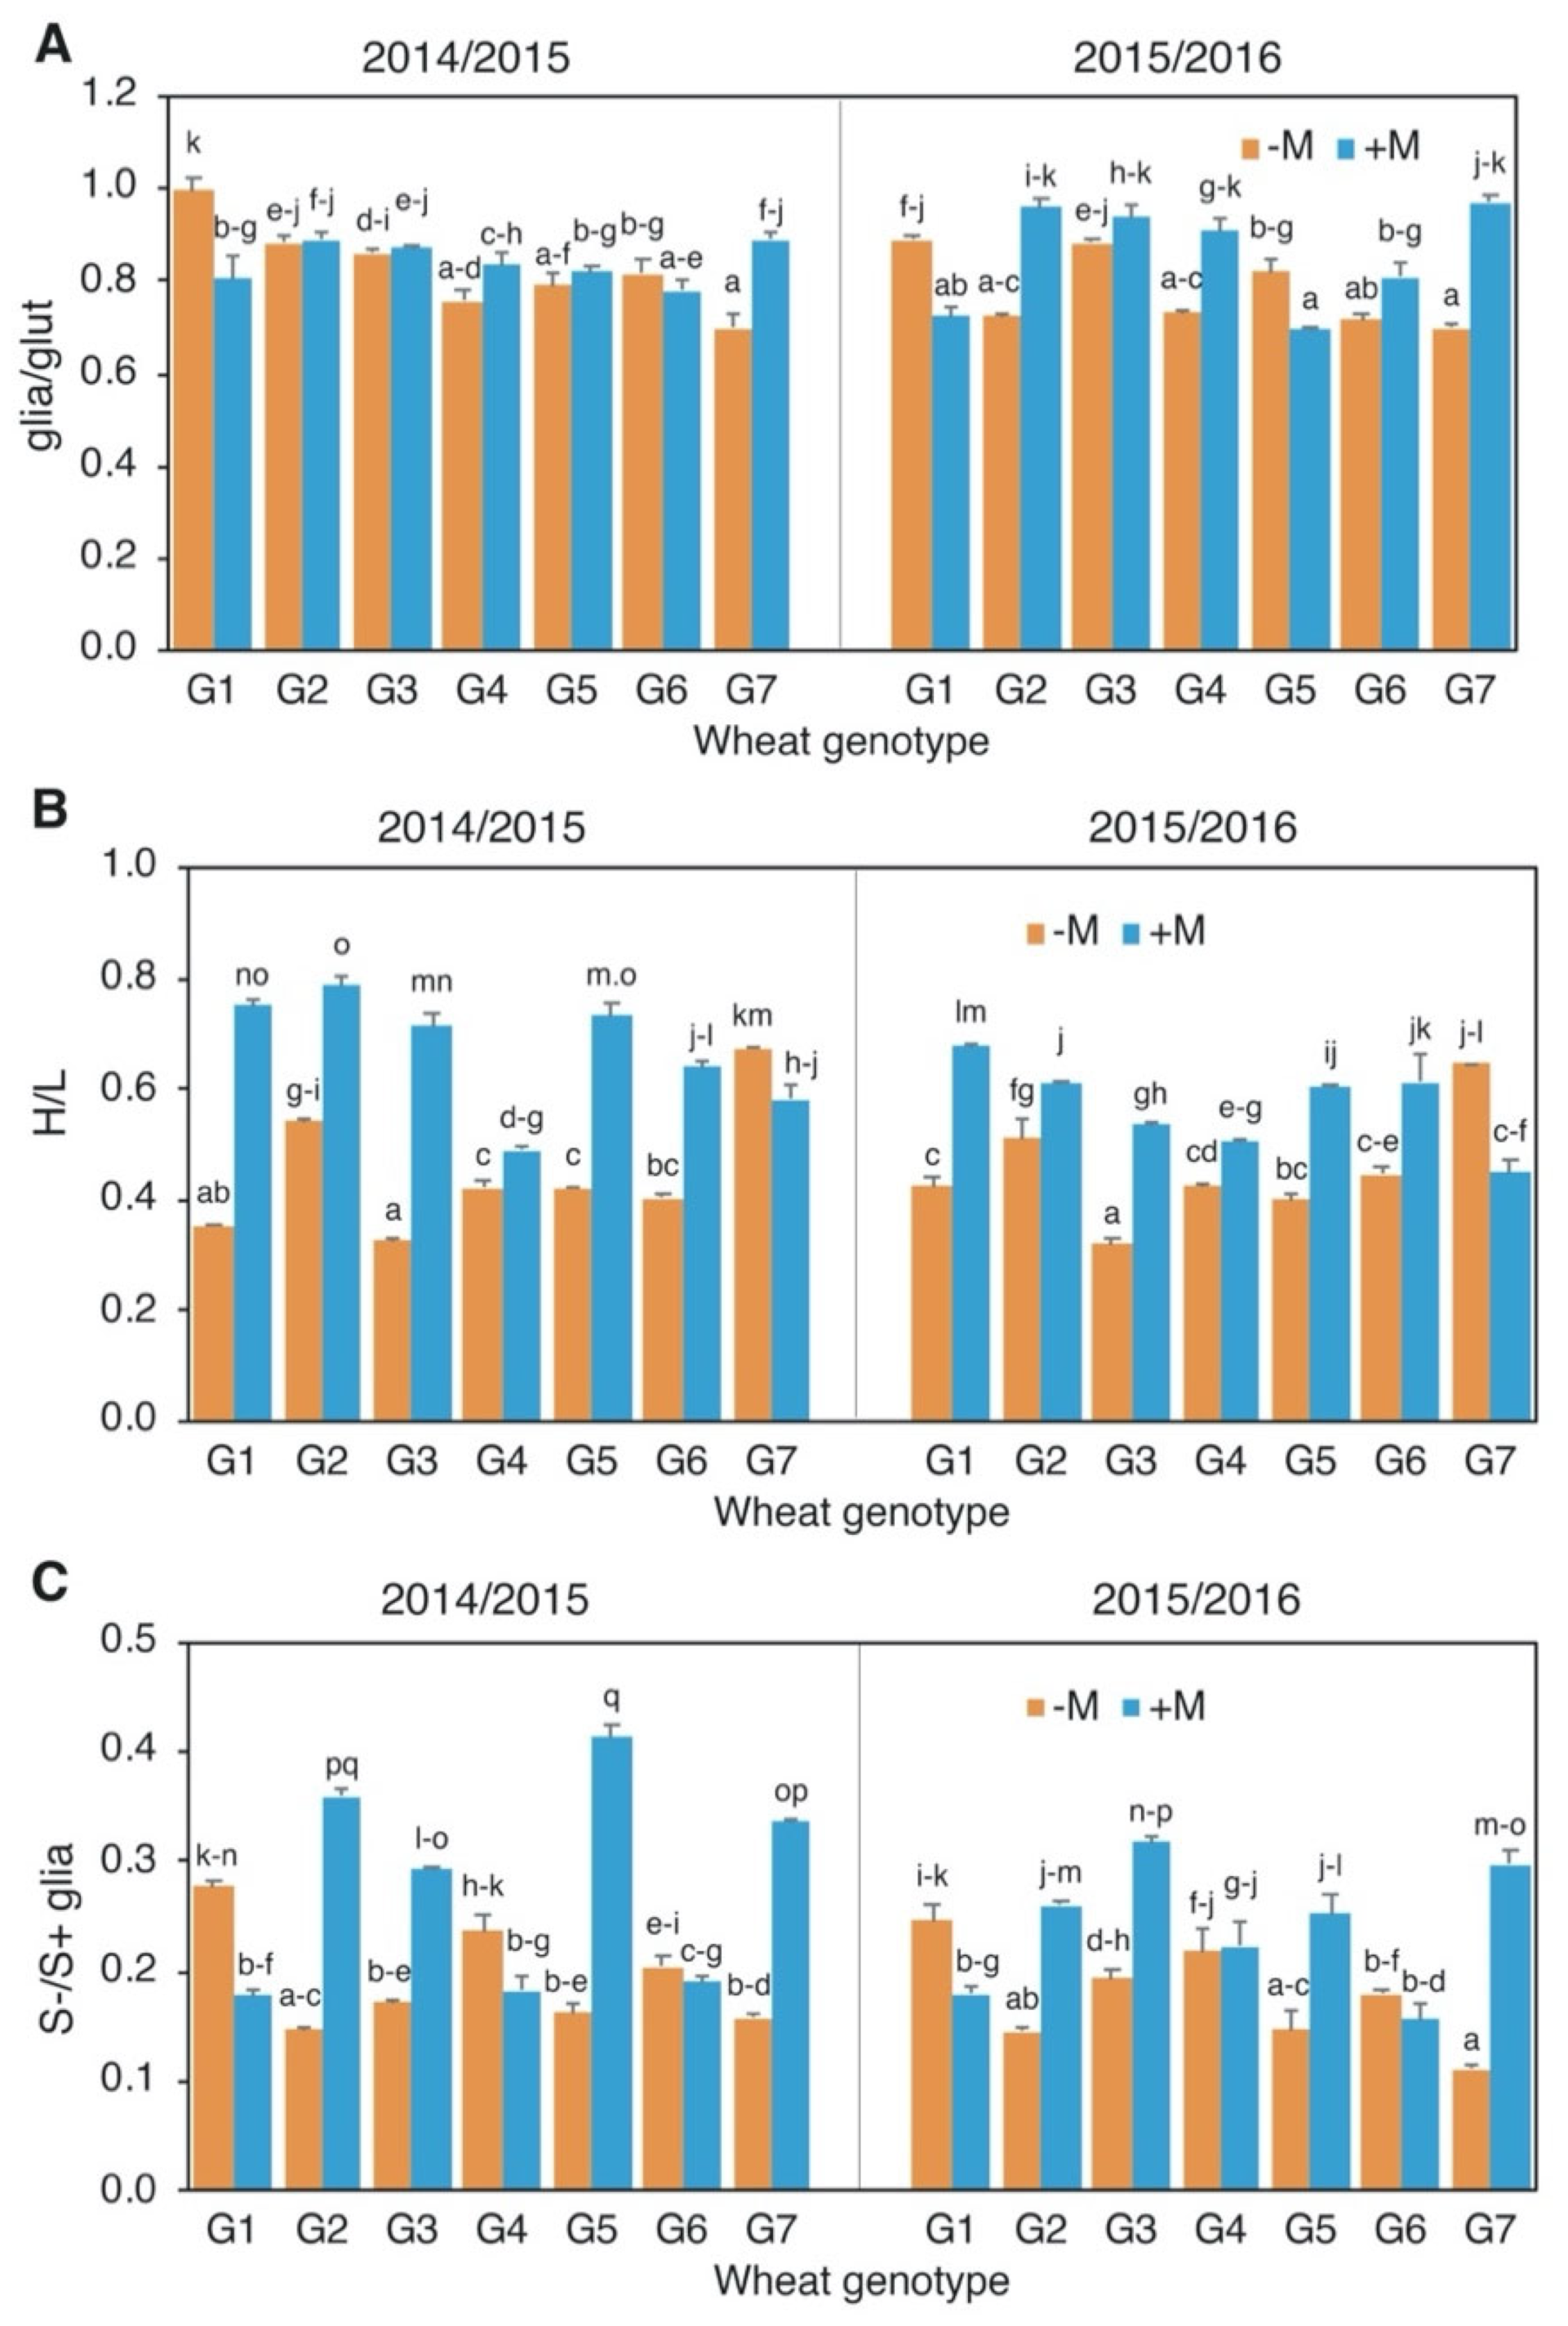
Changes in protein composition were observed in terms of glia/glut, H/L, and S-poor/S-rich gliadin ratio (S−/S+ glia) (Figure 5). A genetic variability was observed with a higher mean gliadin content (glia/glut) within the old genotypes, especially in Frassineto (G3), which also showed the lowest HMW-GS/LMW-GS ratio (H/L) and a high S−/S+ glia ratio corresponding to a high ω-gliadin content. Risciola (G2) and Bologna (G7) had the highest H/L ratio, showing the highest GI within the group of old and modern genotype, respectively (Figure 5B). As for the effect of the year of cultivation, no marked variations were observed except for the proportion of the ω-gliadin on the S-rich gliadins (S−/S+ glia) that resulted as higher in 2014/2015 (Figure 5C). Moreover, the interaction G × AMF × Y resulted as significant for all the protein composition parameters. Concerning glia/glu, the AMF seed coating resulted in a significant decrease (−19%) in Gentil Rosso (G1) and in a significant increase (+33%) in Bologna (G7) in both years (Figure 5A). All genotypes except modern Bologna (G7) showed a higher H/L ratio in both crop years (Figure 5B) ranging from +19% in Autonomia B (G4) in 2015/2016 to 118% in Frassineto (G3) in 2014/2015. With regard to the S−/S+ glia ratio, a general mean increase with AMF treatment was observed in both years except for Gentil Rosso (G1) showing a significant decrease (Figure 5C). The correlation analysis showed a slight significant association between GI and H/L (Table 3). Protein content showed no significant correlation with gluten composition traits. Finally, generally higher S−/S+ glia ratios were observed in the old and modern groups of genotypes with the AMF treatment (Table 4).

3.4. Grain Mineral Composition

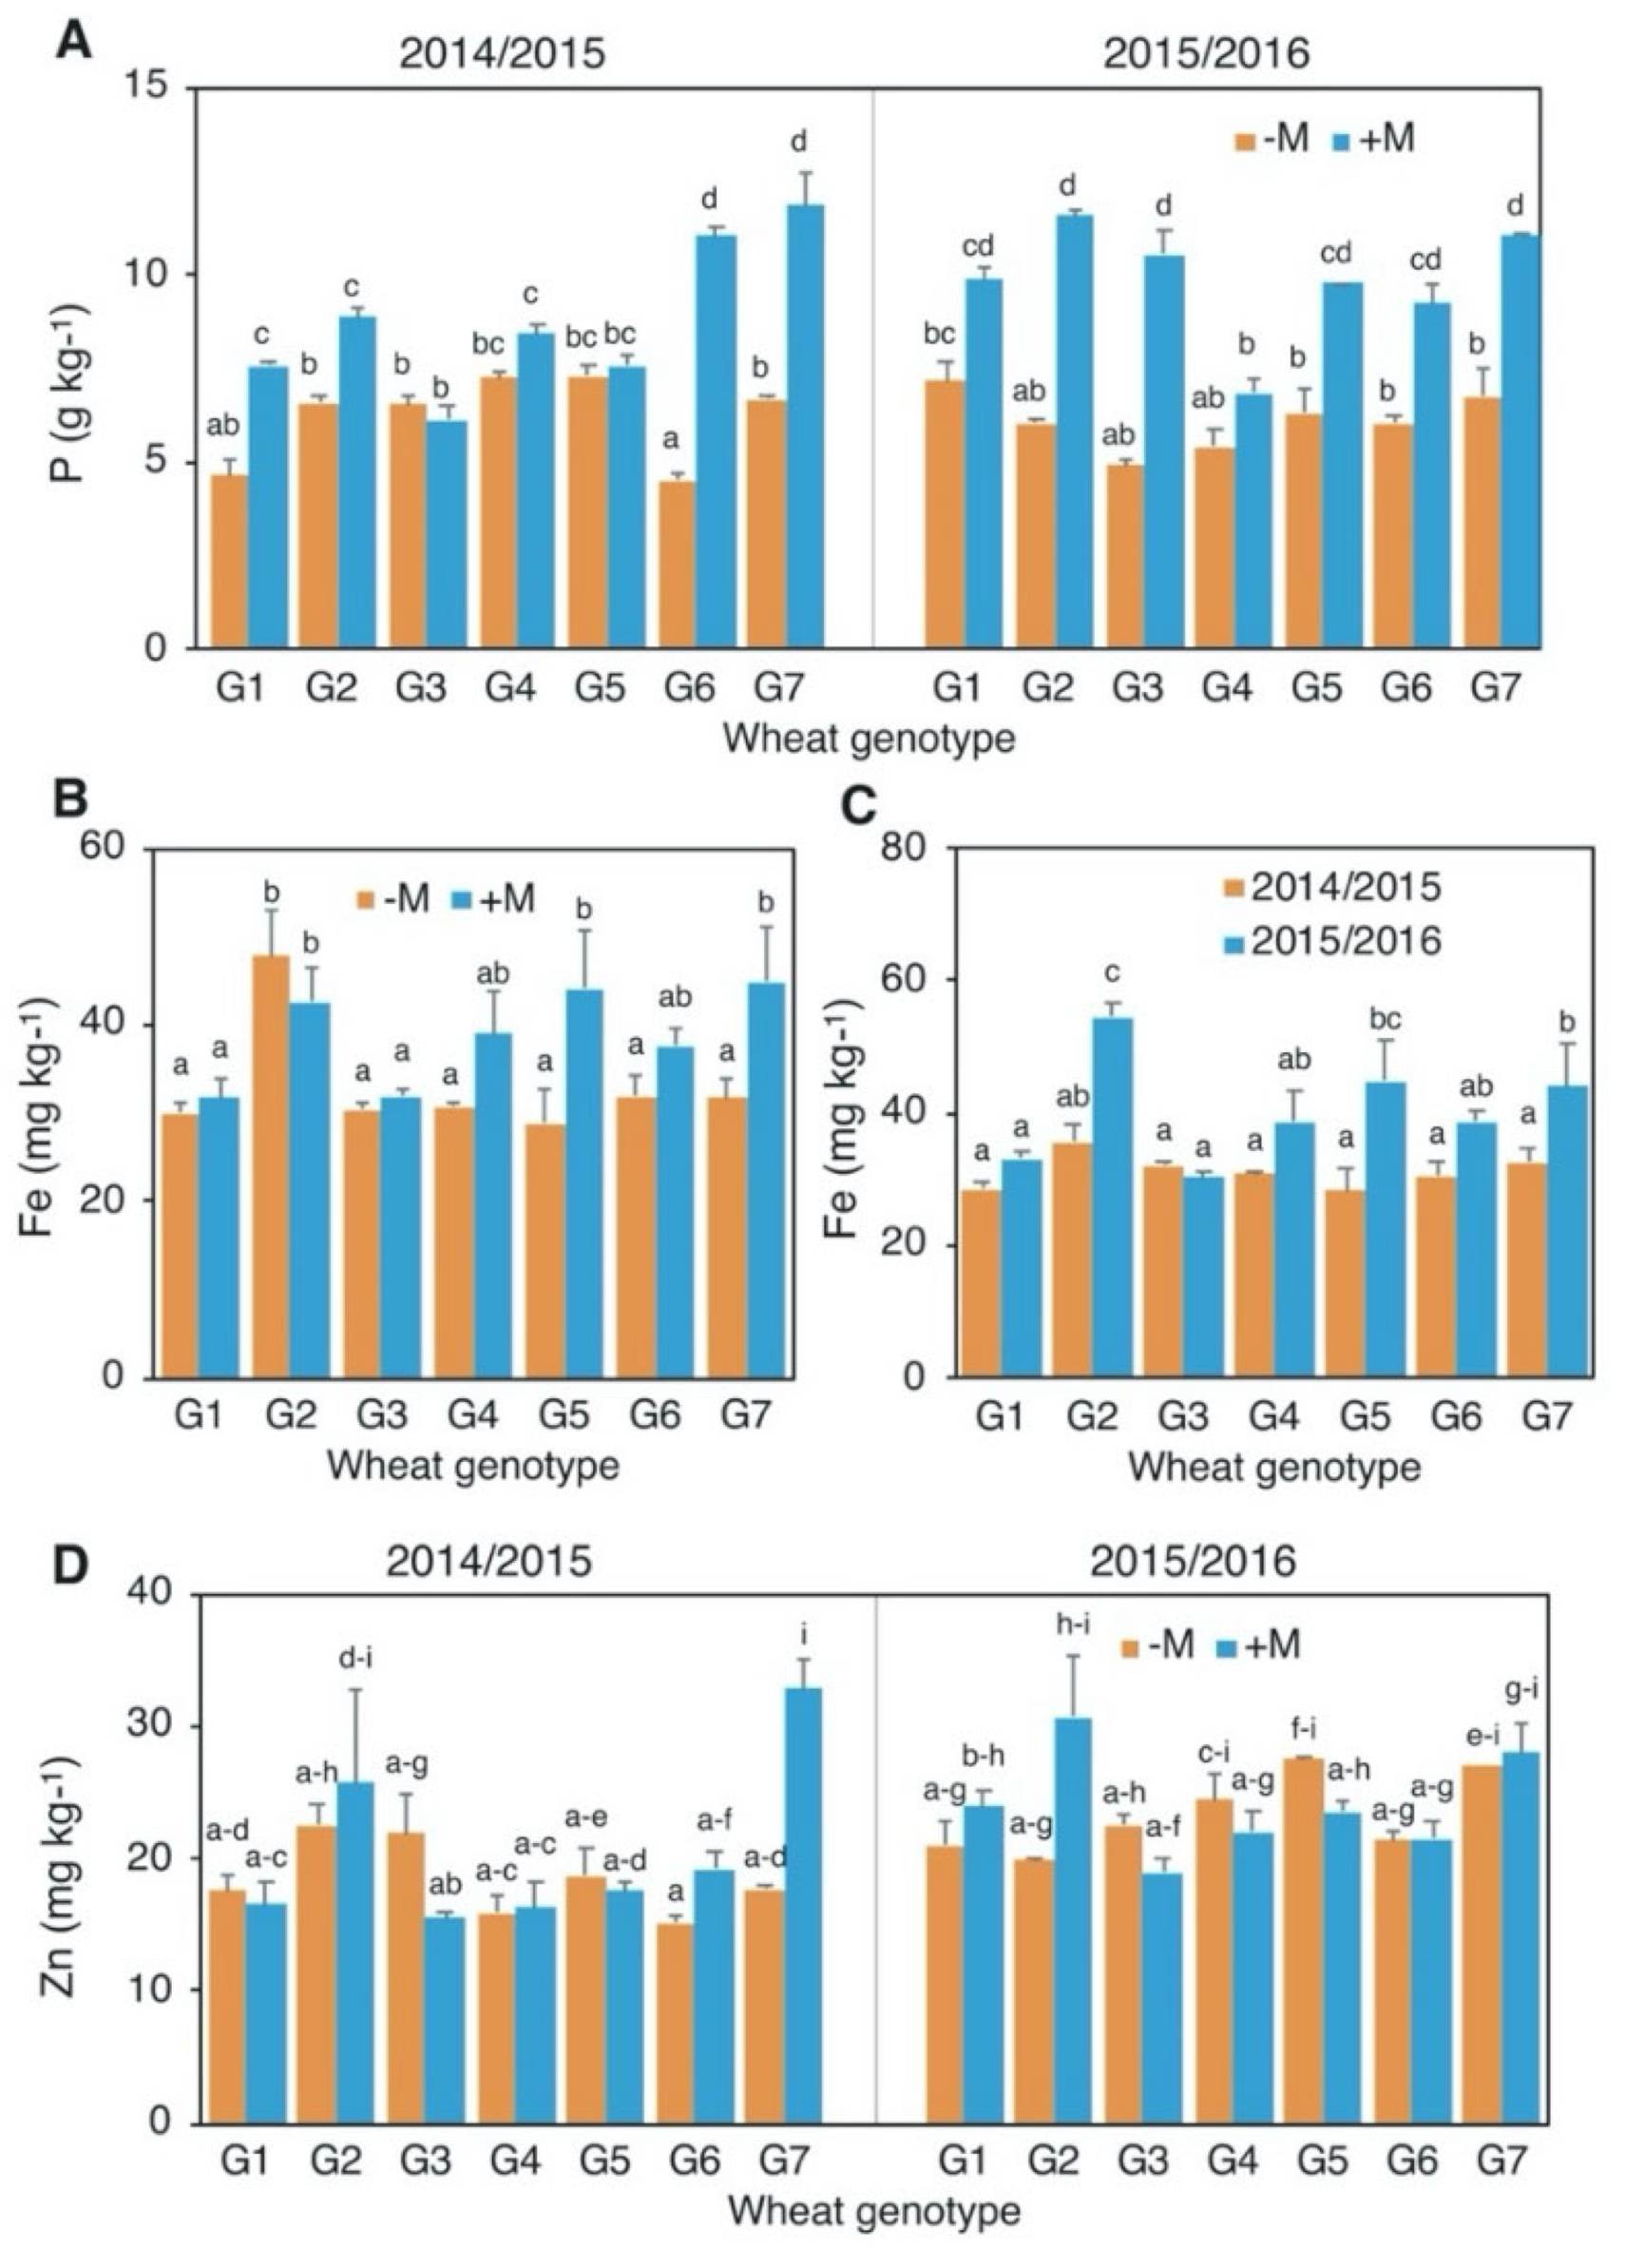
The effect of the interaction G × AMF × Y on grain P concentration was significant (Table 2) and resulted in general higher values with an AM fungal seed coating ranging from 36% in Risciola (G2) 2014/2015 to 145% in Blasco (G6) 2014/2015, with the exception of Autonomia B (G4), which did not show a significant difference in both years (Figure 6A). In terms of groups of genotypes, both the old and the modern ones showed an increase with AMF treatment (+40% and +79%, respectively) as reported in Table 4.
Iron (Fe) concentration in grain ranged from 21.7 to 59.2 mg kg−1 and was affected by the interactions G × AMF and G × Y (Table 2). AM fungal treatment significantly increased Fe concentration only in Verna (G5, +53%) and Bologna (G7, +42%) (Figure 6B). Higher Fe concentration was observed in 2015/2016 with respect to 2014/2015 in Risciola (G2), Verna (G5), and Bologna (G7) (Figure 6C). Zinc (Zn) concentration in grain was affected by the interaction G × AMF × Y as genotypes differently responded to AMF inoculation in the two years (Figure 6D). A significant and positive effect (86%) of AMF treatment was recorded for Bologna (G7) in 2014/2015 (17.8 vs. 33.0 mgkg−1 for −M and +M, respectively, P < 5%) and for Risciola (G2) (+53%) in 2015/2016 (20.0 vs. 30.7 mgkg−1 for −M and +M, respectively, P < 5%).
Phytate concentration (phy) in grain was affected by the interactions G × AMF and G × Y (Table 2). Phytate concentration was significantly decreased by AMF only in Verna (G5) (Figure 7A). Moreover, phytate concentration was lower in 2015/2016 for the genotypes Gentil Rosso (G1), Risciola (G2), Verna (G5), Blasco (G6), and Bologna (G7), whereas in Frassineto (G3) and Autonomia B (G4) the variations were statistically not significant. Phytate content is considered one of the main drivers of mineral availability in the human diet; for this reason, the ratio between phytate and Fe and Zn was calculated (phy/Fe and phy/Zn, respectively). Iron and Zn bioavailability resulted in being markedly influenced by genetic and environmental factors (Table 2). In particular, Bologna (G7) showed the lowest phy/Fe and phy/Zn and, consequently, the higher bioavailability (Table S1). These ratios were mainly influenced by changes in phytate content, resulting in a large variability between the two years of cultivation, almost two-times higher in 2014/2015 with respect to 2015/2016 (Figure 7B).

3.5. Relationships among AM Fungal Colonization, Yield and Yield Components, Proteins and Minerals in Grains

Arbuscular mycorrhizal fungal colonization at the end of tillering (GS26) was positively and significantly related to gluten index (GI) and phytate concentration in grain (phy), whereas it was negatively related to Fe and Zn concentration in grain (Table 3; Table S2; Figure S1). Moreover, interestingly, AM fungal colonization at booting growth stage (GS45) was positively and significantly related to grain yield, the ratio between gliadin and gluten (glia/glu) and the ratio between high molecular weight glutenin subunits and B-type low molecular weight glutenin subunits (H/L), and the concentration of P (P) and phy in grain (Table S2). As expected, grain yield was positively and significantly related to spike density (spikes), number of kernels per spike (K/S), and kernel weight (KW), whereas K/S was negatively and significantly related to KW. Finally, nutrient concentration in grain, such as P, was significantly and positively related to Fe and Zn concentrations in grain, while, as expected, Fe and Zn were positively related to each other, and negatively related to phy.
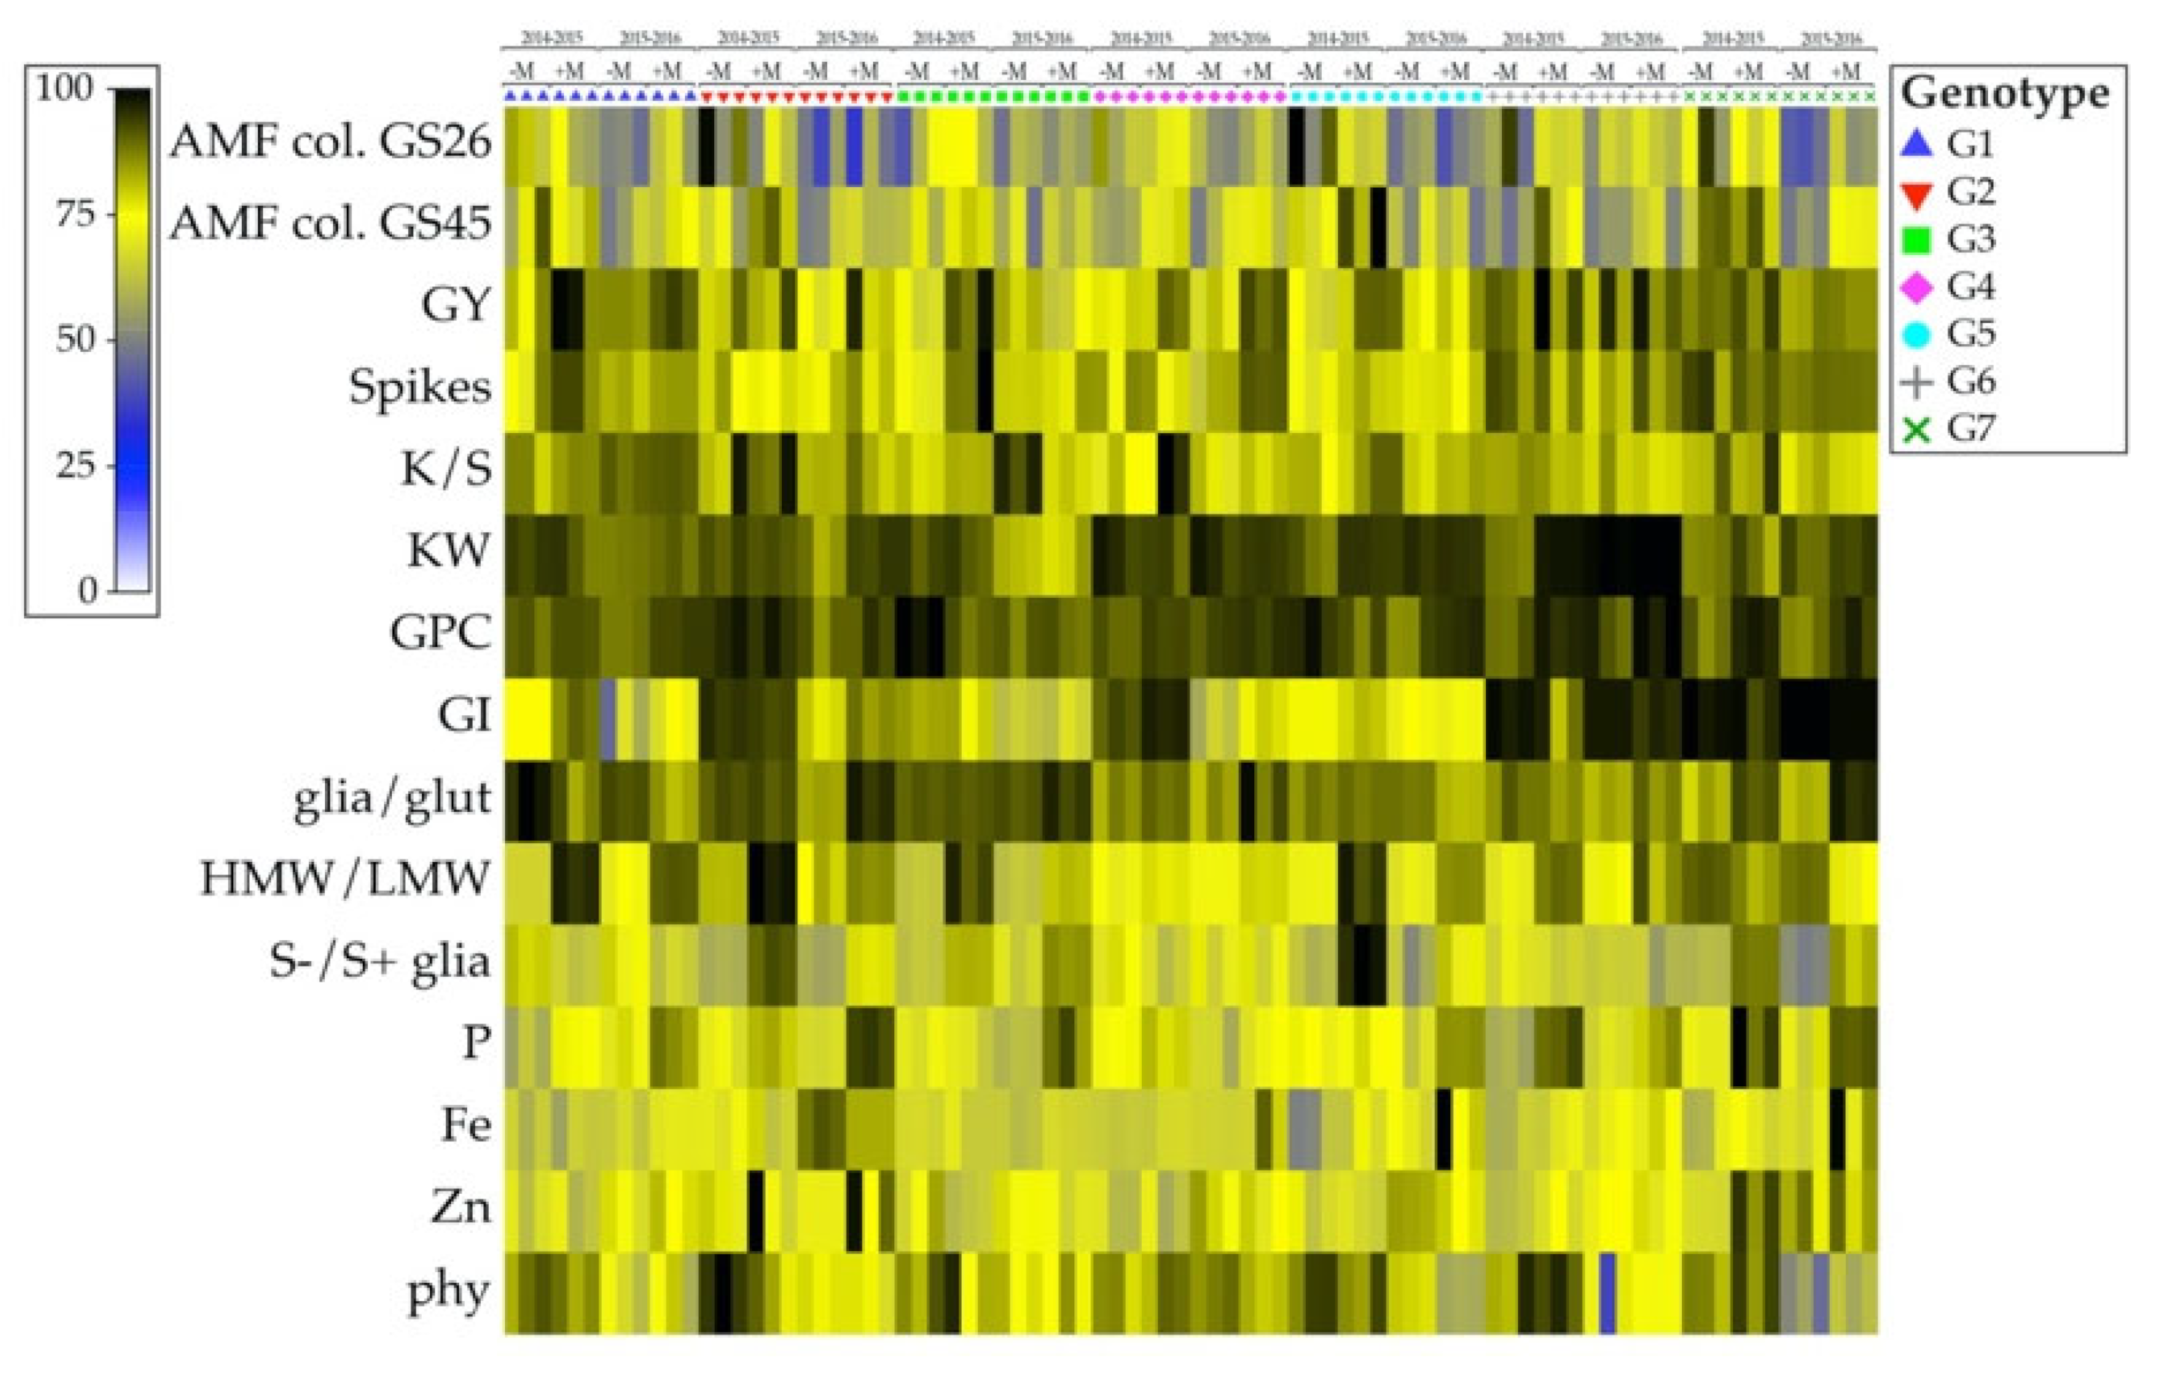
Finally, the shade plot image (Figure 8) represents a powerful tool for interpretating the sample patterns in terms of individual parameters driving those patterns. Indeed, after the transformation and standardization of data, which give a similar relative power to all parameters, we can visualize which are the more variable parameters among plots of the same treatments (e.g., AMF col. GS26 and phy) and the parameters which contribute the most to the differences among treatments (those highly variable among treatments: e.g., GI, glia/glu, H/L, S−/S+ glia, and P).

4. Discussion

The use of biofertilizers is considered a sustainable agronomic tool in order to improve plant resource use efficiency and promote the development of the soil microbial community with favourable consequences to crops [11]. Wheat represents the staple basis for agriculture and food nutrition and any improvement in terms of sustainability and quality may have a relevant impact on consumers. Most of the studies are generally conducted under controlled conditions and with limited information on the interaction with wheat genetic variability. The use of AMF has been previously investigated on wheat, with a demonstrated impact on morphological and yield traits. Under our experimental conditions, an increase in grain yield due to AMF seed coating was observed only in the old genotypes, with a mean general increase of +24%, which is consistent with the worldwide global observations on wheat of +20% percentage change between inoculated and non-inoculated plants [12]. The increase of grain yield, mostly explained by variations in spike number, was probably due to a better development in the early stages that led to an advantage in terms of final crop production, and also due to an improvement in nutrient uptake, especially P [11]. Previous studies investigating the differential response of wheat genotypes to the symbiosis showed that some genotypes have consistently low levels of AM fungal root colonization, whereas others have high levels [30,31,32]. Moreover, they reported a significant interaction of genotype and AM fungal inoculation on grain yield and grain and straw P concentration at medium soil fertility [32], and on nutrient concentration in shoots [31]. Moreover, the mycorrhizal dependency of the wheat genotype with relatively high P efficiency was demonstrated to be lower than that of the genotypes with lower P efficiencies [33], and that the output of the interaction is linked to intra-specific variations in root traits at genotype level [34]. This is also supported by the recent work of Stefani et al. [35] that highlighted differences among old and new cultivars of wheat in the recruitment of AM fungal communities from indigenous AM fungal populations under field conditions. The effectiveness of AM fungal field inoculation is complex and depends on several factors, including root AM fungal root colonization [36] and modification in root AM fungal community structure [16,37]. Moreover, wheat genotypes that are different in terms of root architecture can variably interact with AMF developing in roots [16]. However, on durum wheat, no influence of breeding activity was observed in relation to AM fungal symbiosis, as shown by the effect of lower plant size with the introgression of the Reduced height (Rht) genes [14]. A comparable interaction with AM fungal treatment in old and modern wheat genotypes was also previously observed [16], with an increase in spike fertility and kernels per spike. Overall, our results on AM fungal root colonization demonstrated that this trait did not decrease with the advancement of the growth cycle. In detail, in 2014/2015 and 2015/2016 at GS26 in absence of AM fungal inoculation (−M), root colonization percentage was 15.0% and 7.5%, respectively, while at GS45 it ranged from 8.9% to 20.9% and from 8.1% to 11.7%, respectively. Moreover, in inoculated conditions (+M), root colonization percentage at GS26 was 12.3% and 8.8%, respectively, while at GS45 it ranged from 16.5% to 26.1% and from 10.5% to 16.0%, respectively. However, a previous study on durum wheat [28] showed that in field conditions, AM fungal root colonization percentage is higher at early crop stages and declines with the advancement of the wheat crop cycle, when root dry weight and length is increasing. Thus, our data suggest that in the roots of the studied genotypes AMF are still growing and that the growth of the wheat root system did not determine a dilution of the AM fungal root colonization [38,39]. At booting growth stage (GS45), the increased root colonization after inoculation with R. irregularis MUCL43194 of three genotypes (Risciola, Verna, and Blasco) during the first year of cultivation and the lack of effects in the other cases demonstrated the differential compatibility of wheat genotypes with the inoculated AM fungus in field conditions and a variable competitive ability of the inoculated isolate over the native AMF. However, since in field conditions the natural AM fungal community is present, we cannot discriminate with morphological tools between the inoculated strain and native AMF. Earlier work, studying AM fungal diversity in wheat roots by molecular tools, had shown a differential AM fungal pattern in three genotypes (two old and one modern), supporting the strong effect of host plant identify on root AMF communities [16] and the large genetic variability in AM fungal compatibility and dependency found in durum wheat [32,40]. In addition, other works have underlined the importance of AM fungal community composition within roots rather than the AM fungal colonization in affecting crop yield and quality [41].
It is known that HMW-GS are the main factors responsible for gluten quality of bread wheat, while for pasta-making from durum wheat, a great contribution is also due to B-type LMW-GS [6]. Indeed, the HMW-GS associated to high technological performance are typically B × 7 and D × 5, characterized by major cysteine residues than other variants [42]. The breeding activity from the 20th century was selected for higher quality genotypes, with increasing frequencies of the 5 + 10 Glu-D1 and 7 + 8 Glu-B1 pairs for hard wheat [43], whereas the 2 + 12 Glu-D1 pair is generally preferred for the soft wheat supply chain [27,44]. Further, not only glutenin configuration, but also expression, has been observed as correlated with GI in old and modern wheats [3,6]. The lower dough strength observed in the old lines and landraces with respect to the modern cultivars is comparable to previous investigations [1,2,43,45].
Our results suggest a strict and positive relation between AM fungal colonization at booting growth stage (GS45) and grain yield, glia/glu, HMW-GS to LMW-GS, phosphorous, and phytate in grain. Little information is available on the effects of AM fungal inoculation on wheat grain quality. In a study conducted on the modern bread wheat genotype Bologna [46], the authors reported no significant changes in storage protein composition on samples treated with different biofertilizers. In accordance with our results, the authors reported a trend of reduction of the glutenins/gliadins for the AM fungal inoculation with Rhizophagus irregularis with respect to the untreated control. Unfortunately, the consortium with other different microorganisms in those commercial products makes difficult the explanation of the contribution of the applied AMF. Concerning grain quality, our results showed a significant effect of AM fungal inoculation on protein content in modern genotypes and on protein composition in the old ones. This resulted in a higher proportion of the S-poor storage protein sub-fractions, both in the polymeric glutenins (HMW-GS, D-type LMW-GS) and in the monomeric gliadins (ω-gliadins). This result was highly evident in the old genotypes (+54%) that benefited from the higher HMW-GS accumulation in terms of technological gluten characteristics. The novelty that emerged in the current study consists of the higher HMW-GS observed in the old genotypes, typically characterized by soft gluten. Consistently, a decrease in the ratio of S-poor to S-rich gliadins (ω-gliadin) and glutenins (HMW-GS) was observed in accordance with a decrease in sulphur (S) uptake reported in the literature with AM fungal inoculation [47]. This could interfere with protein biosynthesis, influencing the proportion of the different gluten fractions [27,48]. On the other hand, AM fungal field inoculation was also associated with higher concentration of high-quality minerals, such as P and Fe, even if a significant interaction was observed with genotype. In previous studies, the usefulness of AMF as biofortifiers for the alleviation of nutrient deficiency in humans was evaluated across a range of crop species grown under varying conditions [49,50]. The results reported in the current study confirmed the different contributions of the mycorrhizal pathway on genotype Zn accumulation, especially in relation to Zn-inefficient genotypes [13,51]. Nutrient bioavailability is generally considered more important than micronutrient concentration itself [52]. In a previous study conducted on Gentil Rosso (old) and Blasco (modern), the old genotype showed a higher micronutrient (Fe and Zn) concentration and bioavailability than the modern one [53,54]. Instead, our results showed a high Fe and Zn availability in the modern genotype Bologna due to its low phytate content. The observed interactions of G × AMF confirm the necessity to evaluate the compatibility between plant genotype and AM fungal isolates in order to improve nutrient use efficiency and nutritional quality through the application of biofertilizers [12].

5. Conclusions

The use of soil microorganisms, such as AMF, is proposed as an agronomic tool for improving the resource-use efficiency of crops. This is particularly important in low-input conditions, such as cereal organic farming adopting old genetic resources, well appreciated by the customers. In this study, the application of AMF at sowing by seed coating was investigated in relation to the agronomic performance and, in particular, to grain quality. Indeed, the effectiveness of improving grain yield was particularly relevant in the old wheat genotypes with respect to modern ones. Concerning the AMF seed coating effect on grain quality, while modern genotypes showed an increase in protein content, in old genotypes an improvement of gluten quality was observed in relation to the increase of HMW-to-LMW glutenin subunits and of the S-poor storage protein sub-fractions. With regard to mineral uptake, AM fungal inoculation determined a general increase of phosphorous content in all the investigated genotypes. Furthermore, AMF treatment significantly increased Fe and Zn concentration in the modern genotype Bologna, which also showed the lowest phytate content and, consequently, the higher bioavailability of these micronutrients.
The outcome of this study confirmed the effectiveness of the use of AMF as biofertilizer not only to improve crop yield and nutrient uptakes, but also to improve gluten quality. This resulted as particularly relevant for the old genotypes, often cultivated under organic farming. Further studies will be necessary under different environmental conditions for deep insight into the effects of AMF inoculation on both wheat nutrient use efficiency and grain nutritional and technological quality.

Supplementary Materials

The following supporting information can be downloaded at: https://www.mdpi.com/article/10.3390/agronomy12102418/s1, Supporting information on the dataset (Table S1), significance of the correlation analysis (Table S2) and relative scatterplot (Figure S1) are reported in Supplementary Materials.

Author Contributions

Conceptualization, E.P., L.E. and Z.F.; methodology, M.A.D.S. and E.P.; formal analysis, M.A.D.S., E.P. and L.E; investigation, M.A.D.S., E.P. and L.E.; resources, M.M.G., Z.F. and L.E.; data curation, M.A.D.S., E.P. and L.E.; writing—original draft preparation, M.A.D.S.; writing—review and editing, M.M.G., E.P., Z.F. and L.E; supervision, Z.F. and L.E.; project administration, L.E.; funding acquisition, L.E. and Z.F. All authors have read and agreed to the published version of the manuscript.

Funding

Michele Andrea De Santis is the beneficiary of a Grant by MIUR in the framework of “AIM: Attraction and International Mobility” (PON R&I2014–2020) (D74I18000180001). This project was supported by the European Agricultural Fund for Rural Development 2007–2013 for Tuscany (Italy), measure 16.2 (GRANT project), project leader L.E.

Data Availability Statement

Data are contained within the article and supplementary materials and are available on request.

Conflicts of Interest

The authors declare no conflict of interest.

Abbreviations

AMF = arbuscular mycorrhizal fungi; ANOVA = analysis of variance; G = genotype; GI = gluten index; glia = gliadin; glut = glutenin; GPC = grain protein content; GY = grain yield; ha = hectare; H/L = ratio between high molecular weight glutenin subunits and B-type low molecular weight glutenin subunits; HMW-GS = high molecular weight glutenin subunits; HSD = honestly significant difference in Tukey’s post hoc test; K/S = number of kernels per spike; KW = kernel weight; LMW-GS = low molecular weight glutenin subunits; phy = phytate; S−/S+ glia = ratio between S-poor ω-gliadin and S-rich α-gliadin and γ-gliadin subunits; Y = year; YR = year of release.

References

  1. Guarda, G.; Padovan, S.; Delogu, G. Grain Yield, Nitrogen-Use Efficiency and Baking Quality of Old and Modern Italian Bread-Wheat Cultivars Grown at Different Nitrogen Levels. Eur. J. Agron. 2004, 21, 181–192. [Google Scholar] [CrossRef]
  2. Migliorini, P.; Spagnolo, S.; Torri, L.; Arnoulet, M.; Lazzerini, G.; Ceccarelli, S. Agronomic and Quality Characteristics of Old, Modern and Mixture Wheat Varieties and Landraces for Organic Bread Chain in Diverse Environments of Northern Italy. Eur. J. Agron. 2016, 79, 131–141. [Google Scholar] [CrossRef]
  3. De Santis, M.A.; Giuliani, M.M.; Giuzio, L.; De Vita, P.; Lovegrove, A.; Shewry, P.R.; Flagella, Z. Differences in Gluten Protein Composition between Old and Modern Durum Wheat Genotypes in Relation to 20th Century Breeding in Italy. Eur. J. Agron. 2017, 87, 19–29. [Google Scholar] [CrossRef] [PubMed]
  4. Shewry, P. What Is Gluten—Why Is It Special? Front. Nutr. 2019, 6, 101. [Google Scholar] [CrossRef] [PubMed]
  5. Sanchez-Garcia, M.; Álvaro, F.; Peremarti, A.; Martín-Sánchez, J.A.; Royo, C. Changes in Bread-Making Quality Attributes of Bread Wheat Varieties Cultivated in Spain during the 20th Century. Eur. J. Agron. 2015, 63, 79–88. [Google Scholar] [CrossRef] [Green Version]
  6. De Santis, M.A.; Cunsolo, V.; Giuliani, M.M.; Di Francesco, A.; Saletti, R.; Foti, S.; Flagella, Z. Gluten Proteome Comparison among Durum Wheat Genotypes with Different Release Date. J. Cereal Sci. 2020, 96, 103092. [Google Scholar] [CrossRef]
  7. Malalgoda, M.; Ohm, J.-B.; Meinhardt, S.; Simsek, S. Association between Gluten Protein Composition and Breadmaking Quality Characteristics in Historical and Modern Spring Wheat. Cereal Chem. 2018, 95, 226–238. [Google Scholar] [CrossRef]
  8. Johansson, E.; Branlard, G.; Cuniberti, M.; Flagella, Z.; Hüsken, A.; Nurit, E.; Peña, R.J.; Sissons, M.; Vazquez, D. Genotypic and Environmental Effects on Wheat Technological and Nutritional Quality. In Wheat Quality for Improving Processing and Human Health; Springer: Cham, Switzerland, 2020; pp. 171–204. ISBN 978-3-030-34163-3. [Google Scholar] [CrossRef]
  9. De Santis, M.A.; Soccio, M.; Laus, M.N.; Flagella, Z. Influence of Drought and Salt Stress on Durum Wheat Grain Quality and Composition: A Review. Plants 2021, 10, 2599. [Google Scholar] [CrossRef]
  10. Schüβler, A.; Schwarzott, D.; Walker, C. A New Fungal Phylum, the Glomeromycota: Phylogeny and Evolution. Mycol. Res. 2001, 105, 1413–1421. [Google Scholar] [CrossRef]
  11. Igiehon, N.O.; Babalola, O.O. Biofertilizers and Sustainable Agriculture: Exploring Arbuscular Mycorrhizal Fungi. Appl. Microbiol. Biotechnol. 2017, 101, 4871–4881. [Google Scholar] [CrossRef]
  12. Pellegrino, E.; Öpik, M.; Bonari, E.; Ercoli, L. Responses of Wheat to Arbuscular Mycorrhizal Fungi: A Meta-Analysis of Field Studies from 1975 to 2013. Soil Biol. Biochem. 2015, 84, 210–217. [Google Scholar] [CrossRef]
  13. Coccina, A.; Cavagnaro, T.R.; Pellegrino, E.; Ercoli, L.; McLaughlin, M.J.; Watts-Williams, S.J. The Mycorrhizal Pathway of Zinc Uptake Contributes to Zinc Accumulation in Barley and Wheat Grain. BMC Plant Biol. 2019, 19, 133. [Google Scholar] [CrossRef] [PubMed] [Green Version]
  14. De Vita, P.; Avio, L.; Sbrana, C.; Laidò, G.; Marone, D.; Mastrangelo, A.M.; Cattivelli, L.; Giovannetti, M. Genetic Markers Associated to Arbuscular Mycorrhizal Colonization in Durum Wheat. Sci. Rep. 2018, 8, 10612. [Google Scholar] [CrossRef] [PubMed] [Green Version]
  15. Royo, C.; Soriano, J.M.; Rufo, R.; Guzmán, C. Are the Agronomic Performance and Grain Quality Characteristics of Bread Wheat Mediterranean Landraces Related to the Climate Prevalent in Their Area of Origin? J. Cereal Sci. 2022, 105, 103478. [Google Scholar] [CrossRef]
  16. Pellegrino, E.; Piazza, G.; Arduini, I.; Ercoli, L. Field Inoculation of Bread Wheat with Rhizophagus irregularis under Organic Farming: Variability in Growth Response and Nutritional Uptake of Eleven Old Genotypes and A Modern Variety. Agronomy 2020, 10, 333. [Google Scholar] [CrossRef] [Green Version]
  17. Voets, L.; Dupré de Boulois, H.; Renard, L.; Strullu, D.-G.; Declerck, S. Development of an Autotrophic Culture System for the in Vitro Mycorrhization of Potato Plantlets. FEMS Microbiol. Lett. 2005, 248, 111–118. [Google Scholar] [CrossRef]
  18. Vosátka, M.; Látr, A.; Gianinazzi, S.; Albrechtová, J. Development of Arbuscular Mycorrhizal Biotechnology and Industry: Current Achievements and Bottlenecks. Symbiosis 2012, 58, 29–37. [Google Scholar] [CrossRef]
  19. De La Providencia, I.E.; De Souza, F.A.; Fernández, F.; Delmas, N.S.; Declerck, S. Arbuscular Mycorrhizal Fungi Reveal Distinct Patterns of Anastomosis Formation and Hyphal Healing Mechanisms between Different Phylogenic Groups. New Phytol. 2005, 165, 261–271. [Google Scholar] [CrossRef]
  20. Avio, L.; Pellegrino, E.; Bonari, E.; Giovannetti, M. Functional Diversity of Arbuscular Mycorrhizal Fungal Isolates in Relation to Extraradical Mycelial Networks. New Phytol. 2006, 172, 347–357. [Google Scholar] [CrossRef]
  21. Kokkoris, V.; Li, Y.; Hamel, C.; Hanson, K.; Hart, M. Site Specificity in Establishment of a Commercial Arbuscular Mycorrhizal Fungal Inoculant. Sci. Total Environ. 2019, 660, 1135–1143. [Google Scholar] [CrossRef]
  22. U. S. Department of Agriculture; Natural Resources Conservation Service; Soil Survey Staff. Keys to Soil Taxonomy, 11th ed.Books Express Publishing: Berkshire, UK, 2010; 346p. [Google Scholar]
  23. Lindsay, W.L.; Norvell, W.A. Development of a DTPA Soil Test for Zinc, Iron, Manganese, and Copper. Soil Sci. Soc. Am. J. 1978, 42, 421–428. [Google Scholar] [CrossRef]
  24. Zadocks, J.C.; Chang, T.T.; Konzak, C.F. A Decimal Code for the Growth Stages of Cereals. Weed Res. 1974, 14, 415–421. [Google Scholar] [CrossRef]
  25. Phillips, J.M.; Hayman, D.S. Improved Procedures for Clearing Roots and Staining Parasitic and Vesicular-Arbuscular Mycorrhizal Fungi for Rapid Assessment of Infection. Trans. Br. Mycol. Soc. 1970, 55, 158-IN18. [Google Scholar] [CrossRef]
  26. Giovannetti, M.; Mosse, B. An Evaluation of Techniques for Measuring Vesicular Arbuscular Mycorrhizal Infection in Roots. New Phytol. 1980, 84, 489–500. [Google Scholar] [CrossRef]
  27. De Santis, M.A.; Giuliani, M.M.; Flagella, Z.; Reyneri, A.; Blandino, M. Impact of Nitrogen Fertilisation Strategies on the Protein Content, Gluten Composition and Rheological Properties of Wheat for Biscuit Production. Field Crops Res. 2020, 254, 107829. [Google Scholar] [CrossRef]
  28. Hussain, S.; Maqsood, M.A.; Miller, L.V. Bioavailable Zinc in Grains of Bread Wheat Varieties of Pakistan. Cereal Res. Commun. 2012, 40, 62–73. [Google Scholar] [CrossRef]
  29. Isaac, R.A.; Johnson, W.C., Jr. Elemental Determination by Inductively Coupled Plasma Atomic Emission Spectrometry. In Handbook of Reference Methods for Plant Analysis; CRC Press: Boca Raton, FL, USA, 2019; pp. 165–170. [Google Scholar]
  30. Al-Karaki, G.N.; Al-Raddad, A. Effects of Arbuscular Mycorrhizal Fungi and Drought Stress on Growth and Nutrient Uptake of Two Wheat Genotypes Differing in Drought Resistance. Mycorrhiza 1997, 7, 83–88. [Google Scholar] [CrossRef]
  31. Mardukhi, B.; Rejali, F.; Daei, G.; Ardakani, M.R.; Malakouti, M.J.; Miransari, M. Arbuscular Mycorrhizas Enhance Nutrient Uptake in Different Wheat Genotypes at High Salinity Levels under Field and Greenhouse Conditions. Comptes Rendus Biol. 2011, 334, 564–571. [Google Scholar] [CrossRef]
  32. Singh, A.K.; Hamel, C.; DePauw, R.M.; Knox, R.E. Genetic Variability in Arbuscular Mycorrhizal Fungi Compatibility Supports the Selection of Durum Wheat Genotypes for Enhancing Soil Ecological Services and Cropping Systems in Canada. Can. J. Microbiol. 2012, 58, 293–302. [Google Scholar] [CrossRef]
  33. Yao, Q.; Li, X.; Christie, P. Factors Affecting Arbuscular Mycorrhizal Dependency of Wheat Genotypes with Different Phosphorus Efficiencies. J. Plant Nutr. 2001, 24, 1409–1419. [Google Scholar] [CrossRef]
  34. de Souza Campos, P.M.; Borie, F.; Cornejo, P.; Meier, S.; López-Ráez, J.A.; López-Garcia, Á.; Seguel, A. Wheat Root Trait Plasticity, Nutrient Acquisition and Growth Responses Are Dependent on Specific Arbuscular Mycorrhizal Fungus and Plant Genotype Interactions. J. Plant Physiol. 2021, 256, 153297. [Google Scholar] [CrossRef] [PubMed]
  35. Stefani, F.; Dupont, S.; Laterrière, M.; Knox, R.; Ruan, Y.; Hamel, C.; Hijri, M. Similar Arbuscular Mycorrhizal Fungal Communities in 31 Durum Wheat Cultivars (Triticum turgidum L. var. durum) Under Field Conditions in Eastern Canada. Front. Plant Sci. 2020, 11, 1206. [Google Scholar] [CrossRef] [PubMed]
  36. Suri, V.K.; Choudhary, A.K.; Chander, G.; Verma, T.S. Influence of Vesicular Arbuscular Mycorrhizal Fungi and Applied Phosphorus on Root Colonization in Wheat and Plant Nutrient Dynamics in a Phosphorus-Deficient Acid Alfisol of Western Himalayas. Commun. Soil Sci. Plant Anal. 2011, 42, 1177–1186. [Google Scholar] [CrossRef]
  37. Renaut, S.; Daoud, R.; Masse, J.; Vialle, A.; Hijri, M. Inoculation with Rhizophagus irregularis Does Not Alter Arbuscular Mycorrhizal Fungal Community Structure within the Roots of Corn, Wheat, and Soybean Crops. Microorganisms 2020, 8, 83. [Google Scholar] [CrossRef] [PubMed] [Green Version]
  38. Ryan, M.; Ash, J. Colonisation of Wheat in Southern New South Wales by Vesicular-Arbuscular Mycorrhizal Fungi Is Significantly Reduced by Drought. Aust. J. Exp. Agric. 1996, 36, 563–569. [Google Scholar] [CrossRef]
  39. Mozafar, A.; Anken, T.; Ruh, R.; Frossard, E. Tillage Intensity, Mycorrhizal and Nonmycorrhizal Fungi, and Nutrient Concentrations in Maize, Wheat, and Canola. Agron. J. 2000, 92, 1117–1124. [Google Scholar] [CrossRef]
  40. Ercoli, L.; Schüßler, A.; Arduini, I.; Pellegrino, E. Strong Increase of Durum Wheat Iron and Zinc Content by Field-Inoculation with Arbuscular Mycorrhizal Fungi at Different Soil Nitrogen Availabilities. Plant Soil 2017, 419, 153–167. [Google Scholar] [CrossRef]
  41. Pellegrino, E.; Nuti, M.; Ercoli, L. Multiple Arbuscular Mycorrhizal Fungal Consortia Enhance Yield and Fatty Acids of Medicago Sativa: A Two-Year Field Study on Agronomic Traits and Tracing of Fungal Persistence. Front. Plant Sci. 2022, 13, 814401. [Google Scholar] [CrossRef]
  42. Lafiandra, D.; Shewry, P.R. Wheat Glutenin Polymers 2. The Role of Wheat Glutenin Subunits in Polymer Formation and Dough Quality. J. Cereal Sci. 2022, 106, 103487. [Google Scholar] [CrossRef]
  43. Ormoli, L.; Costa, C.; Negri, S.; Perenzin, M.; Vaccino, P. Diversity Trends in Bread Wheat in Italy during the 20th Century Assessed by Traditional and Multivariate Approaches. Sci. Rep. 2015, 5, 8574. [Google Scholar] [CrossRef] [Green Version]
  44. Igrejas, G.; Ikeda, T.M.; Guzmán, C. (Eds.) Wheat Quality for Improving Processing and Human Health; Springer: Cham, Switzerland, 2020; ISBN 978-3-030-34162-6. [Google Scholar] [CrossRef]
  45. Ghiselli, L.; Rossi, E.; Whittaker, A.; Dinelli, G.; Baglio, A.P.; Andrenelli, L.; Benedettelli, S. Nutritional Characteristics of Ancient Tuscan Varieties of Triticum aestivum L. Ital. J. Agron. 2016, 11, 237–245. [Google Scholar] [CrossRef] [Green Version]
  46. Dal Cortivo, C.; Ferrari, M.; Visioli, G.; Lauro, M.; Fornasier, F.; Barion, G.; Panozzo, A.; Vamerali, T. Effects of Seed-Applied Biofertilizers on Rhizosphere Biodiversity and Growth of Common Wheat (Triticum aestivum L.) in the Field. Front. Plant Sci. 2020, 11, 72. [Google Scholar] [CrossRef] [PubMed] [Green Version]
  47. Taylor, A.; Pereira, N.; Thomas, B.; Pink, D.A.C.; Jones, J.E.; Bending, G.D. Growth and Nutritional Responses to Arbuscular Mycorrhizal Fungi Are Dependent on Onion Genotype and Fungal Species. Biol. Fertil. Soils 2015, 51, 801–813. [Google Scholar] [CrossRef]
  48. Wieser, H.; Gutser, R.; von Tucher, S. Influence of Sulphur Fertilisation on Quantities and Proportions of Gluten Protein Types in Wheat Flour. J. Cereal Sci. 2004, 40, 239–244. [Google Scholar] [CrossRef]
  49. Lehmann, A.; Veresoglou, S.D.; Leifheit, E.F.; Rillig, M.C. Arbuscular Mycorrhizal Influence on Zinc Nutrition in Crop Plants—A Meta-Analysis. Soil Biol. Biochem. 2014, 69, 123–131. [Google Scholar] [CrossRef]
  50. Lehmann, A.; Rillig, M.C. Arbuscular Mycorrhizal Contribution to Copper, Manganese and Iron Nutrient Concentrations in Crops—A Meta-Analysis. Soil Biol. Biochem. 2015, 81, 147–158. [Google Scholar] [CrossRef]
  51. Rengel, Z.; Graham, R.D. Wheat Genotypes Differ in Zn Efficiency When Grown in Chelate-Buffered Nutrient Solution. Plant Soil 1995, 176, 307–316. [Google Scholar] [CrossRef]
  52. Magallanes-López, A.M.; Hernandez-Espinosa, N.; Velu, G.; Posadas-Romano, G.; Ordoñez-Villegas, V.M.G.; Crossa, J.; Ammar, K.; Guzmán, C. Variability in Iron, Zinc and Phytic Acid Content in a Worldwide Collection of Commercial Durum Wheat Cultivars and the Effect of Reduced Irrigation on These Traits. Food Chem. 2017, 237, 499–505. [Google Scholar] [CrossRef]
  53. Ciccolini, V.; Pellegrino, E.; Coccina, A.; Fiaschi, A.I.; Cerretani, D.; Sgherri, C.; Quartacci, M.F.; Ercoli, L. Biofortification with Iron and Zinc Improves Nutritional and Nutraceutical Properties of Common Wheat Flour and Bread. J. Agric. Food Chem. 2017, 65, 5443–5452. [Google Scholar] [CrossRef]
  54. Ma, X.; Luo, W.; Li, J.; Wu, F. Arbuscular Mycorrhizal Fungi Increase Both Concentrations and Bioavilability of Zn in Wheat (Triticum aestivum L.) Grain on Zn-Spiked Soils. Appl. Soil Ecol. 2019, 135, 91–97. [Google Scholar] [CrossRef]
Figure 1. Rainfall ten-day data and minimum and maximum air temperatures during the growth cycle of wheat in 2014–2015 (up) and 2015–2016 (down) at the experimental sites in San Piero a Grado, Pisa, Italy. The data were collected from a nearby weather station Bocca d’Arno, Pisa.
Agronomy 12 02418 g001
Figure 2. Effect of the interaction between arbuscular mycorrhizal fungal inoculation (AMF) and year of cultivation (Y) (AMF × Y) on the arbuscular mycorrhizal (AM) fungal root colonization of seven wheat genotypes sampled at the end of tillering (GS26) (A). Effect of the interaction among wheat genotype (G) × AMF × Y on the AM fungal root colonization of wheat samples at the booting growth stage (GS45) (B). -M: mock-AM fungal inoculated treatment (control); +M: AM fungal inoculated treatment. Wheat genotypes: G1: Gentil Rosso; G2: Risciola; G3: Frassineto; G4: Autonomia B; G5: Verna; G6: Blasco; G7: Bologna. Data are mean ± SE. Different letters indicate significant differences at P < 5% according to Tukey B test.
Agronomy 12 02418 g002
Figure 3. Effect of the interaction among wheat genotype (G), arbuscular mycorrhizal fungal inoculation (AMF), and year of cultivation (Y) (G × AMF × Y) on grain yield (A) and number of spikes per m2 (B). −M: mock-AM fungal inoculated treatment (control); +M: AM fungal inoculated treatment. Wheat genotypes: G1: Gentil Rosso; G2; Risciola; G3: Frassineto; G4: Autonomia B; G5: Verna; G6: Blasco; G7: Bologna. Data are mean ± SE. Different letters indicate significant differences at P < 5% according to Tukey B test.
Agronomy 12 02418 g003
Figure 4. Effect of the interaction among wheat genotype (G), arbuscular mycorrhizal fungal inoculation (AMF), and year of cultivation (Y) (G × AMF × Y) on grain protein concentration (GCP) (A) and gluten index (GI) (B). -M: mock-AM fungal inoculated treatment (control); +M: AM fungal inoculated treatment. Wheat genotypes: G1: Gentil Rosso; G2: Risciola; G3: Frassineto; G4: Autonomia B; G5: Verna; G6: Blasco; G7: Bologna. Data are mean ± SE. Different letters indicate significant differences at P < 5% according to Tukey B test.
Agronomy 12 02418 g004
Figure 5. Effect of the interaction among wheat genotype (G), arbuscular mycorrhizal fungal inoculation (AMF), and year of cultivation (Y) (G × AMF × Y) on glia/glut (A), H/L (B), and S−/S+ glia (C). −M: mock-AM fungal inoculated treatment (control); +M: AM fungal inoculated treatment. Wheat genotypes: G1: Gentil Rosso; G2: Risciola; G3: Frassineto; G4: Autonomia B; G5: Verna; G6: Blasco; G7: Bologna. Data are mean ± SE. Different letters indicate significant differences at P < 5% according to Tukey B test.
Agronomy 12 02418 g005
Figure 6. Effect of the interaction among wheat genotype (G), arbuscular mycorrhizal fungal inoculation (AMF), and year of cultivation (Y) (G × AMF × Y) on grain P (A) and Zn (D) concentration. Effect of the interaction G × AMF on grain Fe concentration (B) and of the interaction G × Y on grain Fe concentration (C). −M: mock-AM fungal inoculated treatment (control); +M: AM fungal inoculated treatment. Wheat genotypes: G1: Gentil Rosso; G2: Risciola; G3: Frassineto; G4: Autonomia B; G5: Verna; G6: Blasco; G7: Bologna. Data are mean ± SE. Different letters indicate significant differences at P < 5% according to Tukey B test.
Agronomy 12 02418 g006
Figure 7. Effect of the interaction between wheat genotype (G) and arbuscular mycorrhizal fungal inoculation (AMF) (G × AMF) (A) and between G and year of cultivation (G × Y) (B) on grain phytate concentration. -M: mock-AM fungal inoculated treatment (control); +M: AM fungal inoculated treatment. Wheat genotypes: G1: Gentil Rosso; G2: Risciola; G3: Frassineto; G4: Autonomia B; G5: Verna; G6: Blasco; G7: Bologna. Data are mean ± SE. Different letters indicate significant differences at P < 5% according to Tukey B test.
Agronomy 12 02418 g007
Figure 8. Shade plot based on arbuscular mycorrhizal fungal colonization, yield and yield components, and proteins and minerals in grain, highlighting variable patterns in mock-AM fungal inoculated (−M) wheat genotypes (G) and AM fungal inoculated (+M) G in the two years of cultivation (2014/2015 and 2015/2016). The input data matrix was square rooted, and data were standardized by the total value of the variables (parameters). For genotype (G), codes refer to Table 1. Parameters are: AMF root colonization (AMF col.) at the end of tillering (G26) and at booting growth stages (GS45); GY: grain yield; Spikes: spike density; K/S: number of kernels per spike; KW: kernel weight; GPC: grain protein concentration; GI: gluten index; glia/glu: glia-din-to-gluten ratio; HMW/LMW: HMW-GS-to-B-type LMW-GS ratio; S−/S+ glia: sulphur-poor to-sulphur-rich gliadin fractions ratio; P: grain phosphorus concentration; Fe: grain iron concentration; Zn: grain zinc concentration; phy: phytates concentration in grain. The quantity parameters are shown by depth/colour of shading from white to black (scale from 0 to 100). Wheat genotypes: G1: Gentil Rosso; G2: Risciola; G3: Frassineto; G4: Autonomia B; G5: Verna; G6: Blasco; G7: Bologna.
Agronomy 12 02418 g008
Table 1. List of the genetic material including information on year of release (YR), pedigree, glutenin configuration, and score quality.
GroupGenotypeCodeYR 1PedigreeGlu-A1Glu-B1Glu-D1Score
oldGentil RossoG1-landrace113 + 192 + 127
RisciolaG2-landrace17 + 82 + 128
FrassinetoG31922selection from Gentil Rosso172 + 127
Autonomia BG41938Frassineto 405/Mentana17 + 82 + 129
VernaG51953Est Mottin 72/Mont Calme 245-65 + 106
modernBlascoG62002Oderzo/Barra27 + 85 + 1015
BolognaG72002H89092/H89136/Soissons27 + 85 + 1015
1 YR = year of release.
Table 2. P-values of three-way ANOVA on the effect of genotype (G), arbuscular mycorrhizal fungal inoculation (AMF), and year of cultivation (Y) and their interactions on AMF root colonization (AMF col.) at the end of tillering and at booting growth stages (GS26 and GS45, respectively) and on the investigated wheat agronomic and quality parameters. In bold are statistically significant P values according to the post-hoc Tukey B test.
TraitsParameterGAMFYG × AMFG × YY × AMFG × AMF × Y
AMF root colonizationAMF col. GS26 10.9770.487<0.0010.5140.4000.0390.606
AMF col. GS450.023<0.001<0.0010.8820.0190.1150.038
Yield and their componentsGY<0.001<0.0010.1470.3130.3670.019<0.001
Spikes<0.001<0.0010.6970.0560.3990.811<0.001
K/S0.0150.2890.2250.0190.0050.0060.26
KW<0.0010.0020.733<0.001<0.0010.716<0.001
Grain proteinsGPC<0.001<0.0010.913<0.001<0.0010.327<0.001
GI<0.001<0.001<0.001<0.001<0.0010.0080.011
glia/glut<0.001<0.0010.087<0.0010.0010.0010.001
H/L<0.001<0.001<0.001<0.001<0.001<0.0010.004
S-/S+ glia<0.001<0.001<0.001<0.001<0.0010.012<0.001
Grain mineralsP0.3260.0080.6120.2030.1170.5390.027
Fe<0.001<0.001<0.0010.0040.0050.1280.398
Zn<0.0010.104<0.001<0.0010.2520.4200.025
phy0.0010.398<0.0010.002<0.0010.8540.165
phy/Fe<0.0010.275<0.0010.0240.0240.5610.207
phy/Zn0.001<0.001<0.0010.001<0.0010.5470.231
1 AMF col. GS26: AMF root colonization at tillering; AMF col. GS45: AMF root colonization at booting; GY: grain yield; Spikes: spike density; K/S: number of kernels per spike; KW: kernel weight; GPC: grain protein content; GI: gluten index; glia/glu: gliadin-to-gluten ratio; H/L: HMW-GS-to-B-type LMW-GS ratio; S−/S+ glia: sulphur-poor to sulphur-rich gliadin fractions ratio; P: grain phosphorus concentration; Fe: grain iron concentration; Zn: grain zinc concentration; phy: grain phytate concentration; phy/Fe: ratio between phytate and iron in grain; phy/Zn: ratio between phytate and zinc in grain.
Table 3. Correlation values among AMF root colonization (AMF col.) at the end of tillering (G26) and at booting growth stages (GS45) and wheat agronomic and quality parameters. In bold are statistically significant P values according to the correlation of Pearson ® on square root transformed and standardized data (standardization based on the variables over the maximum value).
AMF col.GYSpikesK/SKWGPCGIGlia/GlutH/LS−/S+ GliaPFeZn
GS26 1GS45
GS450.305
GY0.0980.244
Spikes0.0450.1850.703
K/S0.0080.1130.417−0.145
KW0.1220.0110.277−0.0130.311
GPC0.1610.177−0.003−0.151−0.0980.357
GI0.2110.1480.3660.351−0.0910.2970.215
glia/glut0.0680.2440.0480.0340.131−0.1470.101−0.109
H/L0.0460.4190.4640.3850.1230.1000.0490.291−0.181
S-/S+ glia0.0590.4370.0910.0370.108−0.0320.042−0.1560.5050.217
P−0.0550.2440.1800.1260.0090.1060.3800.1870.1370.4590.325
Fe0.367−0.1400.0540.034−0.1050.1830.0520.088−0.0230.1520.0650.344
Zn0.258−0.0770.0200.010−0.0420.0800.118−0.0080.1660.0480.0700.3590.383
phy0.4350.388−0.087−0.1210.063−0.0620.2000.0150.210−0.0290.108−0.1520.3540.250
1 AMF col. GS26: AMF root colonization at tillering; AMF col. GS45: AMF root colonization at booting; GY: grain yield; Spikes: spike density; K/S: number of kernels per spike; KW: kernel weight; GPC: grain protein content; GI: gluten index; glia/glu: gliadin-to-gluten ratio; H/L: HMW-GS-to-B-type LMW-GS ratio; S−/S+ glia: sulphur-poor to sulphur-rich gliadin fractions ratio; P: grain phosphorus concentration; Fe: grain iron concentration; Zn: grain zinc concentration; phy: grain phytate concentration.
Table 4. Effect of AMF treatment on root colonization, agronomic and quality parameters in the old and modern groups of bread wheat genotypes. Data are expressed as mean values (± standard deviation) and percent change of the AMF inoculated samples in comparison with the untreated ones (+M vs. –M). Statistically significant differences were evaluated according to Student’s t-test at P < 5%.
ParameterUnitOld+M vs. −Mt-TestModern+M vs. −Mt-Test
AMF col. GS26 1%10.7 ± 5.1−11%ns11.3 ± 5.06%ns
AMF col. GS45%14.6 ± 5.335%*14.4 ± 6.548%*
GYmg/m2416 ± 9124%*482 ± 568%ns
Spikeheads/m2452 ± 7716%*532 ± 552%ns
K/Sn/m223 ± 3.85%ns21.8 ± 2.4−2%ns
KWmg40.3 ± 4.01%ns42.1 ± 5.08%ns
PC%11.7 ± 0.91%ns11.9 ± 1.116%*
GIunits61.8 ± 17.514%ns92.4 ± 7.7−7%ns
glia/glut-0.84 ± 0.091%ns0.80 ± 0.1018%*
H/L-0.53 ± 0.1454%*0.56 ± 0.115%ns
S−/S+ glia-0.23 ± 0.0737%*0.20 ± 0.0750%*
Pg/kg7.5 ± 1.97%*8.4 ± 2.744%*
Femg/kg35.7 ± 10.513%ns36.5 ± 10.030%*
Znmg/kg21.1 ± 5.3−1%ns22.9 ± 6.125%*
phymg/kg13.0 ± 3.0−10%ns11.5 ± 4.620%ns
phy/Femg/kg65.2 ± 23.7−3%ns54.9 ± 28.6−10%ns
phy/Znmg/kg33.7 ± 13.0−19%ns29.1 ± 14.6−5%ns
1 AMF col. GS26: AMF root colonization at tillering; AMF col. GS45: AMF root colonization at booting; GY: grain yield; Spikes: spike density; K/S: number of kernels per spike; KW: kernel weight; GPC: grain protein content; GI: gluten index; glia/glu: gliadin-to-gluten ratio; H/L: HMW-GS-to-B-type LMW-GS ratio; S-/S+ glia: sulphur-poor to sulphur-rich gliadin fractions ratio; P: grain phosphorus concentration; Fe: grain iron concentration; Zn: grain zinc concentration; phy: grain phytate concentration; phy/Fe: ratio between phytate and iron in grain; phy/Zn: ratio between phytate and zinc in grain; ns = difference not significant; * = difference significant at P < 5% according to Student’s t-test.
Publisher’s Note: MDPI stays neutral with regard to jurisdictional claims in published maps and institutional affiliations.