Article

Rapeseed Leaf Estimation Methods at Field Scale by Using Terrestrial LiDAR Point Cloud

1
College of Resources and Environment, Huazhong Agricultural University, Wuhan 430070, China
2
College of Informatics, Huazhong Agricultural University, Wuhan 430070, China
*
Author to whom correspondence should be addressed.
Agronomy 2022, 12(10), 2409; https://doi.org/10.3390/agronomy12102409
Submission received: 15 August 2022 / Revised: 28 September 2022 / Accepted: 2 October 2022 / Published: 5 October 2022

Abstract

:
Exploring the key technologies of agricultural robots is an inevitable trend in the development of smart agriculture. It is significant to continuously transplant and develop novel algorithms and models to update agricultural robots that use light detection and ranging (LiDAR) as a remote sensing method. This paper implements a method for extracting and estimating rapeseed leaves through agricultural robots based on LiDAR point cloud, taking leaf area (LA) measurement as an example. Firstly, the three-dimensional (3D) point cloud obtained with a terrestrial laser scanner (TLS) were used to extract crop phenotypic information. We then imported the point cloud within the study area into a custom hybrid filter, from which the rapeseed point cloud was segmented. Finally, a new LA estimation model, based on the Delaunay triangulation (DT) algorithm was proposed, namely, LA-DT. In this study, a crop canopy analyzer, LAI-2200C, was used to measure rapeseed LA in farmland. The measured values were employed as standard values to compare with the calculated results obtained using LA-DT, and the differences between the two methods were within 3%. In addition, 100 individual rapeseed crops were extracted, and the output of the LA-DT model was subjected to linear regression analysis. The R ² of the regression equation was 0.93. The differences between the outputs of the LAI-2200C and LA-DT in these experiments passed the paired samples t-test with significant correlation (p < 0.01). All the results of the comparison and verification showed that the LA-DT has excellent performance in extracting LA parameters under complex environments. These results help in coping with the complex working environment and special working objects of agricultural robots. This is of great significance for expanding the interpretation methods of agricultural 3D information.

1. Introduction

Rapeseed is the third largest oilseed crop after oil palm and soybean [1]. Compared with other major crops, rapeseed has the lowest yield per hectare [2]. In the process of rapeseed production, it is very important for farmland managers to understand the growth status of crops. Normal plant analysis takes a long time because the data must be collected by farmers and then sent to researchers for analysis results [3]. Agricultural robot platforms carrying light detection and ranging (LiDAR) technology can simplify this process [4,5]. Agricultural robots autonomously collect phenotypic information, such as the physiological state, pests and diseases of target crops, and formulate crop management plans based on this information [4,6,7]. Compared with traditional methods, three dimensional (3D) point cloud data calculation of plant canopy parameters shows competitive advantages, including high precision, labor saving, and fast data collection [4,8,9].
In the field of smart agricultural research, some people have attempted to directly calculate target canopy parameters, such as canopy features, leaf area index (LAI), and leaf area (LA), based on 3D laser point clouds [10,11,12]. Among these phenotypic indicators, LA deserves special attention. Many studies have shown that the LA of crops is positively correlated with crop yield and crop quality [13,14,15]. For instance, Hashimoto et al. [13] verified the feasibility of estimating crop yield through LA in their research, and Li et al. [14] concluded in their study that the higher the total LA of cotton leaves, the higher the cotton yield. Horák et al. [15] believe that the internal composition of grapeseed fruit can be optimized by adjusting the LA of grapeseed seedlings. Therefore, the LA of crops has important guiding significance for crop production. In this paper, we also take the total LA of rapeseed as the research target.
The development of 3D point cloud algorithms has become relatively mature, and the research of point cloud segmentation algorithm has always been a popular topic in this field [16,17,18]. Point cloud segmentation technology is often used for the pretreatment of the 3D point cloud data of plants in forestry and agriculture, including the clustering and segmentation of monomers or organs of plants [19,20,21,22]. For specific structural problems, many studies consider combining multiple unique approaches to achieve desired results. This approach is known as a hybrid strategy [23,24,25]. In some complex point cloud processing scenarios, many studies have also used this concept [26,27,28,29]. These results show that well-designed hybrid filters generally outperform individual point cloud processing algorithms. However, until now, there is still no general hybrid filter that can achieve the segmentation of a point cloud from a rapeseed field.
Over the past few decades, numerous studies have demonstrated that the Delaunay triangulation (DT) algorithm can robustly achieve fast 3D reconstruction of 3D point clouds [30,31,32]. A steady stream of scholars have used the DT algorithm in their research because of its excellent performance. For example, Guo et al. [31] demonstrated the improved DT algorithm proposed in their article from three aspects: point cloud data scale, 3D reconstruction algorithm comparison, and 3D reconstruction object universality. Lo [33] implemented DT of a large point cloud with more than one billion points on a common PC. All these studies achieve efficient triangulation of point clouds by designing various triangulation construction schemes [34,35,36]. The continuously updated DT Algorithm has also been used in various research fields [37,38,39]. Based on the above research results, we also used the DT algorithm to calculate the 3D surface model of the rapeseed point cloud in this study.
In summary, the main objectives of this paper were: (a) Use terrestrial laser scanner (TLS) to collect point cloud of field rapeseed at the farmland scale; (b) Design a hybrid filter, which can segment the rapeseed point cloud from the farmland and filter out most of the noisy point cloud; (c) Establish a LA estimation model based on the point cloud of rapeseed; (d) Explore the feasibility of transplanting the LA estimation model to agricultural robots.

2. Materials

2.1. Site Preparation

Rapeseed, a kind of long-sunshine crop, is widely planted in the central and southern regions of China’s plains. It generally grows in a relatively humid climate and adapts to a cold climate. In this experiment, three winter rapeseed plots (114.3666° E, 30.4741° N) in the experimental field were selected (Figure 1). The seeding method used for planting the rapeseed field was seedling transplantation. The data collection period from mid-November to early March, which is highly representative, was selected to ensure that the model and method had a high universality.

2.2. Field Data Collection

Rapeseed fields under three scenes were selected, and a TLS (Focus S70, FARO, Lake Mary, FL, USA) was used to collect target point clouds, as shown in Figure 1. During the experiment, multiple LiDAR scans needed to be conducted to construct a realistic 3D reconstruction of the target from different spatial perspectives. In addition, in order to minimize the impact of leaf shaking on the data accuracy, sunny and windless weather was selected to collect the target point cloud. For example, seven LiDAR scans were established in Rapeseed-01 to collect the 3D point cloud data of the target rapeseed field, and the systematic measurement error of Focus S70 around 10 m was 1 mm. The spatial position overview of the scanner stack points and target balls is shown in Figure 2. The file size of Rapeseed-01 was 576 MB, and the number of points was approximately 13 million (i.e., 13,188,836). The statistics of the attributes of the three groups of point cloud data are shown in Table 1.
In this study, a plant canopy analyzer (LAI-2200C, LI-COR, Superior Street, Lincoln, NE, USA), which is suitable for crops with uniform density, was used to measure the LA of the target rapeseed field. The “fish-eye” optical sensor was used to measure the projected light under multiple angles of rapeseed canopy. The collected rapeseed canopy information was imported into FV-2200 software (FV-2200, LI-COR, Superior Street, Lincoln, NE, USA), and the LA of the target field was calculated using the radiation transfer model of the plant canopy [40,41].

3. Methods

Point cloud library (PCL) is a modular open source C++ library [42]. It implements a large number of point cloud general algorithms and data management. This study used PCL version 1.11.1 and Visual Studio 2022 to complete all point cloud processing algorithms and point cloud visualization in this paper.

3.1. Measurement of LA by LAI Instrument

Leaf area index (LAI) is the ratio of LA to ground area. The LAI-2200C calculates LAI based on measurements above and below the crop canopy, thereby deriving the LA based on the LAI in the target study area. All algorithms are embedded in the companion software FV-2200. The LAI-2200C allows LAI measurements of individual plants and small plots by blocking undesired objects (such as adjacent crops or adjacent plots) from the sensor’s view. Therefore, using this method of measurement meant we could more conveniently complete the LA measurement of individual rapeseed.

3.2. Field Rapeseed Point Cloud Extraction Based on Hybrid Filter

In this study, we designed a hybrid filter, as shown in Figure 3, for the rapeseed point cloud data in the field scene. This hybrid filter was divided into the following three steps:

3.2.1. Soil Point Cloud Filtering

In this study, most of the soil point clouds were first filtered using a pass-through filtering algorithm based on point cloud elevation values. Then, the rapeseed point cloud was initially segmented from the source data by directly analyzing the RGB attributes of the point cloud using a green enhancement algorithm based on hue, saturation and value (HSV) color space conversion [43,44].

3.2.2. Outlier Point Cloud Filtering

Laser scanning often produces a collection of point clouds with uneven density and irregular outliers, which are often introduced by measurement noise (e.g., measurement errors caused by factors such as air dust, wild insects, air humidity, and additional light sources). In addition, during the laser scanning operation of the study area, the target crops undergo slight non-rigid transformation due to some natural factors (e.g., airflow blowing leaves, sunlight during laser scanning causing deformation of crop leaves). This phenomenon may result in multi-layered leaf point cloud data obtained from laser-scanned crop leaves.
First, convolution filtering based on a Gaussian kernel function was implemented in PCL, where the weight of the specified area followed a Gaussian distribution, which filtered out high frequency noise [45,46]. Then, we removed the obvious outliers using a statistical filter [29,47,48,49]. The combination of these two filters could remove noise points quickly and completely.

3.2.3. Rapeseed Point Cloud Down-sampling

At this time, the amount of point cloud data remained in the order of tens of millions. The point cloud algorithm, when supplied with this many points, is inefficient, and the large amount of point cloud data does not significantly improve the accuracy of the phenotype research model. A voxel filter was used at the end of the mixing filter to down-sample the rapeseed point cloud. Figure 4 illustrates the importance of this algorithm for crop point cloud processing models.
In this part of the research, we kept the points closest to the centroid in each voxel, so as to avoid losing the small features of the original point cloud and to improve the expression accuracy of point cloud data. In the 3D voxel shown in Figure 5, there was a point cloud set A { p 1 , p 2 , , p n } , where the centroid point p 0 ( x 0 , y 0 , z 0 ) of the point set A was obtained by Equation (1).
x 0 = i = 1 n x i n ,   y 0 = i = 1 n y i n , z 0 = i = 1 n z i n .
Suppose p k is a point in the point set A , the distance d k between p k and p 0 is the smallest, then p k is the reserved point of this 3D voxel and d k is obtained by the following equation:
d k = ( x k x 0 ) 2 + ( y k y 0 ) 2 + ( z k z 0 ) 2 .
In this study, voxel grids with side lengths of 2 mm, 3 mm, 5 mm and 7 mm were used for point cloud down-sampling, respectively. We explain the importance of this algorithm for crop point cloud processing models in Section 4.2.

3.3. LA-DT, a New LA Estimation Models Based on DT Algorithm

We proposed LA-DT to triangulate the scattered point clouds in space through Delaunay 3D subdivision in this paper. The 3D surfaces of complex objects were simulated using DT [50].
The hybrid filter in this study could filter most of the noisy points in the target point cloud data, but still retained the noise within a small filtering error range on the 3D surface. In the process of 3D reconstruction, these noise point clouds would cause the surface of rapeseed leaves to be uneven, which would cause certain errors in the LA estimation model. In this section, we used the moving least squares (MLS) method to fit a moving least squares surface in the neighborhood of each sampling point [51,52]. The steps of the algorithm were as follows:
  • Step 1: Compute the locally approximated hyperplane H using by Equation (3), where H is the minimum of the nonlinear energy function EMLS (Equation (4)). The value n is the normal vector of the hyperplane, and q is the neighborhood point of the pi point. In Equation (4), θ is a monotonically decreasing positive weight function, which is represented by Equation (5).
H = { x R 3 | n T x = n T q } ,
E M L S ( q , n ) =   ( n T n T q ) 2 θ ( q p i ) ,
θ ( d ) = e d 2 ε 2 .
  • The value ε is the global estimated sampling space distance, which could control the smoothness of the MLS surface. We set d = r 3 in this algorithm, where r is the neighborhood search radius of the p i point.
  • Step 2: Use the local quadratic surface g ( u , v ) to fit the local point cloud. Let q i be the orthogonal projection of p i onto H , ( x i ,   y i ) be the local two-dimensional coordinates of p i , and f i = q i p i be the height of p i on H . The final g ( u , v ) fitting result minimizes the following errors:
  ( g ( x i ,   y i ) f i ) 2 θ ( q p i ) .
  • Step 3: Obtain the point P i * corresponding to the point p i on the moving least squares surface:
P i * = q i + g ( u , v ) · n .
In order to obtain the real 3D surface of rapeseed leaves, surface reconstruction of scattered point clouds was also required. The process of 3D reconstruction of discrete point cloud in target area restores the topological relationship between each spatial point, so that the obtained 3D surface model can be used to represent the real spatial surface topology of the target object. The methods of 3D reconstruction are roughly divided into two categories: implicit and explicit methods [53]. The former uses the distance function to specify the directed distance of each point cloud to the fitted surface, while the latter interpolates sample points from the point set to generate a triangulated reconstructed surface. This paper adopts the algorithm based on DT in the explicit method. The time complexity O of the DT algorithm is low ( O ( m log m ) , where m represents the number of point clouds in the point set), so this surface reconstruction algorithm is suitable for large point sets in farmland computer vision [33].
The Delaunay 3D reconstruction in this paper was mainly divided into three steps:
  • Step 1: Build the KDTree index of the target point cloud based on the idea of divide and conquer, which could improve the upper limit and processing speed of the input point cloud of the 3D reconstruction model [30,31,33].
  • Step 2: Use the Delaunay point-by-point interpolation algorithm, based on parallel computing, to realize the 3D surface reconstruction of rapeseed point cloud [34,35].
  • Step 3: Check the overall Delaunay 3D reconstruction model, based on the local optimization procedure (LOP) algorithm.
The 3D triangular mesh model of rapeseed was obtained by reconstructing the rapeseed leaf surface (Figure 6). The curved surface model was a single-layer non-closed 3D model, and the 3D coordinate information of the point cloud data could be derived from the model. The coordinate information of the point cloud was substituted into Helen’s Equation to calculate the area of the triangle in which the point cloud was located. Triangle j presumably comprises points P a ( X a , Y a , Z a ), P b ( X b , Y b , Z b ), and P c ( X c , Y c , Z c ). According to Equation (8), the area of the triangle is S j , where φj represents the half circumference of the triangle.
{ L A B = ( X a X b ) 2 + ( Y a Y b ) 2 + ( Z a Z b ) 2 L B C = ( X b X c ) 2 + ( Y b Y c ) 2 + ( Z b Z c ) 2 L A C = ( X a X c ) 2 + ( Y a Y c ) 2 + ( Z a Z c ) 2 φ j = L A B + L B C + L A C 2 S j = φ j · ( φ j L A B ) · ( φ j L B C ) · ( φ j L A C )
The total rapeseed LA, S t o t a l , in the target field could be obtained from Equation (9) using the triangular grid index obtained through the 3D reconstruction of Delaunay.
S t o t a l = j = 1 n S j .

4. Results

4.1. Accuracy Evaluation

4.1.1. Paired Difference Analysis at Farmland Scale

The statistical results of LA are shown in Figure 7. The results showed that the LA estimation results of the two methods were similar, and the results measured by LAI-2200C were slightly higher than those obtained by the LA-DT. The paired difference between LAI-2200C and LA-DT is analyzed in Table 2 where the mean of difference was 0.14 m 2 , the standard deviation of the difference was 0.06, and the standard error of mean was 0.04. In addition, Table 2 shows that there was a correlation between the calculated values of LAI-2200C and LA-DT ( p < 0.01), and the correlation coefficient was as high as 0.99, which proved that the LA value output by LA-DT was close to the standard value.

4.1.2. The Linear Analysis at Individual Plant Scale

A total of 100 seedlings of rapeseed were randomly labeled and numbered in the experimental data to further verify the accuracy of the model. The LA measuring instrument was used to calculate the LA of all individual rapeseed plants as the standard value, and the single plant point cloud data under the corresponding number were removed from the complete field point cloud data.
Linear regression analyses, with the measured results of LAI-2200C as the standard value, were conducted for the calculated results of LA-DT, as shown in Figure 8. The linear regression equation obtained from the analysis was y = 0.99 x + 0.50 , and R 2 is 0.93. The linear regression analysis showed that the outputs of LA-DT and LAI-2200C had a strong linear relationship.
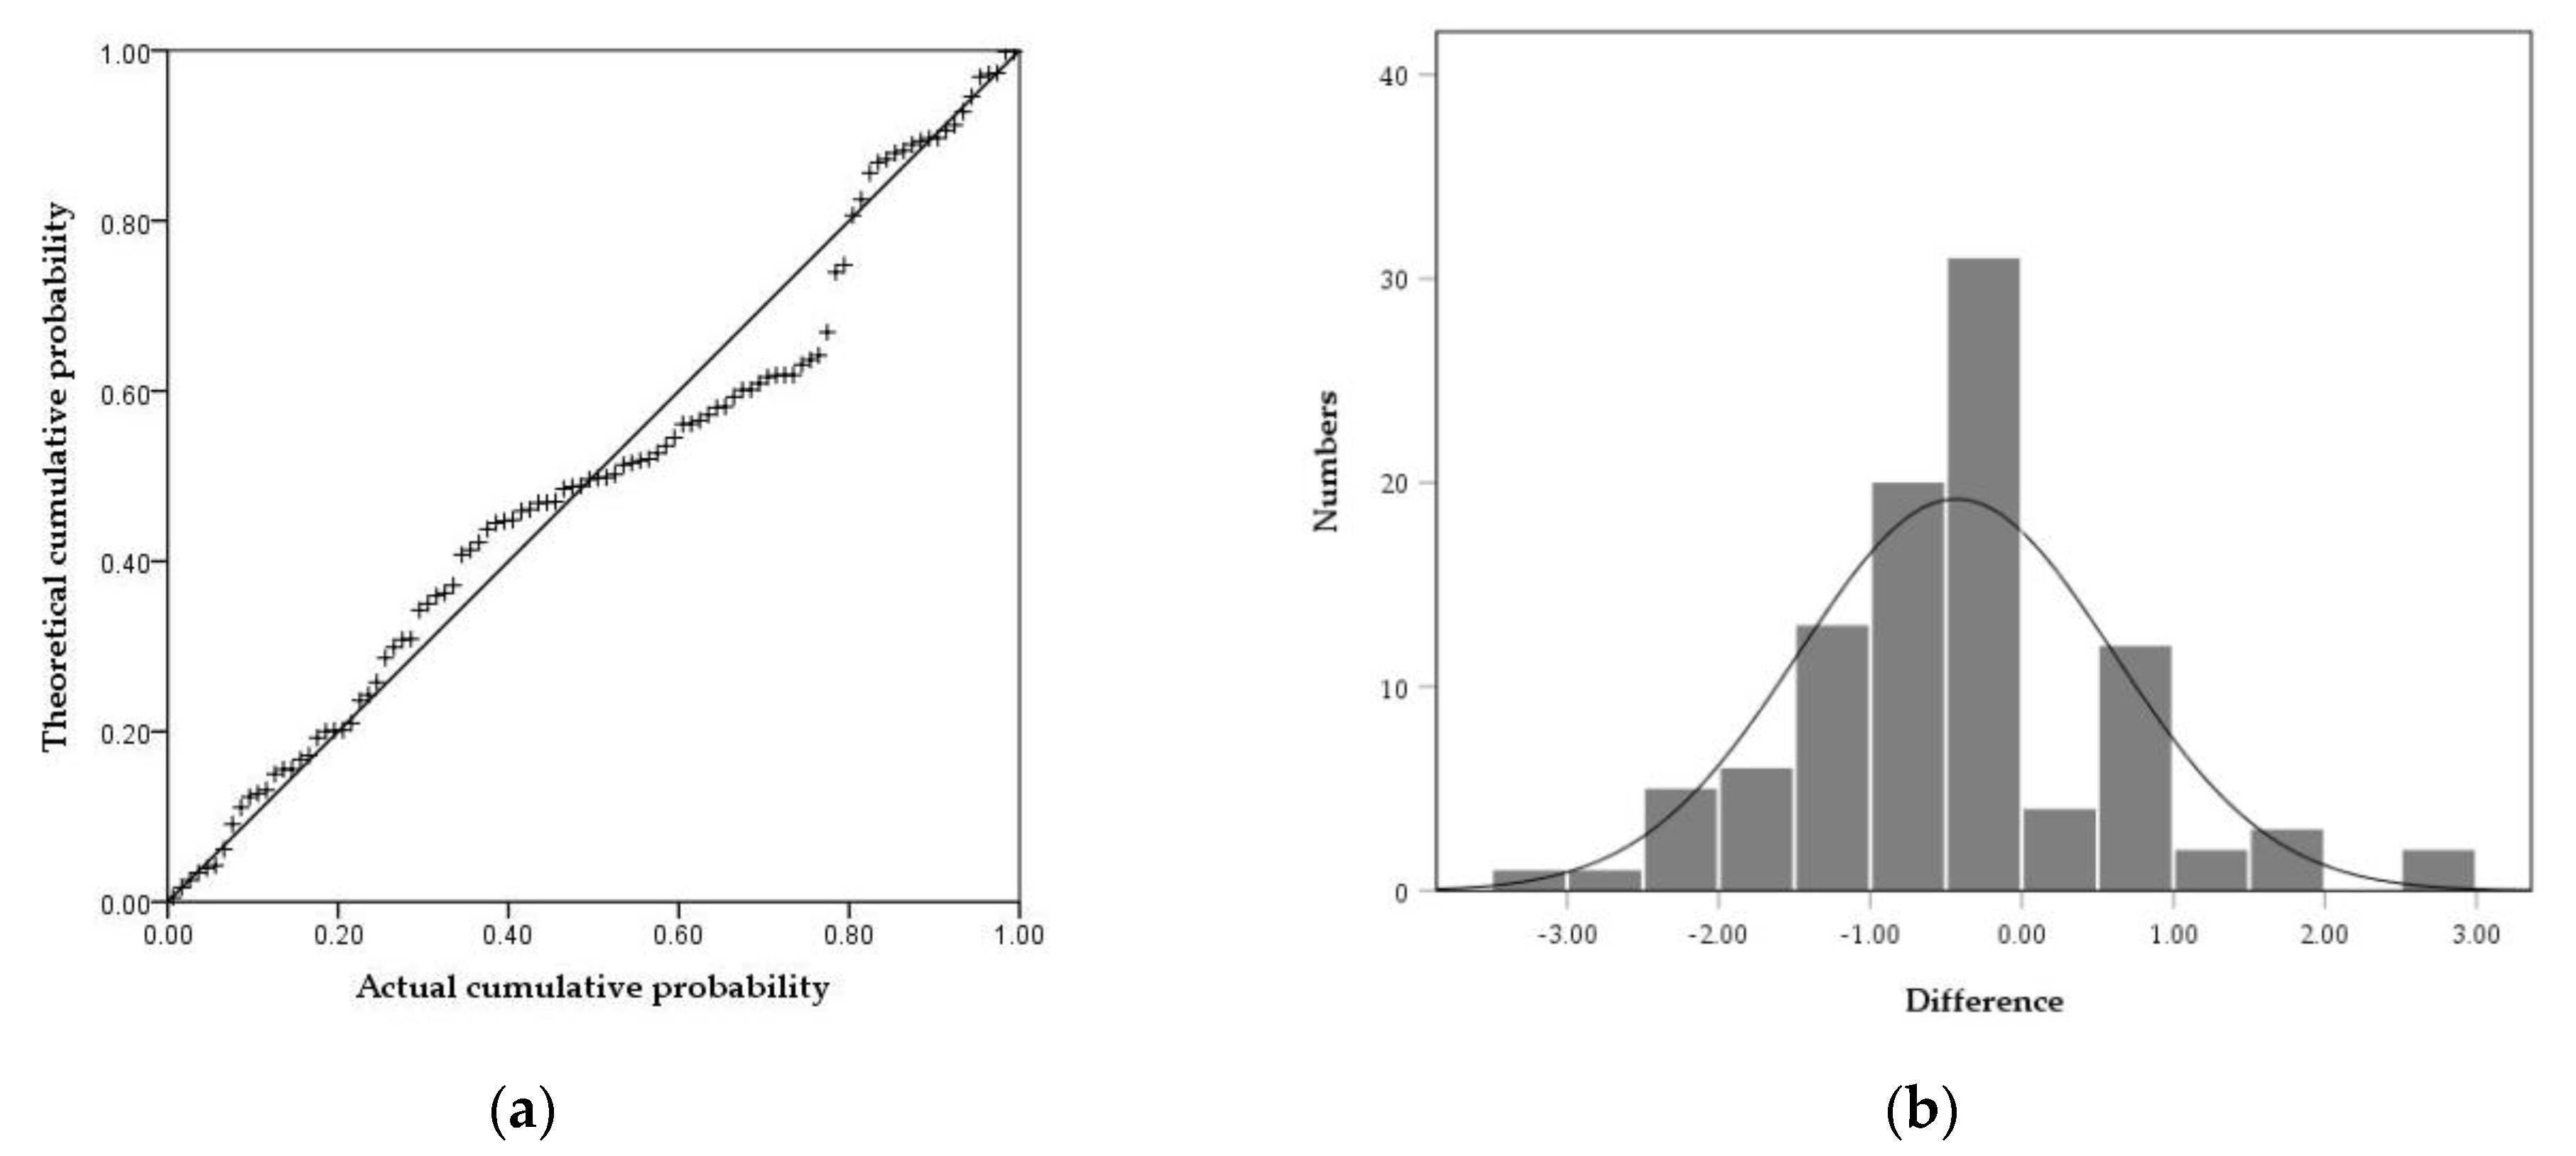
Figure 9a is a P-P plot of the paired differences, which could be determined to be “close enough” to the normal distribution of the measured value differences. Therefore, the assumption of normal distribution of the difference between LA-DT and LAI-2200C measurements could not be rejected, and a paired samples t-test could be used (Figure 9b). In Table 3, the mean of the output difference between LAI-2200C and LA-DT was only 0.43. In the paired sample test, there was a significant positive correlation between the two, and the correlation coefficient was 0.97 ( p < 0.01). The results in Table 3 show that the difference was statistically significant, that is, it could be judged that there was a significant difference between the two LA calculation methods ( t = −4.17, p (2-tailed) < 0.01).

4.2. Subsampling Threshold of Rapeseed Point Cloud

Figure 10a–c corresponds to the Delaunay 3D reconstruction results of the following point clouds: the rapeseed point cloud with noise, the point cloud without noise and the point cloud output by the hybrid filter. Comparing Figure 10(a2,b2), the noise point clouds around the rapeseed leaves would cause the mesh surface to be rough, which would greatly affect the 3D reconstruction of Delaunay. Furthermore, rough 3D surfaces increase the LA estimates and model processing time (Figure 10(a3,b3)). Comparing Figure 10(b2,c2), the thinning of the point cloud close to 50% did not affect the DT. From the 3D surface reconstruction effect in Figure 10(b3,c3), the appropriate reduction of density could make the surfaces of the leaves smoother, that is, the roughness was reduced. Not only that, comparing the processing time of the LA-DT model before and after down-sampling of the rapeseed point cloud, Figure 10(c3) was only one-tenth of Figure 10(b3). That is to say, when the crop point cloud was at an appropriate density, it could ensure the surface reconstruction effect while reducing the model processing time.
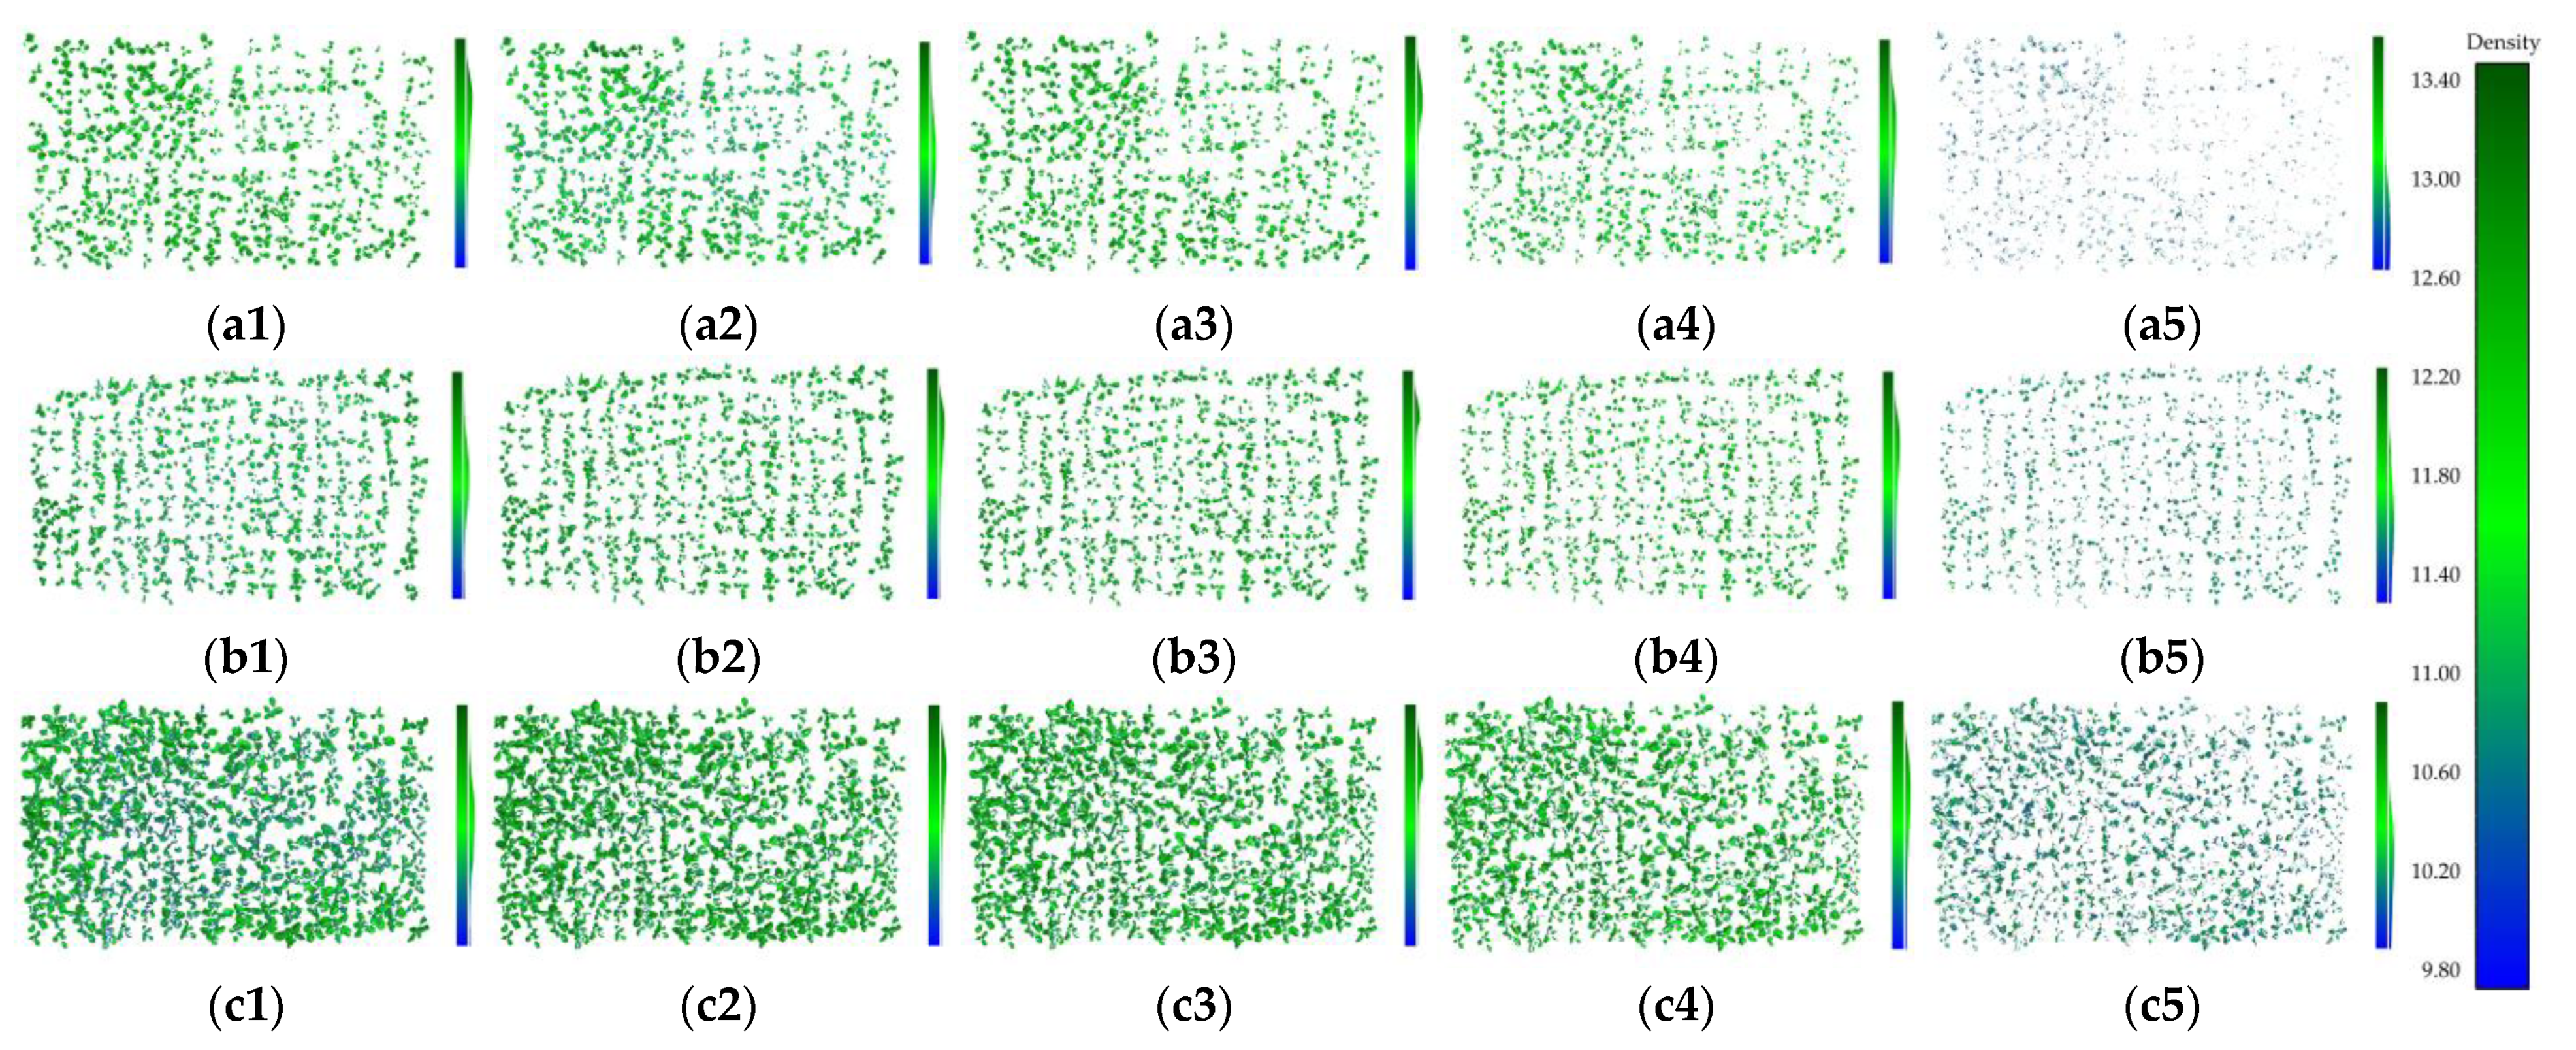
We further verified the above conclusions with three sets of field rapeseed point cloud data, Rapeseed-01, Rapeseed-02 and Rapeseed-03. For these three groups of noise-free point clouds, the voxel filtering algorithm was used to down-sample them with different voxel sizes. The obtained point clouds of rapeseed with different densities were input into the LA-DT model, and then exported to obtain the 3D surface model after DT (Figure 11). Figure 11a–c shows the LA-DT outputs of Rapeseed-01, Rapeseed-02 and Rapeseed-03, respectively. The figures with (1) represent the LA-DT output of the initial rapeseed point cloud without point cloud thinning, while the figures with (2)–(5) represent the LA-DT outputs of the rapeseed point cloud filtered with different voxel sizes, respectively. In Figure 11, we render the DT according to the point cloud distribution density (blue for lower density and green for higher density).
Table 4 presents some parameters of the 3D reconstruction data in Figure 11. Included are the number of point clouds for each group of meshes, LA-DT processing time, the area of the 3D surface, and area ratio. It was clear that the LA-DT model processing time was positively correlated with the number of point clouds, model processing time, and LA estimates output by the model.
When the three groups of initial point clouds were down-sampled in a voxel grid with a side length of 2 mm, the number of point clouds was approximately equal to 50% of the initial ones. The change rates of the calculated LA values in the three groups were all less than 3%, and the processing time was reduced by more than 50% (Figure 11(a2,b2,c2)). Table 5 shows the paired sample t-test of LA values before and after filtering with 2 mm, 3 mm, 5 mm, and 7 mm voxel side lengths. It could be considered that the correlation between the LA values before and after the 2 mm voxel side length filtering was extremely high ( p < 0.01), and the paired samples test results showed that mean of difference, Std. Deviation and Std. Error Mean were small. That is, in LA-DT, the difference between the output LA values before and after 2 mm voxel filtering could be ignored.
When the three groups of initial point clouds were down-sampled in a voxel grid with a side length of 3 mm, the number of point clouds was approximately equal to 30% of the initial value, and the change rates of the calculated LA values in the three groups were all less than 15%. In addition, the time consumption at this time was only 25% of the initial value (Figure 11(a3,b3,c3)). In Table 5, the LA values before and after 3mm voxel filtering were also highly correlated ( p < 0.01). At this time, mean of difference, Std. Deviation and Std. Error Mean had all increased, which could not be ignored. That is, in this study, the 3mm voxel filtering process would have a certain impact on the integrity of the target point cloud.
When the three groups of initial point clouds were down-sampled in the voxel grid with side lengths of 5 mm or 7 mm, the density of the point clouds was low, and a lot of 3D surface information of rapeseed leaves was lost, compared with the initial point clouds (Figure 11(a4,a5,b4,b5,c4,c5)). Therefore, the DT network constructed by LA-DT not only had a large number of holes, but also had serious defects on the edges. In addition, confidence in the correlation of LA values before and after 5mm or 7mm voxel filtering was reduced (Table 5). The pairwise difference parameters at this time proved that the sparser point cloud density would have a large negative impact on the output accuracy of LA-DT.
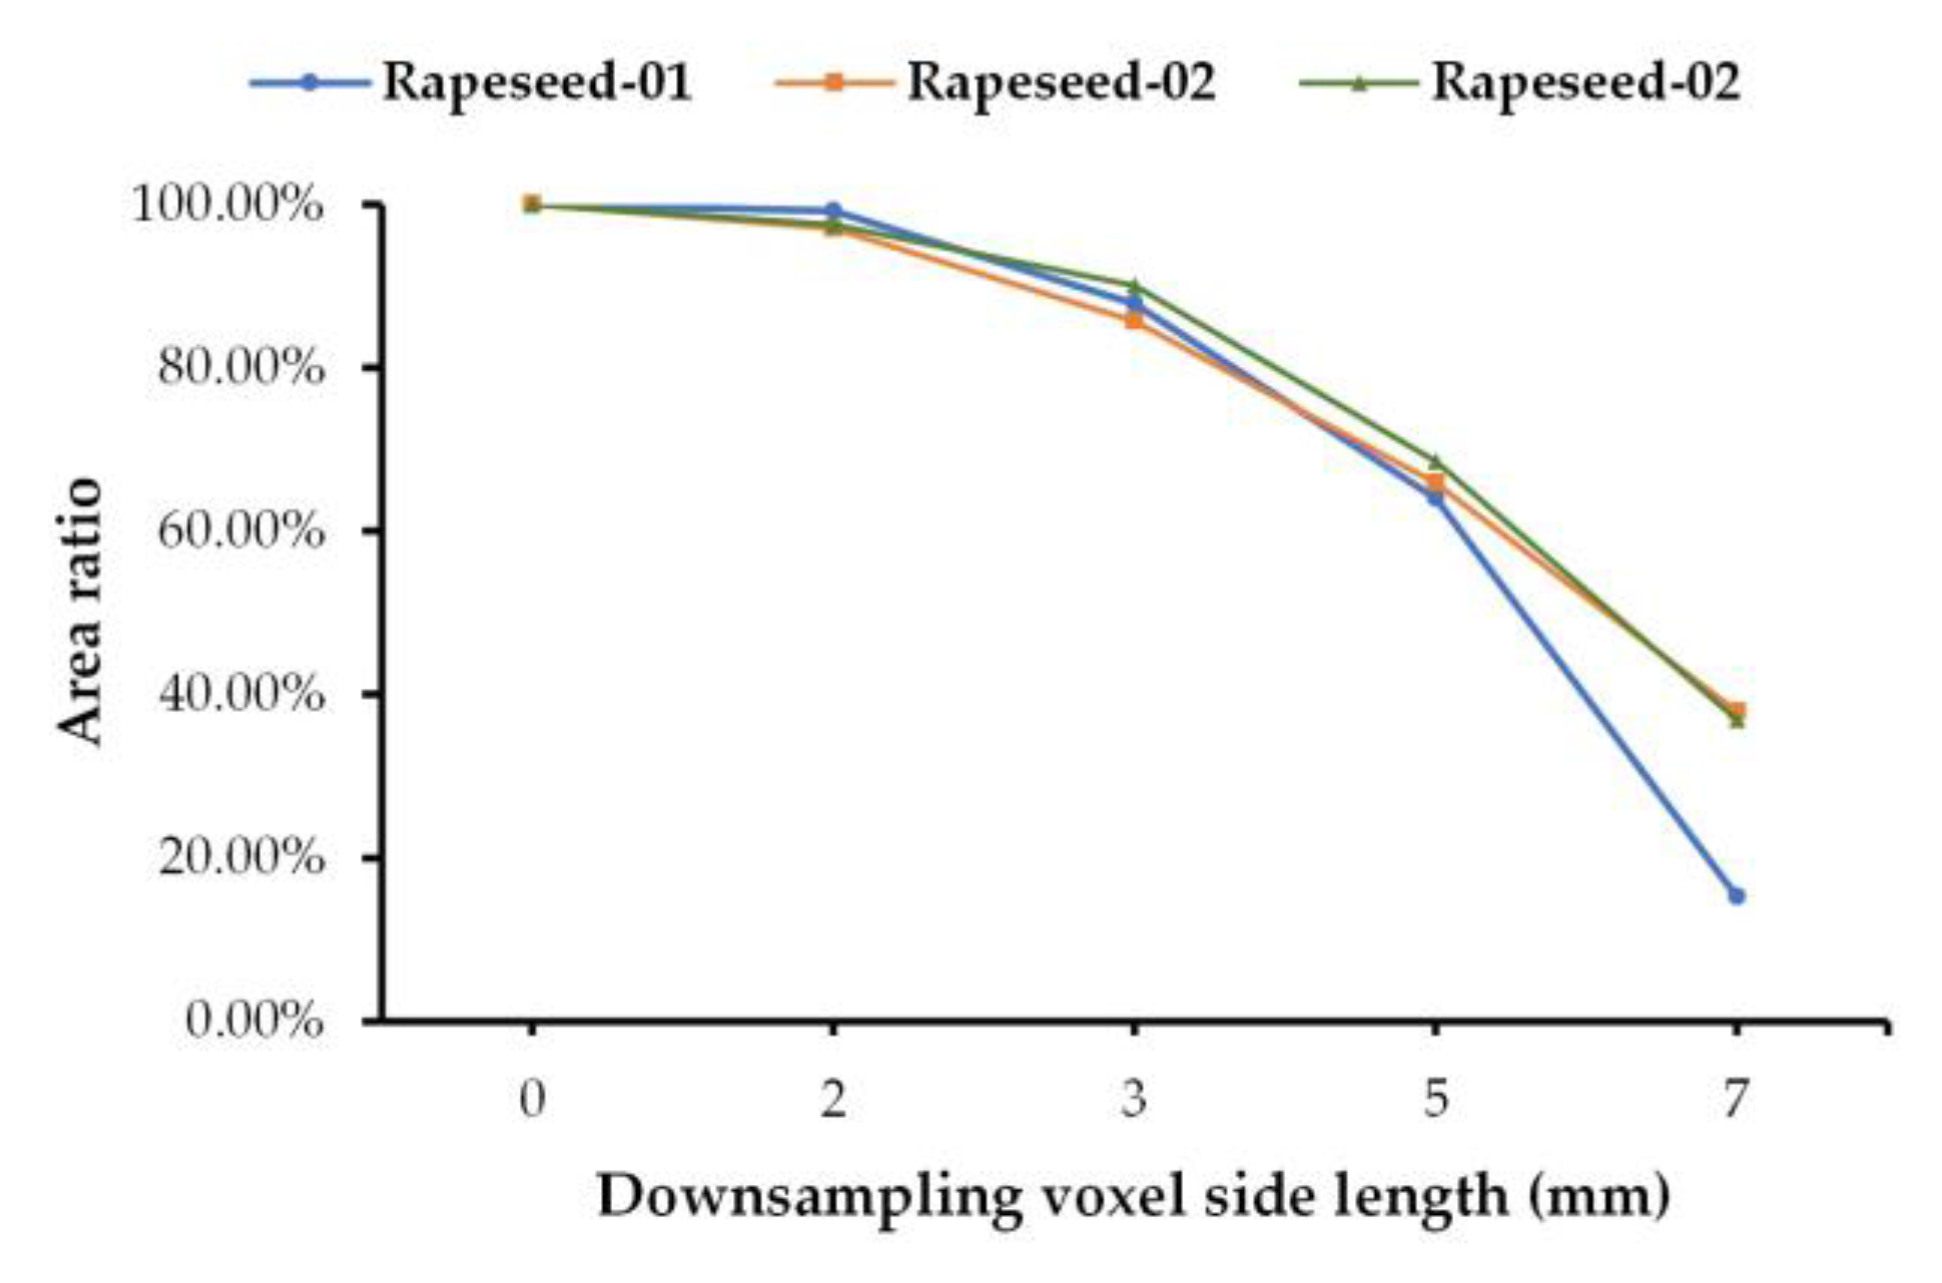
It is more intuitively revealed in Figure 12 that the point cloud down-sampling of the 2 mm voxel grid had little effect on the LA estimation. As the grid size continued to grow, the LA estimate decreased rapidly. In summary, in the field of crop point cloud research, appropriate reduction of point cloud density could greatly reduce model processing time while ensuring the output accuracy of LA-DT.

5. Discussion

Due to the limitation of measurement methods, the plant canopy analyzer LAI-2200C used in this study required users to go deep into the rapeseed field to complete data collection, which might cause irreversible damage to the field surface during the collection process. Compared with other conventional measurement methods, LAI-2200C had obvious advantages in terms of response speed, flexibility, accuracy, ease of use and so on. In this study, this device could accurately measure the total area of rapeseed leaves in the study area, so as to compare and verify the output accuracy of the LA-DT model proposed in this paper. In order to ensure the authenticity of the point cloud acquisition, in terms of the order of instrument use, we first acquired the target point cloud data nondestructively through TLS, and then used the LAI-2200C to collect the rapeseed canopy information in the target area.
Rapeseed is one of the most important economic crops in the world. However, many studies ignore the possibility of combining advanced computer 3D technology with the rapeseed production process. 3D reconstruction of a field of rapeseed based on a 3D point cloud has important significance for rapeseed phenotyping [54,55]. In the pre-processing step of point cloud generation for the rapeseed field, the hybrid filter we propose has a reasonable structure. This hybrid filter can completely separate the soil point cloud and the rapeseed point cloud, and performs well in the preprocessing of the rapeseed canopy point cloud. This ensures that the subsequent surface reconstruction processing can obtain realistic visualization results and accurate LA values. This successful practice also provides a reference for future field crop point cloud segmentation experiments, that is, for formulating a dedicated hybrid filter for the appearance features or morphological structures of the target crops.
In Section 4.2, we argue that the small loss of 3D reconstruction accuracy is worthwhile in exchange for shorter model runtime. In fact, the voxel side length of 0.002m was not the optimal down-sampling threshold for this model, and a more accurate threshold requires more quantitative analysis to be determined.
The only research object of this study was rapeseed at the seedling stage growing in the field. The point cloud data collection method and algorithm parameters in this paper were adapted to the morphological structure and characteristics of rapeseed. For example, the TLS stacking method was designed for rapeseed at seedling stage with high planting density and low height, the hybrid filter was used to extract point cloud of rapeseed in farmland and the LA-DT model was used to construct rapeseed leaves at seedling stage. In the promotion stage of agricultural robots, in order to extend this rapeseed point cloud collection and processing mode to other crop species, it is necessary to formulate corresponding strategies for each crop. In the future integrated system, the user could select the working mode to match the target crop. In addition, the user could select the desired crop phenotype parameters in the interactive interface, and, finally, obtain the effective crop phenotype information output in real time on the terminal.
It is worth mentioning that, although limited by the configuration of the model running equipment, we still used the medium-scale rapeseed fields as the research object in this study, rather than single crop plants. The reasoning was that we believe that intelligent agricultural robots will be more widely used in large-scale farmland scenes in the future. In addition, the integration of simultaneous localization and mapping (SLAM) technology on the agricultural robot platform is a major trend in the development of smart agriculture in the future. Imagine that the agricultural robot could travel to every accessible corner in the farmland environment without obstacles. The complex farmland environment is sensed by a laser scanner, and the phenotypic information of all surrounding crops can be obtained autonomously, and the crop growth status can be quickly fed back to the user. In follow-up research, we will develop a series of studies and implement them.

6. Conclusions

In order to separate the rapeseed point cloud from the original rapeseed field, so as to realize the intelligent detection and rapid response of rapeseed field growth dynamics, a point cloud hybrid filter was designed in this paper. This study firstly used the green enhancement algorithm, combined with the elevation filtering method, to preliminarily extract the rapeseed point cloud data from the target field rapeseed point cloud data. Then, the Gaussian filtering algorithm and the statistical filtering algorithm were used to filter outlier points and noise point clouds in the rapeseed. Finally, the rapeseed point cloud was down-sampled by the voxel filtering algorithm, thereby speeding up the operation efficiency of the subsequent LA calculation model.
In this paper, an innovative LA estimation model, named LA-DT, is proposed, based on the above field rapeseed point cloud. The LA-DT can realize 3D surface reconstruction of rapeseed point clouds based on DT, thereby outputting the 3D surface model of rapeseed and the total amount of LA in the target area. The experimental results showed that the LA-DT estimation errors of the three groups of field rapeseed point clouds, Rapeseed-01, Rapeseed-02 and Rapeseed-03, were all less than 3%. This study further verified the accuracy of the model through individual rapeseed experiments. A linear regression analysis was performed between the LA output values of LAI-2200C and LA-DT from 100 individual rapeseeds, resulting in an R 2 of 0.93. In addition, the outputs of the LAI-2200C and LA-DT of the above two groups of experiments both passed the paired sample t-test. Among them, the parameter values of the correlation test demonstrated that there was a significant correlation between LAI-2200C’s and LA-DT’s LA measurements at an extremely high confidence level. In summary, the LA-DT proposed in this study could accurately estimate the total LA of rapeseed in the target field, and the estimated value was similar to the plant canopy analyzer LAI-2200C.
Finally, this paper explored the effect of point cloud density on the accuracy of computational models. The research results showed that appropriately reducing the point cloud density could not only speed up the running rate of the model, but also ensured the running accuracy of the model. This research idea provides a guarantee for the transplantation of this model to agricultural robots.

Author Contributions

Conceptualization, C.L., F.H. and R.Z.; Methodology, F.H.; software, F.H. and J.P.; Resources, C.L. and R.Z.; Data curation, F.H. and J.W.; Writing—original draft, F.H.; Writing—review & editing, C.L. and R.Z.; Supervision, C.L. and R.Z.; Validation, J.W. and J.P.; Funding Acquisition, C.L. All authors have read and agreed to the published version of the manuscript.

Funding

This research was supported by the National Natural Science Foundation of China (41301522), Natural Science Foundation of Hubei Province (2014CFB940), and Fundamental Research Funds for the Central Universities (Program No. 2662018JC054).

Institutional Review Board Statement

Not applicable.

Informed Consent Statement

Not applicable.

Data Availability Statement

The main PCL/C++ code in this paper are available online at https://github.com/1117ismore/RapeseedPointCloud.git (accessed on 14 August 2022). The data are available online at http://doi.org/10.57760/sciencedb.02204 (accessed on 14 August 2022). As we are still conducting more research on the dataset, we will upload our dataset to the same link later.

Conflicts of Interest

The authors declare no conflict of interest.

References

  1. Liu, S.; Raman, H.; Xiang, Y.; Zhao, C.; Huang, J.; Zhang, Y. De Novo Design of Future Rapeseed Crops: Challenges and Opportunities. Crop. J. 2022, 10, 587–596. [Google Scholar] [CrossRef]
  2. Zheng, M.; Terzaghi, W.; Wang, H.; Hua, W. Integrated Strategies for Increasing Rapeseed Yield. Trends Plant. Sci. 2022, 27, 742–745. [Google Scholar] [CrossRef] [PubMed]
  3. Yuan, H.; Liu, Y.; Song, M.; Zhu, Y.; Cao, W.; Jiang, X.; Ni, J. Design of the Mechanical Structure of a Field-Based Crop Phenotyping Platform and Tests of the Platform. Agronomy 2022, 12, 2162. [Google Scholar] [CrossRef]
  4. Kim, W.-S.; Lee, D.-H.; Kim, Y.-J.; Kim, T.; Lee, W.-S.; Choi, C.-H. Stereo-Vision-Based Crop Height Estimation for Agricultural Robots. Comput. Electron. Agric. 2021, 181, 105937. [Google Scholar] [CrossRef]
  5. Jin, S.; Sun, X.; Wu, F.; Su, Y.; Li, Y.; Song, S.; Xu, K.; Ma, Q.; Baret, F.; Jiang, D.; et al. Lidar Sheds New Light on Plant Phenomics for Plant Breeding and Management: Recent Advances and Future Prospects. ISPRS J. Photogramm. Remote Sens. 2021, 171, 202–223. [Google Scholar] [CrossRef]
  6. Oberti, R.; Marchi, M.; Tirelli, P.; Calcante, A.; Iriti, M.; Tona, E.; Hočevar, M.; Baur, J.; Pfaff, J.; Schütz, C.; et al. Selective Spraying of Grapevines for Disease Control Using a Modular Agricultural Robot. Biosyst. Eng. 2016, 146, 203–215. [Google Scholar] [CrossRef]
  7. Su, D.; Kong, H.; Qiao, Y.; Sukkarieh, S. Data Augmentation for Deep Learning Based Semantic Segmentation and Crop-Weed Classification in Agricultural Robotics. Comput. Electron. Agric. 2021, 190, 106418. [Google Scholar] [CrossRef]
  8. Weiss, U.; Biber, P. Plant Detection and Mapping for Agricultural Robots Using a 3D LIDAR Sensor. Rob. Auton. Syst. 2011, 59, 265–273. [Google Scholar] [CrossRef]
  9. Wei, X.; Jia, K.; Lan, J.; Li, Y.; Zeng, Y.; Wang, C. Automatic Method of Fruit Object Extraction under Complex Agricultural Background for Vision System of Fruit Picking Robot. Optik 2014, 125, 5684–5689. [Google Scholar] [CrossRef]
  10. Indirabai, I.; Nair, M.V.H.; Jaishanker, R.N.; Nidamanuri, R.R. Terrestrial Laser Scanner Based 3D Reconstruction of Trees and Retrieval of Leaf Area Index in a Forest Environment. Ecol. Inform. 2019, 53, 100986. [Google Scholar] [CrossRef]
  11. Indirabai, I.; Nair, M.V.H.; Nair, J.R.; Nidamanuri, R.R. Direct Estimation of Leaf Area Index of Tropical Forests Using LiDAR Point Cloud. Remote Sens. Appl. Soc. Environ. 2020, 18, 100295. [Google Scholar] [CrossRef]
  12. Sultan Mahmud, M.; Zahid, A.; He, L.; Choi, D.; Krawczyk, G.; Zhu, H.; Heinemann, P. Development of a LiDAR-Guided Section-Based Tree Canopy Density Measurement System for Precision Spray Applications. Comput. Electron. Agric. 2021, 182, 106053. [Google Scholar] [CrossRef]
  13. Hashimoto, N.; Saito, Y.; Yamamoto, S.; Ishibashi, T.; Ito, R.; Maki, M.; Homma, K. Feasibility of Yield Estimation Based on Leaf Area Dynamics Measurements in Rice Paddy Fields of Farmers. F. Crop. Res. 2022, 286, 108609. [Google Scholar] [CrossRef]
  14. Li, H.; Liu, Z.; Chen, Y.; Zhang, X.; Chen, D.; Chen, Y. A Positive Correlation between Seed Cotton Yield and High-Efficiency Leaf Area Index in Directly Seeded Short-Season Cotton after Wheat. F. Crop. Res. 2022, 285, 108594. [Google Scholar] [CrossRef]
  15. Horák, M.; Balík, J.; Bieniasz, M. Effect of Leaf Area Size on the Main Composition in Grape Must of Three Varieties of Vitis Vinifera, L. in an Organic Vineyard. Sustainability 2021, 13, 13298. [Google Scholar] [CrossRef]
  16. Hu, T.; Wei, D.; Su, Y.; Wang, X.; Zhang, J.; Sun, X.; Liu, Y.; Guo, Q. Quantifying the Shape of Urban Street Trees and Evaluating Its Influence on Their Aesthetic Functions Based Mobile Lidar Data. ISPRS J. Photogramm. Remote Sens. 2022, 184, 203–214. [Google Scholar] [CrossRef]
  17. Shen, Z.; Liang, H.; Lin, L.; Wang, Z.; Huang, W.; Yu, J. Fast Ground Segmentation for 3D LiDAR Point Cloud Based on Jump-Convolution-Process. Remote Sens. 2021, 13, 3239. [Google Scholar] [CrossRef]
  18. Geng, X.; Ji, S.; Lu, M.; Zhao, L. Multi-Scale Attentive Aggregation for LiDAR Point Cloud Segmentation. Remote Sens. 2021, 13, 691. [Google Scholar] [CrossRef]
  19. Zhang, C.; Zhang, K.; Ge, L.; Zou, K.; Wang, S.; Zhang, J.; Li, W. A Method for Organs Classification and Fruit Counting on Pomegranate Trees Based on Multi-Features Fusion and Support Vector Machine by 3D Point Cloud. Sci. Hortic. 2021, 278, 109791. [Google Scholar] [CrossRef]
  20. Yun, T.; Jiang, K.; Li, G.; Eichhorn, M.P.; Fan, J.; Liu, F.; Chen, B.; An, F.; Cao, L. Individual Tree Crown Segmentation from Airborne LiDAR Data Using a Novel Gaussian Filter and Energy Function Minimization-Based Approach. Remote Sens. Environ. 2021, 256, 112307. [Google Scholar] [CrossRef]
  21. Carr, J.C.; Slyder, J.B. Individual Tree Segmentation from a Leaf-off Photogrammetric Point Cloud. Int. J. Remote Sens. 2018, 39, 5195–5210. [Google Scholar] [CrossRef]
  22. Dersch, S.; Heurich, M.; Krueger, N.; Krzystek, P. Combining Graph-Cut Clustering with Object-Based Stem Detection for Tree Segmentation in Highly Dense Airborne Lidar Point Clouds. ISPRS J. Photogramm. Remote Sens. 2021, 172, 207–222. [Google Scholar] [CrossRef]
  23. Zhang, Q. Hybrid Filtering. In Stochastic Theory and Control; Springer: Berlin/Heidelberg, Germany, 2002; pp. 549–564. [Google Scholar]
  24. Kushwaha, S.; Kumar Singh, R. A New Hybrid Filtering Technique for Minimization of Over-Filtering Issues in Ultrasound Images. Biomed. Res. 2018, 29, 2908–2918. [Google Scholar] [CrossRef] [Green Version]
  25. Cantú, V.H.; Azzaro-Pantel, C.; Ponsich, A. Multi-Objective Evolutionary Algorithm Based on Decomposition (MOEA/D) for Optimal Design of Hydrogen Supply Chains. Comput. Aided Chem. Eng. 2020, 48, 883–888. [Google Scholar]
  26. Li, L.; Yang, M.; Wang, C.; Wang, B. Hybrid Filtering Framework Based Robust Localization for Industrial Vehicles. IEEE Trans. Ind. Inform. 2018, 14, 941–950. [Google Scholar] [CrossRef]
  27. Liu, S.; Chan, K.C.; Wang, C.C.L. Iterative Consolidation of Unorganized Point Clouds. IEEE Comput. Graph. Appl. 2012, 32, 70–83. [Google Scholar] [CrossRef] [PubMed]
  28. Zaman, F.; Wong, Y.P.; Ng, B.Y. Density-Based Denoising of Point Cloud. Lect. Notes Electr. Eng. 2017, 398, 287–295. [Google Scholar]
  29. Han, X.-F.; Jin, J.S.; Wang, M.-J.; Jiang, W.; Gao, L.; Xiao, L. A Review of Algorithms for Filtering the 3D Point Cloud. Signal Process. Image Commun. 2017, 57, 103–112. [Google Scholar] [CrossRef]
  30. Kuhn, A.; Mayer, H. Incremental Division of Very Large Point Clouds for Scalable 3D Surface Reconstruction. In Proceedings of the 2015 IEEE International Conference on Computer Vision Workshop (ICCVW), Santiago, Chile, 7–13 December 2015; pp. 157–165. [Google Scholar]
  31. Guo, B.; Wang, J.; Jiang, X.; Li, C.; Su, B.; Cui, Z.; Sun, Y.; Yang, C. A 3D Surface Reconstruction Method for Large-Scale Point Cloud Data. Math. Probl. Eng. 2020, 2020, 8670151. [Google Scholar] [CrossRef]
  32. Chen, M.-B.; Chuang, T.-R.; Wu, J.-J. Efficient Parallel Implementations of near Delaunay Triangulation with High Performance Fortran. Concurr. Comput. Pract. Exp. 2004, 16, 1143–1159. [Google Scholar] [CrossRef]
  33. Lo, S.H. 3D Delaunay Triangulation of 1 Billion Points on a PC. Finite Elem. Anal. Des. 2015, 102–103, 65–73. [Google Scholar] [CrossRef] [Green Version]
  34. Wu, H.; Guan, X.; Gong, J. ParaStream: A Parallel Streaming Delaunay Triangulation Algorithm for LiDAR Points on Multicore Architectures. Comput. Geosci. 2011, 37, 1355–1363. [Google Scholar] [CrossRef]
  35. Kohout, J.; Kolingerová, I.; Žára, J. Parallel Delaunay Triangulation in E2 and E3 for Computers with Shared Memory. Parallel Comput. 2005, 31, 491–522. [Google Scholar] [CrossRef]
  36. Nave, D.; Chrisochoides, N.; Chew, L.P. Guaranteed-Quality Parallel Delaunay Refinement for Restricted Polyhedral Domains. Comput. Geom. 2004, 28, 191–215. [Google Scholar] [CrossRef]
  37. Huo, Y.; Wang, T.; Li, H.; Zhang, Y.; Li, X.; Liu, B.; Wang, G. Delaunay Mesh Construction and Simplification with Feature Preserving Based on Minimal Volume Destruction. Appl. Sci. 2022, 12, 1831. [Google Scholar] [CrossRef]
  38. Li, Q.; Nevalainen, P.; Peña Queralta, J.; Heikkonen, J.; Westerlund, T. Localization in Unstructured Environments: Towards Autonomous Robots in Forests with Delaunay Triangulation. Remote Sens. 2020, 12, 1870. [Google Scholar] [CrossRef]
  39. Jiang, S.; Jiang, W.; Li, L.; Wang, L.; Huang, W. Reliable and Efficient UAV Image Matching via Geometric Constraints Structured by Delaunay Triangulation. Remote Sens. 2020, 12, 3390. [Google Scholar] [CrossRef]
  40. Ryu, Y.; Nilson, T.; Kobayashi, H.; Sonnentag, O.; Law, B.E.; Baldocchi, D.D. On the Correct Estimation of Effective Leaf Area Index: Does It Reveal Information on Clumping Effects? Agric. For. Meteorol. 2010, 150, 463–472. [Google Scholar] [CrossRef]
  41. Nilson, T.; Kuusk, A. Improved Algorithm for Estimating Canopy Indices from Gap Fraction Data in Forest Canopies. Agric. For. Meteorol. 2004, 124, 157–169. [Google Scholar] [CrossRef]
  42. Rusu, R.B.; Cousins, S. 3D Is Here: Point Cloud Library (PCL). In Proceedings of the 2011 IEEE International Conference on Robotics and Automation, Shanghai, China, 9–13 May 2011; pp. 1–4. [Google Scholar]
  43. Wu, G.; Li, B.; Zhu, Q.; Huang, M.; Guo, Y. Using Color and 3D Geometry Features to Segment Fruit Point Cloud and Improve Fruit Recognition Accuracy. Comput. Electron. Agric. 2020, 174, 105475. [Google Scholar] [CrossRef]
  44. Dorj, U.O.; Lee, M.; Yun, S.-S. An Yield Estimation in Citrus Orchards via Fruit Detection and Counting Using Image Processing. Comput. Electron. Agric. 2017, 140, 103–112. [Google Scholar] [CrossRef]
  45. Leach, R. Surface Topography Characterisation. In Fundamental Principles of Engineering Nanometrology; Elsevier: Amsterdam, The Netherlands, 2014; pp. 241–294. ISBN 9781455777532. [Google Scholar]
  46. Patiño, H.; Zapico, P.; Rico, J.C.; Fernández, P.; Valiño, G. A Gaussian Filtering Method to Reduce Directionality on High-Density Point Clouds Digitized by a Conoscopic Holography Sensor. Precis. Eng. 2018, 54, 91–98. [Google Scholar] [CrossRef]
  47. Schall, O.; Belyaev, A.; Seidel, H.-P. Robust Filtering of Noisy Scattered Point Data. In Proceedings of the Eurographics/IEEE VGTC Symposium Point-Based Graphics, Stony Brook, NY, USA, 21–22 June 2005; pp. 71–144. [Google Scholar]
  48. Jenke, P.; Wand, M.; Bokeloh, M.; Schilling, A.; Straßer, W. Bayesian Point Cloud Reconstruction. Comput. Graph. Forum 2006, 25, 379–388. [Google Scholar] [CrossRef]
  49. Särkkä, S. Bayesian Filtering and Smoothing; Cambridge University Press: Cambridge, UK, 2013; ISBN 9781107030657. [Google Scholar]
  50. Wang, W.; Su, T.; Liu, H.; Li, X.; Jia, Z.; Zhou, L.; Song, Z.; Ding, M. Surface Reconstruction from Unoriented Point Clouds by a New Triangle Selection Strategy. Comput. Graph. 2019, 84, 144–159. [Google Scholar] [CrossRef]
  51. Lancaster, P.; Salkauskas, K. Surfaces Generated by Moving Least Squares Methods. Math. Comput. 1981, 37, 141. [Google Scholar] [CrossRef]
  52. Alexa, M.; Behr, J.; Cohen-Or, D.; Fleishman, S.; Levin, D.; Silva, C.T. Point Set Surfaces. In Proceedings of the Proceedings of the IEEE Visualization Conference; San Diego, CA, USA, 21–26 October 2001, pp. 21–28.
  53. Thayyil, S.B.; Yadav, S.K.; Polthier, K.; Muthuganapathy, R. Local Delaunay-Based High Fidelity Surface Reconstruction from 3D Point Sets. Comput. Aided Geom. Des. 2021, 86, 101973. [Google Scholar] [CrossRef]
  54. Zhu, R.; Sun, K.; Yan, Z.; Yan, X.; Yu, J.; Shi, J.; Hu, Z.; Jiang, H.; Xin, D.; Zhang, Z.; et al. Analysing the Phenotype Development of Soybean Plants Using Low-Cost 3D Reconstruction. Sci. Rep. 2020, 10, 7055. [Google Scholar] [CrossRef]
  55. Zhu, F.; Thapa, S.; Gao, T.; Ge, Y.; Walia, H.; Yu, H. 3D Reconstruction of Plant Leaves for High-Throughput Phenotyping. In Proceedings of the Proceedings—2018 IEEE International Conference on Big Data, Big Data 2018, Seattle, WA, USA, 10–13 December 2019; pp. 4285–4293. [Google Scholar]
Figure 1. Field overview of rapeseed under three scenarios. (a) Preview of the 3D point cloud acquisition scene of Rapeseed-01 in the field; (b) Rapeseed-02; (c) Rapeseed-03.
Agronomy 12 02409 g001
Figure 2. Point cloud acquisition method for Rapeseed-01 in the field. (a) Right view; (b) Vertical view; (c) Isoaxometric left view.
Agronomy 12 02409 g002
Figure 3. Hybrid filter for Rapeseed point cloud extraction.
Agronomy 12 02409 g003
Figure 4. Schematic of voxel filtering algorithm.
Agronomy 12 02409 g004
Figure 5. Schematic diagram of voxel retention points.
Agronomy 12 02409 g005
Figure 6. Schematic diagram of 3D reconstruction of point cloud Delaunay of single rapeseed in experimental data.
Agronomy 12 02409 g006
Figure 7. Statistical bar graph of total LA estimates for LAI-2200C and LA-DT.
Agronomy 12 02409 g007
Figure 8. Linear regression analysis of LA-DT and LAI-2200C.
Agronomy 12 02409 g008
Figure 9. (a) P-P plot of pairwise differences between the output values of LA-DT and LAI-2200C; (b) Normal distribution of pairwise differences.
Agronomy 12 02409 g009
Figure 10. The eight-leaf rapeseed point cloud is processed by the hybrid filter and used as the input of the LA-DT model. Figures (a1,b1,c1) are the rapeseed point cloud with noise, the point cloud without noise, and the output point cloud of the hybrid filter with voxel filter module; the figures (a2,b2,c2) are the DTs calculated by LA-DT according to the input point cloud; the figures (a3,b3,c3) are the 3D reconstruction meshes output by LA-DT.
Agronomy 12 02409 g010aAgronomy 12 02409 g010b
Figure 11. 3D surface model output in LA-DT of field rapeseed point cloud at different densities. To the right of the legend in the subfigure is a histogram of the mesh surface point cloud density. (ac) The LA-DT outputs of Rapeseed-01, Rapeseed-02 and Rapeseed-03, respectively; (1) The LA-DT output of the initial rapeseed point cloud without point cloud thinning, (2)–(5) The LA-DT output of rapeseed point clouds filtered with voxels of 2 mm, 3 mm, 5 mm and 7 mm edge lengths, respectively.
Agronomy 12 02409 g011
Figure 12. Line chart of the relationship between voxel grid size and LA ratio.
Agronomy 12 02409 g012
Table 1. Field point cloud property sheet.
Rapeseed-01Rapeseed-02Rapeseed-03
Field area (m2)181818
Number of rapeseed plants189194190
Planting density (plant/m2)10.5010.7810.56
Scan date3 November 202113 November 20211 December 2021
LiDAR scans numbers778
Number of Points131888361691043114299328
Data size576 MB749 MB622 MB
Table 2. Paired samples t-test of LA of LAI-2200C and LA-DT for 3 groups of field rapeseeds.
N Correlation P Paired Difference
MeanStd. DeviationStd. Error Mean
Pair: LAI-2200C & LA-DT30.99<0.010.140.060.04
Table 3. Paired samples t-test of LA of LAI-2200C and LA-DT for 100 individual rapeseeds.
N Correlation p Paired Differencetdfp (2-Tailed)
MeanStd. DeviationStd. Error Mean
Pair: LAI-2200C & LA-DT1000.97<0.010.431.040.10−4.1799<0.01
Table 4. Output parameters of field rapeseed point cloud in LA-DT under different densities.
Rapeseed-01Rapeseed-02Rapeseed-03
Voxel Side Length (mm)PointsTime (s)Area (m2)Area ratioPointsTime (s)Area (m2)Area ratioPointsTime(s)Area (m2)Area Ratio
03,097,5314726.48100.00%1,911,8452915.75100.00%6,372,74497217.98100.00%
21,465,5201676.4399.23%1,064,2731225.5897.04%3,441,35039317.5397.50%
3828,484955.6987.81%619,393714.9385.74%2,000,02122816.2090.10%
5336,320384.1564.04%259,456303.7965.91%842,4249612.3368.58%
7179,157200.9915.28%141,698162.1837.91%458,141536.6436.93%
Table 5. LA value paired sample t-test: unfiltered point cloud versus filtered point cloud with voxel side lengths of 2 mm, 3 mm, 5 mm and 7 mm, respectively.
Voxel Side Length (mm)NCorrelationpPaired Difference
MeanStd. DeviationStd. Error Mean
Pair: 0 & 230.99<0.010.220.210.12
Pair: 0 & 330.99<0.011.130.560.33
Pair: 0 & 530.99<0.053.312.031.17
Pair: 0 & 730.97<0.056.804.042.34
Publisher’s Note: MDPI stays neutral with regard to jurisdictional claims in published maps and institutional affiliations.