Article

Life-Cycle Energy, Economic, and Greenhouse Gas Emissions of Diversified Sweet-Potato-Based Cropping Systems in South China

1
Key Laboratory of Crop Genetic Improvement of Guangdong Province, Crops Research Institute, Guangdong Academy of Agricultural Sciences, Guangzhou 510640, China
2
Rice Program, Pakistan Agricultural Research Council, Kala Shah Kaku, Lahore 39020, Pakistan
3
Solid Wastes and Chemicals Management Center, Ministry of Ecology and Environment, Beijing 100029, China
*
Author to whom correspondence should be addressed.
Agronomy 2022, 12(10), 2340; https://doi.org/10.3390/agronomy12102340
Submission received: 11 August 2022 / Revised: 13 September 2022 / Accepted: 20 September 2022 / Published: 28 September 2022

Abstract

:
Sweet potato (Ipomoea batatas L.) is a promising food and industrial crop that plays an important role in China’s agricultural poverty relief strategy. Selecting an appropriate cropping system for sweet-potato production could simultaneously achieve energy, economic, and environmental benefits. Therefore, the comprehensive assessment of diversified sweet-potato-based cropping systems (i.e., sweet potato monoculture (SP), continuous sweet potato cropping (SPSP), sweet potato–rice (SPRI), sweet potato–maize (SPMA), and sweet potato–potato (SPPO)) in South China was conducted with a field survey and life-cycle assessment. The data were collected quantitatively using a questionnaire for face-to-face interviewing of 70 farmers. The results indicated that the annual crop yield (sweet potato equivalent yield) of five cropping systems was in increasing order as SPPO > SPSP > SPMA > SPRI > SP. The SPMA system exhibited the highest net energy (499.09 GJ/ha) and energy rate (7.77). The SPSP system performed better in energy efficiency (0.90 kg/MJ), net return (140,284 CNY/ha), benefit to cost rate (3.20), and eco-efficiency (45 CNY/kg CO2-eq). The annual greenhouse-gas (GHG) emissions of five cropping systems ranked from lowest to highest as follows: SP < SPRI < SPSP < SPMA < SPPO. With comprehensive consideration, extended rotation systems (e.g., SPMA, SPRI, and SPSP) are proposed because they could effectively reduce GHG emissions while maintaining or even increasing the system’s productivity (ensuring food safety) in South China.

1. Introduction

Given both the ongoing expansion of the world population and climate change, it is increasingly imperative to develop efficient cropping systems coupled with highly productive genotypes to promote sustainable agricultural production [1,2,3]. Many countries have implemented diverse cropping system strategies to increase crops productivity while mitigating greenhouse-gas (GHG) emissions from agriculture fields. Diversified crop systems (e.g., short- and long-term rotation) can promote the nutrient cycling efficiency, the maintenance of long-term productivity of the land, the control of diseases and pests, and consequently the improvement of agricultural sustainability [4,5,6].
China, as one of the highest multiple cropping indices in the world, has nearly 57% of the arable land with multiple cropping systems [7,8]. Meanwhile, China is the leading producer of sweet potato (Ipomoea batatas L.) with an annual production of 52 million tones (57% of the world’s production) in 2019 [9]. Sweet potato can be rotated with staple crops such as rice (Oryza sativa L.), maize (Zea mays L.), and wheat (Triticum aestivum L.). The development of such a diversified rotation system would not only ensure food security but also improve soil quality [10]. Moreover, sweet potato can be considered as an alternative industrial crop as well as health food due to its rich carbohydrates and antioxidant compounds. Considering the current diversified sweet-potato-based cropping systems, it is of great significant to comprehensively assess the widely followed cropping systems in sweet-potato production. Selecting the optimal sweet-potato-based cropping systems with maximum food production and minimum energy requirements and environment impacts would help to enhance the role of sweet potato to implement the multiple cropping strategy in China.
Recently, several studies have focused on the evaluation of agricultural systems with energy, economic, and environmental analysis [11,12,13]. Energy is a vital input during crop production, and energy efficiency is an important factor for the sustainable assessment of an agricultural system [14,15]. Economic analysis, assessing the cost and income of a studied system, is a vital index that cannot be neglected to promote the sustainable agricultural production [16,17]. Additionally, agricultural activities are an important source of GHG emissions and exceed 24% of the total global GHG emissions [18]. Hence, the optimization of agricultural systems has been identified as an attractive mitigation strategy [19,20,21]. To date, extensive studies have been done to assess the energy, economic, or environmental performance of single crop cultivation systems e.g., rice [13], maize [22], wheat [23], potato (Solanum tuberosum L.) [24], sweet sorghum (Sorghum bicolor L.) [25], Jerusalem artichoke (Helianthus tuberosus L.) [16], and sweet potato [26]. Previous studies have also compared and analyzed different cropping systems from the perspectives of energy, economy, and environment. For instance, Soni et al. [27] evaluated the energy performance of two rice-based cropping systems in the middle Indo-Gangetic plains of India. Yang et al. [28] found that diversified cropping systems, including grain, forage, and bioenergy crops, can effectively reduce the carbon footprint in the North China plain based on a life-cycle assessment (LCA) estimation. Li et al. [29] reported the economic, energy, and environmental consequences of shifting from maize-wheat to forage rotation in the North China Plain. However, few studies have addressed the energy, economic, and environmental performance of diversified sweet-potato-based cropping systems. The rationalization of sweet-potato-based cropping systems should be done by evaluating the indicators of green and circular economies, such as high-energy efficiency and economic productivity, as well as low GHG emissions.
Guangdong, a province in South China, was selected as a case study to evaluate the life-cycle energy, economic, and environmental impacts of diversified sweet-potato-based cropping systems. First, Guangdong is a representative province of intensive sweet-potato production, with an annual production of 3.5 million tons [30]. Secondly, Guangdong is endowed with special climate conditions involving abundant solar radiation and water resources, which create extremely favorable conditions for multi-cropping. Therefore, the specific objectives of this study were (i) to assess and compare the energy efficiency, economic productivity, and GHG emissions of the existing sweet-potato-based cropping systems in Guangdong from a life-cycle perspective and (ii) to identify an appropriate cropping system with high productivity, energy saving, and GHG emission reduction. The findings of this study will be valuable for the sustainable development of sweet potato in South China and other sweet-potato production areas of the planet.

2. Materials and Methods

2.1. Survey Sites and Data Collection

Three main sweet potato-producing regions in Guangdong were selected as survey sites, i.e., Western Guangdong, Eastern Guangdong, and the Pearl River Delta. Farms were selected randomly from the villages in the study area. Soil properties and climate conditions of the sweet-potato production areas are presented in Table 1.
Face-to-face interviews using a questionnaire were conducted with local farmers to achieve input-output data. To ensure the quality and reliability of survey data, we firstly invited the leader of each village and introduced the significance of this study for agricultural sustainable development. Secondly, the leaders organized the farmers to fill out the questionnaires. Thirdly, the collected and uncertainty data were carefully verified by experts and experience. Ultimately, 70 validated questionnaires were collected, including 45, 18, and 7 from the Western Guangdong, Eastern Guangdong, and the Pearl River Delta, respectively (Figure 1). Five locally established sweet-potato-based cropping systems were included, as follows: (1) sweet potato mono cropping (SP); (2) sweet potato continuous cropping (SPSP); (3) sweet potato and rice rotation (SPRI); (4) sweet potato and maize rotation (SPMA); and (5) sweet potato and potato rotation (SPPO). The crop-planting sequence for the five cropping systems is shown in Figure 2. The system boundary diagrams of cropping systems included land preparation, planting, field management, and harvesting. The input and output data of five cropping systems are shown in Table 2. The functional unit was defined as per hectare of cultivated land.

2.2. Yield Calculation

To compare the yield performance of the studied cropping systems, the grain yield of rice and maize and the tuber yield of potato was converted to sweet potato equivalent yield (SPEY, kg/ha) according to the method of Liu et al. [31]. The yield of each crop straw was calculated by multiplying the tuber or grain yield by the corresponding field residue index reported by Fang et al. [32].
SPEY   = P non sweet   potato ÷ P sweet   potato × Y non sweet   potato
where Pnon-sweet potato is the price of non-sweet potato crops, Psweet potato is the price of sweet potato, and Ynon-sweet potato is the yield of non-sweet potato crops.

2.3. Life-Cycle Energy Performance

Energy inputs of each cropping system included labor, machinery, diesel, fertilizers, pesticides, irrigation water, plastic film, and seeds. Energy outputs consisted of crops yield (main product) and aboveground straw biomass (by-product). Because the inputs and outputs of energy were measured in different units, the data were converted into a common energy unit through appropriate coefficients of energy equivalence (Table S1). Life-cycle energy performance was assessed based on the parameters of net energy, energy rate, and energy efficiency. They were calculated using Equations (2)–(6).
Energy   input   = i = 1 n ( Q i × Eq i )
Energy   output   = j = 1 n ( Q j × Eq j )
Net   energy   = Energy   output Energy   input
Energy   rate   = Energy   output ÷ Energy   input
Energy   efficiency   = SPEY ÷ Energy   input
where Qi/j is the quantity of input i/output j, and Eqi/Eqj is the energy equivalent of input i/output j.

2.4. Life-Cycle Economic Performance

A life-cycle economic analysis was performed based on cost, benefit, net return, benefit to cost ratio, and economic productivity. These factors were calculated using Equations (7)–(11).
Economic   input   = i = 1 n C i
Economic   output   = SPEY × P sweet   potato
Net   return   = Economic   output Economic   input
Benefit   to   cos t   ratio   = Economic   output ÷ Economic   input
Economic   efficiency   = SPEY ÷ Economic   input
where Ci is the cost of input i (CNY/ha).

2.5. Life-Cycle GHG Emissions

Life-cycle GHG emissions considered both direct emissions and indirect emissions. Direct emissions included emissions from the applied fertilizer in the field and were estimated from the usage amount and the corresponding pollutants emitted. The most important GHG in terms of fertilizer application was N2O, which was estimated as 1.25% of applied nitrogen by weight [33]. Indirect GHG emissions included emissions associated with the production of energy (e.g., diesel refinery), and the production of machinery, fertilizers, pesticides, plastic film, and seed. To avoid regional errors, we choose the domestic database of China, the Chinese Core life cycle Database 0.8 (CLCD, Integrated Knowledge for our Environment, Chengdu, China), to calculate indirect emissions of energy and material production [34]. The database represents the general technologies in the Chinese market. The life-cycle environmental impacts were implemented using eBalance software v.4.7 (Integrated Knowledge for our Environment, Chengdu, China). The eBalance was developed in China and was fully functional LCA software that incorporated both Chinese and global quality databases. It has become a preferred choice for the LCA of products manufactured in China and has been used by researchers in recent years [35,36].

2.6. Eco-Efficiency

The eco-efficiency (economic and environmental trade-offs) indicator is defined as the ratio between an economic creation and an ecological destruction. Eco-efficiency expresses how efficient an economic activity is, with respect to its impact upon nature. The eco-efficiency is expressed in Equation (12).
Eco fficiency   = Net   return ÷ Total   GHG   emissions

2.7. Statistical Analysis

Statistical analysis was carried out using SPSS 26.0 analytical software (IBM, SPSS Inc., Chicago, IL, USA). The statistical significance of differences between mean values was determined using analysis of variance (ANOVA) followed by post hoc comparisons using least significant difference (LSD) test at 5% probability level. The data standardization method and principal component analysis (PCA) were used to evaluate the weight coefficient of studied energy, economic, and environmental parameters, and finally to calculate the comprehensive score of each cropping system.

3. Results

3.1. Input and Output

The agricultural input of the monoculture system (SP) was lower than that of the continuous cropping system (SPSP) and the rotation cropping systems (SPRI, SPMA, and SPPO). The input of the SPSP and SPPO systems was higher than that of SPRI, SPMA, and SP, such as labor, machinery, fertilizers, and seeds (Table 2). Sweet potato and potato cultivation were labor-intensive compared with rice and maize. As a result, the SPPO system had the highest labor input.
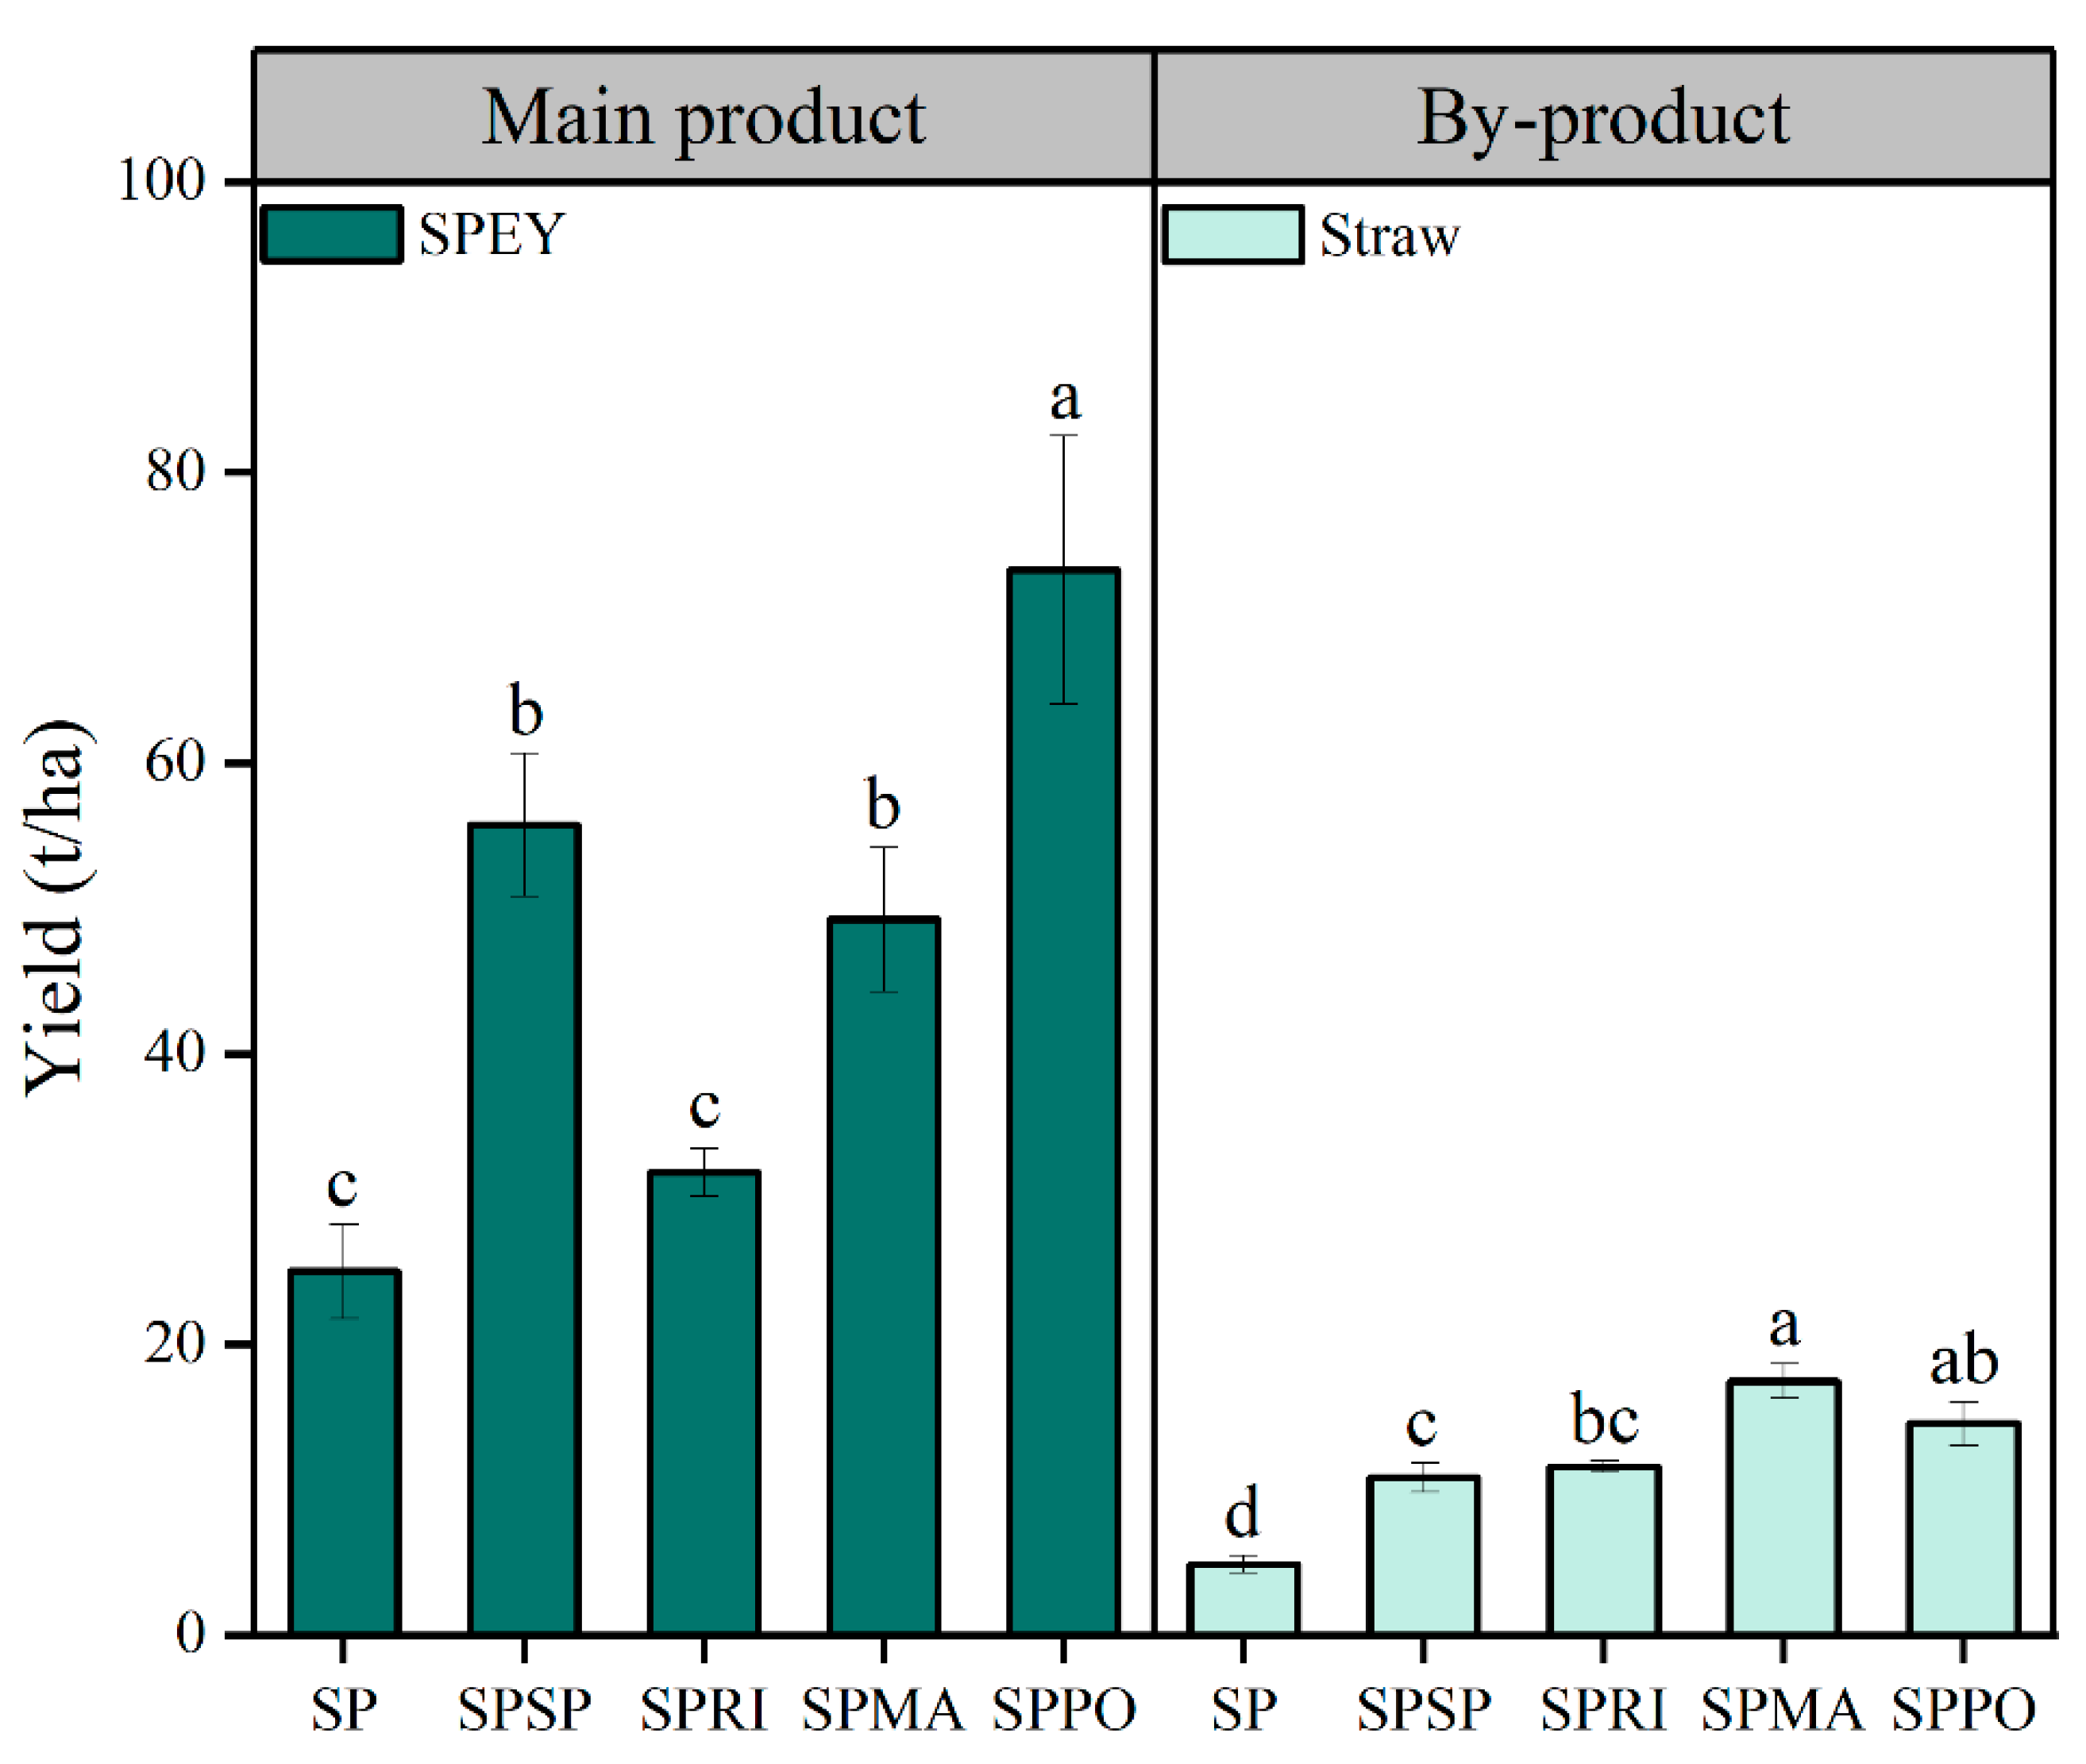
The SPPO cropping system had the highest SPEY (73.30 t/ha), which was 1.31, 1.49, 2.30, and 2.93 times higher than those of the SPSP, SPMA, SPRI, and SP cropping systems, respectively (Figure 3). The SPMA cropping system had the highest straw yield, with an annual value of 17.45 t/ha (Figure 3). Additionally, the sweet potato yield ranged from 25.02 to 35.00 t/ha (fresh basis) across five sweet-potato-based cropping systems, with an average value of 26.20 t/ha (Table 2). The sweet potato yield was significantly higher than the average yield of rice (6.65 t/ha) and maize (11.98 t/ha) but lower than that of potato (41.25 t/ha).

3.2. Energy Performance

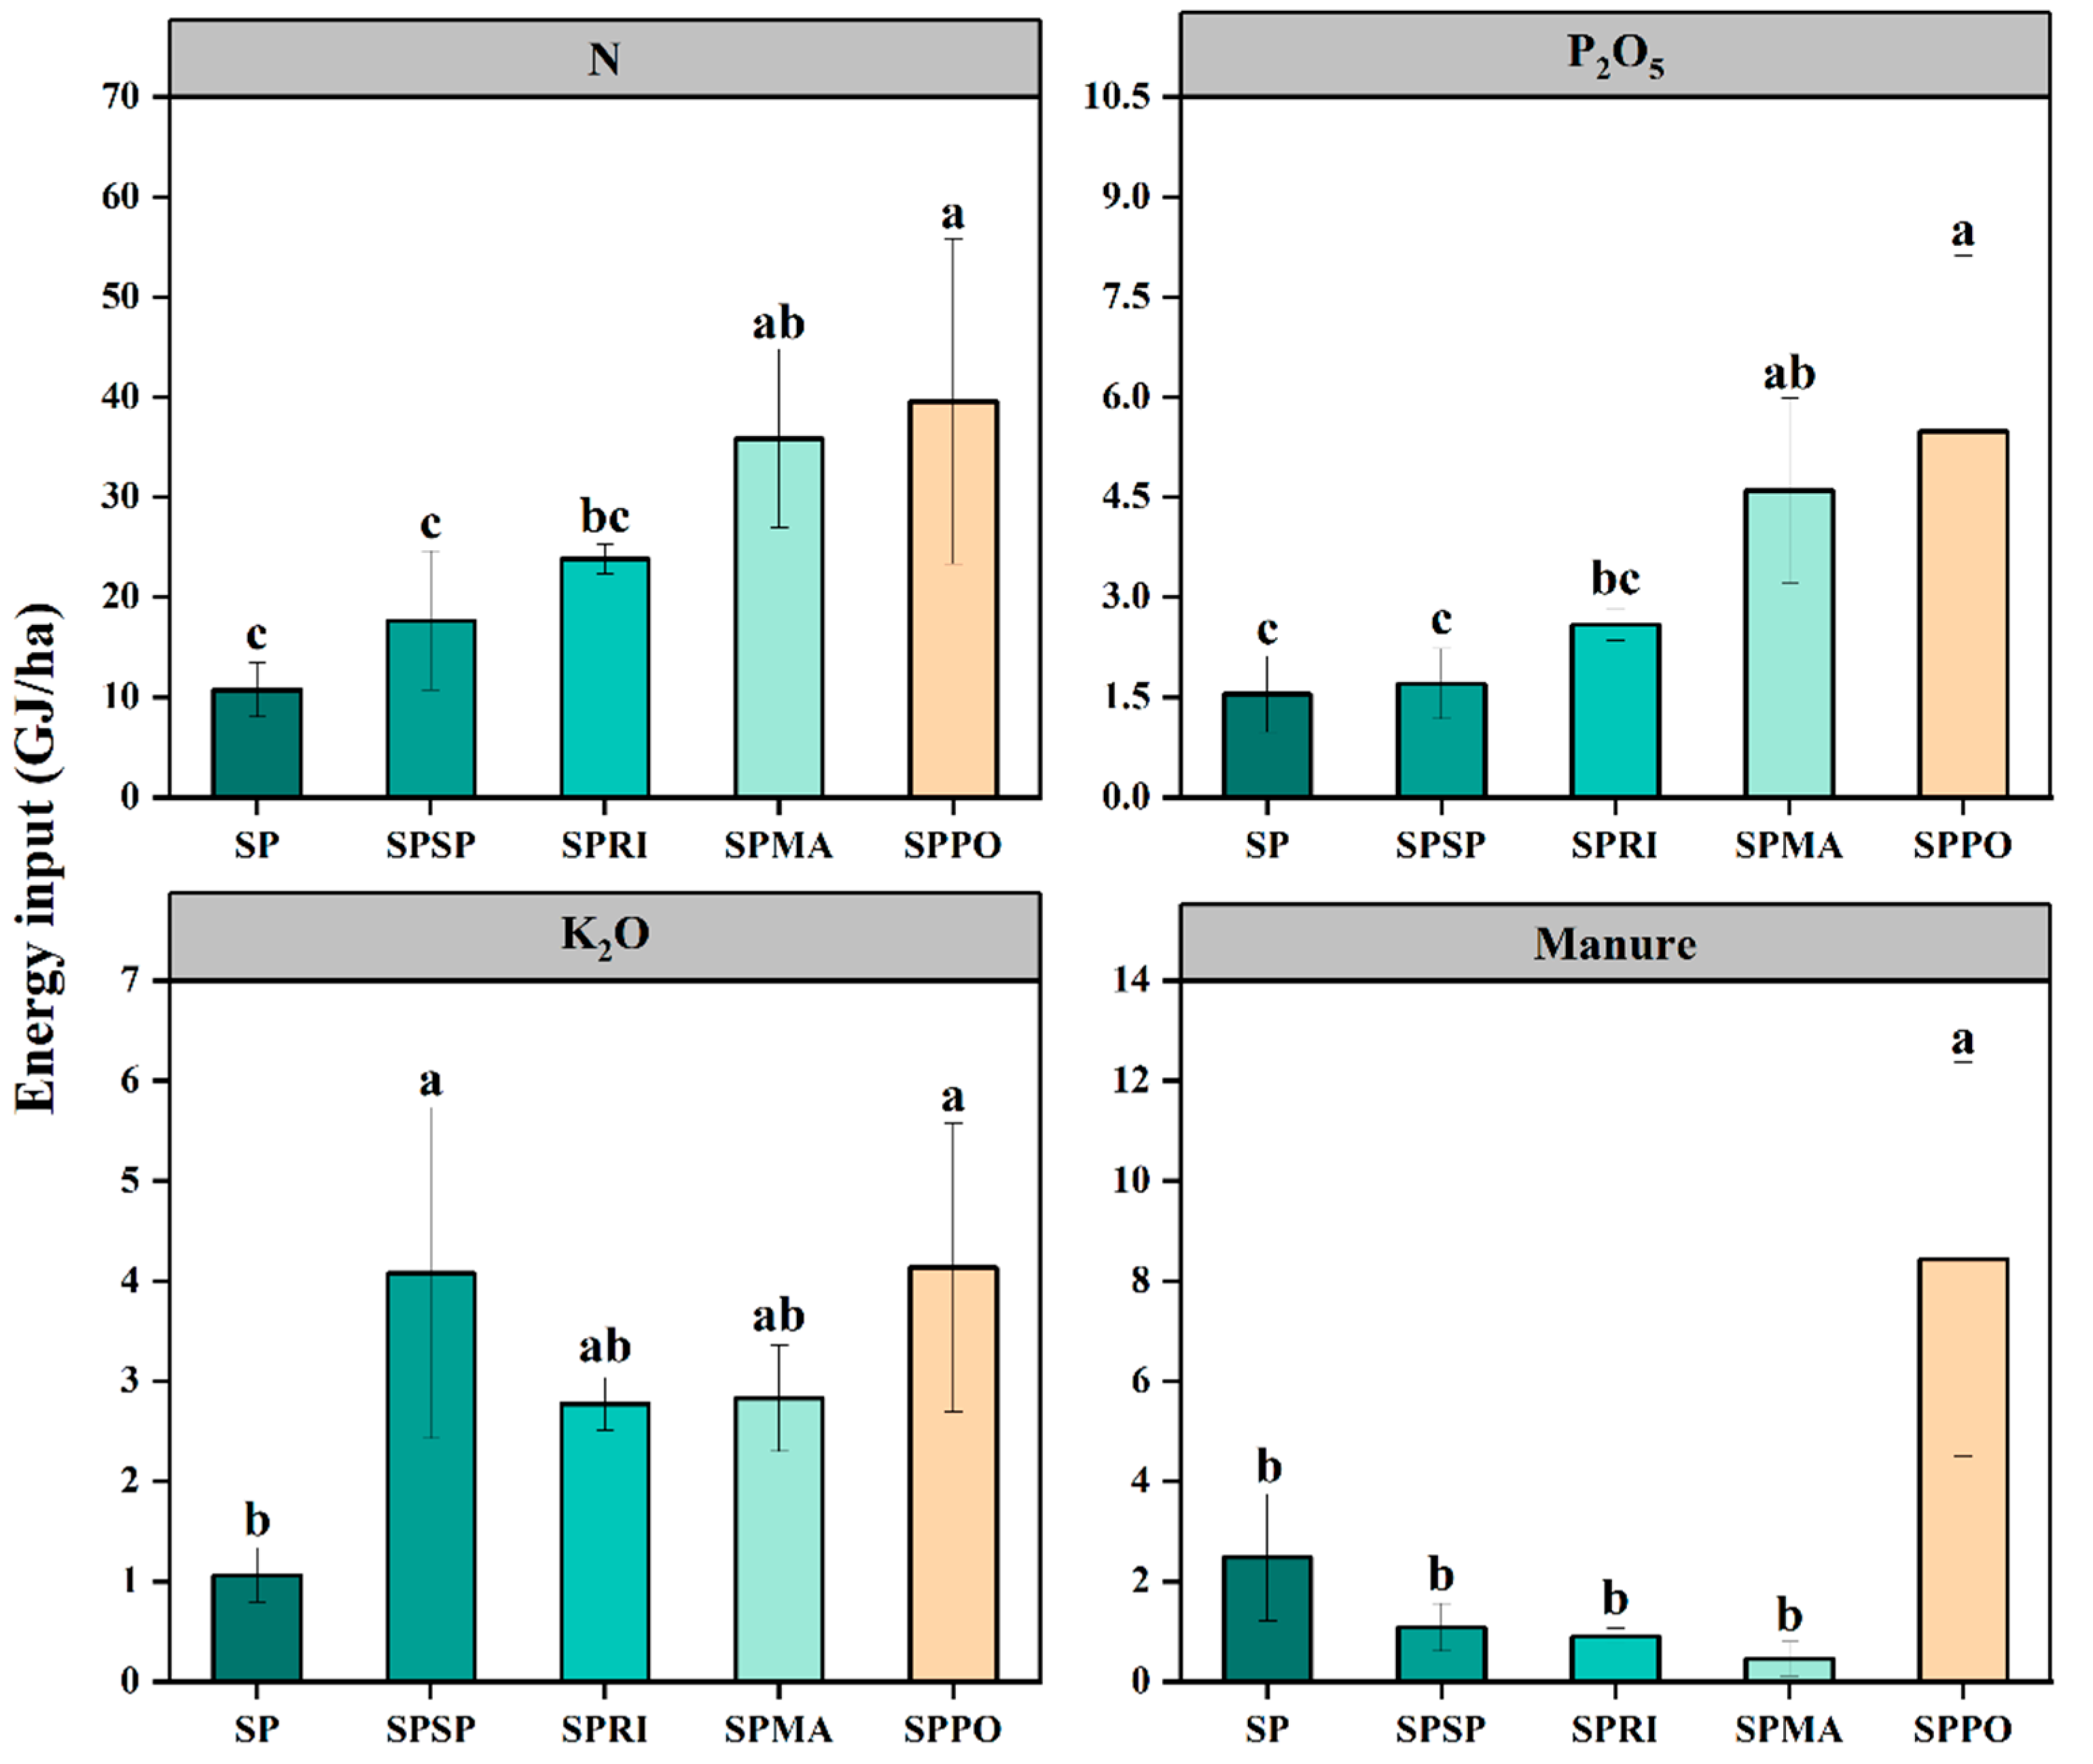
The total energy input of SP was 33.65 GJ/ha (Table 3), significantly (p < 0.05) lower than SPSP (61.95 GJ/ha), SPRI (51.81 GJ/ha), SPMA (73.70 GJ/ha), and SPPO (105.96 GJ/ha). The energy from fertilizers was the highest for all cropping systems, representing a range of 39.61–59.32% (Figure 4a). The percentage of nitrogen (N) across all cropping systems was the highest, about 74.30% on an average basis. The total energy input in the SPPO system was significantly higher than in the other four systems, mainly because of the higher inputs of fertilizers, i.e., N, phosphorus (P2O5); potassium (K2O); and farmyard manure (Figure 5). In addition, the energy input of labor, pesticides, and plastic film in the SPPO cropping system was higher than that in the other cropping systems (Table 3).
Energy output included the main product (grains and tubers) and by-product (straw) yields (Table 3). Compared with the single cropping system (SP), double-cropping systems (i.e., SPSP, SPRI, SPRI, and SPPO) showed higher energy output and net energy. The total energy output of the SPMA system (572.79 GJ/ha) was significantly higher (261.22%, 62.13%, 62.99%, and 20.52%) than that of the SP, SPSP, SPRI, and SPPO systems, respectively. Meanwhile, the SPMA system showed the highest net energy (499.09 GJ/ha) and energy rate (7.77). The SPSP system had the highest energy efficiency (0.90 kg/MJ), which suggests that this system is more productive than others in terms of the quantity of crops produced (SPEY) per unit of energy used.

3.3. Economic Analysis

The total cost for the SPPO production system was the highest (95,100 CNY/ha), followed by SPSP, SPMA, SPRI, and SP (Table 4). The percentage of labor cost (33.25% to 46.41%) was the highest across five cropping systems (Figure 4b), primarily because of the expensive labor force and labor-intensiveness in terms of planting, management, and harvesting practices during sweet potato and potato cultivation. The percentage of fertilizer costs was the second position (20.06% to 26.42%) across all the cropping systems. In addition, the inputs of pesticides, plastic film, and seeds in the SPPO system were higher than those of the SP, SPSP, SPRI, and SPMA systems.
The SPSP system was the most profitable, with high economic output (203,950 CNY/ha) and net return (140,284 CNY/ha) among all the five cropping systems (Table 4). The highest net return of the SPSP system was attributed to the higher yield and market price of sweet potato. Although the cropping system had no significant effect on the benefit to cost ratio and economic productivity, the SPSP and SPMA systems had the highest value of these two parameters, respectively.

3.4. GHG Emissions and Eco-Efficiency

The total GHG emission of the SPPO cropping system was 4,846 kg CO2-eq/ha, which was significantly (p < 0.05) higher than the SPMA, SPSP, SPRI, and SP cropping systems, respectively (Table 5). The SP had the lowest GHG emissions across all cropping systems. Fertilizers (including direct and indirect emissions) were the key contributor (47.492–75.28%) to GHG emissions in the five studied cropping systems (Figure 4c). Seeds were also an important contributor to GHG emissions in this study, accounting for 23.57% on average. The eco-efficiency was 45 CNY/kg CO2-eq in the SPSP system, which was 1.29, 2.05, 1.88, and 3.00 times higher than the values in the SP, SPRI, SPMA, and SPPO systems, respectively (Table 5).

3.5. Comprehensive Assessment

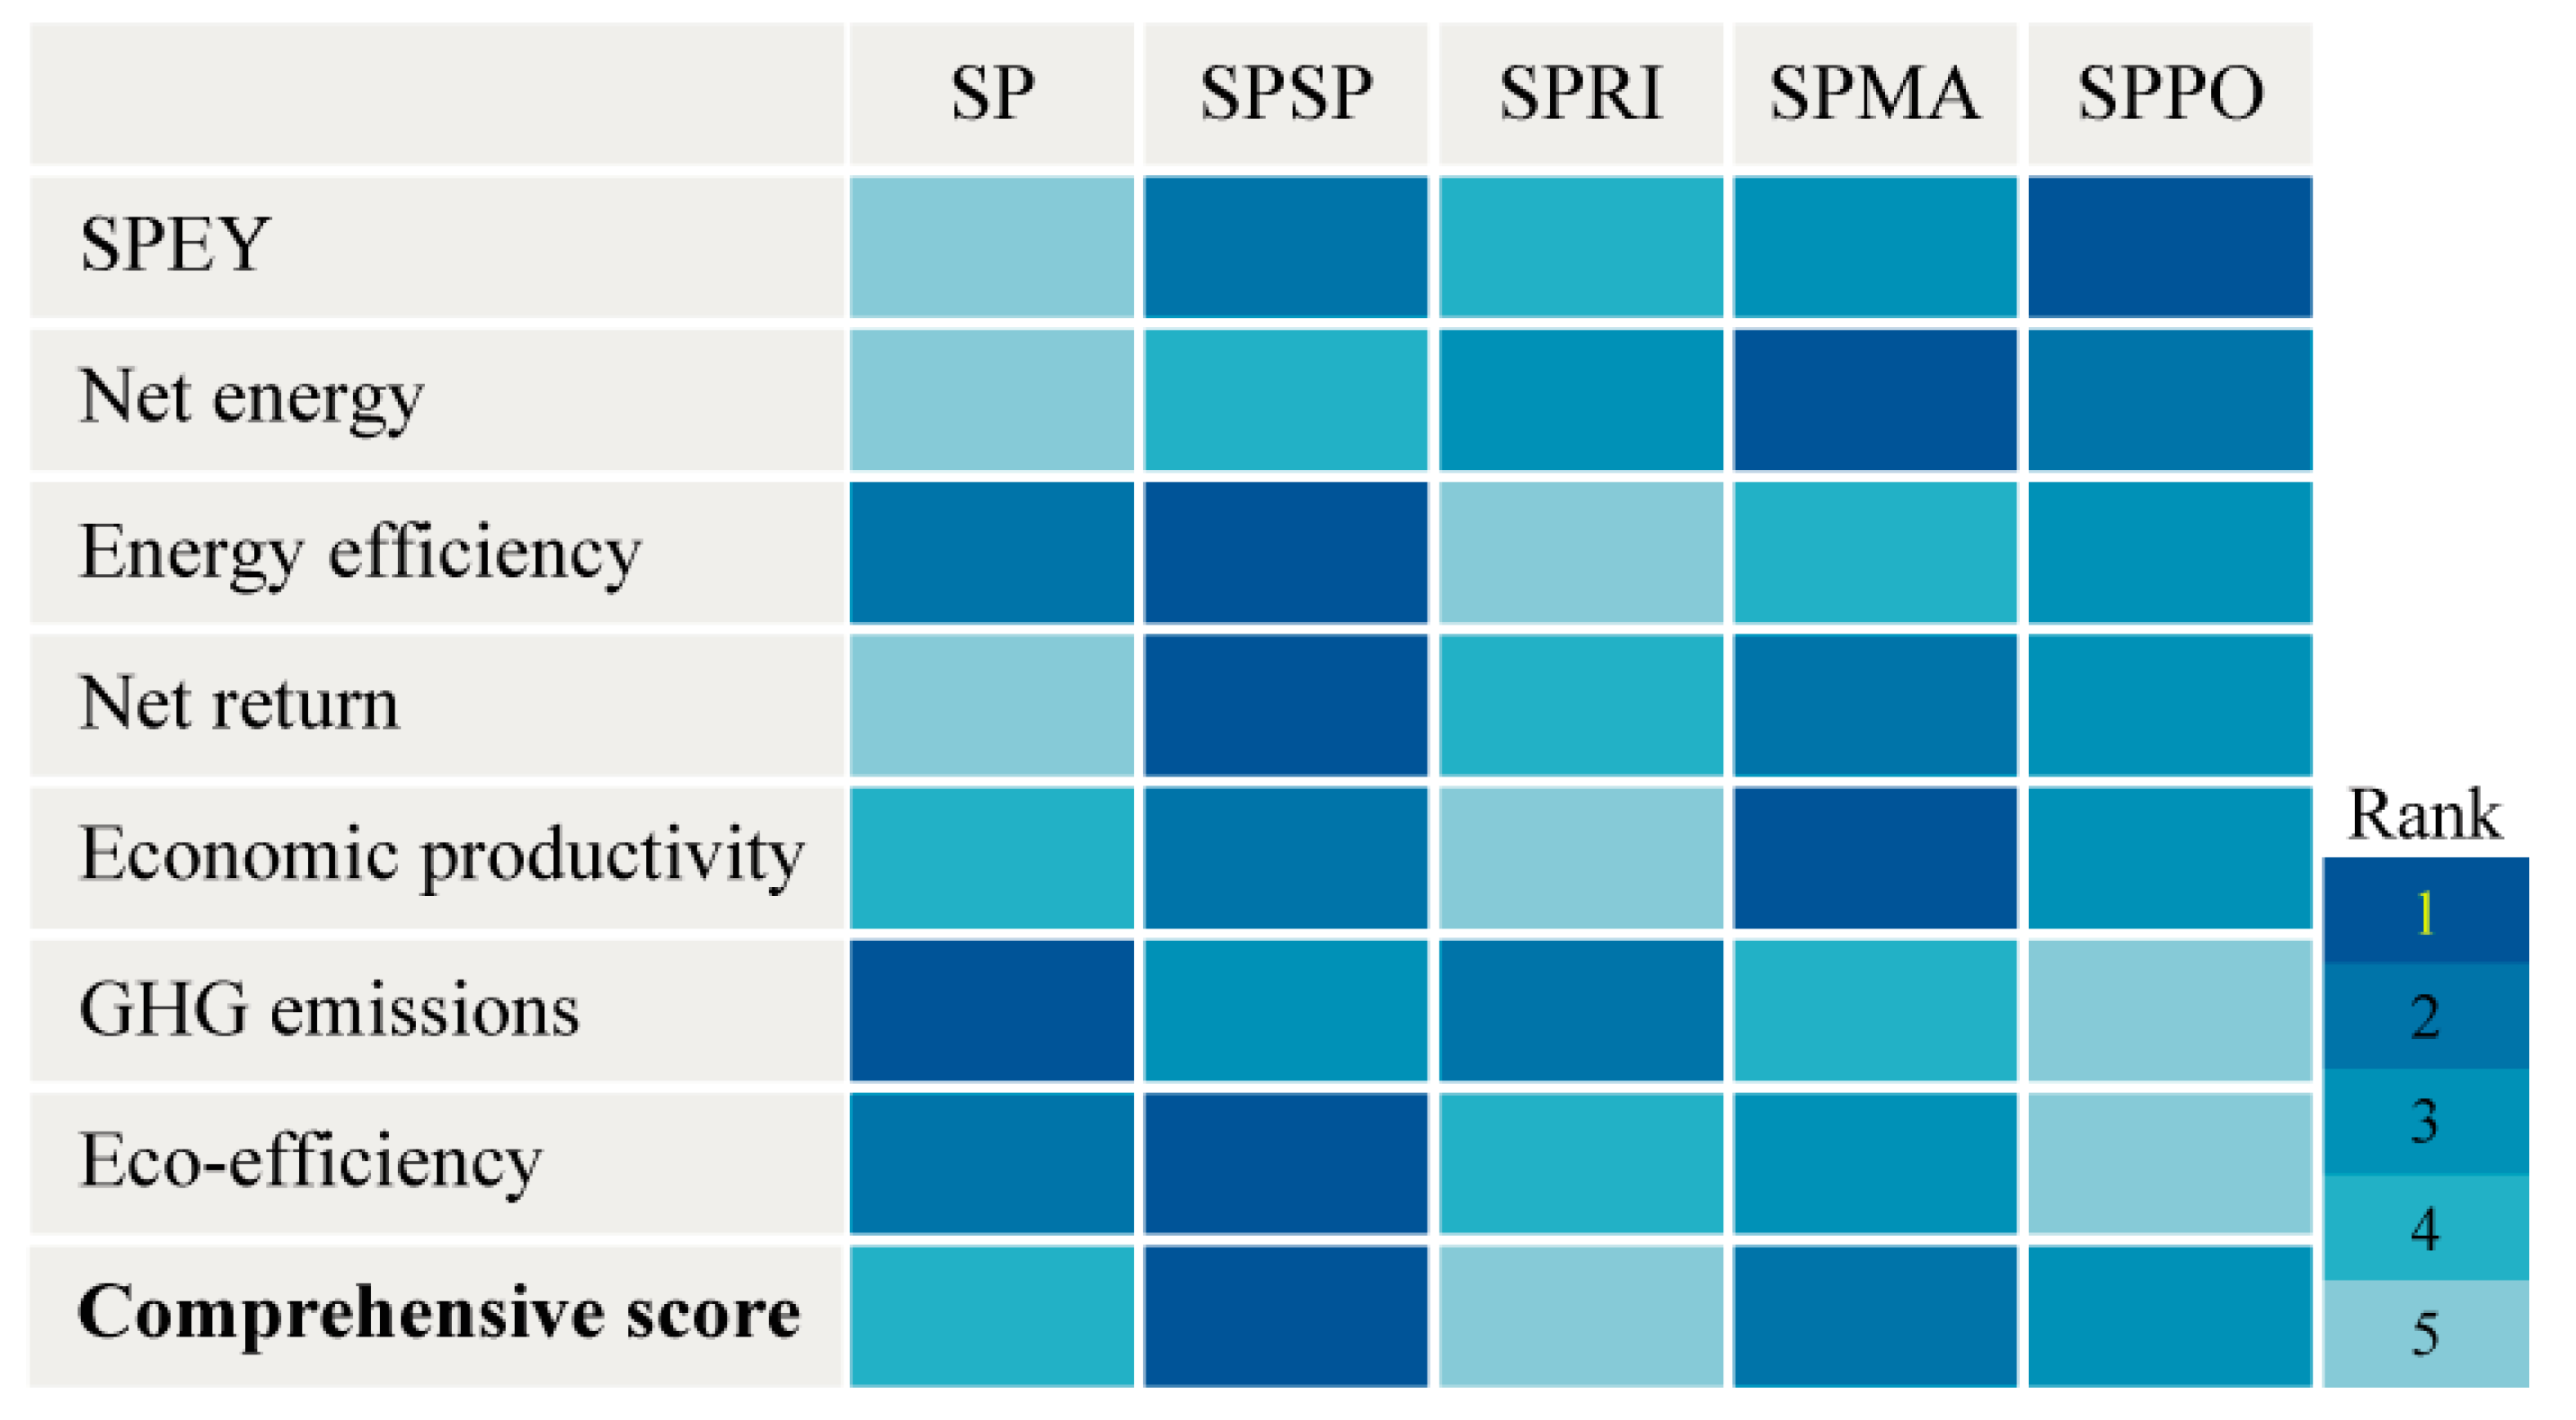
Seven factors, i.e., SPEY, net energy, energy efficiency, net return, economic productivity, GHG emissions, and eco-efficiency, were used to comprehensively evaluate the five cropping systems. The corresponding weight coefficients of seven factors were 10.66%, 4.72%, 20.78%, 21.38%, 11.19%, 10.71%, and 20.57%, respectively. Finally, each sweet-potato-based cropping system was evaluated comprehensively and fairly by assigning a unique score. As shown in Figure 6, the mean comprehensive score of the five cropping systems was ranked in the order of SPSP (0.473) > SPMA (0.328) > SPPO (0.316) > SP (0.307) > SPRI (0.261).

4. Discussion

4.1. Energy and Environmental Performance of Sweet-Potato-Based Cropping Systems

From the perspectives of energy and environment, the SPSP system was characterized by the highest energy efficiency and eco-efficiency in the present study. The SPMA system exhibited the highest value of net energy and energy rate, primarily due to maize as a C4 crop, which could use water and solar radiation efficiently to achieve high and stable grain yield remarkably [37]. We found that the monoculture system (i.e., SP) had lower GHG emissions and crop yield than double-cropping system, which was consistent with Gao et al. [38]. Overall, the input–output of energy and GHG emissions are driven by crop- and site-specific yield parameters, as well as by regional characteristics, such as soil properties, the socio-economic characteristics of the farm, and especially the cropping system [39,40].
Intensive agricultural production is generally considered a system with high agricultural inputs, especially the application of chemical fertilizers to obtain high crop yield [41,42]. Indeed, reasonable fertilization has positive effects on crop production, but excessive fertilization cannot be utilized by the plants, resulting in a low fertilizer efficiency and negative side effects regarding environmental pollution [1,43,44,45]. As this study shows, energy consumption and GHG emissions for fertilizer application (especially N) was the prime factor in all sweet-potato-based cropping systems. The findings align with previous studies concluding that energy inputs and GHG emissions in crop production were dominated by fertilizer consumption [15,24,40]. Soni et al. [27] also reported that fertilizer input accounted for the highest energy consumption in rice-based cropping systems. As chemical fertilizers are non-renewable energy-intensive resources, the supplementation of plant nutrients through renewable resources such as farmyard manure would increase the net energy yield [46]. Li et al. [17] suggested that substituting 50% of mineral-N with organic manure had a great potential for sustainable maize-wheat rotation production. In summary, advanced agricultural practices can achieve a win–win outcome in terms of simultaneously increasing crop yield and minimizing environmental impacts by optimizing the quantity of fertilizer [20,47,48]. Encouraging farmers to adopt science-based agronomic management practices is effective in reducing chemical fertilizer use (approximately 20%) without compromising crop yield [40,49,50]. Future efforts to reduce the environmental impact of sweet-potato-based cropping systems are needed, especially the development of crop genotypes with higher N use efficiency.

4.2. Economic Perspective of Sweet-Potato-Based Cropping Systems

From an economic point of view, the continuous cropping system of sweet potato (SPSP) was found to be more interesting for farmers because the net return was higher than the values of other systems. Moreover, the present study indicated that SPSP could be regarded as a potential economic and environmental trade-off cropping system. These results can be explained by the high fresh yield and price of sweet potato leading to high economic output, which is consistent with our previous study [26]. Similar results have been observed by Soni et al. [27], who indicated that the net income from the rice–potato system was higher than that from the rice–wheat system due to a higher yield and the better market price of the potato. In the present study, many farmers consider sweet potato as a better cash crop, and thus continuous cropping of the crop is the most profitable option. Therefore, in China or other developing countries, sweet potato can be regarded as an important cash crop for the government to implement a poverty relief strategy, whether it is cultivated as continuous cropping or rotated with existing staple crops.
Based on survey responses, labor wages constituted about one-third to a half of the total expenses across all cropping systems. This result was the same with Liu et al. [25] and Fang et al. [16], which indicated that the cost of the labor was the major economic input during crop cultivation. In particular, the cultivation of tuber crops (sweet potato and potato) requires more labor in planting, management, and harvesting practices than other field prevailing crops (i.e., rice and maize) [26]. As a strategy going forward, the combination of mechanization and newly designed rotation systems with low labor inputs will increase the gross profits in sweet-potato-based cropping systems [27,51]. In a word, a cost-saving farm cultivation system will be more attractive due to the increasing labor cost.

4.3. Candidate Cropping Systems for Sweet-Potato Production

The evaluation of diversified sweet-potato-based cropping systems is a multi-criteria decision-making process, which should consider many factors. Improving economic return while decreasing the energy consumption and GHG emissions from farmland are critical to promote sustainable production of agriculture (including sweet potato) [13,20,26]. This study concluded that the SPSP system should be appropriately encouraged through the comprehensive evaluation of diversified sweet-potato-based cropping systems. Nevertheless, a recent study shows that continuous cropping of sweet potato alters the fungal community structure of the rhizosphere in such a way that the content of the beneficial fungi decreases, while that of harmful fungi increases, thereby increasing soil-borne diseases and reducing the yield and quality of sweet potato [52]. As a result, no single cropping system can satisfy all kinds of requirements, and thus the candidate cropping system should be designed carefully considering the local climate conditions, soil type, cropping pattern, and management practices to maximize the agronomic and environmental benefits [53].
Nowadays, an increasing need for high-quality food with minimal environmental impacts has led to renewed interest in crop rotation [53]. Rotation could increase crop yield by 20% on average and improve the nutrient supply and water holding capacity of coarse soil when compared with continuous monoculture practices [53,54]. However, shorter rotations may increase disease risks, particularly those induced by soil- and straw-borne pathogens, as well as the decline yield of crops [55]. Extended rotations with crop diversity have a greater amount of mineralizable N, soil organic carbon, and aggregates than do continuous two-crop rotation systems. As Winter et al. [56] reported, a suitable combination of wheat, oilseed rape (Brassica campestris L.), and maize with adapted cropping methods can significantly mitigate the threat of stem-based diseases in wheat. Yang et al. [21] demonstrated that diversifying crop rotation systems, i.e., sweet potato → cotton (Gossypium spp.) → sweet potato → winter wheat–summer maize (4-year cycle) could significantly reduce carbon footprint and plays an important role in conserving energy, reducing GHG emissions, and developing cleaner agricultural production in the North China Plains. Furthermore, the addition of legumes to sweet-potato-based rotation systems can reduce mineral nitrogen fertilization requirements and the carbon footprint while maintaining net economic benefits and crop productivity [4,50,57]. Potentially, diversified long-term rotation involving sweet potato, maize, rice, and a legume crop could effectively reduce GHG emissions while maintaining or even increasing the systems’ productivity.

5. Conclusions

This study assessed and compared the energy consumption, economic benefits, and GHG emissions of five sweet-potato-based cropping systems in South China. In conclusion, double-cropping systems (i.e., SPSP, SPRI, SPMA, and SPPO) proved more conducive for ensuring food security because the crop yield under these systems is higher than that of monoculture (SP). For double-cropping systems, in detail, the continuous cultivation of sweet potato (SPSP) exhibited obvious advantages in energy efficiency, net return, and eco-efficiency. The SPMA system exhibited the highest net energy and energy rate, while the SPRI had a low level of GHG emissions, even though each double-cropping system has its advantages and there will be a balance when selecting the sweet-potato-based cropping system. However, in general, appropriately designed and extended rotations involving a greater number of crops (e.g., sweet potato, maize, and rice) can effectively reduce the GHG emissions while maintaining or even increasing the systems productivity.
The result of this study firstly provides the reference information for policy makers to optimize the diversified cropping systems for the sustainable development of agriculture in South China. Secondly, the sustainable development assessment framework of agricultural cropping systems in this study could be used in other crops or countries. Furthermore, non-GHG environmental considerations and the impact of farm size and region conditions on diversified cropping systems are important directions for future research.

Supplementary Materials

The following supporting information can be downloaded at https://www.mdpi.com/article/10.3390/agronomy12102340/s1, Table S1: Energy equivalent of inputs and outputs in crop production; Table S2: Greenhouse gas (GHG) emission coefficients of agricultural inputs; Supplementary references.

Author Contributions

Conceptualization and methodology, C.T. and Y.Y.; formal analysis, B.J. and X.M.; investigation, C.T. and Z.W.; writing—original draft preparation, C.T.; writing—review and editing, B.J. and A.A.; visualization, C.T.; supervision, Z.W. and Y.Y.; and funding acquisition, C.T., Z.W., and Y.Y. All authors have read and agreed to the published version of the manuscript.

Funding

This research was funded by the Guangdong Modern Agro-Industry Technology Research System (2019KJ111; 2020KJ111), the National Natural Science Foundation of China (42101291), and the earmarked fund for CARS-10-Sweetpotato.

Institutional Review Board Statement

Not applicable.

Informed Consent Statement

Not applicable.

Data Availability Statement

Data are presented in the article.

Acknowledgments

We gratefully acknowledge the innovation team members of the Guangdong Modern Agro-Industry Technology Research System for their time and collaboration in completing the survey.

Conflicts of Interest

The authors declare no conflict of interest.

References

  1. Antar, M.; Lyu, D.; Nazari, M.; Shah, A.; Zhou, X.; Smith, D.L. Biomass for a sustainable bioeconomy: An overview of world biomass production and utilization. Renew. Sustain. Energy Rev. 2021, 139, 110691. [Google Scholar] [CrossRef]
  2. Deng, J.; Ni, H.; Zhang, Z.; Usman, S.; Yang, X.; Shen, Y.; Li, Y. Designing productive, energy-efficient, and environmentally friendly production systems by replacing fallow period with annual forage cultivation on the Loess Plateau of China. J. Clean. Prod. 2021, 320, 128660. [Google Scholar] [CrossRef]
  3. Gan, Y.; Liang, C.; Chai, Q.; Lemke, R.L.; Campbell, C.A.; Zentner, R.P. Improving farming practices reduces the carbon footprint of spring wheat production. Nat. Commun. 2014, 5, 5012. [Google Scholar] [CrossRef]
  4. Yang, Y.; Reilly, E.C.; Jungers, J.M.; Chen, J.; Smith, T.M. Climate Benefits of Increasing Plant Diversity in Perennial Bioenergy Crops. One Earth 2019, 1, 434–445. [Google Scholar] [CrossRef]
  5. Zegada-Lizarazu, W.; Monti, A. Energy crops in rotation. A review. Biomass Bioenergy 2011, 35, 12–25. [Google Scholar] [CrossRef]
  6. Zhang, K.; Maltais-Landry, G.; Liao, H.-L. How soil biota regulate C cycling and soil C pools in diversified crop rotations. Soil Biol. Biochem. 2021, 156, 108219. [Google Scholar] [CrossRef]
  7. Gao, J.; Yang, X.; Zheng, B.; Liu, Z.; Zhao, J.; Sun, S.; Li, K.; Dong, C. Effects of climate change on the extension of the potential double cropping region and crop water requirements in Northern China. Agric. For. Meteorol. 2019, 268, 146–155. [Google Scholar] [CrossRef]
  8. Yang, X.; Chen, F.; Lin, X.; Liu, Z.; Zhang, H.; Zhao, J.; Li, K.; Ye, Q.; Li, Y.; Lv, S.; et al. Potential benefits of climate change for crop productivity in China. Agric. For. Meteorol. 2015, 208, 76–84. [Google Scholar] [CrossRef]
  9. FAOSTAT (Statistics division of Food and Agriculture Organization of the United Nations). 2020. Available online: http://www.fao.org/faostat/zh/#data/QC (accessed on 5 January 2021).
  10. Wang, S.; Yang, L.; Su, M.; Ma, X.; Sun, Y.; Yang, M.; Zhao, P.; Shen, J.; Zhang, F.; Goulding, K.; et al. Increasing the agricultural, environmental and economic benefits of farming based on suitable crop rotations and optimum fertilizer applications. Field Crop. Res. 2019, 240, 78–85. [Google Scholar] [CrossRef]
  11. Cui, J.; Yan, P.; Wang, X.; Yang, J.; Li, Z.; Yang, X.; Sui, P.; Chen, Y. Integrated assessment of economic and environmental consequences of shifting cropping system from wheat-maize to monocropped maize in the North China Plain. J. Clean. Prod. 2018, 193, 524–532. [Google Scholar] [CrossRef]
  12. D’Amato, D.; Droste, N.; Allen, B.; Kettunen, M.; Lähtinen, K.; Korhonen, J.; Leskinen, P.; Matthies, B.D.; Toppinen, A. Green, circular, bio economy: A comparative analysis of sustainability avenues. J. Clean. Prod. 2017, 168, 716–734. [Google Scholar] [CrossRef]
  13. Htwe, T.; Sinutok, S.; Chotikarn, P.; Amin, N.; Akhtaruzzaman, M.; Techato, K.; Hossain, T. Energy use efficiency and cost-benefits analysis of rice cultivation: A study on conventional and alternative methods in Myanmar. Energy 2020, 214, 119104. [Google Scholar] [CrossRef]
  14. Stolarski, M.J.; Krzyżaniak, M.; Tworkowski, J.; Załuski, D.; Kwiatkowski, J.; Szczukowski, S. Camelina and crambe production—Energy efficiency indices depending on nitrogen fertilizer application. Ind. Crops Prod. 2019, 137, 386–395. [Google Scholar] [CrossRef]
  15. Zhang, W.; Qian, C.; Carlson, K.M.; Ge, X.; Wang, X.; Chen, X. Increasing farm size to improve energy use efficiency and sustainability in maize production. Food Energy Secur. 2021, 10, e271. [Google Scholar] [CrossRef]
  16. Fang, Y.R.; Liu, J.A.; Steinberger, Y.; Xie, G.H. Energy use efficiency and economic feasibility of Jerusalem artichoke production on arid and coastal saline lands. Ind. Crops Prod. 2018, 117, 131–139. [Google Scholar] [CrossRef]
  17. Li, S.; Wu, J.; Wang, X.; Ma, L. Economic and environmental sustainability of maize-wheat rotation production when substituting mineral fertilizers with manure in the North China Plain. J. Clean. Prod. 2020, 271, 122683. [Google Scholar] [CrossRef]
  18. Huang, W.; Wu, F.; Han, W.; Li, Q.; Han, Y.; Wang, G.; Feng, L.; Li, X.; Yang, B.; Lei, Y.; et al. Carbon footprint of cotton production in China: Composition, spatiotemporal changes and driving factors. Sci. Total Environ. 2022, 821, 153407. [Google Scholar] [CrossRef]
  19. Chen, X.; Xu, X.; Lu, Z.; Zhang, W.; Yang, J.; Hou, Y.; Wang, X.; Zhou, S.; Li, Y.; Wu, L.; et al. Carbon footprint of a typical pomelo production region in China based on farm survey data. J. Clean. Prod. 2020, 277, 124041. [Google Scholar] [CrossRef]
  20. Hosseinzadeh-Bandbafha, H.; Nabavi-Pelesaraei, A.; Khanali, M.; Ghahderijani, M.; Chau, K.-W. Application of data envelopment analysis approach for optimization of energy use and reduction of greenhouse gas emission in peanut production of Iran. J. Clean. Prod. 2018, 172, 1327–1335. [Google Scholar] [CrossRef]
  21. Yang, X.; Gao, W.; Zhang, M.; Chen, Y.; Sui, P. Reducing agricultural carbon footprint through diversified crop rotation systems in the North China Plain. J. Clean. Prod. 2014, 76, 131–139. [Google Scholar] [CrossRef]
  22. Jankowski, K.J.; Dubis, B.; Sokólski, M.M.; Załuski, D.; Bórawski, P.; Szempliński, W. Productivity and energy balance of maize and sorghum grown for biogas in a large-area farm in Poland: An 11-year field experiment. Ind. Crops Prod. 2020, 148, 112326. [Google Scholar] [CrossRef]
  23. Xiong, L.; Liang, C.; Ma, B.; Shah, F.; Wu, W. Carbon footprint and yield performance assessment under plastic film mulching for winter wheat production. J. Clean. Prod. 2020, 270, 122468. [Google Scholar] [CrossRef]
  24. Komleh, S.H.P.; Ghahderijani, M.; Sefeedpari, P. Energy consumption and CO2 emissions analysis of potato production based on different farm size levels in Iran. J. Clean. Prod. 2012, 33, 183–191. [Google Scholar] [CrossRef]
  25. Liu, H.; Ren, L.; Spiertz, H.; Zhu, Y.; Xie, G.H. An economic analysis of sweet sorghum cultivation for ethanol production in North China. GCB Bioenergy 2014, 7, 1176–1184. [Google Scholar] [CrossRef]
  26. Tang, C.; Lu, Y.; Jiang, B.; Chen, J.; Mo, X.; Yang, Y.; Wang, Z. Energy, Economic, and Environmental Assessment of Sweet Potato Production on Plantations of Various Sizes in South China. Agronomy 2022, 12, 1290. [Google Scholar] [CrossRef]
  27. Soni, P.; Sinha, R.; Perret, S.R. Energy use and efficiency in selected rice-based cropping systems of the Middle-Indo Gangetic Plains in India. Energy Rep. 2018, 4, 554–564. [Google Scholar] [CrossRef]
  28. Yang, X.; Sun, B.; Gao, W.; Chen, Y.; Sui, P. Carbon footprints of grain-, forage-, and energy-based cropping systems in the North China plain. Int. J. Life Cycle Assess. 2018, 24, 371–385. [Google Scholar] [CrossRef]
  29. Li, S.; Wu, J.; Ma, L. Economic, energy and environmental consequences of shifting from maize-wheat to forage rotation in the North China Plain. J. Clean. Prod. 2021, 328, 129670. [Google Scholar] [CrossRef]
  30. National Bureau of Statistics, China. Available online: https://data.stats.gov.cn (accessed on 20 May 2021).
  31. Liu, K.; Blackshaw, R.E.; Johnson, E.N.; Hossain, Z.; Hamel, C.; St-Arnaud, M.; Gan, Y. Lentil enhances the productivity and stability of oilseed-cereal cropping systems across different environments. Eur. J. Agron. 2019, 105, 24–31. [Google Scholar] [CrossRef]
  32. Fang, Y.R.; Wu, Y.; Xie, G.H. Crop residue utilizations and potential for bioethanol production in China. Renew. Sustain. Energy Rev. 2019, 113, 109288. [Google Scholar] [CrossRef]
  33. Wang, X.; Chen, Y.; Sui, P.; Yan, P.; Yang, X.; Gao, W. Preliminary analysis on economic and environmental consequences of grain production on different farm sizes in North China Plain. Agric. Syst. 2017, 153, 181–189. [Google Scholar] [CrossRef]
  34. CLCD 0.8, Chinese Core Life Cycle Database. Integrated Knowledge for our Environment, Chengdu, China. Available online: http://www.ike-global.com (accessed on 15 May 2021).
  35. Tian, X.; Wu, Y.; Hou, P.; Liang, S.; Qu, S.; Xu, M.; Zuo, T. Environmental impact and economic assessment of secondary lead production: Comparison of main spent lead-acid battery recycling processes in China. J. Clean. Prod. 2017, 144, 142–148. [Google Scholar] [CrossRef]
  36. Yang, Y.; Ni, J.-Q.; Zhou, S.; Xie, G.H. Comparison of energy performance and environmental impacts of three corn stover-based bioenergy pathways. J. Clean. Prod. 2020, 272, 122631. [Google Scholar] [CrossRef]
  37. Meng, Q.; Wang, H.; Yan, P.; Pan, J.; Lu, D.; Cui, Z.; Zhang, F.; Chen, X. Designing a new cropping system for high productivity and sustainable water usage under climate change. Sci. Rep. 2017, 7, srep41587. [Google Scholar] [CrossRef] [PubMed]
  38. Gao, B.; Ju, X.; Meng, Q.; Cui, Z.; Christie, P.; Chen, X.; Zhang, F. The impact of alternative cropping systems on global warming potential, grain yield and groundwater use. Agric. Ecosyst. Environ. 2015, 203, 46–54. [Google Scholar] [CrossRef]
  39. Dubis, B.; Jankowski, K.J.; Sokólski, M.M.; Załuski, D.; Bórawski, P.; Szempliński, W. Biomass yield and energy balance of fodder galega in different production technologies: An 11-year field experiment in a large-area farm in Poland. Renew. Energy 2020, 154, 813–825. [Google Scholar] [CrossRef]
  40. Stolarski, M.J.; Krzyżaniak, M.; Kwiatkowski, J.; Tworkowski, J.; Szczukowski, S. Energy and economic efficiency of camelina and crambe biomass production on a large-scale farm in north-eastern Poland. Energy 2018, 150, 770–780. [Google Scholar] [CrossRef]
  41. Cui, Z.; Zhang, H.; Chen, X.; Zhang, C.; Ma, W.; Huang, C.; Zhang, W.; Mi, G.; Miao, Y.; Li, X.; et al. Pursuing sustainable productivity with millions of smallholder farmers. Nature 2018, 555, 363–366. [Google Scholar] [CrossRef]
  42. Wu, Y.; Xi, X.; Tang, X.; Luo, D.; Gu, B.; Lam, S.K.; Vitousek, P.M.; Chen, D. Policy distortions, farm size, and the overuse of agricultural chemicals in China. Proc. Natl. Acad. Sci. USA 2018, 115, 7010–7015. [Google Scholar] [CrossRef]
  43. Ju, X.-T.; Xing, G.-X.; Chen, X.-P.; Zhang, S.-L.; Zhang, L.-J.; Liu, X.-J.; Cui, Z.-L.; Yin, B.; Christie, P.; Zhu, Z.-L.; et al. Reducing environmental risk by improving N management in intensive Chinese agricultural systems. Proc. Natl. Acad. Sci. USA 2009, 106, 3041–3046. [Google Scholar] [CrossRef] [Green Version]
  44. Xu, R.; Tian, H.; Pan, S.; Prior, S.A.; Feng, Y.; Batchelor, W.D.; Chen, J.; Yang, J. Global ammonia emissions from synthetic nitrogen fertilizer applications in agricultural systems: Empirical and process-based estimates and uncertainty. Glob. Chang. Biol. 2019, 25, 314–326. [Google Scholar] [CrossRef]
  45. Zhang, Y.; Wang, H.; Lei, Q.; Luo, J.; Lindsey, S.; Zhang, J.; Zhai, L.; Wu, S.; Zhang, J.; Liu, X.; et al. Optimizing the nitrogen application rate for maize and wheat based on yield and environment on the Northern China Plain. Sci. Total Environ. 2017, 618, 1173–1183. [Google Scholar] [CrossRef]
  46. Mandal, K.; Saha, K.; Ghosh, P.; Hati, K.; Bandyopadhyay, K. Bioenergy and economic analysis of soybean-based crop production systems in central India. Biomass-Bioenergy 2002, 23, 337–345. [Google Scholar] [CrossRef]
  47. Chen, X.; Cui, Z.; Fan, M.; Vitousek, P.; Zhao, M.; Ma, W.; Wang, Z.; Zhang, W.; Yan, X.; Yang, J.; et al. Producing more grain with lower environmental costs. Nature 2014, 514, 486–489. [Google Scholar] [CrossRef] [PubMed]
  48. Wang, J.; Zhang, L.; He, X.; Zhang, Y.; Wan, Y.; Duan, S.; Xu, C.; Mao, X.; Chen, X.; Shi, X. Environmental mitigation potential by improved nutrient managements in pear (Pyrus pyrifolia L.) orchards based on life cycle assessment: A case study in the North China Plain. J. Clean. Prod. 2020, 262, 121273. [Google Scholar] [CrossRef]
  49. Wang, Y.Y.; Cheng, Y.H.; Chen, K.E.; Tsay, Y.F. Nitrate Transport, Signaling, and Use Efficiency. Annu. Rev. Plant Biol. 2018, 69, 85–122. [Google Scholar] [CrossRef]
  50. Cai, S.; Pittelkow, C.M.; Zhao, X.; Wang, S. Winter legume-rice rotations can reduce nitrogen pollution and carbon footprint while maintaining net ecosystem economic benefits. J. Clean. Prod. 2018, 195, 289–300. [Google Scholar] [CrossRef]
  51. Muazu, A.; Yahya, A.; Ishak, W.; Bejo, S.K. Machinery utilization and production cost of paddy cultivation under wetland direct seeding conditions in Malaysia. Eng. Agric. Environ. Food 2015, 8, 289–297. [Google Scholar] [CrossRef]
  52. Gao, Z.; Han, M.; Hu, Y.; Li, Z.; Liu, C.; Wang, X.; Tian, Q.; Jiao, W.; Hu, J.; Liu, L.; et al. Effects of Continuous Cropping of Sweet Potato on the Fungal Community Structure in Rhizospheric Soil. Front. Microbiol. 2019, 10, 2269. [Google Scholar] [CrossRef]
  53. Zhao, J.; Yang, Y.; Zhang, K.; Jeong, J.; Zeng, Z.; Zang, H. Does crop rotation yield more in China? A meta-analysis. Field Crops Res. 2019, 245, 107659. [Google Scholar] [CrossRef]
  54. Munkholm, L.J.; Heck, R.J.; Deen, B. Long-term rotation and tillage effects on soil structure and crop yield. Soil Tillage Res. 2013, 127, 85–91. [Google Scholar] [CrossRef]
  55. Bennett, A.J.; Bending, G.; Chandler, D.; Hilton, S.; Mills, P. Meeting the demand for crop production: The challenge of yield decline in crops grown in short rotations. Biol. Rev. 2011, 87, 52–71. [Google Scholar] [CrossRef] [PubMed]
  56. Winter, M.; de Mol, F.; von Tiedemann, A. Cropping systems with maize and oilseed rape for energy production may reduce the risk of stem base diseases in wheat. Field Crops Res. 2014, 156, 249–257. [Google Scholar] [CrossRef]
  57. Qin, S.; Yeboah, S.; Cao, L.; Zhang, J.; Shi, S.; Liu, Y. Breaking continuous potato cropping with legumes improves soil microbial communities, enzyme activities and tuber yield. PLoS ONE 2017, 12, e0175934. [Google Scholar] [CrossRef] [Green Version]
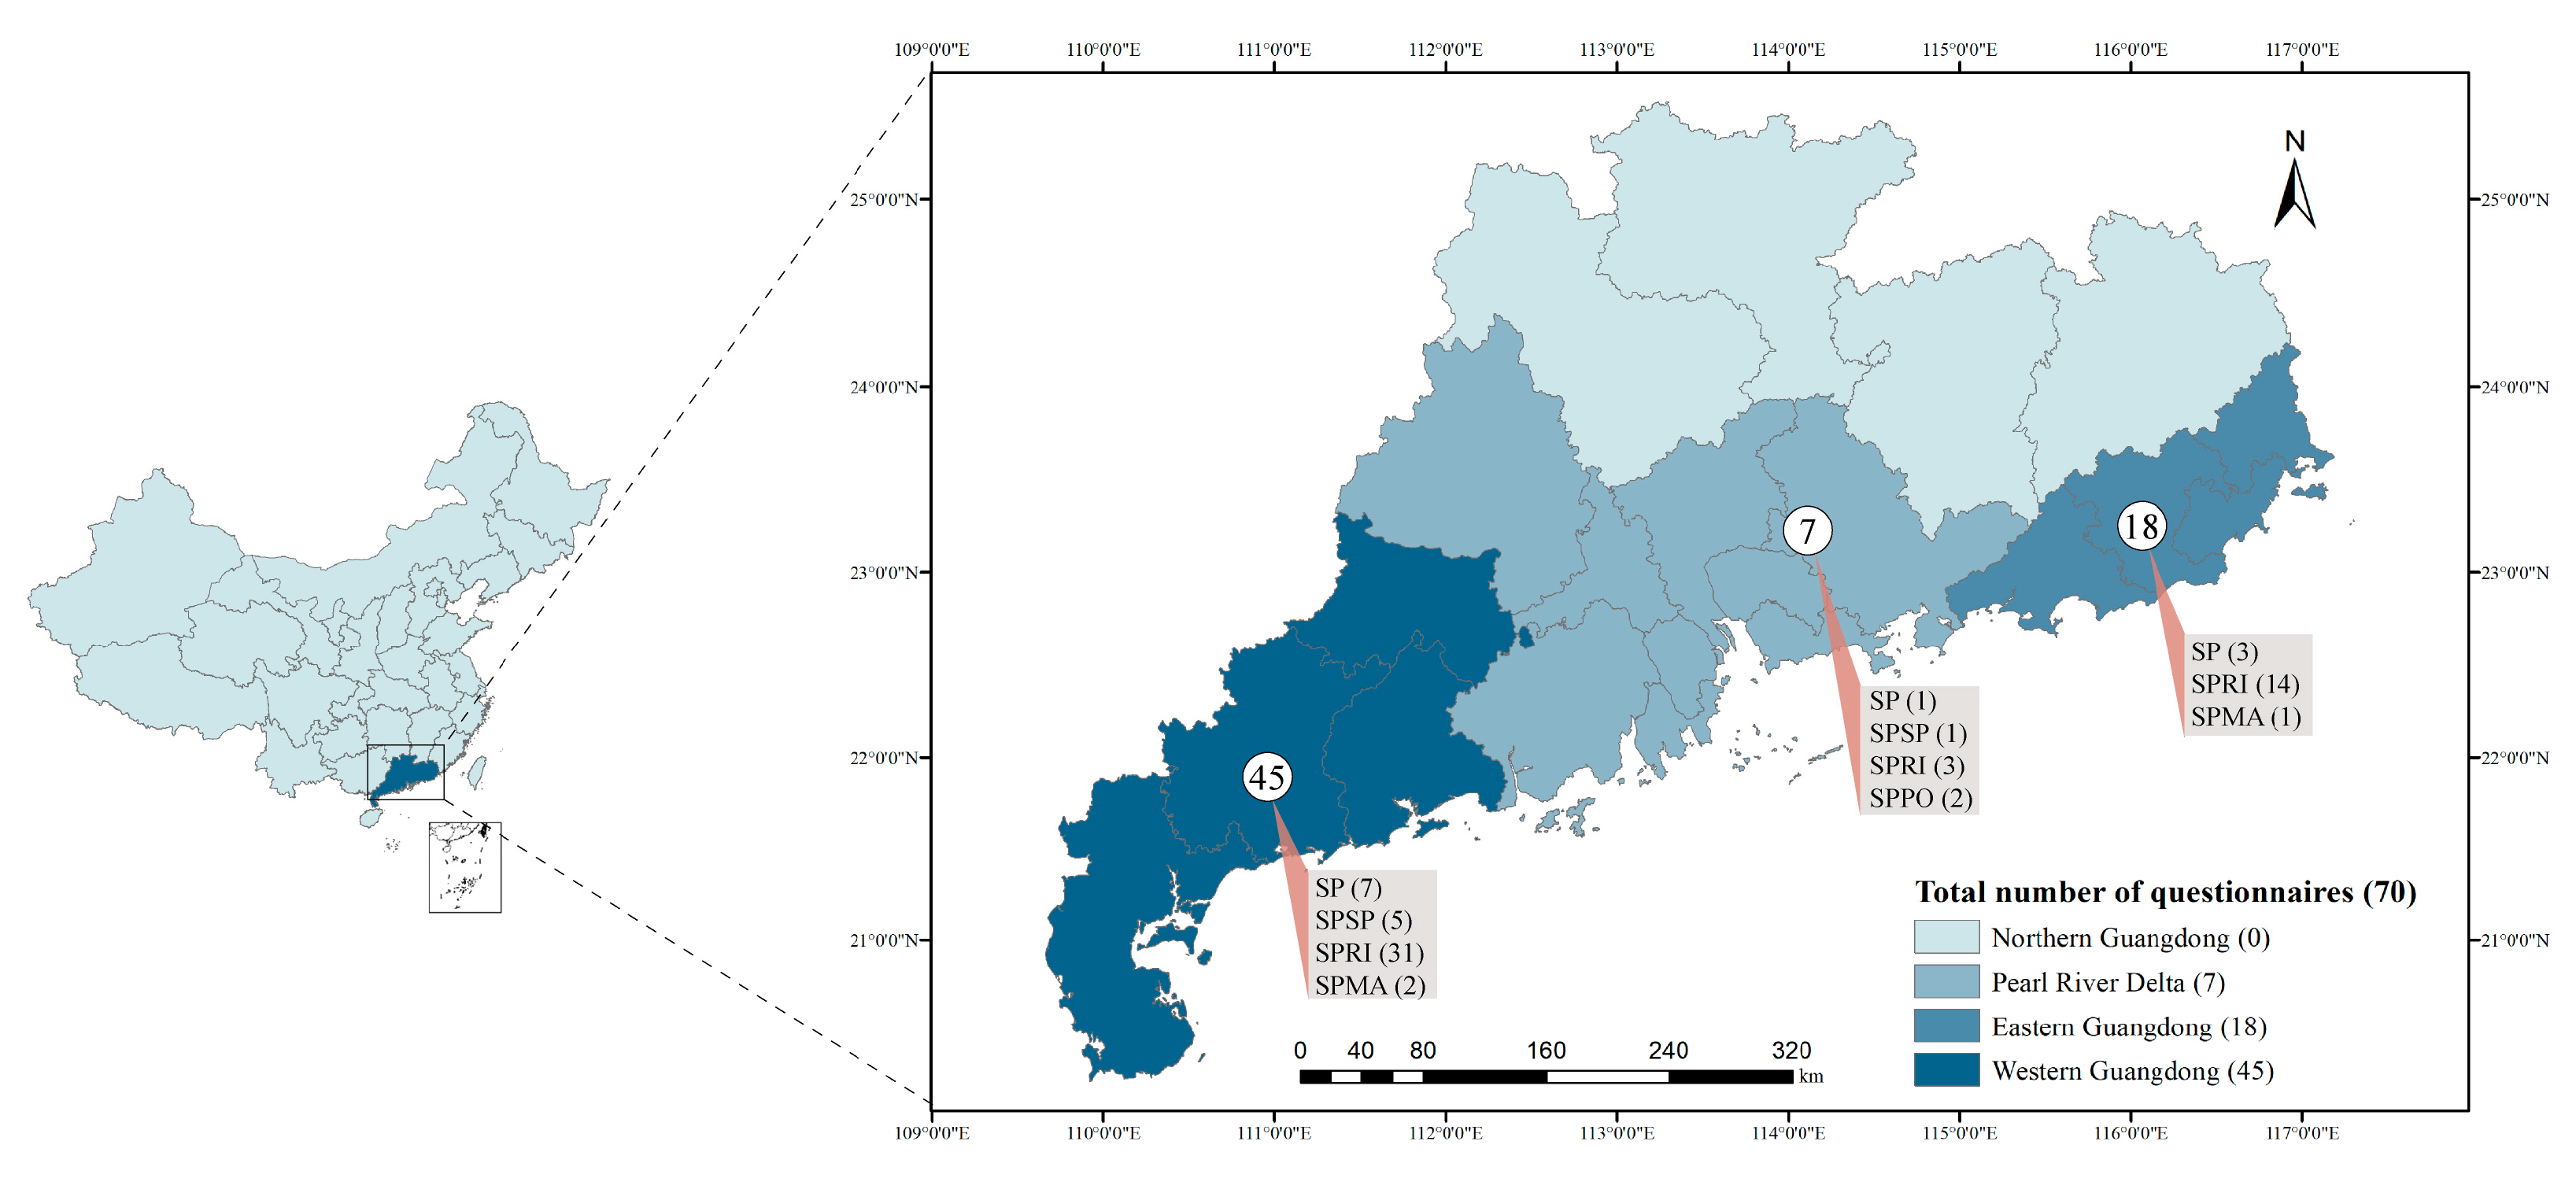
Figure 1. Distribution of sample sites for face-to-face questionnaire survey in Guangdong. SP, sweet potato monoculture; SPRI, sweet potato–rice; SPMA, sweet potato–maize; SPPO, sweet potato–potato; and SPSP, sweet potato–sweet potato. Numbers are expressed as the number of questionnaires.
Agronomy 12 02340 g001
Figure 2. Cultivation time of the five cropping systems within a year.
Agronomy 12 02340 g002
Figure 3. The main product yield (sweet potato equivalent yield, SPEY) and by-product (straw) yield of mono cropping of sweet potato (SP); continuous cropping of sweet potato (SPSP); and rotation cropping system of sweet potato–rice (SPRI), sweet potato–maize (SPMA), and sweet potato–potato (SPPO). The different lowercase letters indicate significant differences within cropping system treatments at p < 0.05. Bars represent standard errors.
Agronomy 12 02340 g003
Figure 4. The percentage of each input source to the total energy inputs (a), economic inputs (b), and greenhouse-gas emissions (c) for mono cropping of sweet potato (SP); continuous cropping of sweet potato (SPSP); and rotation cropping system of sweet potato–rice (SPRI), sweet potato–maize (SPMA), and sweet potato–potato (SPPO).
Agronomy 12 02340 g004
Figure 5. Energy inputs of nitrogen (N), phosphorus (P2O5), potassium (K2O), and farmyard manure of mono cropping of sweet potato (SP); continuous cropping of sweet potato (SPSP); and rotation cropping system of sweet potato–rice (SPRI), sweet potato–maize (SPMA), and sweet potato–potato (SPPO). The different lowercase letters indicate significant differences within cropping system treatments at p < 0.05. Bars represent standard errors.
Agronomy 12 02340 g005
Figure 6. Comprehensive assessment of sweet-potato-based cropping systems in Guangdong province. For each parameter, the change of color from dark to light in a row indicates the order of cropping systems from high to low. SP: sweet potato monocropping; SPSP: sweet potato continuous cropping; SPRI: sweet potato and rice rotation; SPMA: sweet potato and maize rotation; SPPO: sweet potato and potato rotation; and SPEY: sweet potato equivalent yield.
Agronomy 12 02340 g006
Table 1. Location, soil, and climate characteristics of sampled farms for sweet-potato-based production system in this study.
Cropping SystemWestern GuangdongEastern GuangdongPearl River Delta
Longitude109°48′−112°18′115°36′−116°63′113°09′−114°55′
Latitude20°31′−22°12′22°53′−23°66′22°49′−23°08′
Soil pH a5.4 ± 0.75.5 ± 0.65.2 ± 0.3
Soil organic matter (g/kg) a15.2 ± 6.516.9 ± 8.921.0 ± 3.7
Total nitrogen (g/kg) a1.0 ± 0.41.1 ± 0.51.4 ± 0.2
Available phosphorus (mg/kg) a118.2 ± 112.054.1 ± 42.3342.7 ± 78.3
Available potassium (mg/kg) a80.2 ± 54.889.3 ± 42.180.8 ± 48.4
Mean annual temperature (°C) b23.6 ± 0.422.8 ± 0.621.8 ± 0.1
Precipitation (mm) b2012.7 ± 658.21470.7 ± 208.61525.8 ± 222.5
a denotes average value of soil samples at a depth of 0–30 cm was collected in West Guangdong (n = 19), East Guangdong (n = 10), and the Pearl River Delta (n = 7) during the survey. b denotes average value of annual temperature and precipitation for 2018 and 2019 collected from local meteorological stations.
Table 2. Input and output data of five sweet-potato-based cropping systems in Guangdong province per hectare.
ParameterUnitSPSPSPSPRISPMASPPO
(n = 11)(n = 6)(n = 48)(n =3)(n = 2)
Input
1-Land rentCNY/ha529159503831525014,250
2-Laborh/ha7381567128512691738
3-Machineryh/ha1020141314
4-Diesel fuelL/ha144285198187199
5-Fertilizers
Nitrogen (N)kg/ha117192259389430
Phosphorus (P2O5)kg/ha115127195343410
Potassium (K2O)kg/ha116444300307449
Farmyard manurekg/ha826836003050150028,125
6-Pesticides
Herbicideskg/ha3.068.272.410.8721.53
Insecticides kg/ha0.180.270.360.731.18
Fungicideskg/ha0.401.000.560.802.14
7-Water for irrigationm3/ha3412120500
8-Plastic filmkg/ha114518180300
9-Seedkg/ha209242591895/26(RI)1821/25(MA)1533/2250(PO)
Output
Crop yieldt/ha25.0255.7525.31/6.65(RI)35.00/11.98(MA)33.75/41.25(PO)
n: number of questionnaires. The seeds of SP and SPSP systems are sweet potato, and the seeds of other cropping systems are composed of sweet potato and rotation crops, i.e., rice (RI), maize (MA), and potato (PO). The crop yield of SP and SPSP systems comprises sweet potato, and the yields of other cropping systems are composed of sweet potato and rotation crops, i.e., rice (RI), maize (MA), and potato (PO).
Table 3. Energy input and output for five sweet-potato-based cropping systems in Guangdong province.
ParameterSPSPSPSPRISPMASPPOANOVA
(n = 11)(n = 6)(n = 48)(n =3)(n = 2)
Input (MJ/ha)33,64661,95051,81173,701105,961***
Labor14463071253124873406*
Machinery21424244296927772959*
Diesel fuel525810,417728768177264*
Fertilizers15,85324,53830,08743,72057,607***
Pesticides81418887676115525***
Water for irrigation3412417510**
Plastic film5672337941934715,579***
Seed753215,3327213789113,620***
Output (MJ/ha)158,570353,291351,422572,789475,279***
Main product90,082200,700188,283323,947270,000***
By-product68,488152,591163,139248,842205,279***
Net energy (MJ/ha)124,924291,341299,611499,088369,318***
Energy rate4.715.706.787.774.49**
Energy efficiency (kg/MJ)0.770.900.610.670.69*
SP: sweet potato monocropping; SPSP: sweet potato continuous cropping; SPRI: sweet potato and rice rotation; SPMA: sweet potato and maize rotation; SPPO: sweet potato and potato rotation; *: significant at p < 0.05; **: significant at p < 0.01; and ***: significant at p < 0.001.
Table 4. Economic input and output for five sweet-potato-based cropping systems in Guangdong province.
ParameterSPSPSPSPRISPMASPPOANOVA
(n = 11)(n = 6)(n = 48)(n =3)(n = 2)
Input (CNY/ha)33,81863,66645,84355,46595,100***
Land rent529159503831525014,250*
Labor11,24626,47021,27720,56032,588*
Machinery23966502442643354582*
Diesel fuel9181818127211901268*
Fertilizers893513,060919713,37523,445**
Pesticides13912625222645209292***
Water for irrigation94340471400**
Plastic film10945021618003000***
Seed 34396451335142956675**
Output (CNY/ha)92,673203,950106,043144,515169,500***
Net return(CNY/ha)58,855140,28460,20089,05074,400**
Benefit to cost ratio2.743.202.312.611.78ns
Economic productivity (kg/CNY)0.740.880.690.890.77ns
SP: sweet potato monocropping; SPSP: sweet potato continuous cropping; SPRI: sweet potato and rice rotation; SPMA: sweet potato and maize rotation; SPPO: sweet potato and potato rotation; ns: non-significant; *: significant at p < 0.05; **: significant at p < 0.01; and ***: significant at p < 0.001.
Table 5. GHG emissions of five sweet-potato-based cropping systems in Guangdong province.
ParameterSPSPSPSPRISPMASPPOANOVA
(n = 11)(n = 6)(n = 48)(n =3)(n = 2)
Direct emissions a (kg CO2-eq/ha)43671596414501601**
Indirect emissions (kg CO2-eq/ha)12442420181523023245***
Machinery152301211197210*
Diesel fuel89177124116123*
Fertilizers44678391813751632***
Pesticides22571912150***
Plastic film62611105175***
Seed5281075532497955***
Total emissions (kg CO2-eq/ha)16803135277937524846***
Eco-efficiency (CNY/kg CO2-eq)3545222415*
a The direct emissions were estimated by multiplying the amount of nitrogen application by the coefficient of 1.25%. SP: sweet potato monocropping; SPSP: sweet potato continuous cropping; SPRI: sweet potato and rice rotation; SPMA: sweet potato and maize rotation; SPPO: sweet potato and potato rotation; *: significant at p < 0.05; **: significant at p < 0.01; and ***: significant at p < 0.001.
Publisher’s Note: MDPI stays neutral with regard to jurisdictional claims in published maps and institutional affiliations.