Article

Phytoremediation of Heavy Metal Contaminated Soils Using Safflower

by
Barbara Rachele Ciaramella
,
Sebastiano Andrea Corinzia
,
Salvatore Luciano Cosentino
and
Giorgio Testa
*
Department of Agriculture, Food and Environment (Di3A), University of Catania, Via Valdisavoia 5, 95123 Catania, Italy
*
Author to whom correspondence should be addressed.
Agronomy 2022, 12(10), 2302; https://doi.org/10.3390/agronomy12102302
Submission received: 24 August 2022 / Revised: 17 September 2022 / Accepted: 20 September 2022 / Published: 25 September 2022

Abstract

:
The promotion and gradual replacement of fossil fuels with renewable sources increasing the competition between food and fuel. Therefore, energy crops could be produced on unproductive marginal land due to unfavorable conditions, such as limitations in nutrient and water availability or the presence of contaminants such as hydrocarbons or heavy metals. In the case of soils contaminated with heavy metals, one option could be the use of plants to extract or immobilize the contaminants in the soil in a process called phytoremediation. Carthamus tinctorius L. is an annual herbaceous plant with a deep root system, and the oil extracted from the seeds is an excellent oil for conversion into biofuel. It appears suitable to be used in the phytoremediation process, increasing the opportunity to valorize polluted areas and reducing the risk of abandonment of these lands. In this study, C. tinctorius was tested in soils contaminated with zinc, cadmium, lead, and nickel at different concentrations to evaluate the effects on yield and heavy metal content in the different parts of the plant. The experiment highlights the tolerance of Safflower to the cultivation in heavy-metal-polluted soil; in fact, a low reduction in biomass yield was observed. Among the evaluated heavy metals, the higher susceptibility was observed at the highest concentrations of zinc and cadmium. Generally, safflower concentrates heavy metals in the belowground biomass. The relative low concentrations of heavy metals in some parts of the aboveground biomass could suggest the possibility of using it as a feedstock for bioenergy conversion.

1. Introduction

Soil must be considered a non-renewable resource, and the preservation of its ability to provide ecological, economic, and social services is relevant to the well-being of future generations. Therefore, it must be used sustainably. It is estimated by Toth et al. (2016) [1] that 137,000 km2 of European agricultural land needs to be remediated from heavy metal contamination. Generally, heavy metals in contaminated soils are defined as chemical elements whose density is greater than 7 g/cm3 or, based on their atomic weight, as an element whose atomic weight is greater than 20 [2,3]. Heavy metals are naturally present in the soil, but due to industrialization and the discarding of electronic waste, for most of them (for example, Pb, Cd, Zn, As, Ni, and Hg), the concentration in the soil has been increasing, leading to severe concerns regarding health issues for human beings, animals, and plants. Several remediation techniques have been developed in relation to the typology of chemicals contaminating the soil, involving both physical and biological processes. Among biological processes, phytoremediation uses plants to extract, stabilize, volatilize, and degrade pollutants. This approach has a lower environmental impact and economic cost than other chemical and physical techniques [4]. Furthermore, the economic suitability can be enhanced with the possibility of cultivating energy crops, overcoming the unproductive use of the land [5,6,7].
Plants’ rhizospheres along with the pH, climatic conditions, and organic matter are factors that affect the bioavailability of heavy metals. As a result, metals in soils can be available, unavailable, or exchangeable [8], promoting the remediation of these soils. The crop selection needs to fulfill several conditions, such as the tolerance of the crops to heavy metals, high production of biomass, deep and extensive root systems, well known agronomic techniques and a low requirement for agronomic input. In addition, the possibility of converting biomass for bio-energy production, including ethanol, biogas, and biodiesel, represents an additional benefit of phytoremediation crops [9,10].
The bio-energy conversion allows for controlling the dispersion of the contaminated biomass or the contaminated ashes deriving from the uncontrolled combustion of the biomass and answers the request for the production of sustainable energy (RED II) [11], leading to a fair mediation between the economic profit deriving from the use of the land and the respect for the environment promoted through the adoption of European directives and regulations in environmental matter.
In this scenario, safflower (Carthamus tinctorius L.), an oilseed plant from the Asteraceae family that originated in southern Asia, appears to be an excellent candidate crop for heavily polluted soils. It is an annual or biennial herbaceous plant cultivated in different climatic conditions, including the Mediterranean area, thanks to its excellent tolerance to drought [12] and salinity [13]. It is a spring–summer, long-day plant grown in high-intensity light and high temperatures during all phases of the biological cycle. It is currently cultivated in North America, Asia, and Russia.
Safflower has been cultivated for the yellow and red pigments obtained from the flowers, which have been used as coloring agents in food, clothes, cosmetics, and medicine. In addition, safflower seed has been recognized as a promising oil source for biodiesel production because of its high oil content of between 26 and 45% and the high oleic and linoleic acid [14]. Further bioenergy applications include the production of biogas or bioethanol from safflower straw and the development of biorefinery processes based on the whole safflower plant [15,16].
The hypothesis investigated in this work is that safflower is able to grow in contaminated heavy metal soils and to remediate these soils. These abilities were evaluated under cadmium, lead, nickel, and zinc contamination, investigating two different concentrations for each metal. The remediation of these elements is considered very important due to their relatively wider spread when compared to other heavy metals and their negative impacts on the ecosystem and human health. The environmental contamination by these elements derives from various sources, such as industry, mining, smelting, and agriculture [17,18,19]. To define the possibility of reusing biomass for bioenergy purposes, the heavy metal accumulation in the different parts of the plants (stems, leaves, seeds) has been measured.

2. Materials and Methods

The experiment was carried out at the University of Catania, Department of Agriculture, Food and Environment (Sicily, Italy), in two subsequent years (2020 and 2021). Carthamus tinctorius L. was grown in pots containing 12 kg of soil (30 cm diameter and 30 cm height), previously contaminated with four heavy metals at two concentrations (low and high). The concentrations of the contaminants applied to the soils are reported in Table 1. Pots containing untreated soil were used as a control group. Pots were arranged in a completely randomized experimental design with 3 replications, The soil was contaminated using nitrate of Zinc [Zn (NO3)2], nitrate of cadmium [Cd(NO3)2], nitrate of nickel [Ni(NO3)2], and nitrate of lead [Pb(NO3)2].
The soil (Andisol, USDA) used for the experiment was collected from a farm in the Etna area, taken from a depth of 30 cm. It was characterized at the beginning of the experiments by sampling 1 kg of soil, which had been dried in an oven at a temperature between 25 and 30 °C and then sieved through a 2 mm mesh. Particle size distribution was measured, and conductivity was determined in 1:1 soil/distilled water suspensions after 1 h with conductivity electrodes. A pH-meter PH 7 Vio XS measured the pH value (H2O). The soil organic matter was determined using the Walkley–Black method [20].
The uncontaminated soil characteristics were reported in Table 2. The texture of the soil was characterized by a high sand content (92.9%). The organic matter content was low (0.86%). The pH was neutral–lightly alkaline and had a high conductivity.
The total metal content (Cd, Ni, Zn, and Pb) of the soil was quantified by atomic absorption spectrometry (AAnalyst 200 AA Spectrometer, Perkin Elmer) on the aqua regia digested samples, according to ISO 11466 (ISO, 1998) [21] before the experiment and after the harvesting of the plants. In addition, the bioavailable heavy metal content in the soil was determined following ISO 17402 (ISO, 2008) [22] using EDTA concentration of 0.05 M, pH 7.5 (near to soil pH) to a volume ratio of 1:20 in 1 g of soil, under stirring for 24 h. The filtrate solution was measured by atomic absorption to quantify the available heavy metals.
The seeds were germinated in Petri dishes, and each germinated seed was planted into peat pots and, after two weeks, transplanted into the contaminated pots (eight plants per pot). During the crop cycle, plants were maintained in well water conditions. The main meteorological parameters were recorded by a meteorological station nearby (Figure 1).
During the two growing seasons (March–July) the minimum temperature ranged from 6.7 °C to 19.8 °C and from 5.3 °C to 21.1 °C in the first and second year, respectively. The maximum temperature ranged from 14.9 °C to 31.9 °C and from 17.4 °C to 35.7 °C in the first and second year, respectively. The cumulative rainfall of the growing seasons was equal to 266.4 mm in the first year and 67.0 mm in the second year. The high rainfall amount in the first year was related to extreme events that occurred in the third week of March 2020 (Table S1).
The harvest was performed at the complete seed ripening stage, and the plants in each pot were collected and fractionated into stems, leaves, and seeds. Then, the biomass was weighted and dried in an oven at 65 °C until constant weight. In addition, the roots were collected and washed with ultra-pure water to remove soil particles and weighted and dried at 65 °C in oven until constant weight.
Each sample was ground with a mill at a 1 mm sieve (IKA M20), and 1 g of biomass was reduced to ashes in the muffle furnace at 550 °C for 5 h. The heavy metal digestion of the biomass samples was performed in a water bath with 10 mL of nitric acid solution 1:1 (Nitric Acid 65%, Sigma-Aldrich, Burlington, MA, USA). The sample was filtrated through Whatman paper. The heavy metal concentration of the extract was quantified in a specific volume by the atomic absorption spectrometer (AAnalyst 200 AA Spectrometer, Perkin Elmer, Waltham, MA, USA).

Data Analysis

To evaluate the tolerance of safflower, the potential phytoextraction, and the transportation of the heavy metals into the plants, the tolerance index (TI), the bioconcentration factor (BCF), the accumulation index (mAI), and the translocation factor (TF) were calculated according to Barbosa et al. (2015) [9,23].
-
TI (Tolerance index) was used to evaluate the tolerance of plants at different levels of contaminants in the soil [23,24,25]:
T I = dry   aboveground   biomass   weight   of   contaminated   plants ,   g   pot 1 dry   aboveground   biomass   weight   of   control   plants ,   g   pot 1
-
mAI (modified Accumulation Index) was calculated to evaluate the plant’s ability to uptake the heavy metal from the soil [9]:
m A I = metal   accumulation   in   the   contaminated   plant s   mg   kg 1 metal   accumulation   in   the   control   plants ,   mg   kg 1
-
mBCF (modified bioconcentration factor) was used to evaluate the ability of the plant to extract and accumulate the metal in the aerial or radical fraction of the biomass. The content of the bioavailable metal in the soil, determined by EDTA extraction, represents the amount of metal potentially bioavailable for the plant. Therefore, this factor can represent more realistically the translocation capacity of the metal in plants [9,26,27]:
m B C F = metal   concentration   in   the   plant   fraction ,   mg   kg 1 bioavailable   metal   concentration   in   the   soil ,   mg   kg 1
-
TF (Translocation Factor) is expressed as the ratio between the metal concentration in the aboveground fraction of the plant (mg kg−1) and the metal concentration in the root fraction of the plant (mg kg−1) [9,23,27]:
T F = metal   concentration   in   the   aboveground   plant   fraction ,   mg   kg 1 metal   concentration   in   the   belowground   plant   fraction ,   mg   kg 1
Plants with mBCF and TF indices greater than one (>1) are potentially suitable for phytoextraction.
The data were statistically analyzed using R software (4.2.0, R Core Team, 2013). Contaminants and their concentrations were considered the main factors, and the means were separated by the Tuckey’s HSD test. The Shapiro test was used to verify the normality of the residual distribution. Finally, the ANOVA tested the difference in productivity and heavy metal concentration over the years.
A principal component analysis (PCA) was used to visualize and interpret the multidimensional data. The PCA was based on Person’s correlation matrix calculated upon the biomass fraction yields and heavy metal concentration in the biomass fractions [28].

3. Results

3.1. Soil Characterization

The results showed that bioavailable Zn, Cd, and Ni concentrations in the soil were higher in the first year of the experiment (2020), while Pb had a higher bioavailable concentration in the second year (2021) (Table 3). Considering the first year, the bioavailability was 59.2% and 61.6% for Zn450 and Zn900, 54.1% and 61.6% for Pb450 and Pb900, 55.7% and 65.5% for Cd4 and Cd8, 65.1% and 70.4% for Ni110 and Ni220. In the second year, the bioavailability increased to 65.3% and 66.9% for Zn450 and Zn900, respectively. In the Pb treatment, a slight decrease in the bioavailability was observed (53.1%) in the low level of contaminant (Pb450), while an increase was observed in the high level (66.7%). The bioavailability of Cd underwent a considerable decrease, reaching 39.2% for Cd4 and 51.8% for Cd8. In Ni treatments, a lower bioavailability was observed in the second year, with 47.7% and 69.9% for Ni110 and Ni220, respectively.

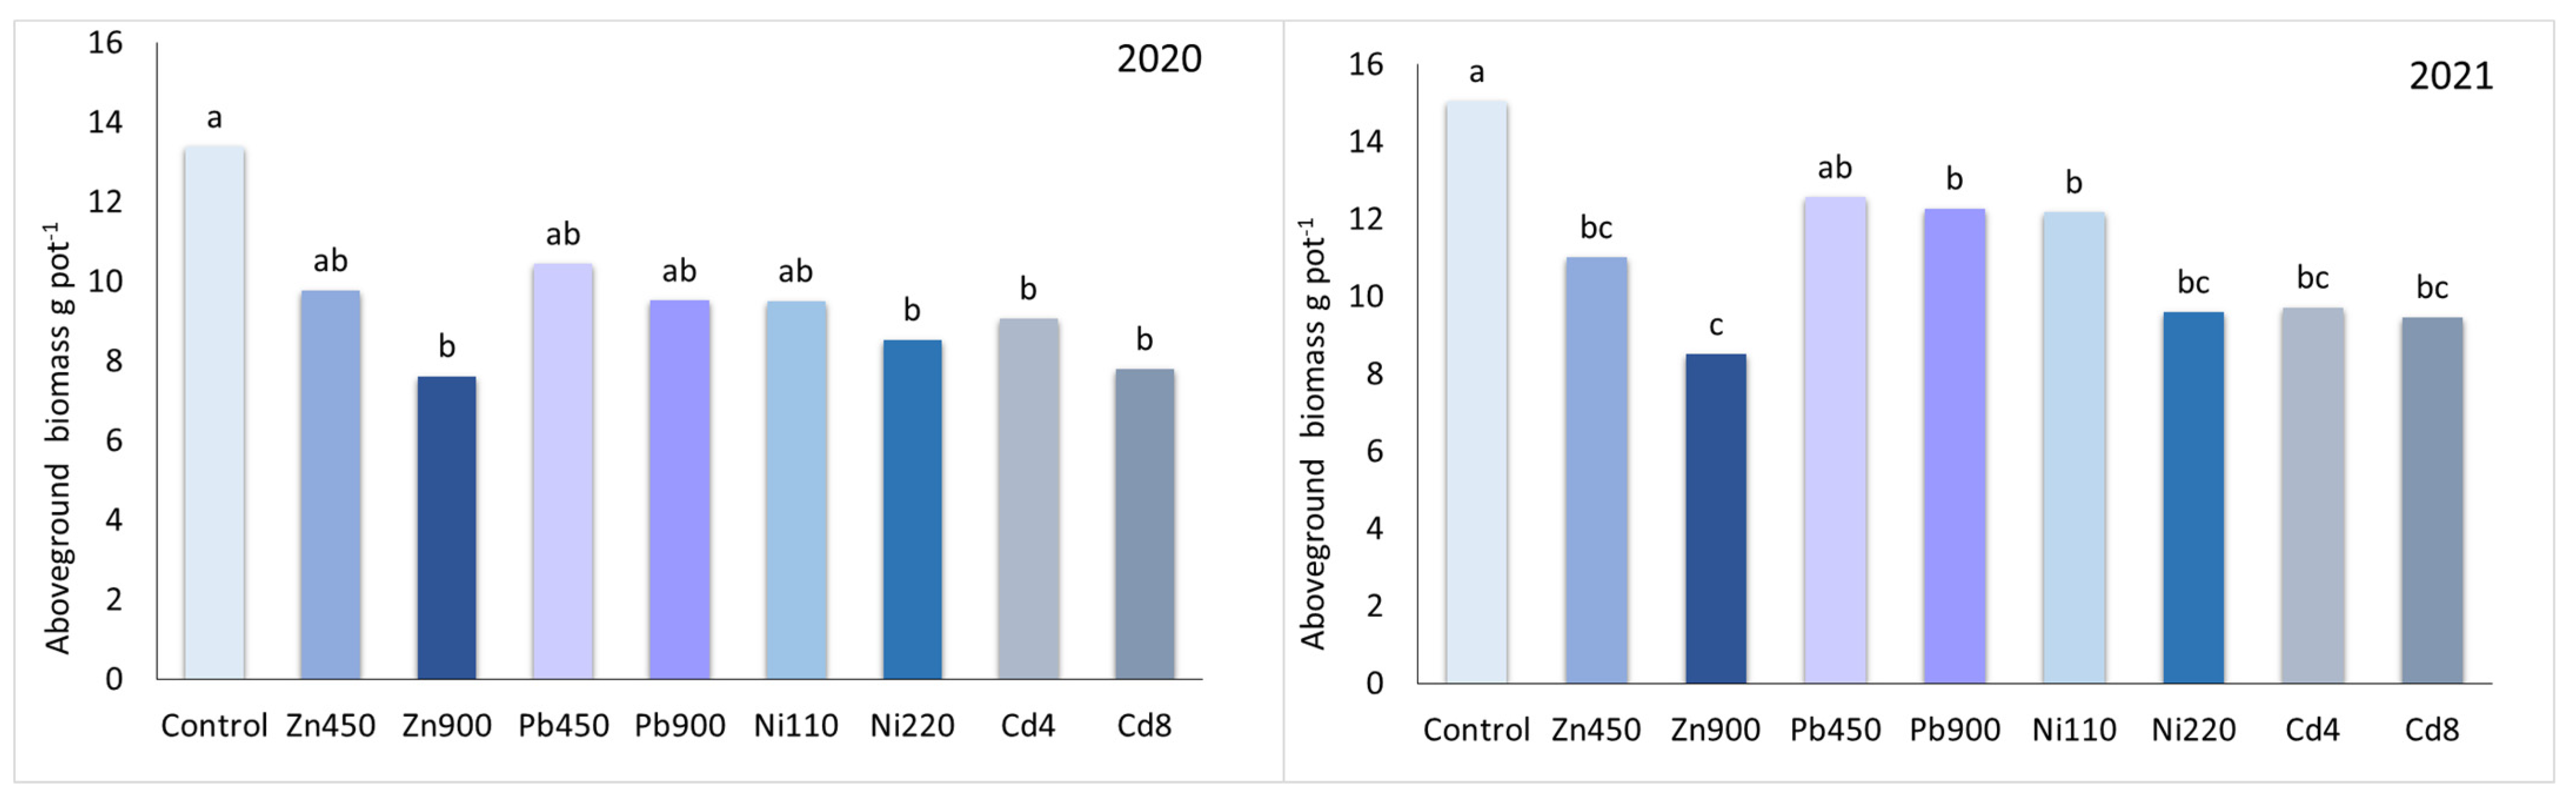
3.2. Biomass Production

The aboveground biomass was affected by heavy metals concentration in soil with different behaviors according to the contaminant (Figure 2). In particular, Zn treatments significantly affected the aboveground biomass production in both years, with higher reduction at higher Zn content. Pb contamination led to a minor reduction in aboveground biomass.
The aboveground productivity was higher in the second growing season than in the first. A slight increase was observed in the control, while the productivity increased from 9.8 to 11.0 g pot−1 in Zn450 and from 7.6 to 8.5 g pot−1 in Zn900. The aboveground productivity in Ni220 reached 9.5 and 12.2 g.pot−1 in the first and second year, respectively. No significant effects were observed among different concentrations of Pb. In Ni-contaminated pots, the reduction in the yield was 19.1% and 36.3% for Ni110 and Ni220, respectively, while in Cd trials, the reduction was 35.4% and 37.1% for Cd4 and Cd8, showing that Cd has a high effect on safflowers’ productivity.
The contaminants’ effect on the biomass fractions yields can be observed in Table 4. Regarding root yield during the first year, Zn induced the highest reduction. The highest productivity reduction was observed in the roots of Zn900, with a reduction of 56% and 63% in the first and second year, respectively.
The stem productivity reduction due to heavy metal contamination was significant in 2020 and reached the highest magnitude in Zn900. In 2021, the reduction in stem productivity was significant for Pb900, Ni220, and all Cd concentrations, with a reduction of 30%. The highest reduction (49%) was observed in Zn900.
Heavy metal contamination affected seed yield only in 2020 when Cd8 achieved the lowest seed yield and a 60% reduction compared to the uncontaminated plants. In 2021, the effect on seed yield was not significant.

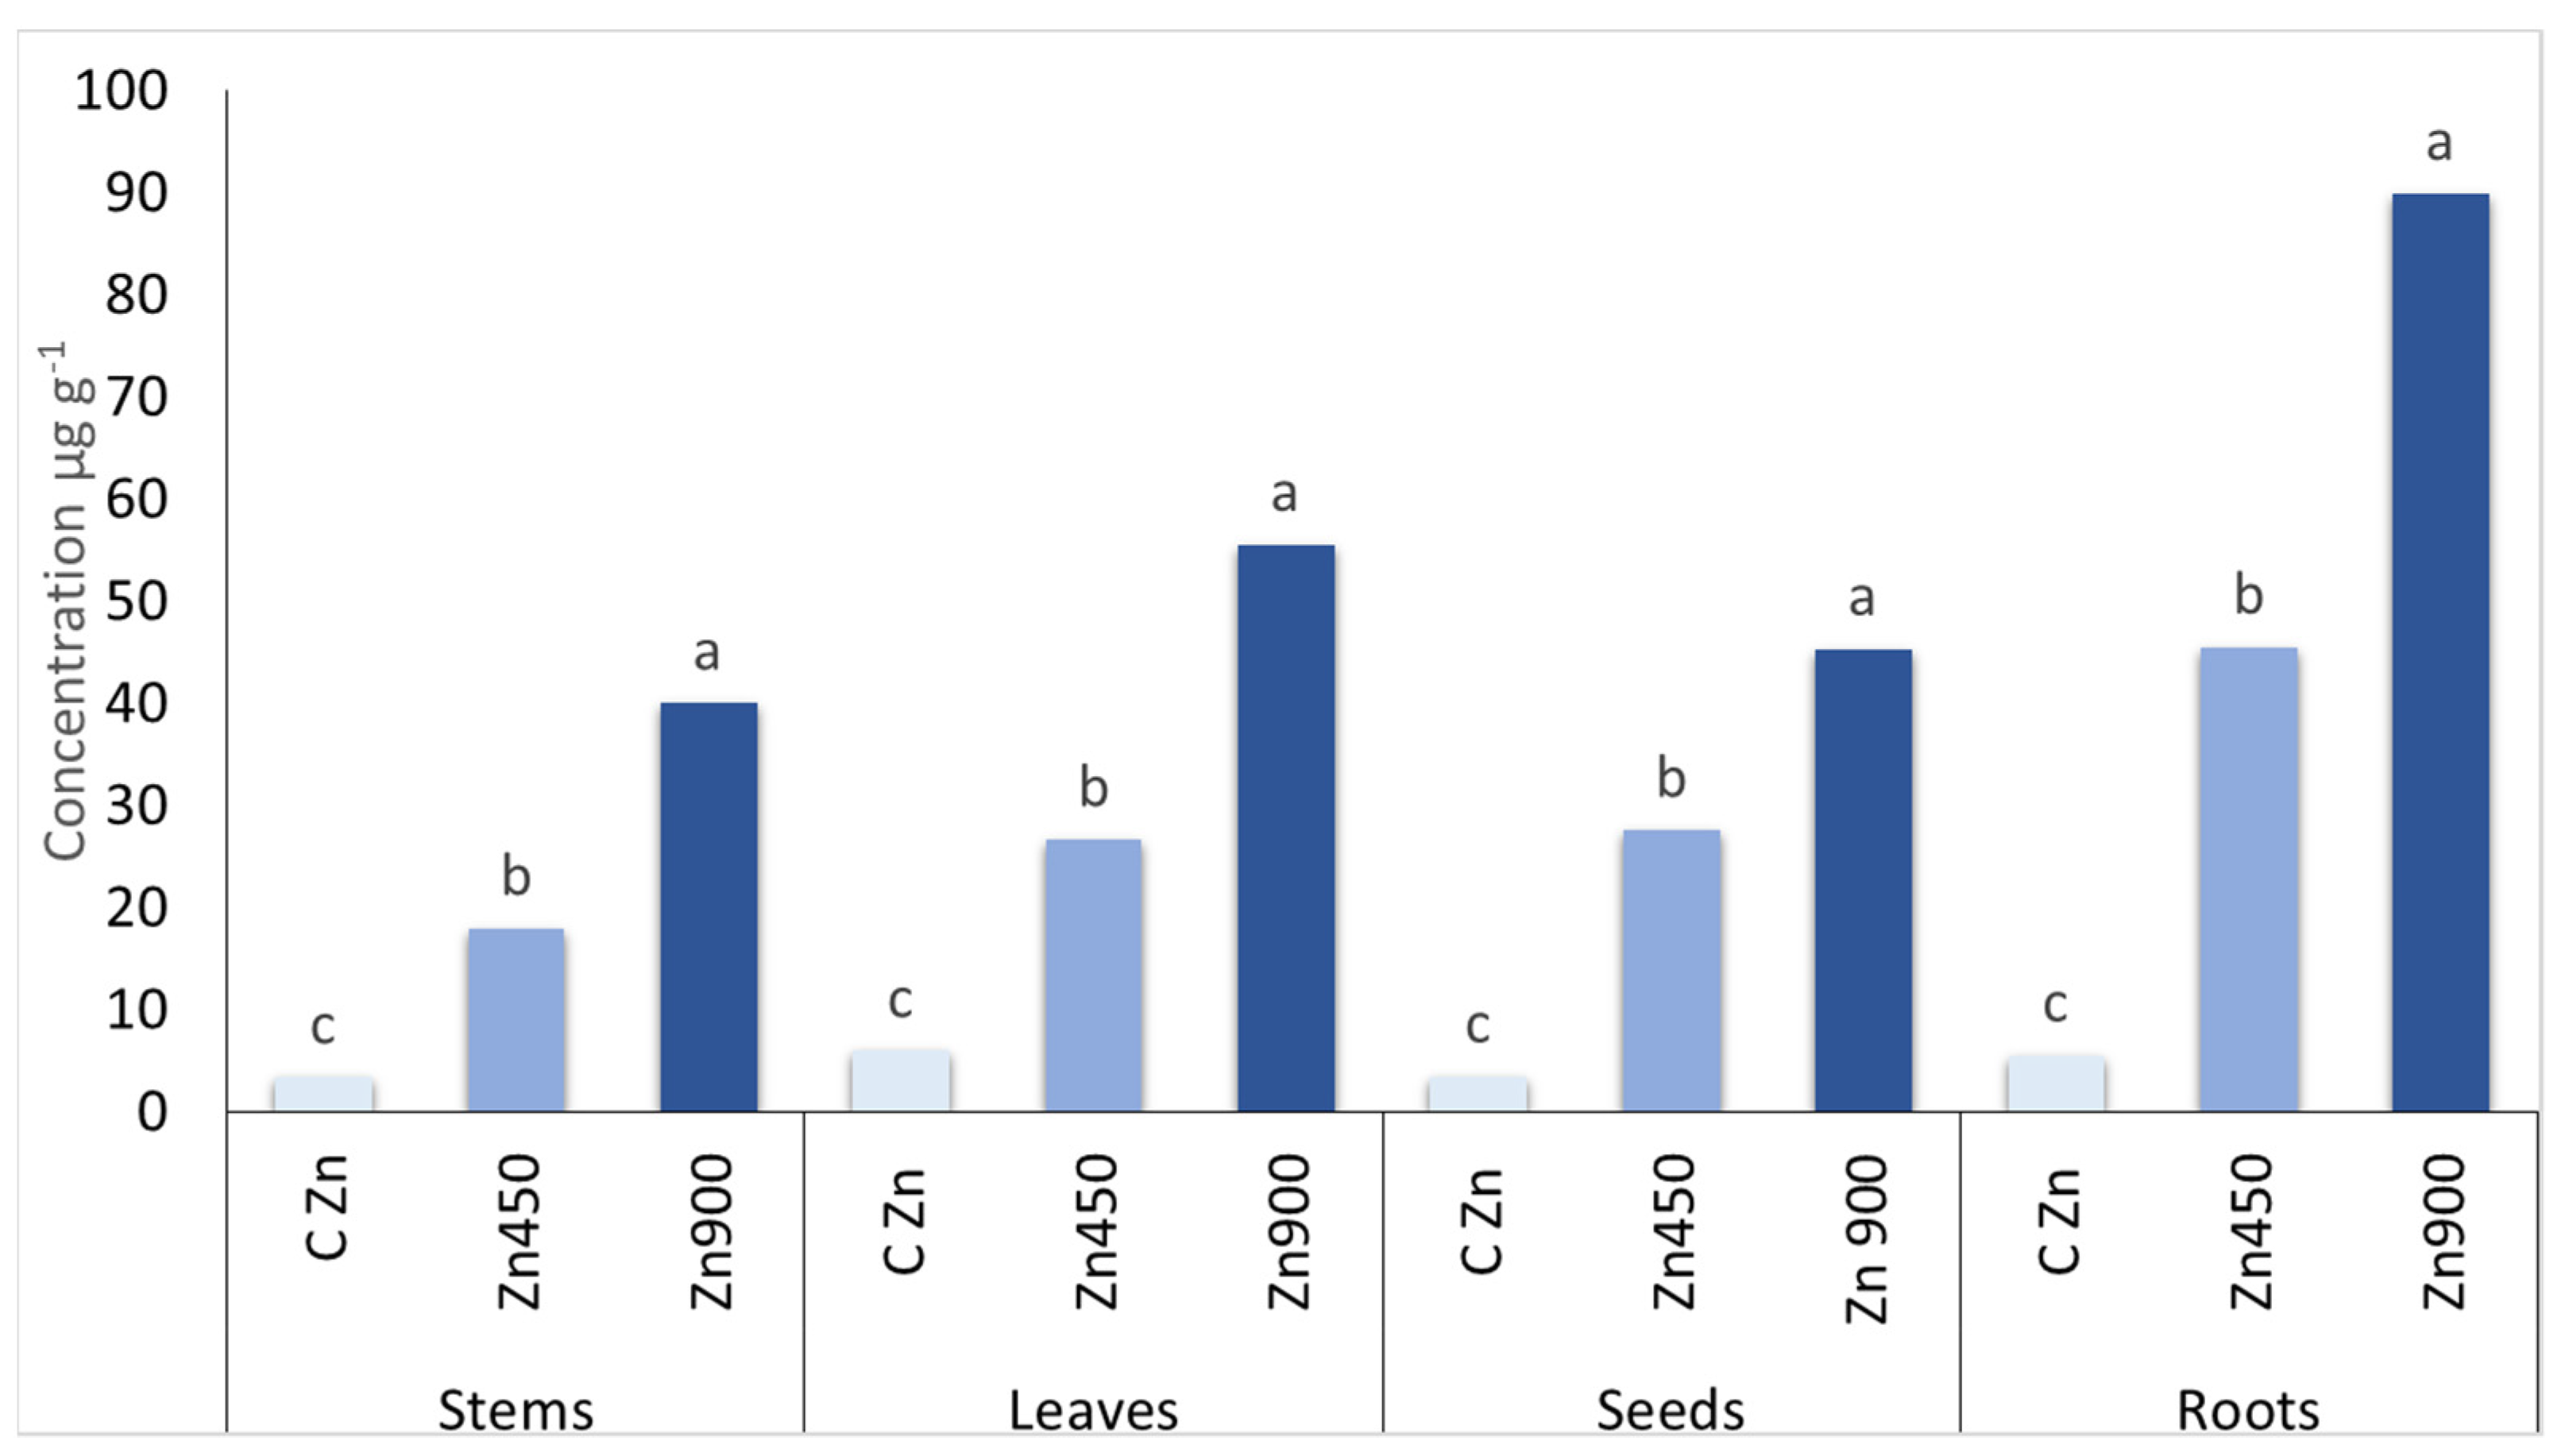
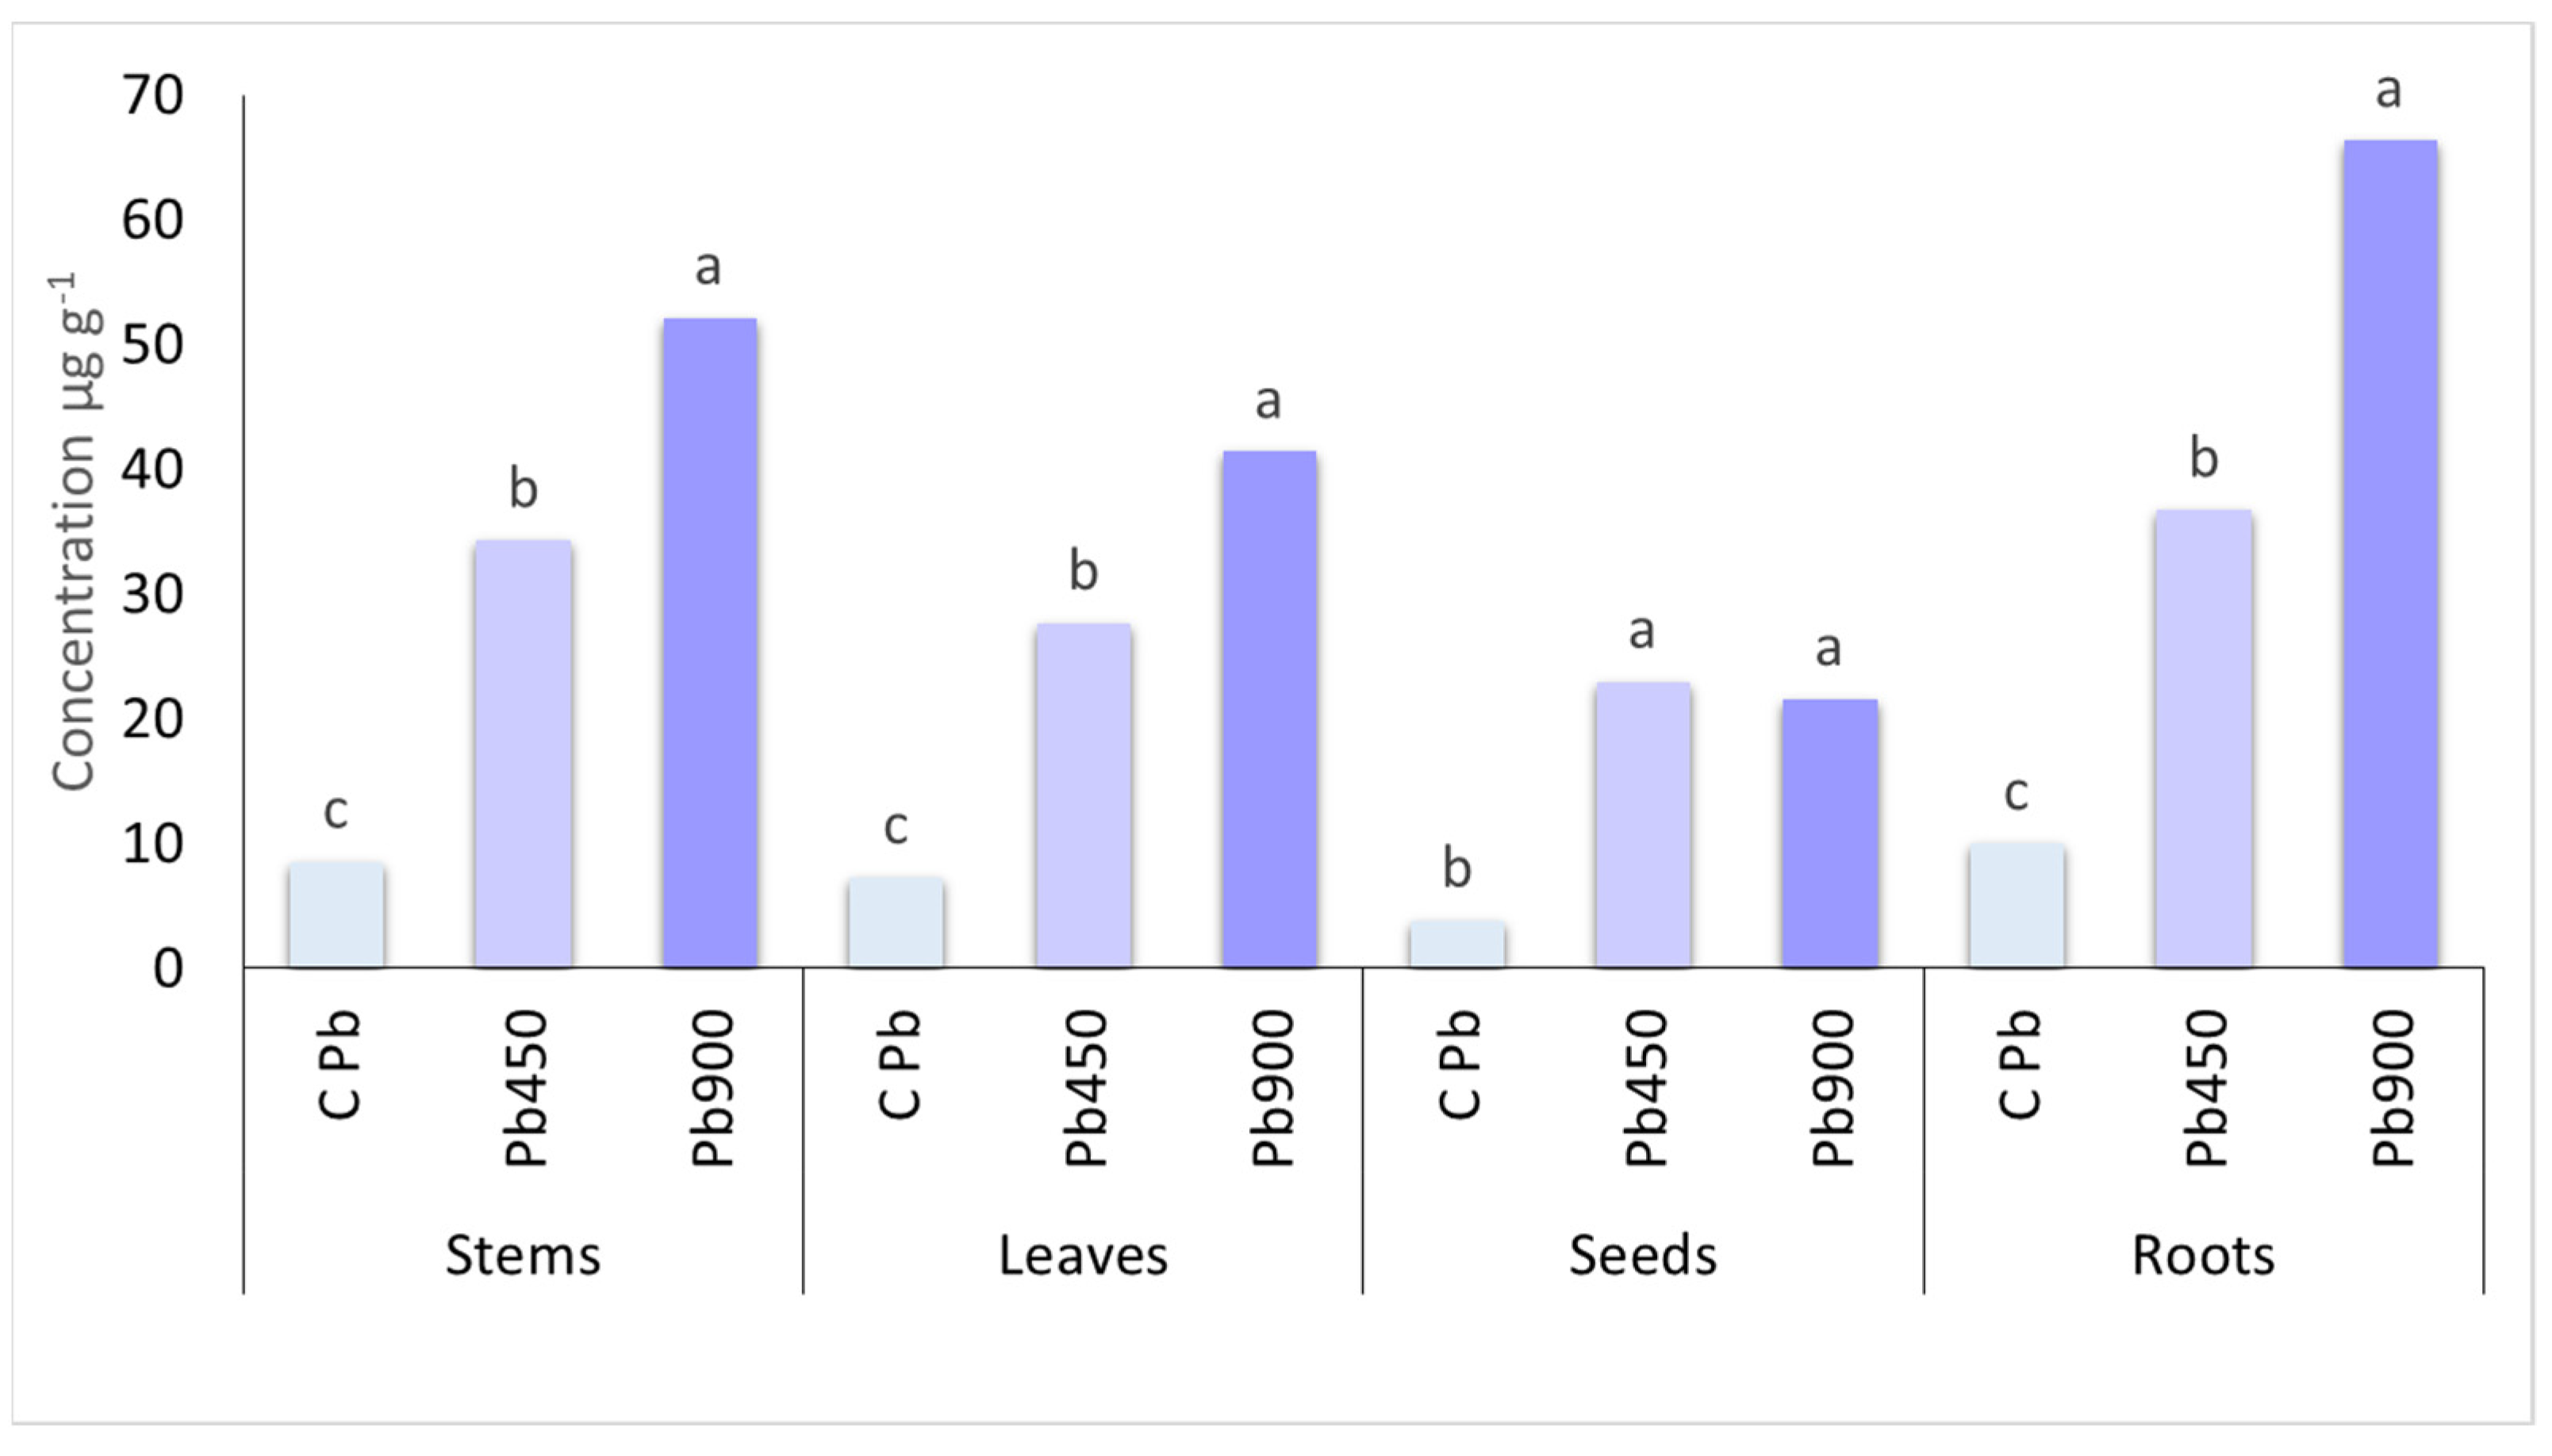
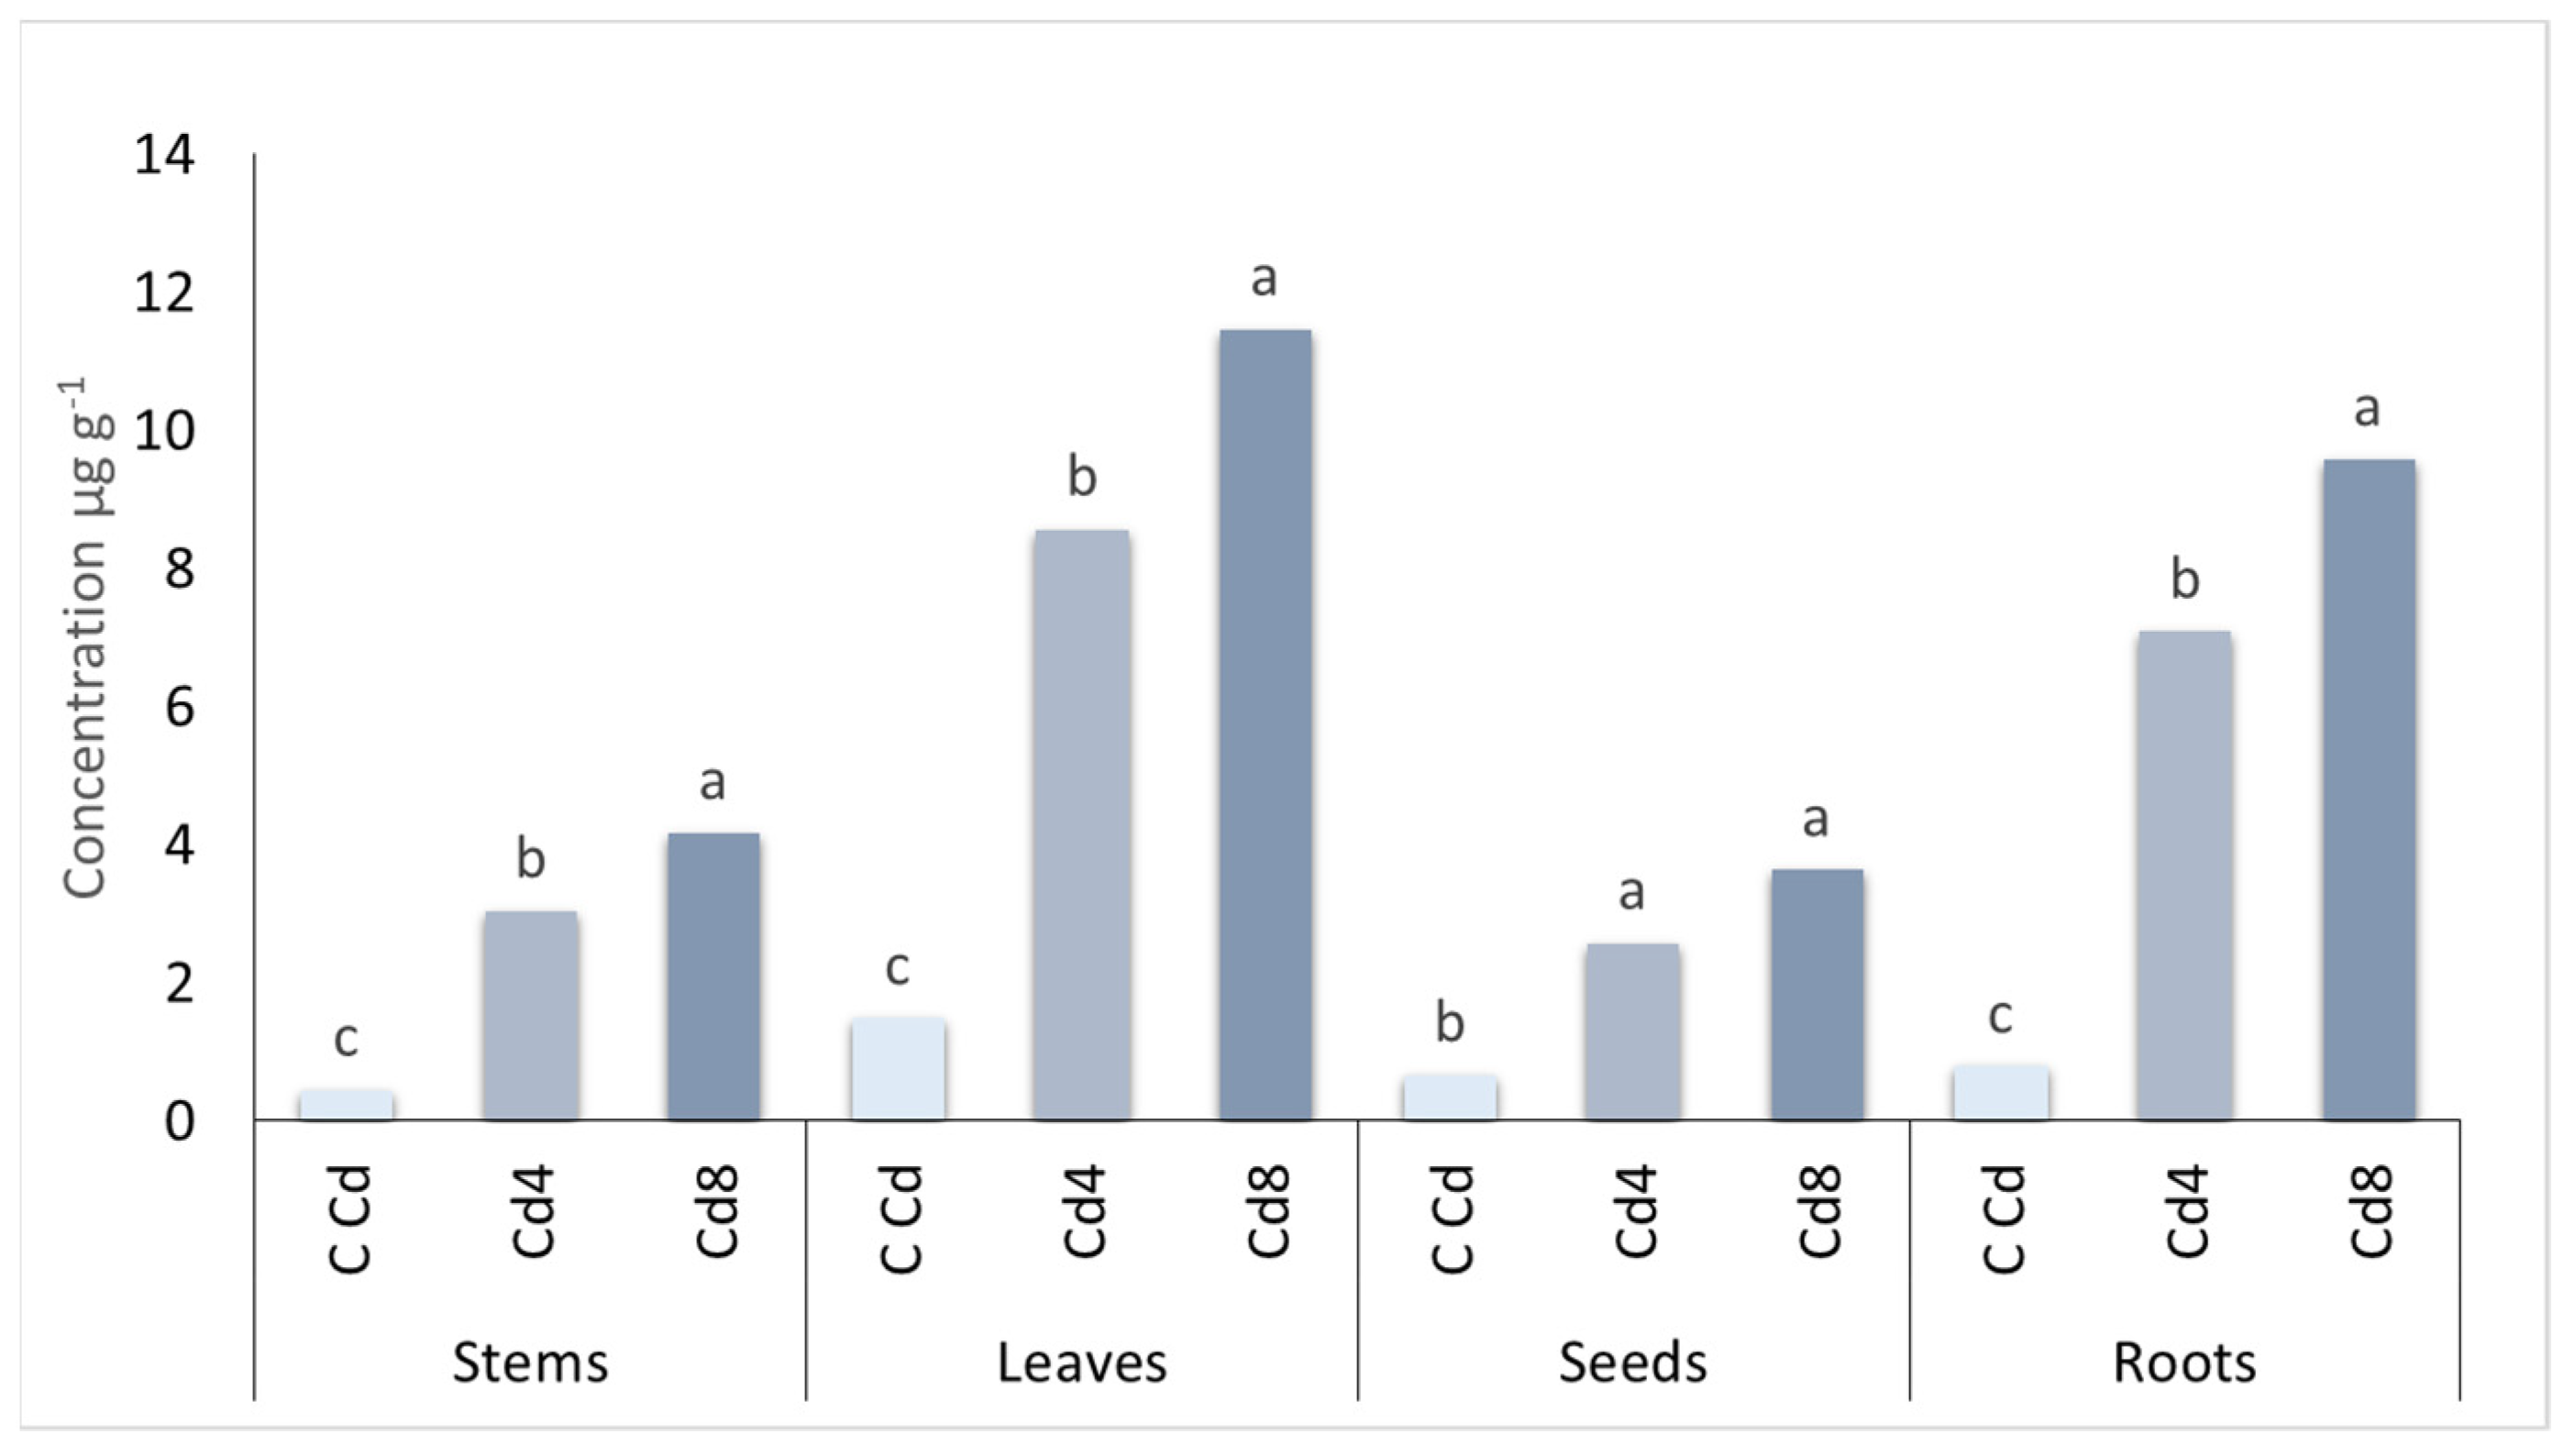
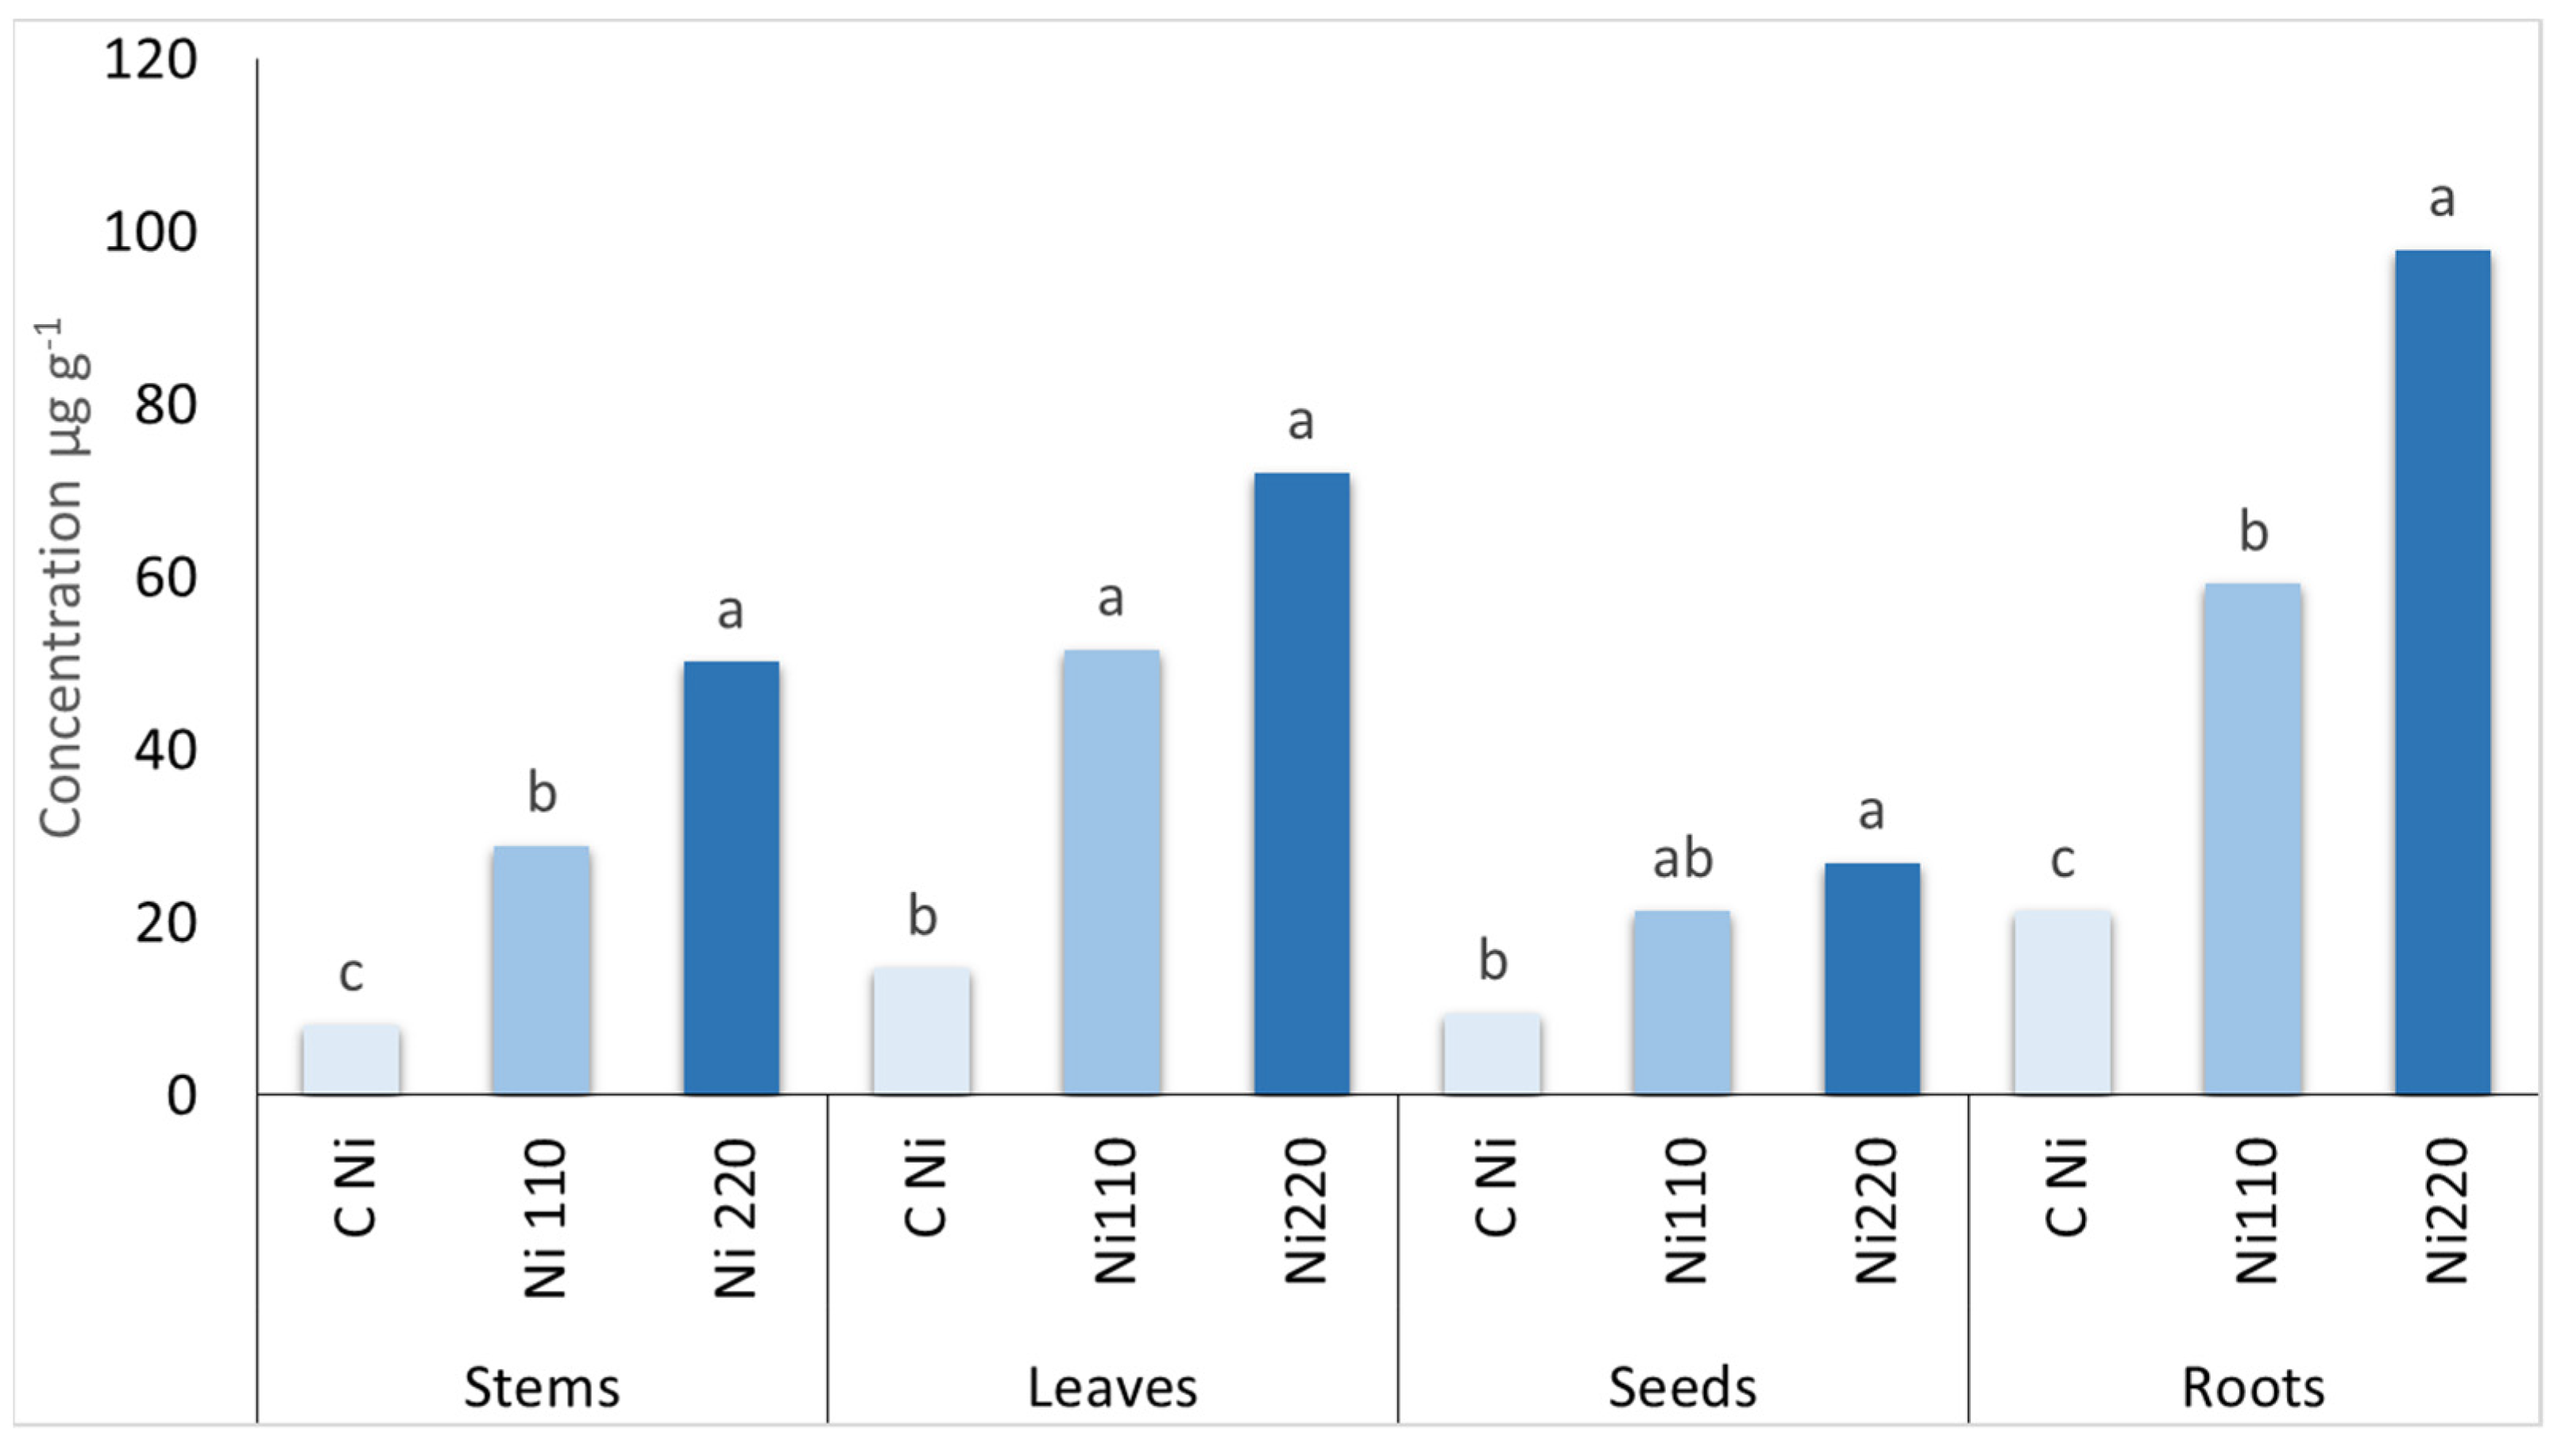
3.3. Heavy Metal Uptake per Plant and Amount of Heavy Metal Extracted

The heavy metal concentration in the plants showed differences among the four contaminants. Higher heavy metal concentration in the soil induced a higher concentration of the contaminant in plant organs, denoting the bioaccumulation potential of safflower. In addition, different heavy metals induced a variation in the partitioning of heavy metals uptaken into the plant organs caused by the different mobility of the contaminants.
In Zn-contaminated soils (Figure 3), the highest concentration was observed in roots, in comparison with leaves, stems, and seeds. The two levels of Zn led to a significant reduction in all biomass components (Table 5). In the first year, the concentration of Zn in the roots was seven times higher in the treatment Zn450 than in the control, and in Zn900, the concentration in the roots was twice Zn450. The same trend was observed in the second year’s roots partitioning when zinc concentration was ten times larger than in the control in Zn450 and more than twenty-one times larger in Zn900 than the control.
A similar result was observed in Pb-contaminated soil (Figure 4), where the highest heavy metal concentration was observed in roots (Table 6). The concentration of Pb in soil affected the concentrations in stems, leaves, and roots, while it was not significant for the concentrations of Pb in the seeds. The accumulation in Pb450 plants was 30.3% of the total Pb uptake in the roots, 28.2% in the stems, 22.7% in leaves, and 18.8% in seeds. The accumulation in Pb900 plants was 36.0% of the total Pb uptake in the roots, 28.9% in the stems, 23.2% in leaves, and 11.9% in seeds.
Compared with the control, the Pb accumulation in the different parts of the plant was four to seven times higher for Pb450 and Pb900, respectively.
A different result was observed in Cd treatments (Figure 5), where the highest heavy metal concentration was observed in the leaves, indicating the ability to translocate the uptaken Cd from the roots to the leaves.
The concentration in the stem, leaves, and roots showed significant differences between the two years of the experiment and between low and high concentrations in the soil, while the concentration in the seeds did not differ significantly between low and high concentrations in the soil (Table 7).
The accumulation in the leaves was 40.2% and 39.9% of the total Cd uptake for Cd4 and Cd8, respectively. The accumulation in roots was lower, 33.3% and 33.2% for Cd4 and Cd8, respectively. The translocation of cadmium in seeds was lower than 15% of the total uptake in both soil concentrations.
In Ni contaminated soils, the highest concentration of heavy metal was observed in the roots, followed by leaves, stems, and seeds (Figure 6). In the Ni220 treatment, the concentration of Ni in the roots was six to eight times more than the control treatment.
The concentration in the stems and roots showed significant differences between the two years of the experiment and between low and high concentrations in the soil, while the concentration in leaves and seeds did not differ significantly between low and high concentrations in the soil (Table 8).
In Ni110 treatment, the plants accumulated the heavy metal mainly in the roots, reaching the 36.8% of total Ni uptake. The amount of Ni accumulated in the leaves reached 31.8%.
Roots accumulated a higher share of total Ni uptake in the Ni220 treatment, reaching 39.6%.
The amount of Ni stored in the seeds was below 15% of the total uptake in all the contaminated treatments, reaching the lowest value of 11.0% in Ni220.

3.4. Tolerance Index, Translocation Factor, and Modified Accumulation Index and Bioconcentration Factor of the Aboveground and the Belowground

The tolerance index shows the adaptability of safflower to being grown in soils contaminated with increasing concentrations of Zn, Pb, Cd, and Ni (Table 9). The tolerance index decreased at the highest concentration for all the contaminants. The highest tolerance index has been found in Pb treatments, followed by Ni and Zn, both at low concentration. The lowest scores of the tolerance index have been observed for Zn900, Cd8, and Ni220.
The ability to accumulate heavy metals in plant biomass was verified through the modified accumulation index, which relates the accumulation of heavy metals in the whole plant with the accumulation in the whole plant grown in the control soil. The mAI increased at higher concentrations for all four heavy metals tested. In the Pb treatment, a slight increase was observed, while at the highest concentration of Zn in the soil, the mAI was almost double compared to the lower concentration, showing that a Zn concentration of 900 mg kg-1 is not limiting for plant uptake.
The bioconcentration factor highlights the potential of safflower to accumulate heavy metals in the different parts of the plant in relation to the presence of bio-available heavy metals in the soil. The mBCF calculated for whole aboveground biomass showed a reduction at increasing concentrations of contaminants in the soil, with the exception of Zn. The same trend was observed for the mBCF calculated on the belowground biomass.
The translocation factor represents the ability to translocate the pollutant from the roots to the aboveground biomass. This index did not vary significantly between the two concentration levels of each contaminant, with the exception of Pb.

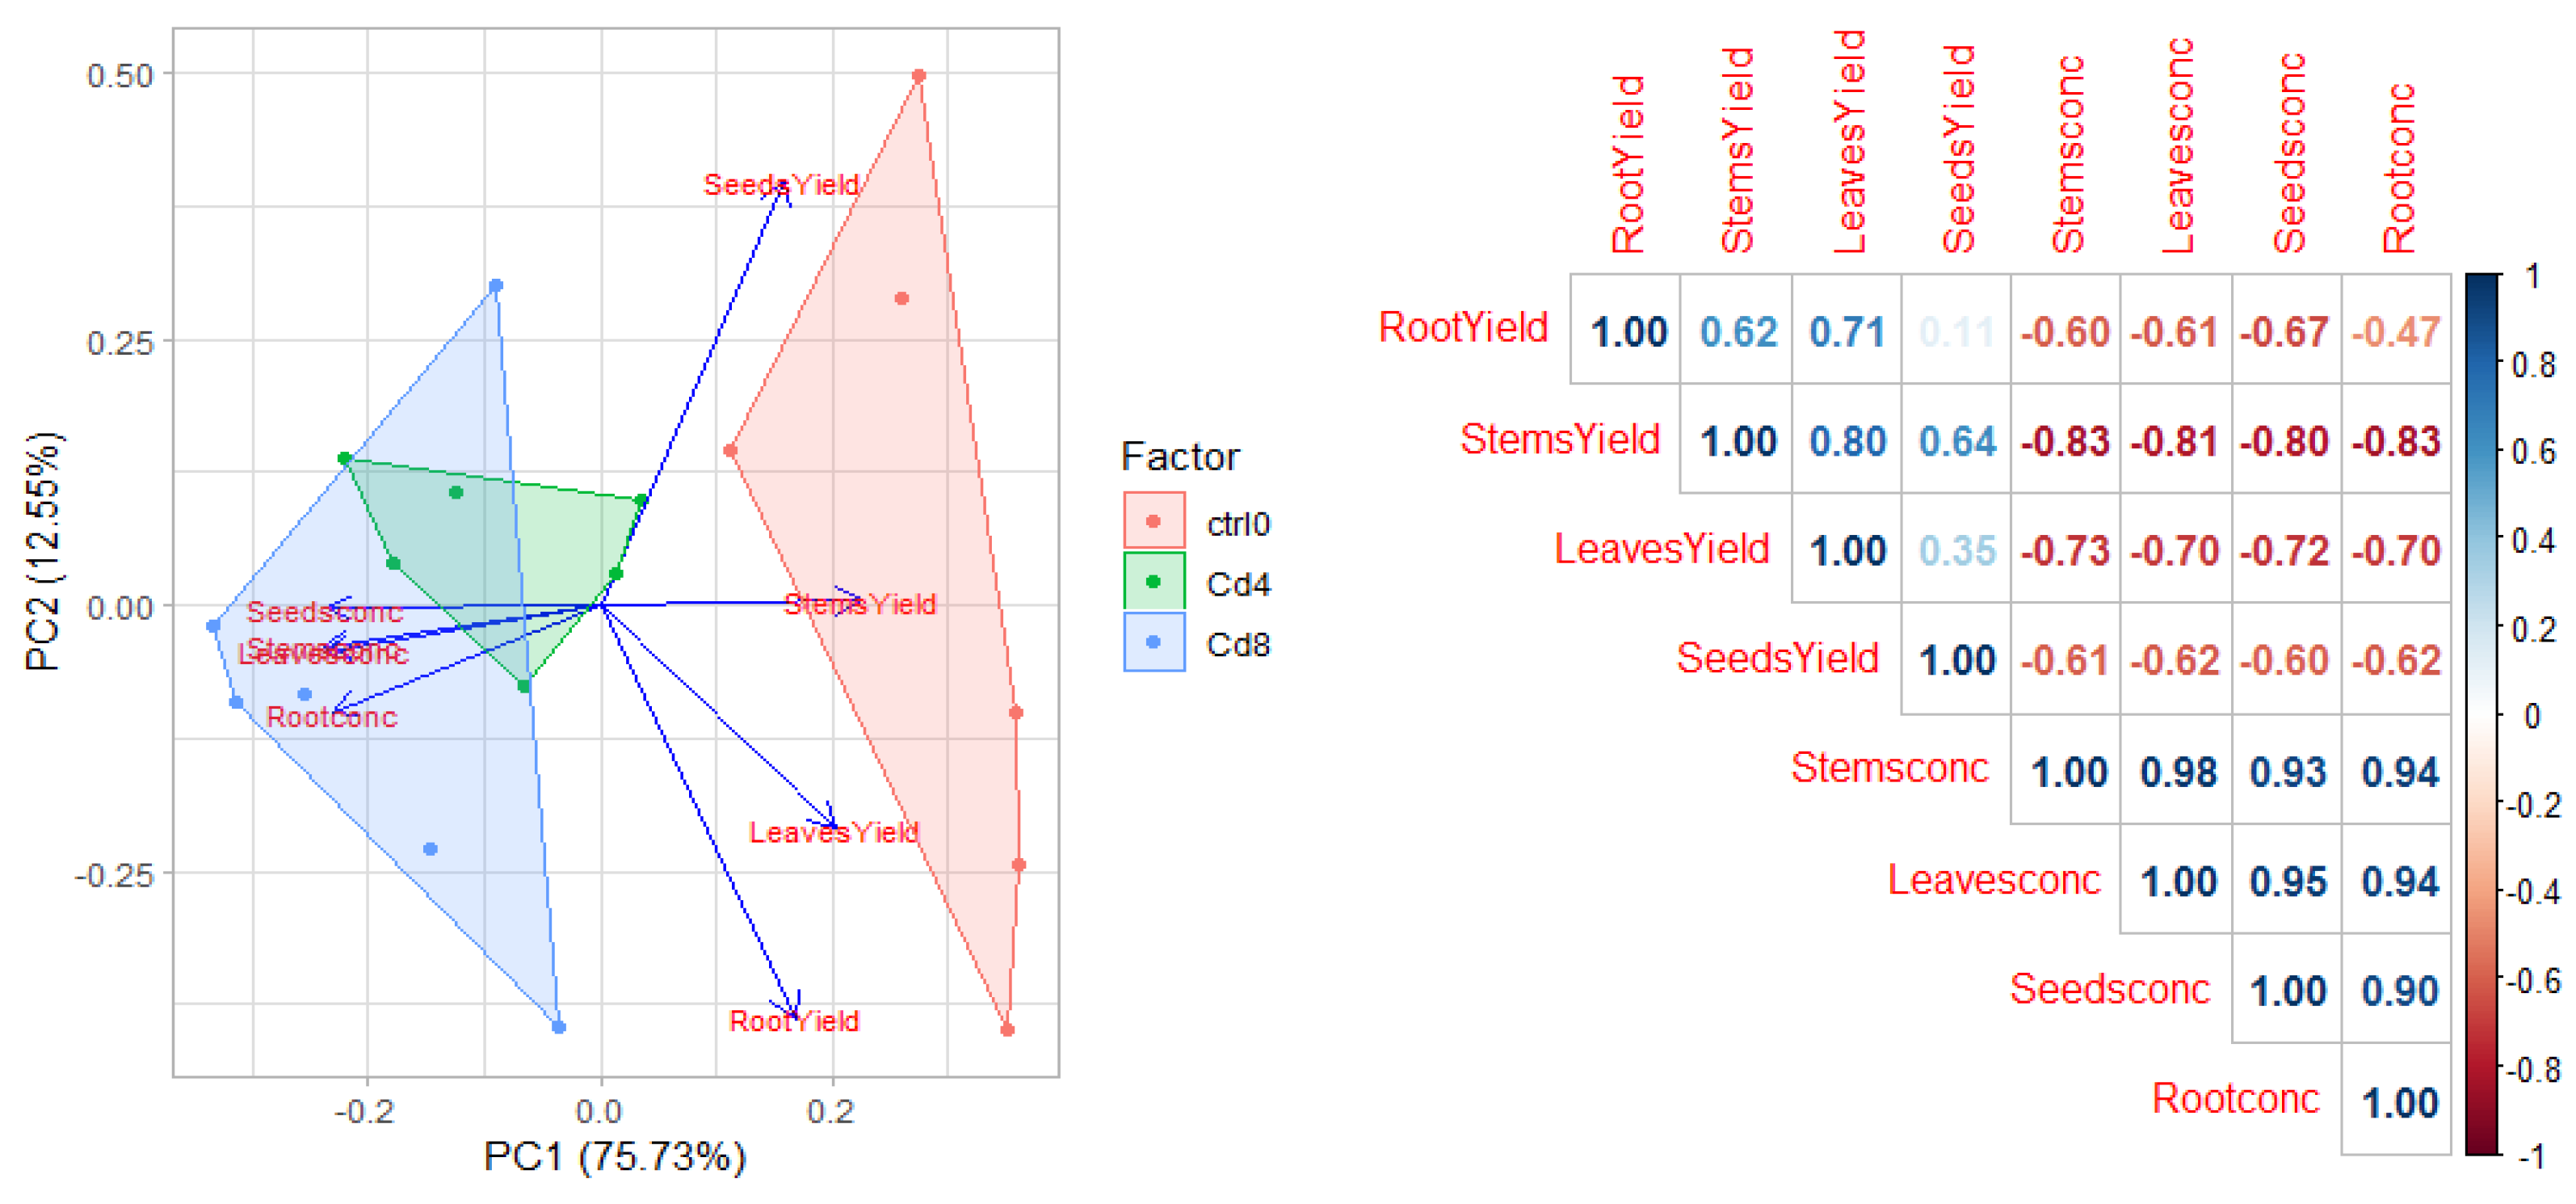
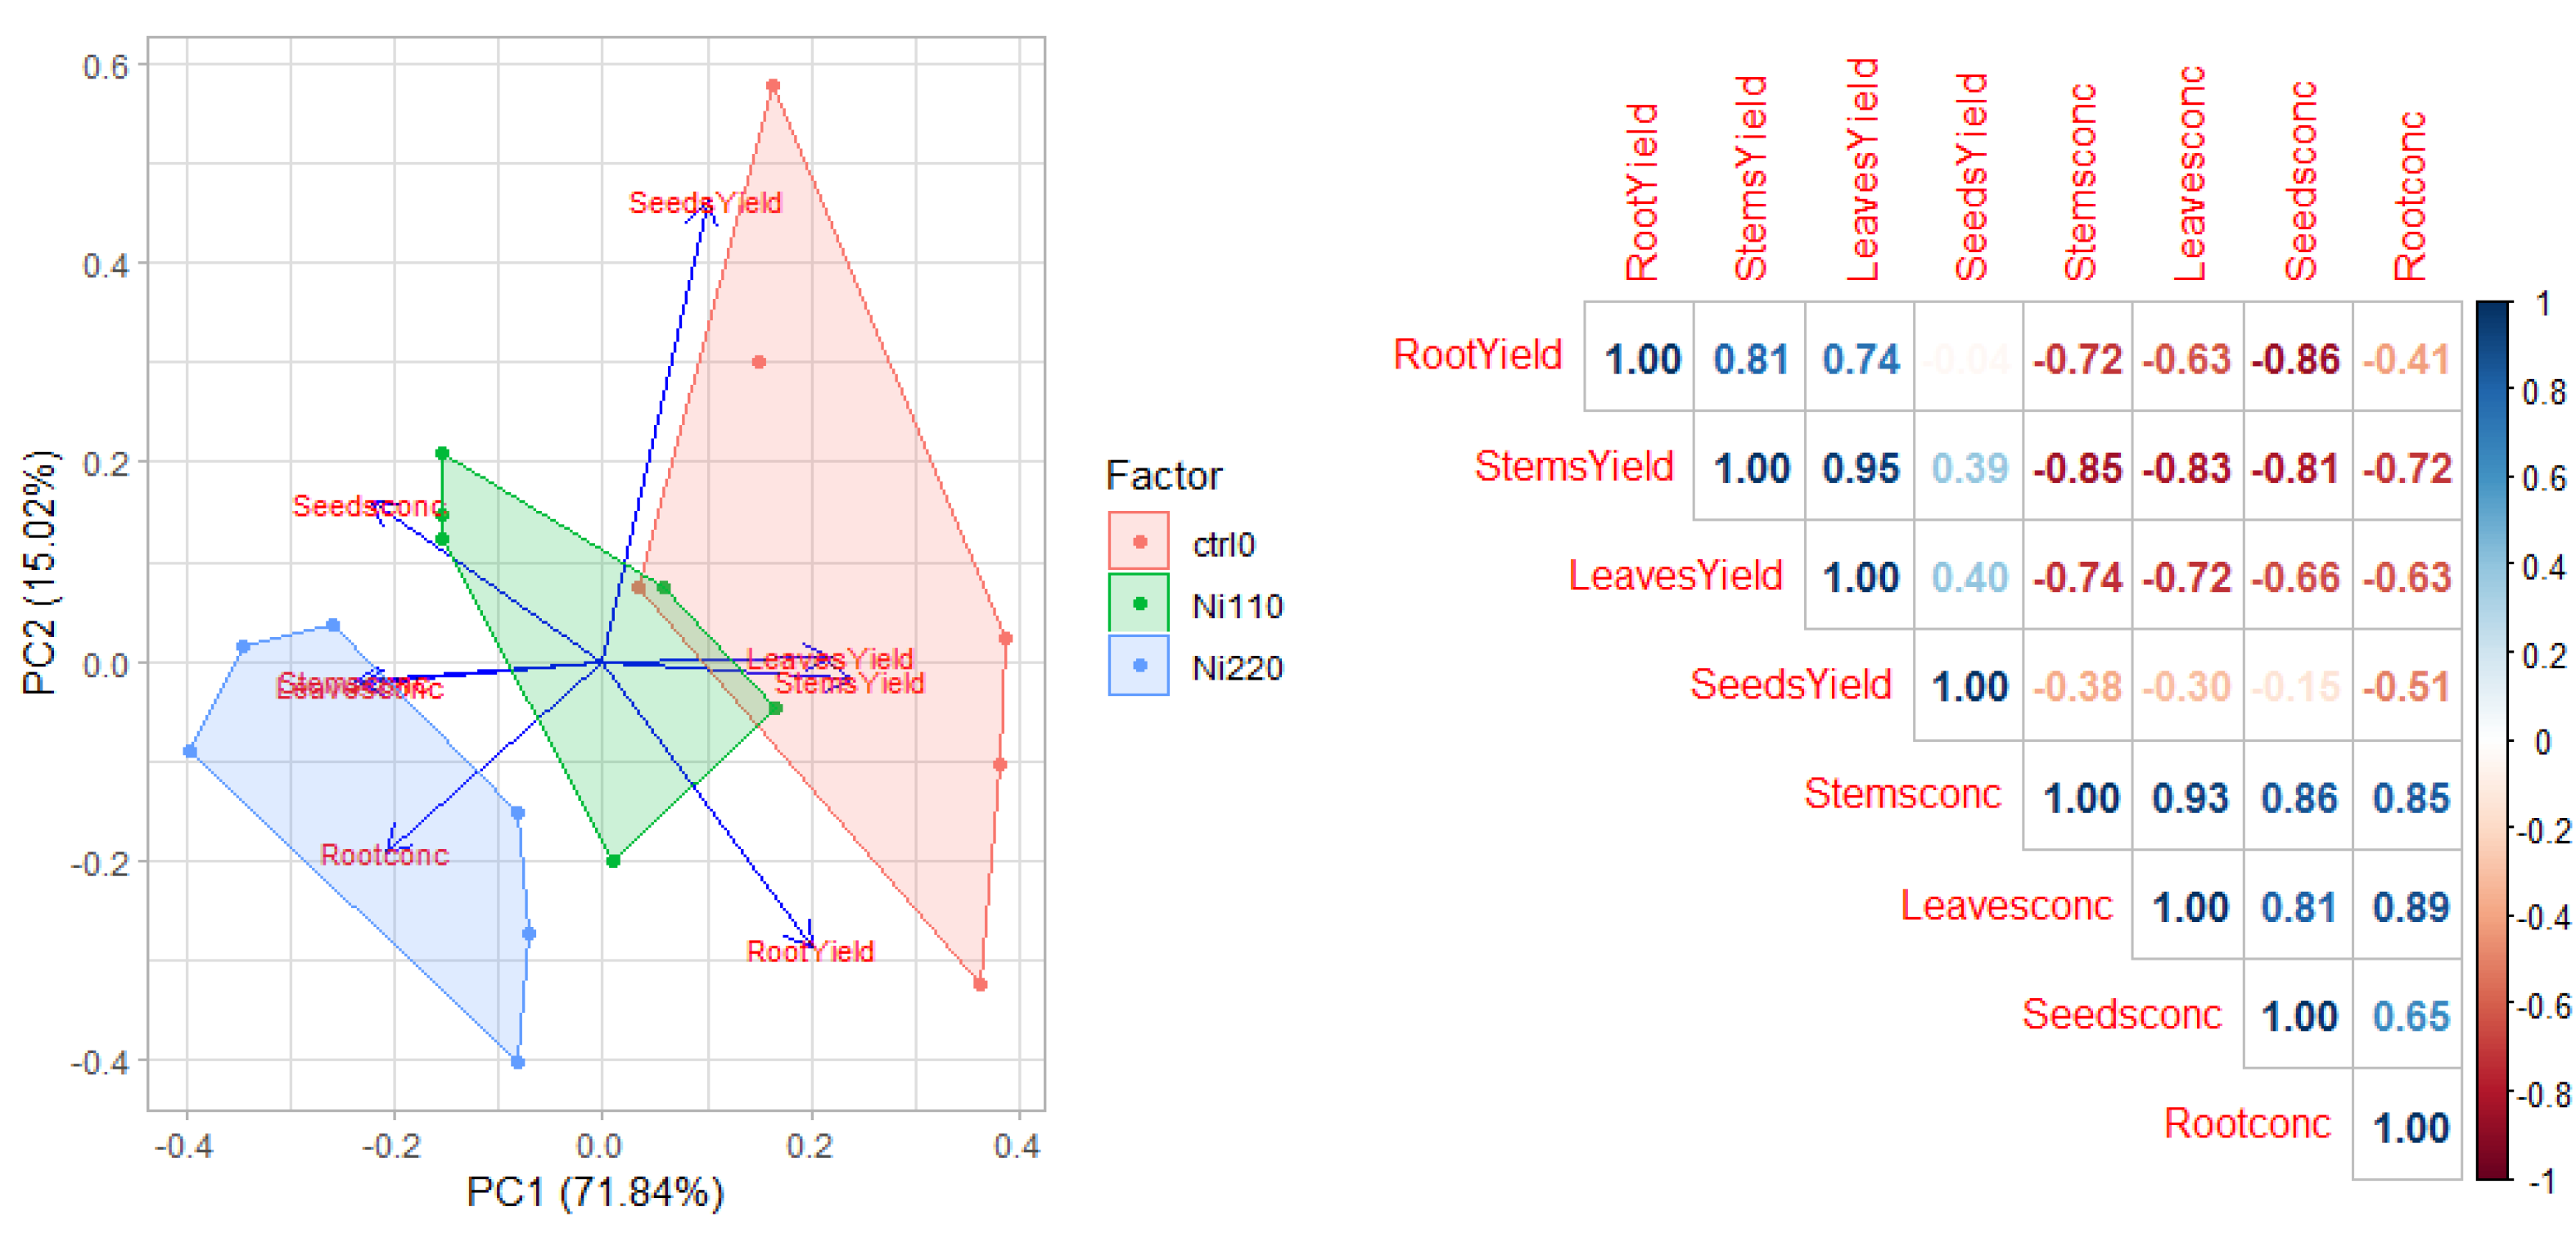
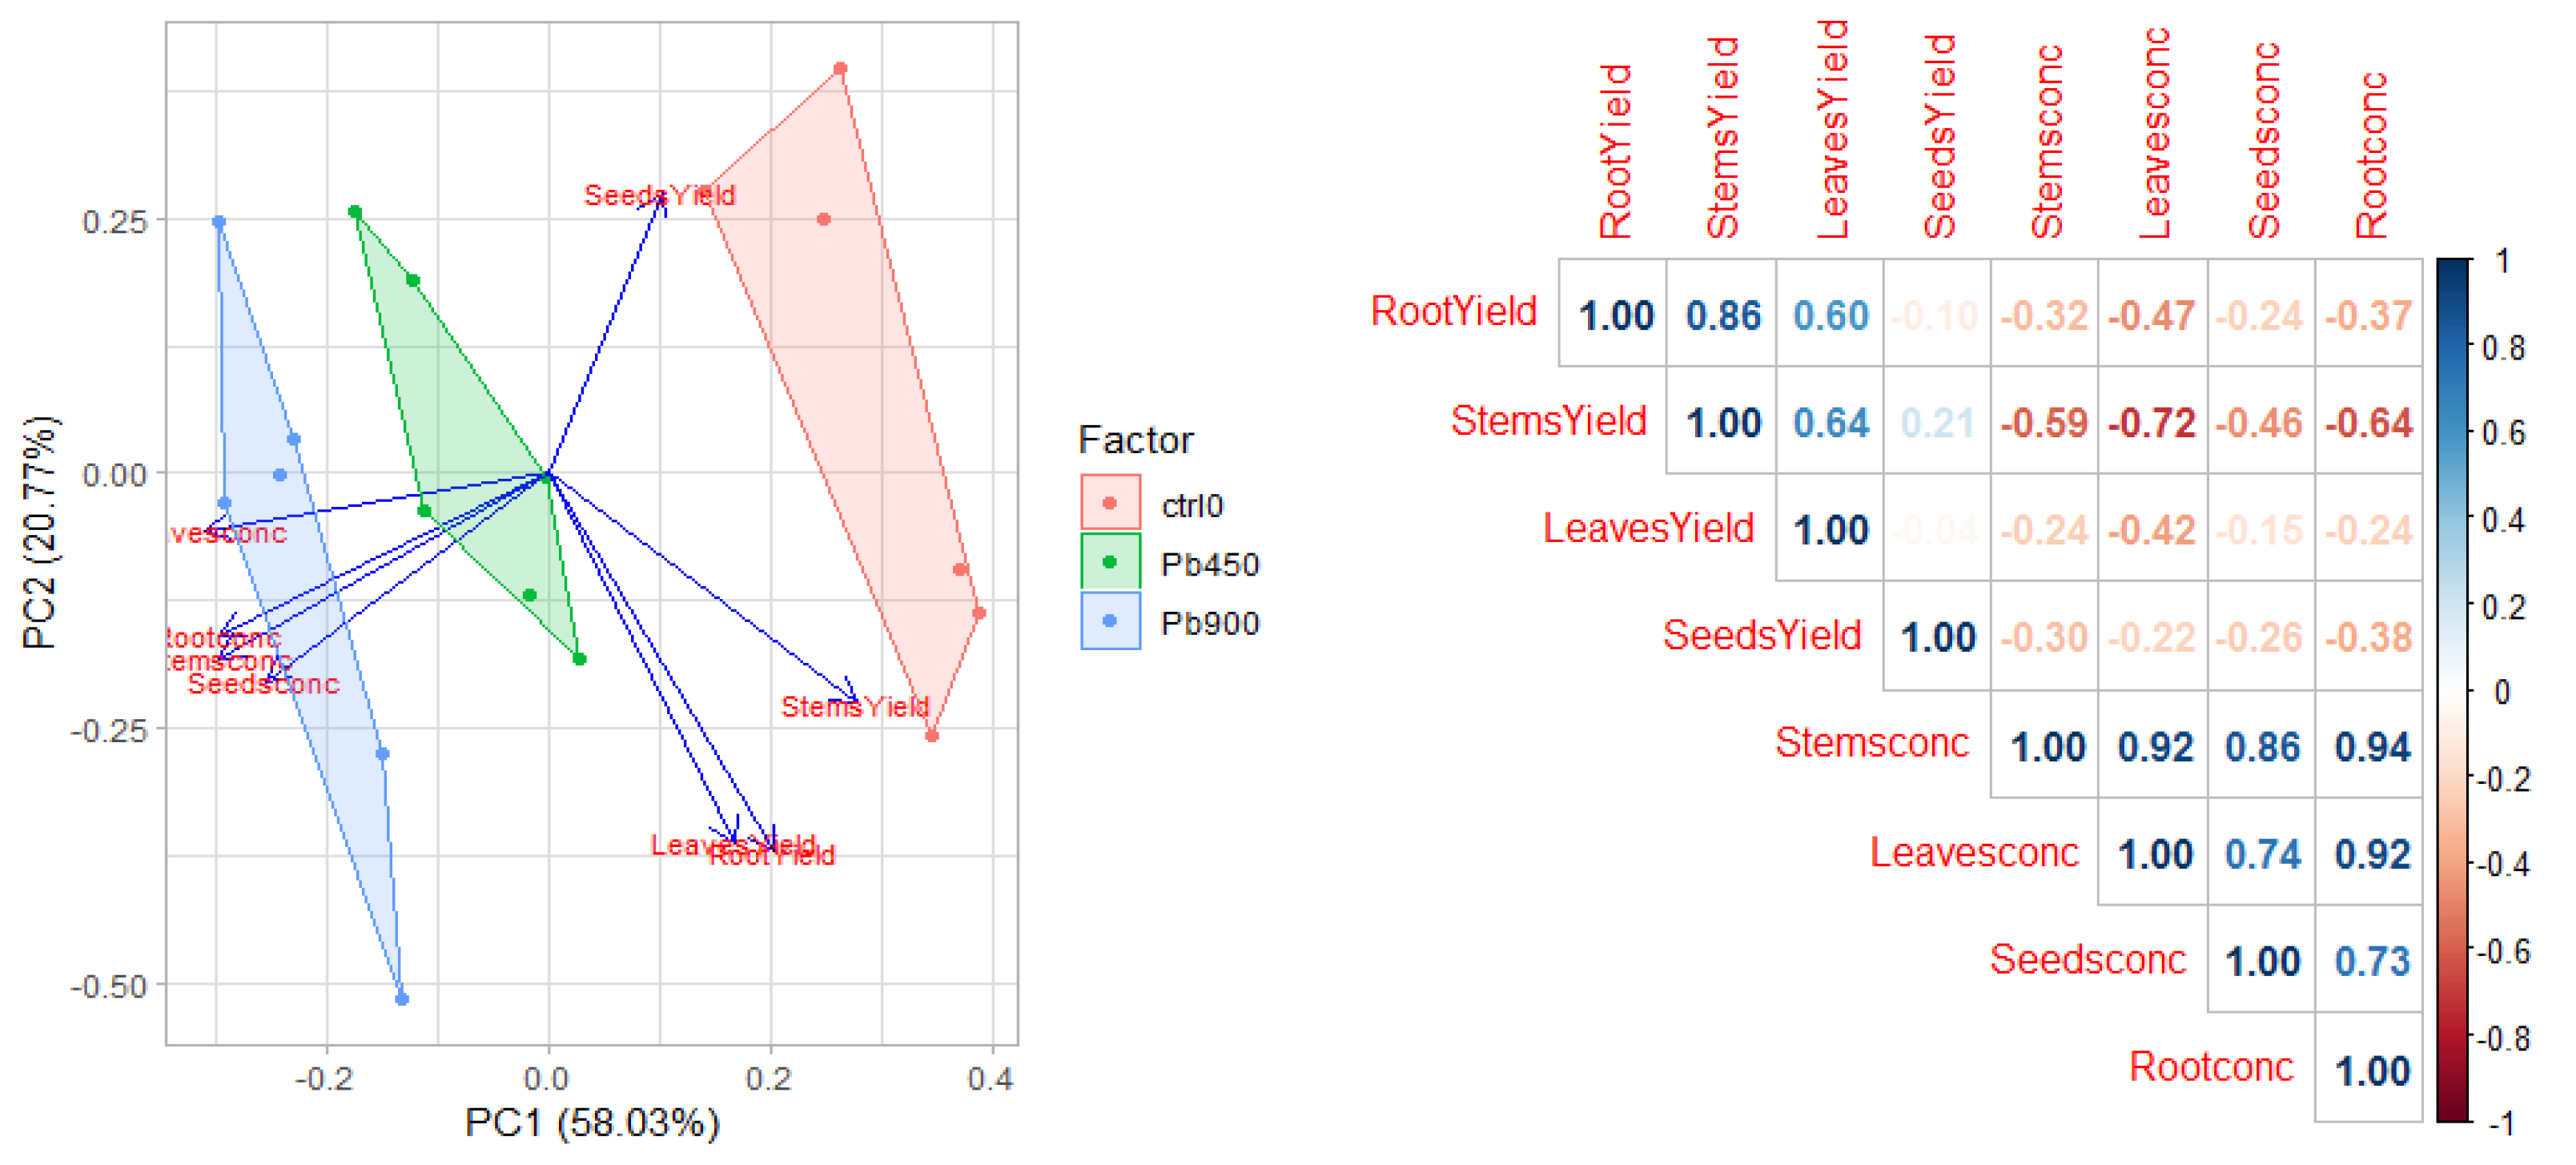
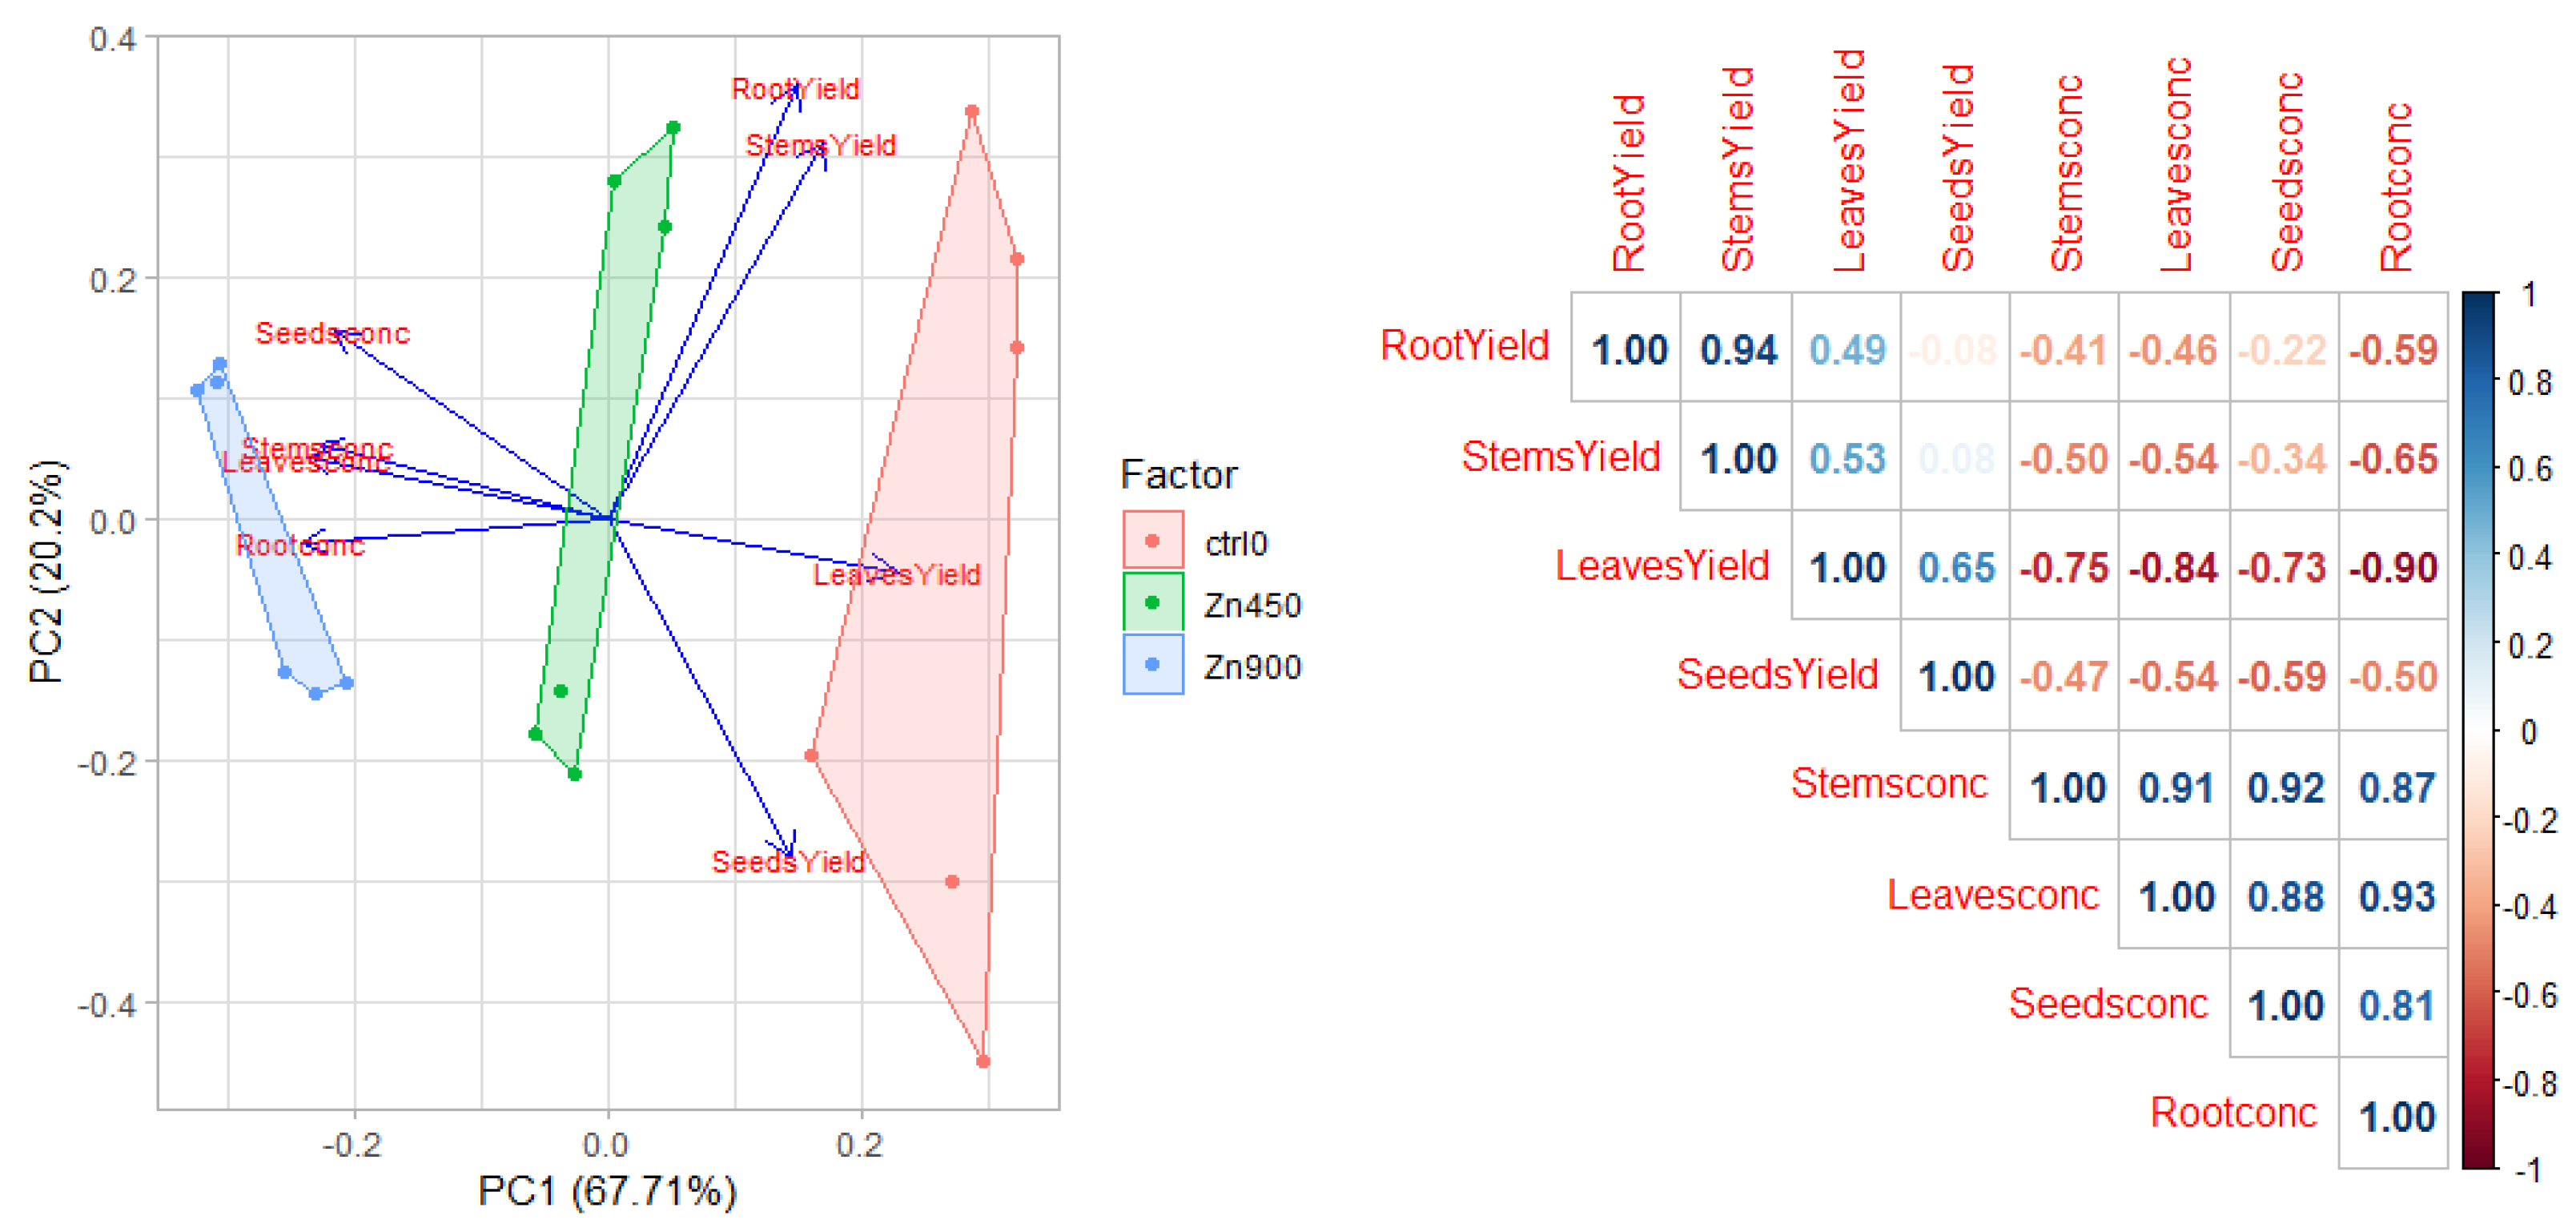
3.5. Tolerance and Phytoextraction Traits Evaluated with Principal Components Analysis and Multivariate Analysis

A principal component analysis (PCA) has been performed to evaluate the effect of the metal contaminants at several concentrations on several highly correlated variables (Figure 7, Figure 8, Figure 9 and Figure 10). In particular, the biomass yield components (stem, leaves, and root) are mutually correlated and inversely correlated to the contaminant concentration in the plant fractions (stem, leaves, seeds, and root yield). In addition, seed yield appears to be weakly correlated to the other biomass components’ yield, particularly root yield.
The first component of the PCA (PC1) describes between 73.5% and 61.6% of the total variance in the data in the Cd- and Pb-contaminated samples, respectively. PC1 direction coincides with higher biomass yield and lowers contaminant concentration in the plant organs.
For all metal contaminants, the control group does not overlap with the contaminated groups. The control group has high values of PC1, indicating higher biomass yield components and lower contaminant concentration in the plant organs. The contaminated groups have lower PC1 scores in relation to the concentration factor: the groups with the highest concentration factor have the lowest PC1 scores. In contrast, the groups with the lowest concentration factor have PC1 scores that are intermediate between the control group and those with the highest concentration factor. Considering the first and the second PCs, no overlapping has been observed between groups, excluding the samples contaminated with Cd.
In Ni-, Pb-, and Zn-contaminated samples, the root yield is the least influenced by the contaminant concentration, while flower and stem yields show the strongest negative correlation to the contaminant concentration. Cd contaminant concentration appears to be strongly anticorrelated with all biomass yield components.

3.6. Trend of the Four Heavy Metals Tested in Safflower

Safflower showed different behaviors regarding the accumulation and translocation of the heavy metals tested in this study.
Increasing concentration of contaminants in the soil led to an increase in the concentration of contaminants accumulated in all the organs of the plant for all the heavy metals tested.
Roots are the organs that accumulated most of the uptaken Pb, Ni, and Zn, while Cd has been translocated mostly in the leaves, decreasing the amount stored in the roots.
Concerning the aboveground biomass, leaves are the organs where most of the heavy metals are translocated, with the exception of Pb, which is translocated mainly to the stems. Low concentrations of Ni, Cd, and Pb were observed in the seeds, while Zn has been translocated evenly among the aboveground organs, seeds included.

4. Discussion

In general, heavy metals can be found in soils in different forms, such as free heavy metals and soluble metal complexes, associated with the organic matter in the soil as oxides, hydroxides, carbonates, or incorporated into silicate mineral structures [8,15]. To be absorbed by plants, heavy metals must be bioavailable in the soil. Bioavailability is determined by several factors: pH, soil organic matter, redox potential soil texture and structure, water flux, and soil microorganisms. This experiment was performed in soil rich in sand, with a high concentration of Fe and neutral pH. As reported by Huang et al. (2020), [29] pH, together with the presence of other metals in soils, has a main role in determining the availability of heavy metals in sandy soils and, therefore, the concentration of the metal ions. This experiment showed that the heavy metals bioavailable concentration in soils was at least 30% lower than the amount added to the soil.
Several studies confirm that Zn and Cd have similar chemical proprieties [2]. The results showed that Cd bioavailability was strongly reduced due to the soil proprieties. Even if Cd has higher mobility than Zn at a pH lower than 7.5, Cd absorbed in soils is not easily available [2].
Ni content was high in the control soil (33.53 mg/kg), in agreement with Kabata-Pendis [24]. However, due to the affinity with metallic Fe, they found higher content in semiarid regions, up to 53.8 mg/kg in soil with 4.6% clay content.
The content of bioavailable Pb in the experiment soil was low, causing its low mobility when compared with other trace metals. One of the reasons that contribute to the low mobility is soil pH. In alkaline or sub-alkaline soils, Pb may precipitate as hydroxides, phosphates, or carbonates, forming stable Pb–organic complexes. Therefore, the decrease in soil pH may increase Pb solubility.
A decrease in safflower yield was observed during the first year, caused by a one-month delay in sowing time, as reported by Patane et al. 2020 [30], who found that safflower is significantly affected by the time of sowing, showing an optimum in late winter and a decrease in plant productivity for later sowing.
Regarding the productivity in the contaminated pots, a decrease in yield was observed, particularly in Zn-contaminated soil, in both years of the experiment. A similar result was also observed in Namdjoyan et al. (2017) and Manvelian et al. (2021) [12,31], where Zn treatment significantly reduced roots and shoot biomass production compared to the controls. Zn inhibits photosynthesis in several ways, such as substituting Mg2+ in chlorophyll (Chl) or inducing Fe deficiency [32].
The highest Zn accumulation in safflower was measured in the roots, followed by the leaves, the seeds, and the stems. Goodarzi et al. (2020) [33] conducted an experiment to study Zn-stressed safflower seedlings. The depletion of non-enzymatic antioxidants content and the decreased activity of enzymes involved in the antioxidant defense and the glyoxalase systems may also be associated with the lower Zn concentration in the plants supplemented with salicylic acid, nitric oxide, and melatonin, which are signaling molecules that can increase plant ability to tolerate the HMs’ stress-induced toxicity [27].
In Ni-contaminated soil, safflower showed significant yield reduction, particularly at the highest concentration in the soil. Al Chami et al. (2015) [34] reported that Ni was more toxic than Pb and Zn in the studied plant species: no growth of safflower was observed at Ni concentration above 10 mg L−1. In Baran et al. (2022) [35], Carthamus species accumulated Ni in descending order as root > stem > leaf under all tested concentrations. Ni contents in root and shoot tissues of both species progressively increased in a concentration-dependent manner. These results demonstrated that large amounts of Ni were accumulated primarily in the roots and marginally in the plant’s other organs due to the low translocation between plant organs. In this experiment, a similar concentration of Ni was observed in roots and leaves at a low soil concentration. Whereas, at a high concentration of Ni in the soil, the highest concentration of the heavy metal within the plant organs was observed in the roots. Baran et al. (2022) report that Ni acts as a plant micronutrient at low soil concentrations; however, it can cause toxic effects, reducing shoot and root lengths and yield at high concentrations. In general, the bioavailability of Ni depends on its oxidation state. Afzal et al. (2021) and Hassan et al. (2019) [36,37] found that absorbed Ni is effectively stored in leaves and seeds.
Cadmium induced the highest stress to safflower plants, significantly reducing the dry weight at high soil concentrations. Z. Amjadi et al. (2021) [38] reported a severe decrease (56%) in shoot and root biomass yield in Cd-stressed safflower in comparison with the control. Namdjoyan et al. (2011) [39] reported a direct relationship between Cd-induced toxicity tolerance with higher accumulation of this element in roots and the prevention of its transferring to the aboveground parts of the plant.
The concentration of Cd in safflower differed from Shi et al.’s [40] experimental results. They reported good adaptability of safflower to Cd-contaminated soil and demonstrated that most Cd was found in the roots. However, substantial amounts were still found in the shoots, showing that it is a hyperaccumulator.
Finally, safflower yield was not particularly affected in Pb-contaminated soil. One reason for the Pb tolerance in safflower can be ascribed to the low mobility between roots and aboveground organs. For example, Al Chami et al. (2015) [34] reported that safflower was not affected in all the productivity parameters in soil contaminated by 5 and 10 mg kg−1 of Pb; while at higher concentrations (25 mg L−1), the plants were not growing.
The tolerance and accumulation indices, the mBCF, and the TF indicate the ability of safflower to tolerate and accumulate heavy metals. The accumulation index increased at higher soil concentrations of Cd, Ni, Pb, and Zn. In contrast, the tolerance index decreased at higher soil concentrations for the four heavy metals.
The TF showed a differentiated behavior in relation to the heavy metal: no response to concentration was observed for Zn and Cd. In contrast, a decrease at higher concentrations was observed for Pb ad Ni. The mBCF decreased at higher concentrations of Cd, Ni, and Pb, while the belowground mBCF increased at higher Zn concentrations.
Results showed that safflower could grow in a wide range of heavy-metal-induced abiotic stresses. Depending on the heavy metal, safflower has adopted different mechanisms to accumulate or stabilize the contaminant through the different fractions of the biomass in the soil. However, exploring the data through phytoremediation index and factors, PCA analysis and correlation matrix helped to understand the behavior of safflower in soil contaminated with Zn, Ni, Cd, and Pb. Leaves and stems yields showed the strongest negative correlation to the contaminant concentration, while the root yield was the least influenced by the concentration of the heavy metal, explaining that safflower is still able to store the heavy metals in the belowground of the biomass at raised concentrations of pollutants in the soil. This result was also confirmed by the accumulation index that increased with the level of heavy metal in the soil and from the translocation factor, which showed that safflower accumulates more contaminants in the belowground biomass, reducing its ability to transport to the aerial part of the plant. Cd contamination concentration appears to be strongly anticorrelated with all biomass yield components.
This study highlights the possibility of further research concerning bioenergy production using contaminated safflower as a feedstock, as Gomes et al, (2022) [23] investigated the potential of bioenergy production of contaminated biomass. Some studies have already proposed safflower biomass for biogas or bioethanol production, while the oil extracted from safflower seeds has been suggested for biodiesel production [41]. Several methods to produce biogas or bioethanol have been investigated [39] and can be applied in contaminated safflower biomass to produce bioenergy.

5. Conclusions

The results showed safflower’s suitability for biomass production under heavy metal contamination. Moreover, the plant’s ability to accumulate heavy metals and translocate them to the aerial biomass highlights its potential for the phytoextraction process.
Low heavy metal accumulation in safflower seeds suggests the possibility of using the seeds in the bioenergy conversion process, avoiding the concerns about contaminant dispersion. The possibility of valorizing safflower residues such as stems and leaves by converting them into biofuels or bioproducts increases the interest in this crop. It is essential to explore the economic viability of its utilization for the phytoremediation process. Future investigation on bioenergy products produced with the contaminated biomass of safflower could help to obtain valuable feedstock from soils not suitable for food crops.

Supplementary Materials

The following supporting information can be downloaded at: https://www.mdpi.com/article/10.3390/agronomy12102302/s1, Table S1.

Author Contributions

Conceptualization, G.T. and B.R.C.; methodology, G.T. and B.R.C.; validation, G.T.; formal analysis, S.A.C. and B.R.C.; investigation, B.R.C., S.A.C., G.T.; resources, S.L.C. and G.T.; data curation, B.R.C., S.A.C., G.T.; writing—original draft preparation, B.R.C., S.A.C., G.T.; writing—review and editing, B.R.C., S.A.C., G.T., S.L.C.; supervision, G.T. and S.L.C.; funding acquisition, S.L.C. and G.T. All authors have read and agreed to the published version of the manuscript.

Funding

This research work is part of a project that has received funding from the European Union’s Horizon 2020 research and innovation program under grant agreement No 727698.

Institutional Review Board Statement

Not applicable.

Informed Consent Statement

Not applicable.

Data Availability Statement

Not applicable.

Conflicts of Interest

The authors declare no conflict of interest.

References

  1. Tóth, G.; Hermann, T.; Da Silva, M.R.; Montanarella, L. Heavy Metals in Agricultural Soils of the European Union with Implica-Tions for Food Safety. Environ. Int. 2016, 88, 299–309. [Google Scholar] [CrossRef] [PubMed]
  2. Worsfold, P.J. Heavy Metals in Soils: B.J. Alloway (Ed.)., 2nd Edn. Blackie, Glasgow, 1995 (ISBN 0-7514-0198-6). Anal. Chim. Acta 1995, 309, 408–409. [Google Scholar] [CrossRef]
  3. Jenkins, G.N. Trace Elements. J. R. Soc. Med. 1969, 62, 1316–1320. [Google Scholar] [CrossRef]
  4. Salt, D.E.; Blaylock, M.; Kumar, N.P.B.A.; Dushenkov, V.; Ensley, B.D.; Chet, I.; Raskin, I. Phytoremediation: A Novel Strategy for the Removal of Toxic Metals from the Environment Using Plants. Bio/Technology 1995, 13, 468–474. [Google Scholar] [CrossRef]
  5. Liu, Y.N.; Xiao, X.Y.; Guo, Z.H. Identification of Indicators of Giant Reed (Arundo donax L.) Ecotypes for Phytoremediation of Metal-Contaminated Soil in a Non-Ferrous Mining and Smelting Area in Southern China. Ecol. Indic. 2019, 101, 249–260. [Google Scholar] [CrossRef]
  6. Nalepa, R.A.; Bauer, D.M. Marginal Lands: The Role of Remote Sensing in Constructing Landscapes for Agrofuel Development. J. Peasant Stud. 2012, 39, 403–422. [Google Scholar] [CrossRef]
  7. Von Cossel, M.; Wagner, M.; Lask, J.; Magenau, E.; Bauerle, A.; Von Cossel, V.; Warrach-Sagi, K.; Elbersen, B.; Staritsky, I.; van Eupen, M.; et al. Prospects of Bioenergy Cropping Systems for a More Social-Ecologically Sound Bioeconomy. Agronomy 2019, 9, 605. [Google Scholar] [CrossRef]
  8. Shen, X.; Dai, M.; Yang, J.; Sun, L.; Tan, X.; Peng, C.; Ali, I.; Naz, I. A Critical Review on the Phytoremediation of Heavy Metals from Environment: Performance and Challenges. Chemosphere 2022, 291, 132979. [Google Scholar] [CrossRef]
  9. Barbosa, B.; Boléo, S.; Sidella, S.; Costa, J.; Duarte, M.P.; Mendes, B.; Cosentino, S.L.; Fernando, A.L. Phytoremediation of Heavy Metal-Contaminated Soils Using the Perennial Energy Crops Miscanthus spp. and Arundo donax L. Bioenergy Res. 2015, 8, 1500–1511. [Google Scholar] [CrossRef]
  10. Fernando, A.L.; Duarte, M.P.; Vatsanidou, A.; Alexopoulou, E. Environmental Aspects of Fiber Crops Cultivation and Use. Ind. Crops Prod. 2015, 68, 105–115. [Google Scholar] [CrossRef]
  11. European Commission. EU Directive (EU) 2018/2001 of the European Parliament and of the Council on the Promotion of the Use of Energy from Renewable Sources; European Commision: Brussels, Belgium, 2018; pp. 82–209. [Google Scholar]
  12. Manvelian, J.; Weisany, W.; Tahir, N.A.; Jabbari, H. Industrial Crops & Products Physiological and Biochemical Response of Safflower (Carthamus tinctorius L.) Cultivars to Zinc Application under Drought Stress. Ind. Crop. Prod. 2021, 172, 114069. [Google Scholar] [CrossRef]
  13. Gengmao, Z.; Yu, H.; Xing, S.; Shihui, L.; Quanmei, S.; Changhai, W. Salinity Stress Increases Secondary Metabolites and Enzyme Activity in Safflower. Ind. Crop. Prod. 2015, 64, 175–181. [Google Scholar] [CrossRef]
  14. Gongora, B.; Nelson, S.; De Souza, M.; Bassegio, D.; Santos, F.; Antonio, J.; Siqueira, C.; Aparecido, R.; Gurgacz, F.; Secco, D.; et al. Industrial Crops & Products Comparison of Emissions and Engine Performance of Safflower and Commercial Biodiesels. Ind. Crop. Prod. 2022, 179, 114680. [Google Scholar] [CrossRef]
  15. Sajad, S.; Mirmohamadsadeghi, S.; Karimi, K. Biore Fi Nery Development Based on Whole Safflower Plant. Renew. Energy 2020, 152, 399–408. [Google Scholar] [CrossRef]
  16. Sajad, S.; Karimi, K.; Mirmohamadsadeghi, S. Hydrothermal Pretreatment of Safflower Straw to Enhance Biogas Production. Energy 2019, 172, 545–554. [Google Scholar] [CrossRef]
  17. Briffa, J.; Sinagra, E.; Blundell, R. Heavy Metal Pollution in the Environment and Their Toxicological Effects on Humans. Heliyon 2020, 6, e04691. [Google Scholar] [CrossRef]
  18. Yang, Y.; Xiao, C.; Wang, F.; Peng, L.; Zeng, Q.; Luo, S. Assessment of the Potential for Phytoremediation of Cadmium Polluted Soils by Various Crop Rotation Patterns Based on the Annual Input and Output Fluxes. J. Hazard. Mater. 2022, 423, 127183. [Google Scholar] [CrossRef]
  19. Yang, J.; Sun, Y.; Wang, Z.; Gong, J.; Gao, J.; Tang, S.; Ma, S.; Duan, Z. Heavy Metal Pollution in Agricultural Soils of a Typical Volcanic Area: Risk Assessment and Source Appointment. Chemosphere 2022, 304, 135340. [Google Scholar] [CrossRef]
  20. Nelson, D.W.; Sommers, L.E. Total Carbon, Organic Carbon, and Organic Matter. In Methods of Soil Analysis; John Wiley & Sons, Ltd.: Hoboken, NJ, USA, 1983; pp. 539–579. ISBN 9780891189770. [Google Scholar]
  21. ISO 11047:1998; Soil Quality—Determination of Cadmium, Chromium, Cobalt, Copper, lead, Manganese, Nickel and Zinc—Flame and Electrothermal Atomic Absorption Spectrometric Methods. ISO: Geneva, Switzerland, 1998.
  22. ISO 707:2008; Milk and Milk Products—Guidance on Sampling. ISO: Geneva, Switzerland, 2008.
  23. Gomes, L.; Costa, J.; Moreira, J.; Cumbane, B.; Abias, M.; Santos, F.; Zanetti, F.; Monti, A.; Fernando, A.L. Switchgrass and Giant Reed Energy Potential When Cultivated in Heavy Metals Contaminated Soils. Energies 2022, 15, 5538. [Google Scholar] [CrossRef]
  24. Girdhar, M.; Sharma, N.R.; Rehman, H.; Kumar, A.; Mohan, A. Comparative Assessment for Hyperaccumulatory and Phytoremediation Capability of Three Wild Weeds. 3 Biotech 2014, 4, 579–589. [Google Scholar] [CrossRef] [Green Version]
  25. Yadav, S.K.; Juwarkar, A.A.; Kumar, G.P.; Thawale, P.R.; Singh, S.K.; Chakrabarti, T. Bioaccumulation and Phyto-Translocation of Arsenic, Chromium and Zinc by Jatropha curcas L.: Impact of Dairy Sludge and Biofertilizer. Bioresour. Technol. 2009, 100, 4616–4622. [Google Scholar] [CrossRef] [PubMed]
  26. Barbafieri, M.; Dadea, C.; Tassi, E.; Bretzel, F.; Fanfani, L. Uptake of Heavy Metals by Native Species Growing in a Mining Area in Sardinia, Italy: Discovering Native Flora for Phytoremediation. Int. J. Phytoremediation 2011, 13, 985–997. [Google Scholar] [CrossRef] [PubMed]
  27. Mattina, M.J.I.; Lannucci-Berger, W.; Musante, C.; White, J.C. Concurrent Plant Uptake of Heavy Metals and Persistent Organic Pollutants from Soil. Environ. Pollut. 2003, 124, 375–378. [Google Scholar] [CrossRef]
  28. Pidlisnyuk, V.; Erickson, L.; Stefanovska, T.; Popelka, J.; Hettiarachchi, G.; Davis, L.; Trögl, J. Potential Phytomanagement of Military Polluted Sites and Biomass Production Using Biofuel Crop Miscanthus x giganteus. Environ. Pollut. 2019, 249, 330–337. [Google Scholar] [CrossRef]
  29. Huang, J.; Hartemink, A.E. Soil and Environmental Issues in Sandy Soils. Earth-Sci. Rev. 2020, 208, 103295. [Google Scholar] [CrossRef]
  30. Patanè, C.; Cosentino, S.L.; Calcagno, S.; Pulvirenti, L.; Siracusa, L. Industrial Crops & Products How Do Sowing Time and Plant Density affect the Pigments Safflomins and Carthamin in Florets of Safflower? Ind. Crops Prod. 2020, 148, 112313. [Google Scholar] [CrossRef]
  31. Namdjoyan, S.; Kermanian, H.; Abolhasani, A.; Modarres, S.; Nazli, T. Interactive Effects of Salicylic Acid and Nitric Oxide in Alleviating Zinc Toxicity of Safflower (Carthamus tinctorius L.). Ecotoxicology 2017, 16, 752–761. [Google Scholar] [CrossRef]
  32. Kabata-Pendias, A. Trace Elements in Soils and Plants: Fourth Edition; CRC Taylor and Francis: Boca Raton, FL, USA, 2010; ISBN 9781420093704. [Google Scholar]
  33. Goodarzi, A.; Namdjoyan, S.; Soorki, A.A. Effects of Exogenous Melatonin and Glutathione on Zinc Toxicity in Safflower (Carthamus tinctorius L.) Seedlings. Ecotoxicol. Environ. Saf. 2020, 201, 110853. [Google Scholar] [CrossRef]
  34. Al Chami, Z.; Amer, N.; Al Bitar, L.; Cavoski, I. Potential Use of Sorghum Bicolor and Carthamus tinctorius in Phytoremediation of Nickel, Lead and Zinc. Int. J. Environ. Sci. Technol. 2015, 12, 3957–3970. [Google Scholar] [CrossRef]
  35. Baran, U.; Ekmekçi, Y. Physiological, Photochemical, and Antioxidant Responses of Wild and Cultivated Carthamus Species Exposed to Nickel Toxicity and Evaluation of Their Usage Potential in Phytoremediation. Environ. Sci. Pollut. Res. 2022, 29, 4446–4460. [Google Scholar] [CrossRef]
  36. Afzal, O.; Hassan, F.; Ahmed, M.; Shabbir, G.; Ahmed, S. Determination of Stable Safflower Genotypes in Variable Environments by Parametric and Non-Parametric Methods. J. Agric. Food Res. 2021, 6, 100233. [Google Scholar] [CrossRef]
  37. Hassan, M.U.; Chattha, M.U.; Khan, I.; Chattha, M.B.; Aamer, M.; Nawaz, M.; Ali, A.; Khan, M.A.U.; Khan, T.A. Nickel Toxicity in Plants: Reasons, Toxic Effects, Tolerance Mechanisms, and Remediation Possibilities—A Review. Environ. Sci. Pollut. Res. 2019, 26, 12673–12688. [Google Scholar] [CrossRef] [PubMed]
  38. Amjadi, Z.; Namdjoyan, S.; Abolhasani, A. Exogenous Melatonin and Salicylic Acid Alleviates Cadmium Toxicity in Safflower (Carthamus tinctorius L.) Seedlings. Ecotoxicology 2021, 30, 387–401. [Google Scholar] [CrossRef]
  39. Namdjoyan, S.; Namdjoyan, S.; Kermanian, H. Induction of Phytochelatin and Responses of Antioxidants under Cadmium Stress in Safflower (Carthamus tinctorius) Seedlings. Turk. J. Botany 2012, 36, 495–502. [Google Scholar] [CrossRef]
  40. Shi, G.; Cai, Q. Cadmium Tolerance and Accumulation in Eight Potential Energy Crops. Biotechnol. Adv. 2009, 27, 555–561. [Google Scholar] [CrossRef] [PubMed]
  41. Kadir, M.; Cesur, C.; Aslan, V.; Yilbasi, Z. The Production of Biodiesel from Safflower (Carthamus tinctorius L.) Oil as a Potential Feedstock and Its Usage in Compression Ignition Engine: A Comprehensive Review. Renew. Sustain. Energy Rev. 2020, 119, 109574. [Google Scholar] [CrossRef]
Figure 1. Meteorological data for the two years. Tmax and Tmin represent the 10 days average of the daily maximum and minimum temperature, respectively.
Agronomy 12 02302 g001
Figure 2. Aboveground DM (g.pot−1) of Safflower concerning the different studied treatments. Values with different letters indicate statistical significance (according to HSD at p ≤ 0.05).
Agronomy 12 02302 g002
Figure 3. Concentration of Zn (µg g−1) in the different fractions of the plant as average of two years. The multiple comparison between the means has been performed within the plant fractions. Values with different letters indicate statistical significance (according to HSD at p ≤ 0.05).
Agronomy 12 02302 g003
Figure 4. Concentration of Pb (µg g−1) in the different fractions of the plant as average of two years. The multiple comparison between the means has been performed within the plant fractions. Values with different letters indicate statistical significance (according to HSD at p ≤ 0.05).
Agronomy 12 02302 g004
Figure 5. Concentration of Cd (µg g−1) in the different fractions of the plants as average of two years. The multiple comparison between the means has been performed within the plant fractions. Values with different letters indicate statistical significance (according to HSD at p ≤ 0.05).
Agronomy 12 02302 g005
Figure 6. Concentration of Ni (µg g−1) in the different fractions of the plants as average of two years. The multiple comparisons between the means have been performed within the plant fractions. Values with different letters indicate statistical significance (according to HSD at p ≤ 0.05).
Agronomy 12 02302 g006
Figure 7. Principal component analysis and correlation matrix in cadmium-contaminated soil in the two years.
Agronomy 12 02302 g007
Figure 8. Principal component analysis and correlation matrix in nickel-contaminated soil in the two years.
Agronomy 12 02302 g008
Figure 9. Principal component analysis and correlation matrix in lead-contaminated soil in the two years.
Agronomy 12 02302 g009
Figure 10. Principal component analysis and correlation matrix in zinc-contaminated soil in the two years.
Agronomy 12 02302 g010
Table 1. Amounts of contaminants supplied to the soil in the different studied factors.
Zinc
(mg kg−1)
Cadmium (mg kg−1)Nickel
(mg kg−1)
Lead
(mg kg−1)
Low Level4504110450
High Level9008220900
Table 2. Soil physical and chemical characteristics.
Physical Characteristics
Clay (%)3.0
Silt (%)4.1
Sand (%)92.9
TextureSandy
Conductivity (μS/cm)34.2
Chemical characteristics
pH7.4
Organic matter (%)0.86
Fe (mg kg−1)23.6
P (mg kg−1)7
Mn (mg kg−1)0.1
Cu (mg kg−1)21.8
Table 3. The total and bioavailable heavy metals (HM) concentration in the contaminated and control soils.
HMConcentration (mg kg−1)20202021
Total HM
(mg kg−1)
Bioavailable HM (mg kg−1)Total HM
(mg kg−1)
Bioavailable HM (mg kg−1)
Control-Zn-35.98 ± 2.729.51 ± 1.1636.89 ± 10.504.57 ± 1.41
Zn450478.61 ± 5.40283.18 ± 2.00496.85 ± 14.01324.68 ± 13.69
Zn900883.70 ± 22.33544.60 ± 1.35803.30 ± 45.41537.35 ± 6.16
Control-Pb-11.01 ± 2.132.32 ± 1.1617.45 ± 6.963.76 ± 1.01
Pb450447.80 ± 3.99242.45 ± 1.63464.96 ± 53.44247.02 ± 62.63
Pb900840.13 ± 12.62517.59 ± 5.85876.20 ± 69.86584.38 ± 31.66
Control-Cd-0.43 ± 0.110.11 ± 0.050.69 ± 0.100.16 ± 0.001
Cd44.43 ± 0.222.47 ± 0.193.74 ± 0.201.47 ± 0.002
Cd88.86 ± 0.805.80 ± 0.109.88 ± 2.125.11 ± 0.26
Control-Ni-33.53 ± 3.7912.96 ± 1.8320.92 ± 4.764.72 ± 1.82
Ni110121.19 ± 7.9378.87 ± 14.64119.39 ± 13.2256.98 ± 2.86
Ni220248.20 ± 18.82174.80 ± 5.13207.27 ± 6.23144.82 ± 7.72
Table 4. Total biomass yield and plant fractions (roots, stems, leaves, and seeds) in the two years and in relation to HM treatments. Within the same column, values with different letters indicate statistical significance (according to HSD at p ≤ 0.05).
20202021
Roots
(g pot−1)
Stems
(g pot−1)
Leaves
(g pot−1)
Seeds
(g pot−1)
Total DM (g pot−1)Roots
(g pot−1)
Stems
(g pot−1)
Leaves
(g pot−1)
Seeds
(g pot−1)
Total DM (g pot−1)
Control1.8 a5.4 a3.7 a4.3 a15.2 a5.3 a7.0 a4.8 a3.2 a20.4 a
Zn4501.0 b3.7 b,c2.9 a3.2 a,b10.7 a,b4.5 a,b5.4 a,b,c3.5 a,b2.1 a15.5 b
Zn9000.8 b2.8 c2.4 a2.5 a,b8.4 b2.0 c3.6 c2.6 b2.2 a10.5 c
Pb4501.1 ab3.7 b,c3.5 a3.2 a,b11.6 a,b3.9 a,b5.6 a,b3.5 a,b3.4 a16.5 a,b
Pb9001.5 a,b3.6 b,c3.1 a2.9 a,b11.0 a,b3.0 b,c5.1 b,c4.2 a,b3.0 a15.3 b
Ni1101.2 a,b3.7 b,c2.5 a3.3 a,b10.7 a,b3.5 a,b,c5.5 a,b,c3.5 a,b3.2 a15.7 b
Ni2201.1 a,b3.3 b,c2.7 a2.6 a,b9.7 b3.4 b,c4.4 b,c3.0 b2.2 a13.0 b,c
Cd41.2 a,b4.3 a,b2.6 a2.2 a,b10.3 a,b3.2 b,c4.2 b,c2.7 b2.8 a12.9 b,c
Cd81.3 a,b3.2 b,c2.9 a1.7 b9.1 b3.3 b,c4.1 b,c2.9 b2.4 a12.7 b,c
AVG1.23.72.92.910.73.65.03.42.714.7
Table 5. Two-way ANOVA of the main factor and interaction for zinc concentration in stems, leaves, seeds, and roots during the two years of the experiment (* significance level at p ≤ 0.05, ** significance level at p ≤ 0.005, *** significance level at p ≤ 0.001).
ZincStemsLeavesSeedsRoot
Level0.0088 ***0.0479 ***0.0007 ***0.0013 ***
Year0.0010 **0.28420.0002 ***0.0197 *
Level x Year0.0005 ***0.19550.05350.4405
Table 6. Two-way ANOVA of the main factor and interaction for the concentration of lead in stems, leaves, seeds, and roots during the two years of the experiment (* significance level at p ≤ 0.05, *** significance level at p ≤ 0.001).
LeadStemsLeavesSeedsRoots
Level0.0001 ***0.0008 ***0.50920.0495 ***
Year0.30760.06390.0315 *0.1637
Level: Year0.13760.42550.11000.6013
Table 7. Two-way ANOVA of the main factor and interaction for the concentration of cadmium in stems, leaves, seeds, and roots during the two years of the experiment (** significance level at p ≤ 0.005, *** significance level at p ≤ 0.001).
CadmiumStemsLeavesSeedsRoots
Level0.0002 ***0.0023 **0.08410.0041 **
Year0.0000 ***0.0002 ***0.0016 ***0.0006 ***
Level: Year0.0003 ***0.0068 **0.13700.0056 **
Table 8. Two-way ANOVA of the main factor and interaction for the concentration of nickel in stems, leaves, seeds, and roots during the two years of the experiment (* significance level at p ≤ 0.05, ** significance level at p ≤ 0.005, *** significance level at p ≤ 0.001).
NickelStemsLeavesSeedsRoots
Level0.0338 *0.12680.22170.0017 **
Year0.0332 ***0.0000 ***0.0002 ***0.0005 ***
Level: Year0.05280.33820.50720.0053 **
Table 9. Index and Factors calculated concerning heavy metals in the soil and the plants.
Cont.Conc.TImAImBCF Abov.mBCF Below.TF
Zn4500.73 ± 0.103.87 ± 0.330.07 ± 0.0120.15 ± 0.020.51 ± 0.10
Zn9000.57 ± 0.076.01 ± 0.390.09 ± 0.0010.17 ± 0.010.52 ± 0.03
Pb4500.81 ± 0.113.55 ± 0.440.12 ± 0.0200.15 ± 0.020.79 ± 0.07
Pb9000.76 ± 0.114.61 ± 0.480.07 ± 0.0060.12 ± 0.010.61 ± 0.08
Cd40.66 ± 0.113.80 ± 0.562.26 ± 0.33.79 ± 0.270.63 ± 0.08
Cd80.61 ± 0.115.21 ± 0.821.19 ± 0.11.74 ± 0.150.68 ± 0.08
Ni1100.76 ± 0.146.17 ± 0.190.48 ± 0.10.89 ± 0.190.55 ± 0.11
Ni2200.64 ± 0.107.29 ± 0.250.32 ± 0.00.62 ± 0.060.54 ± 0.09
Publisher’s Note: MDPI stays neutral with regard to jurisdictional claims in published maps and institutional affiliations.

