
Mānuka Clones Differ in Their Volatile Profiles: Potential Implications for Plant Defence, Pollinator Attraction and Bee Products


Abstract
:1. Introduction
2. Materials and Methods
2.1. Study Site and Biological Material
2.2. Data Analysis
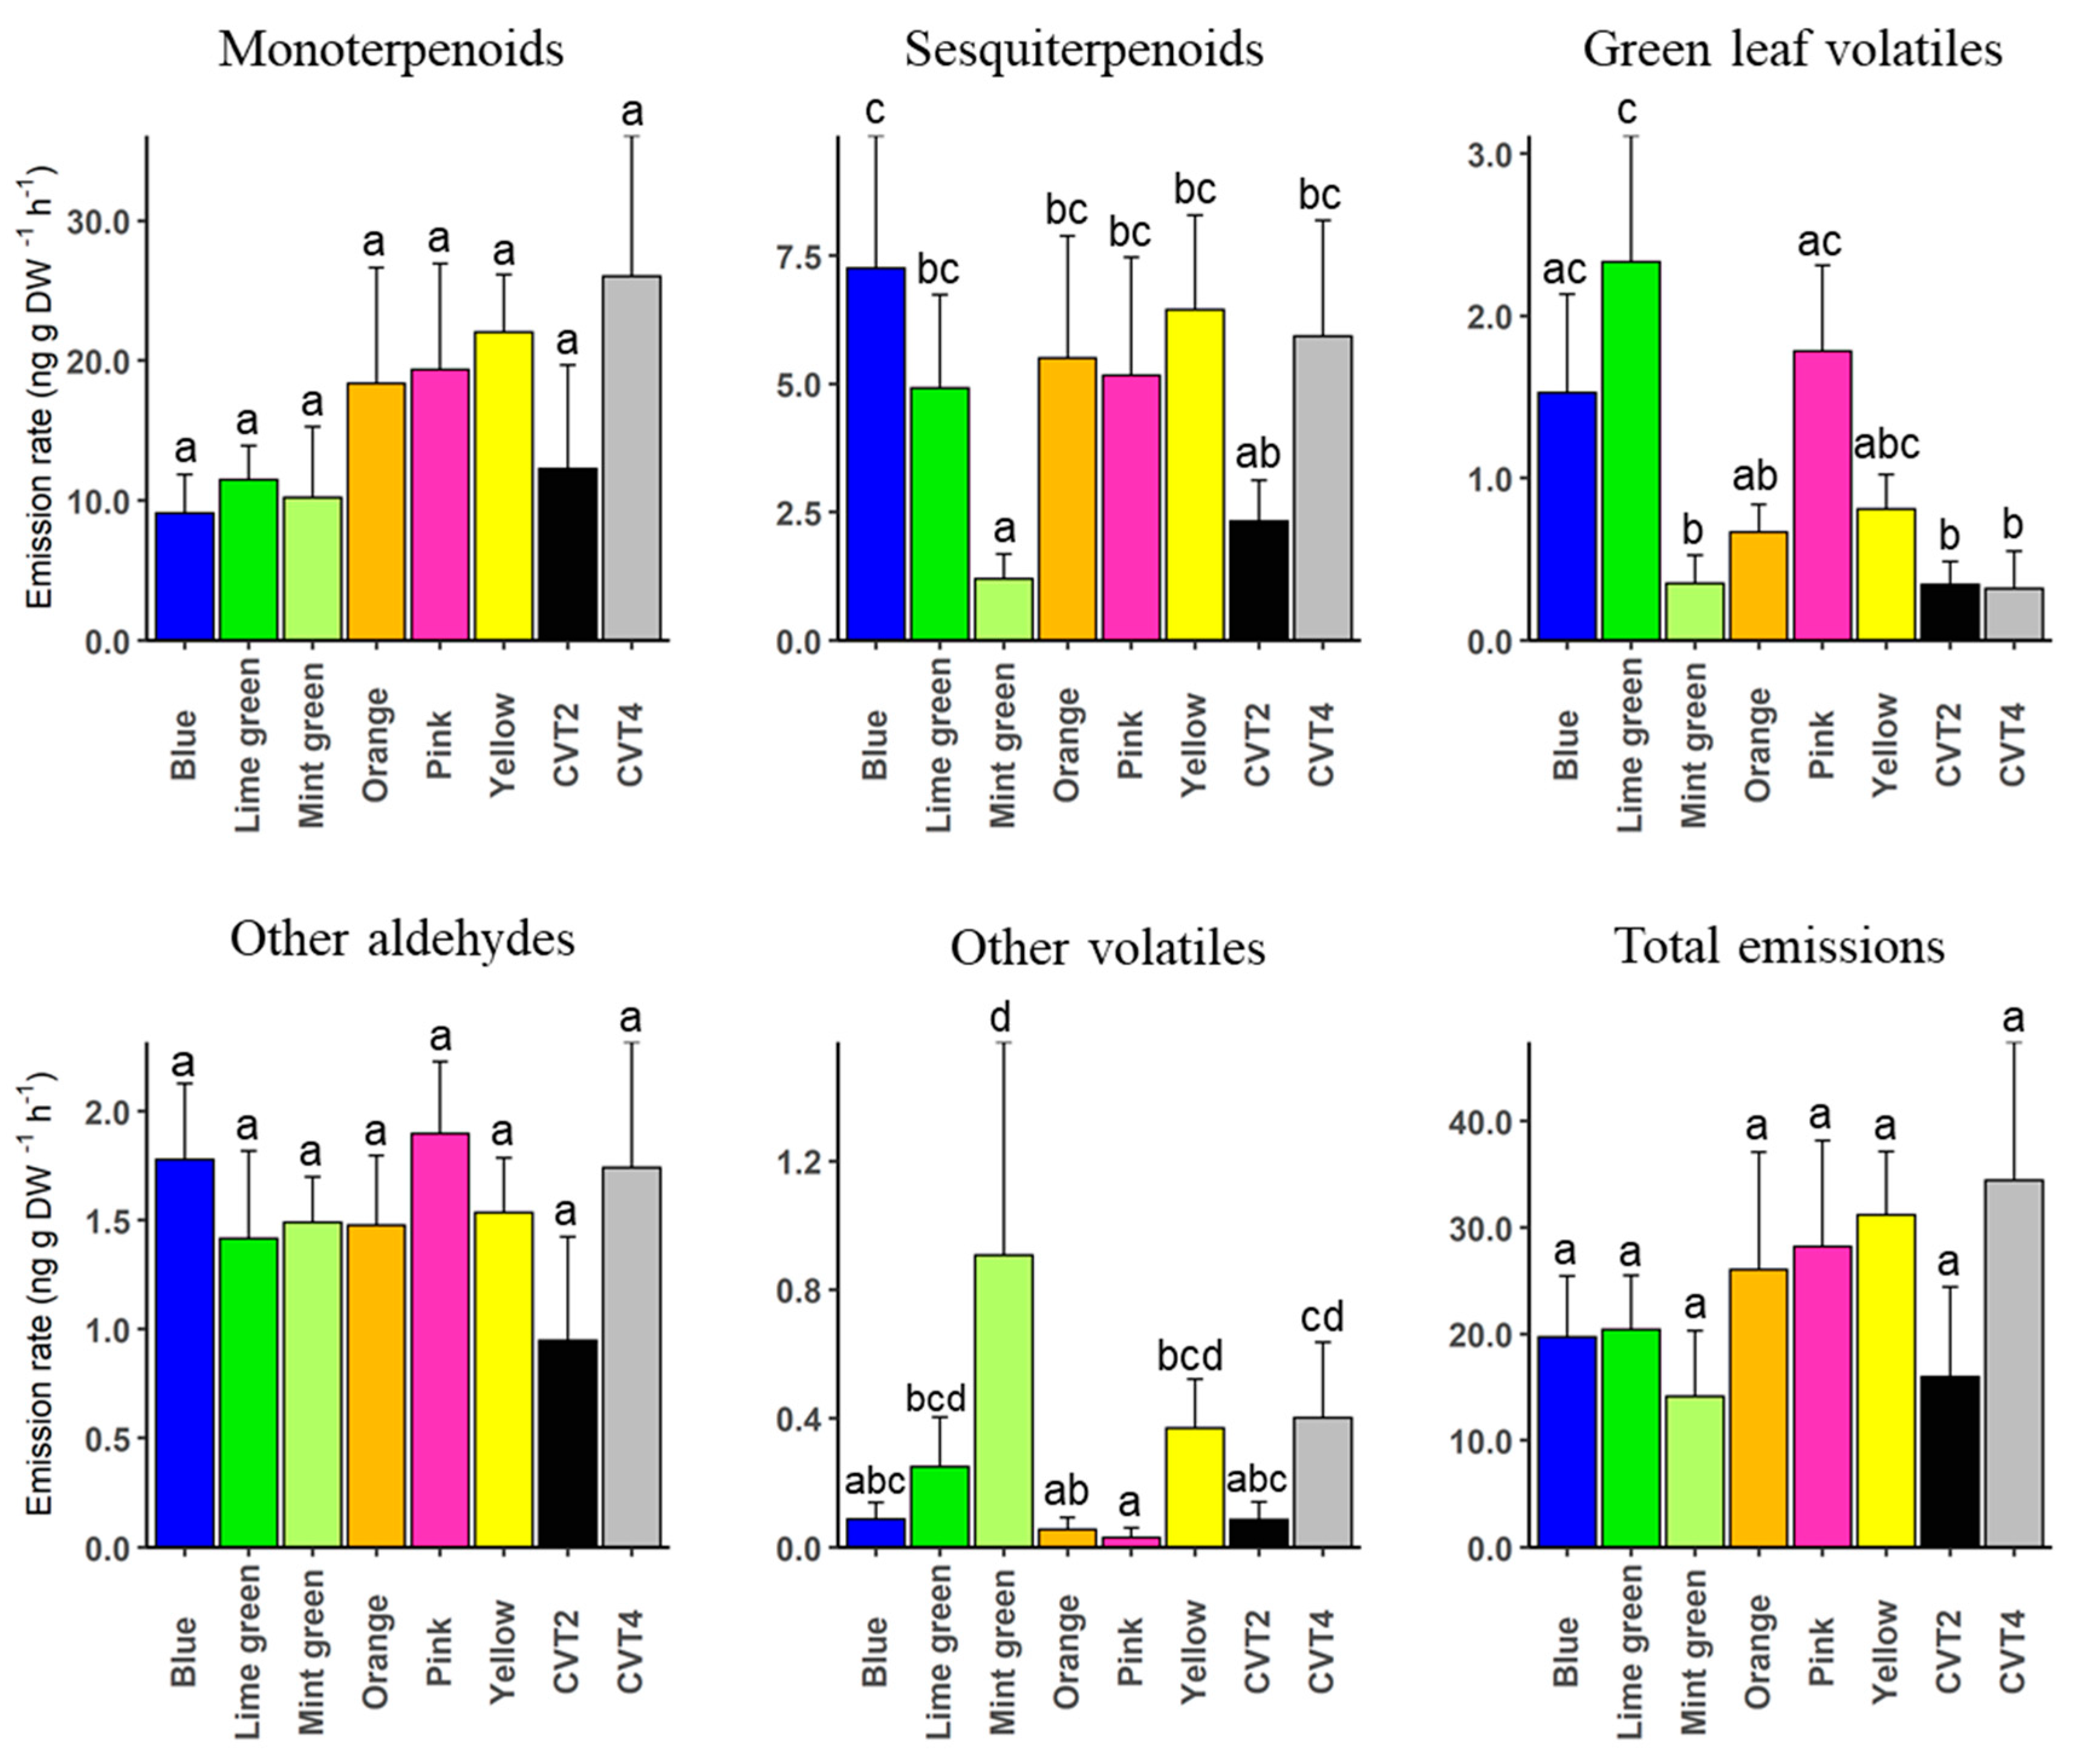
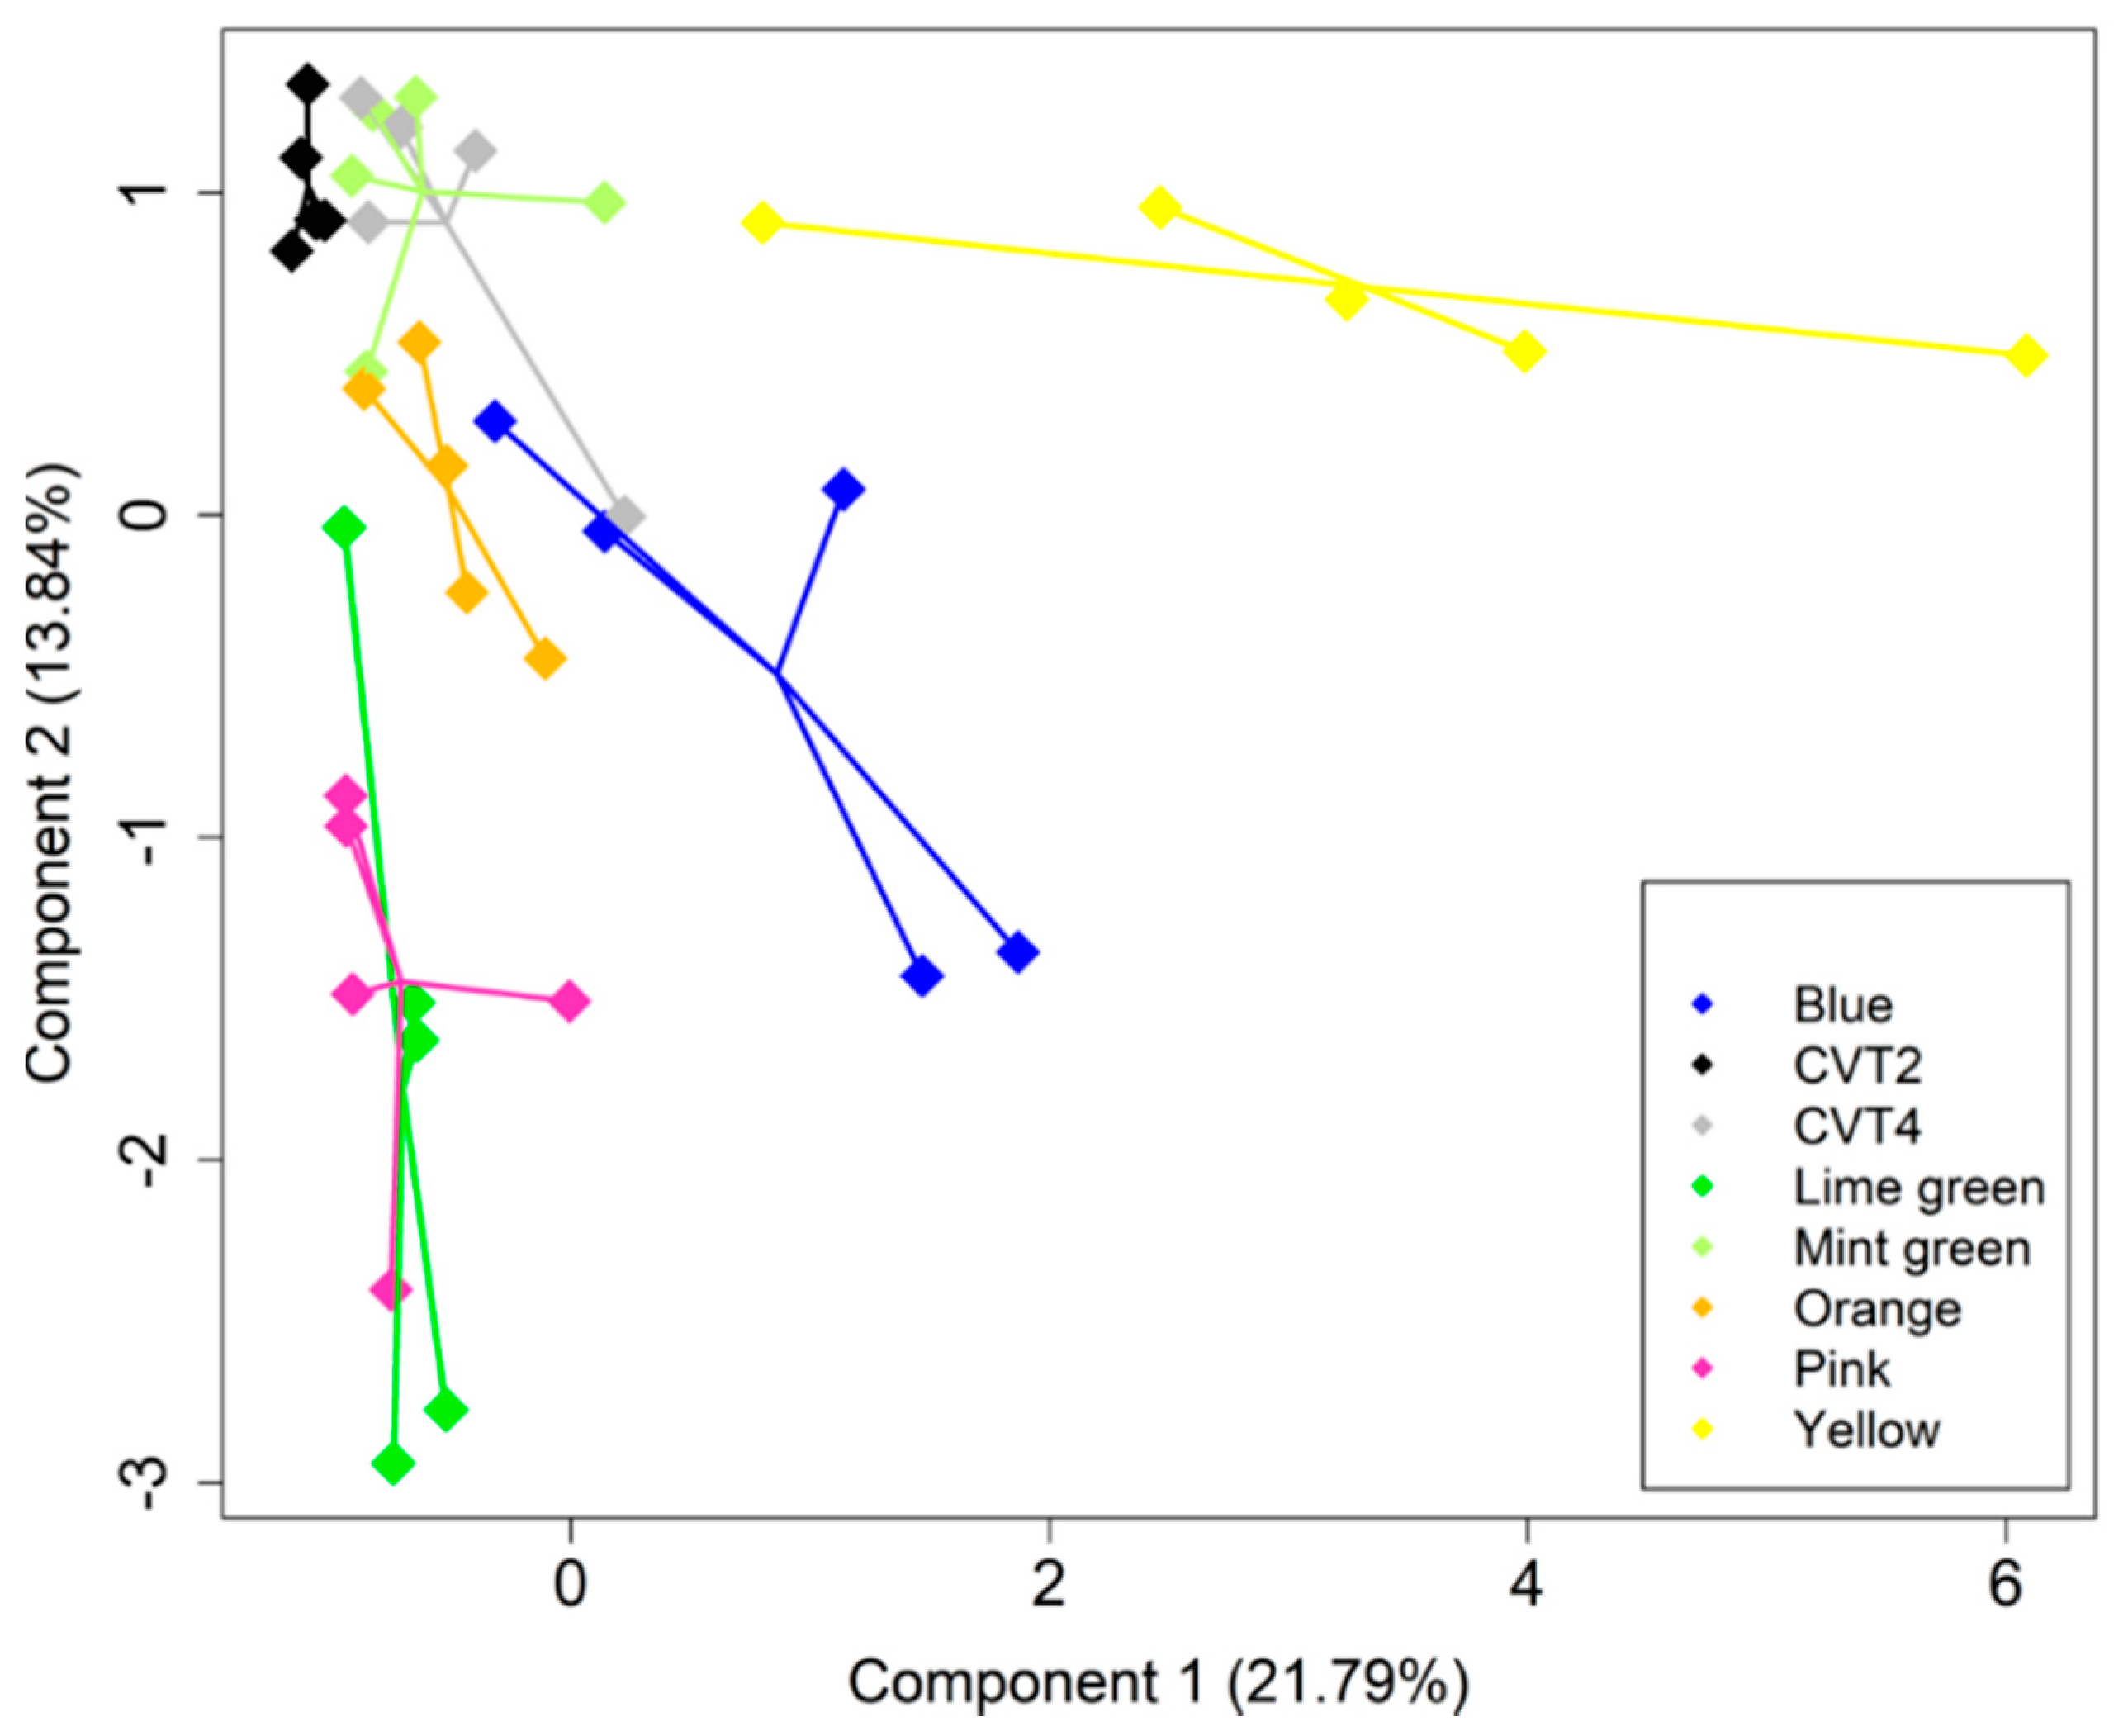
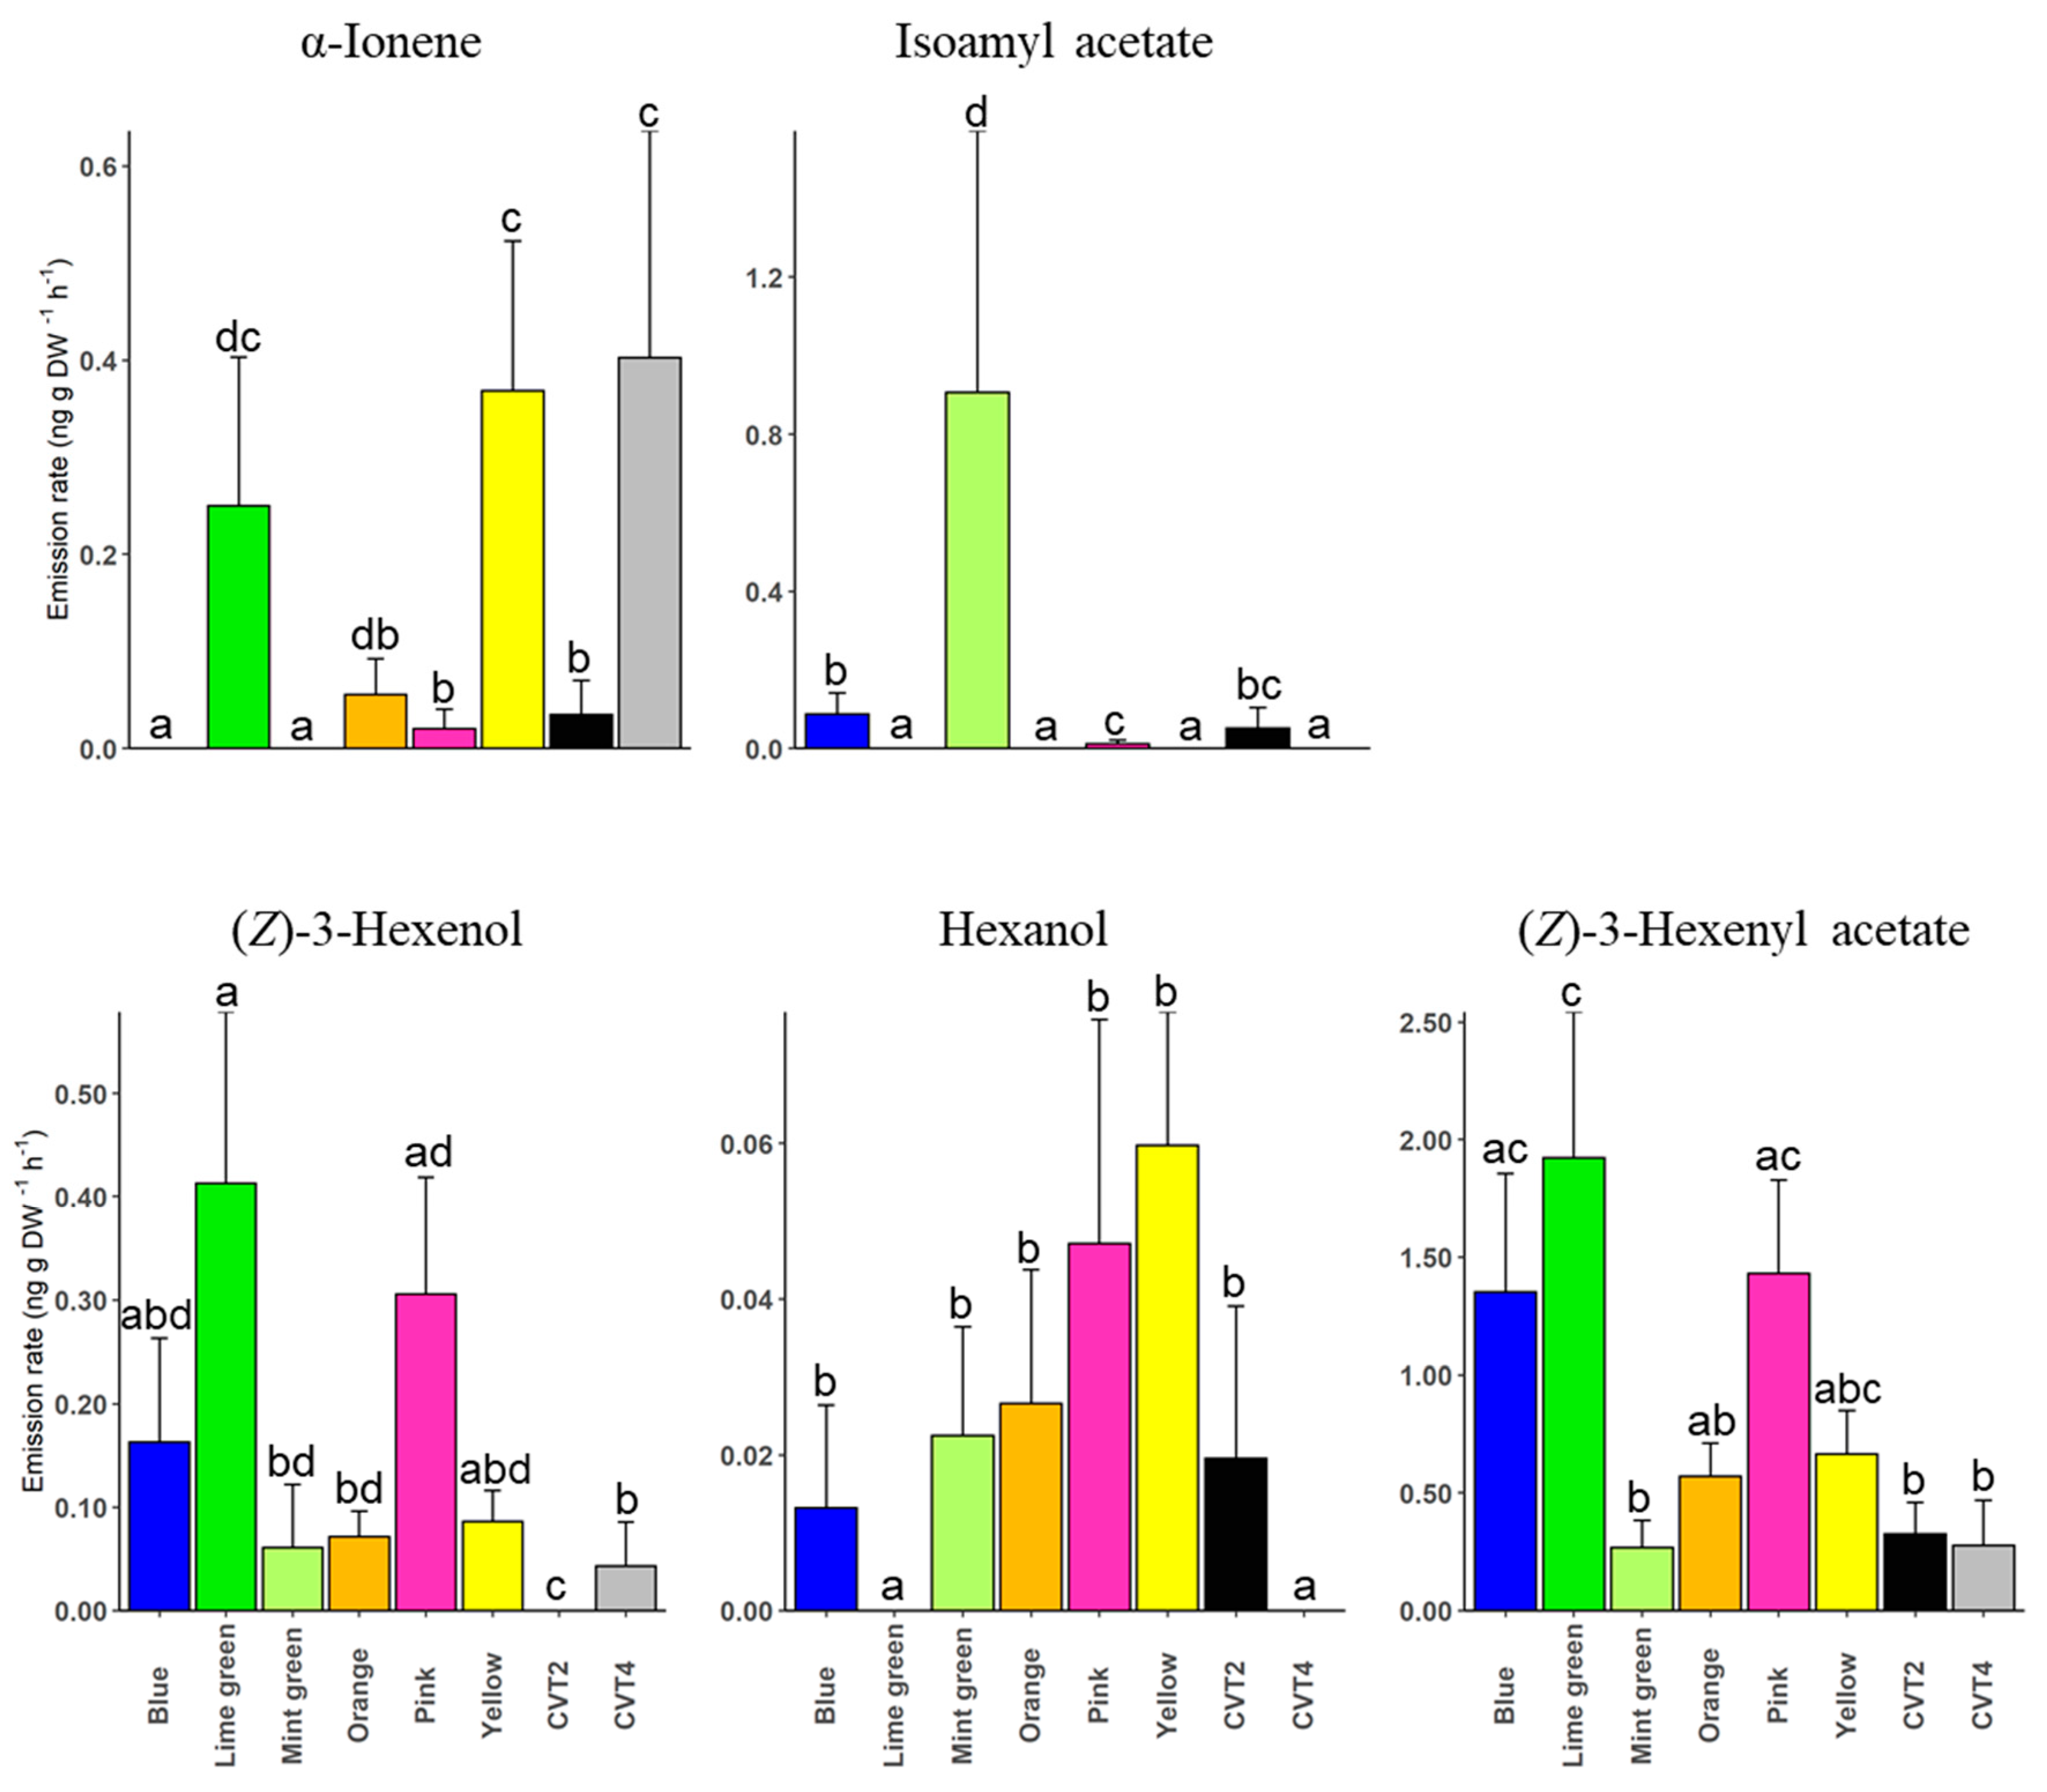
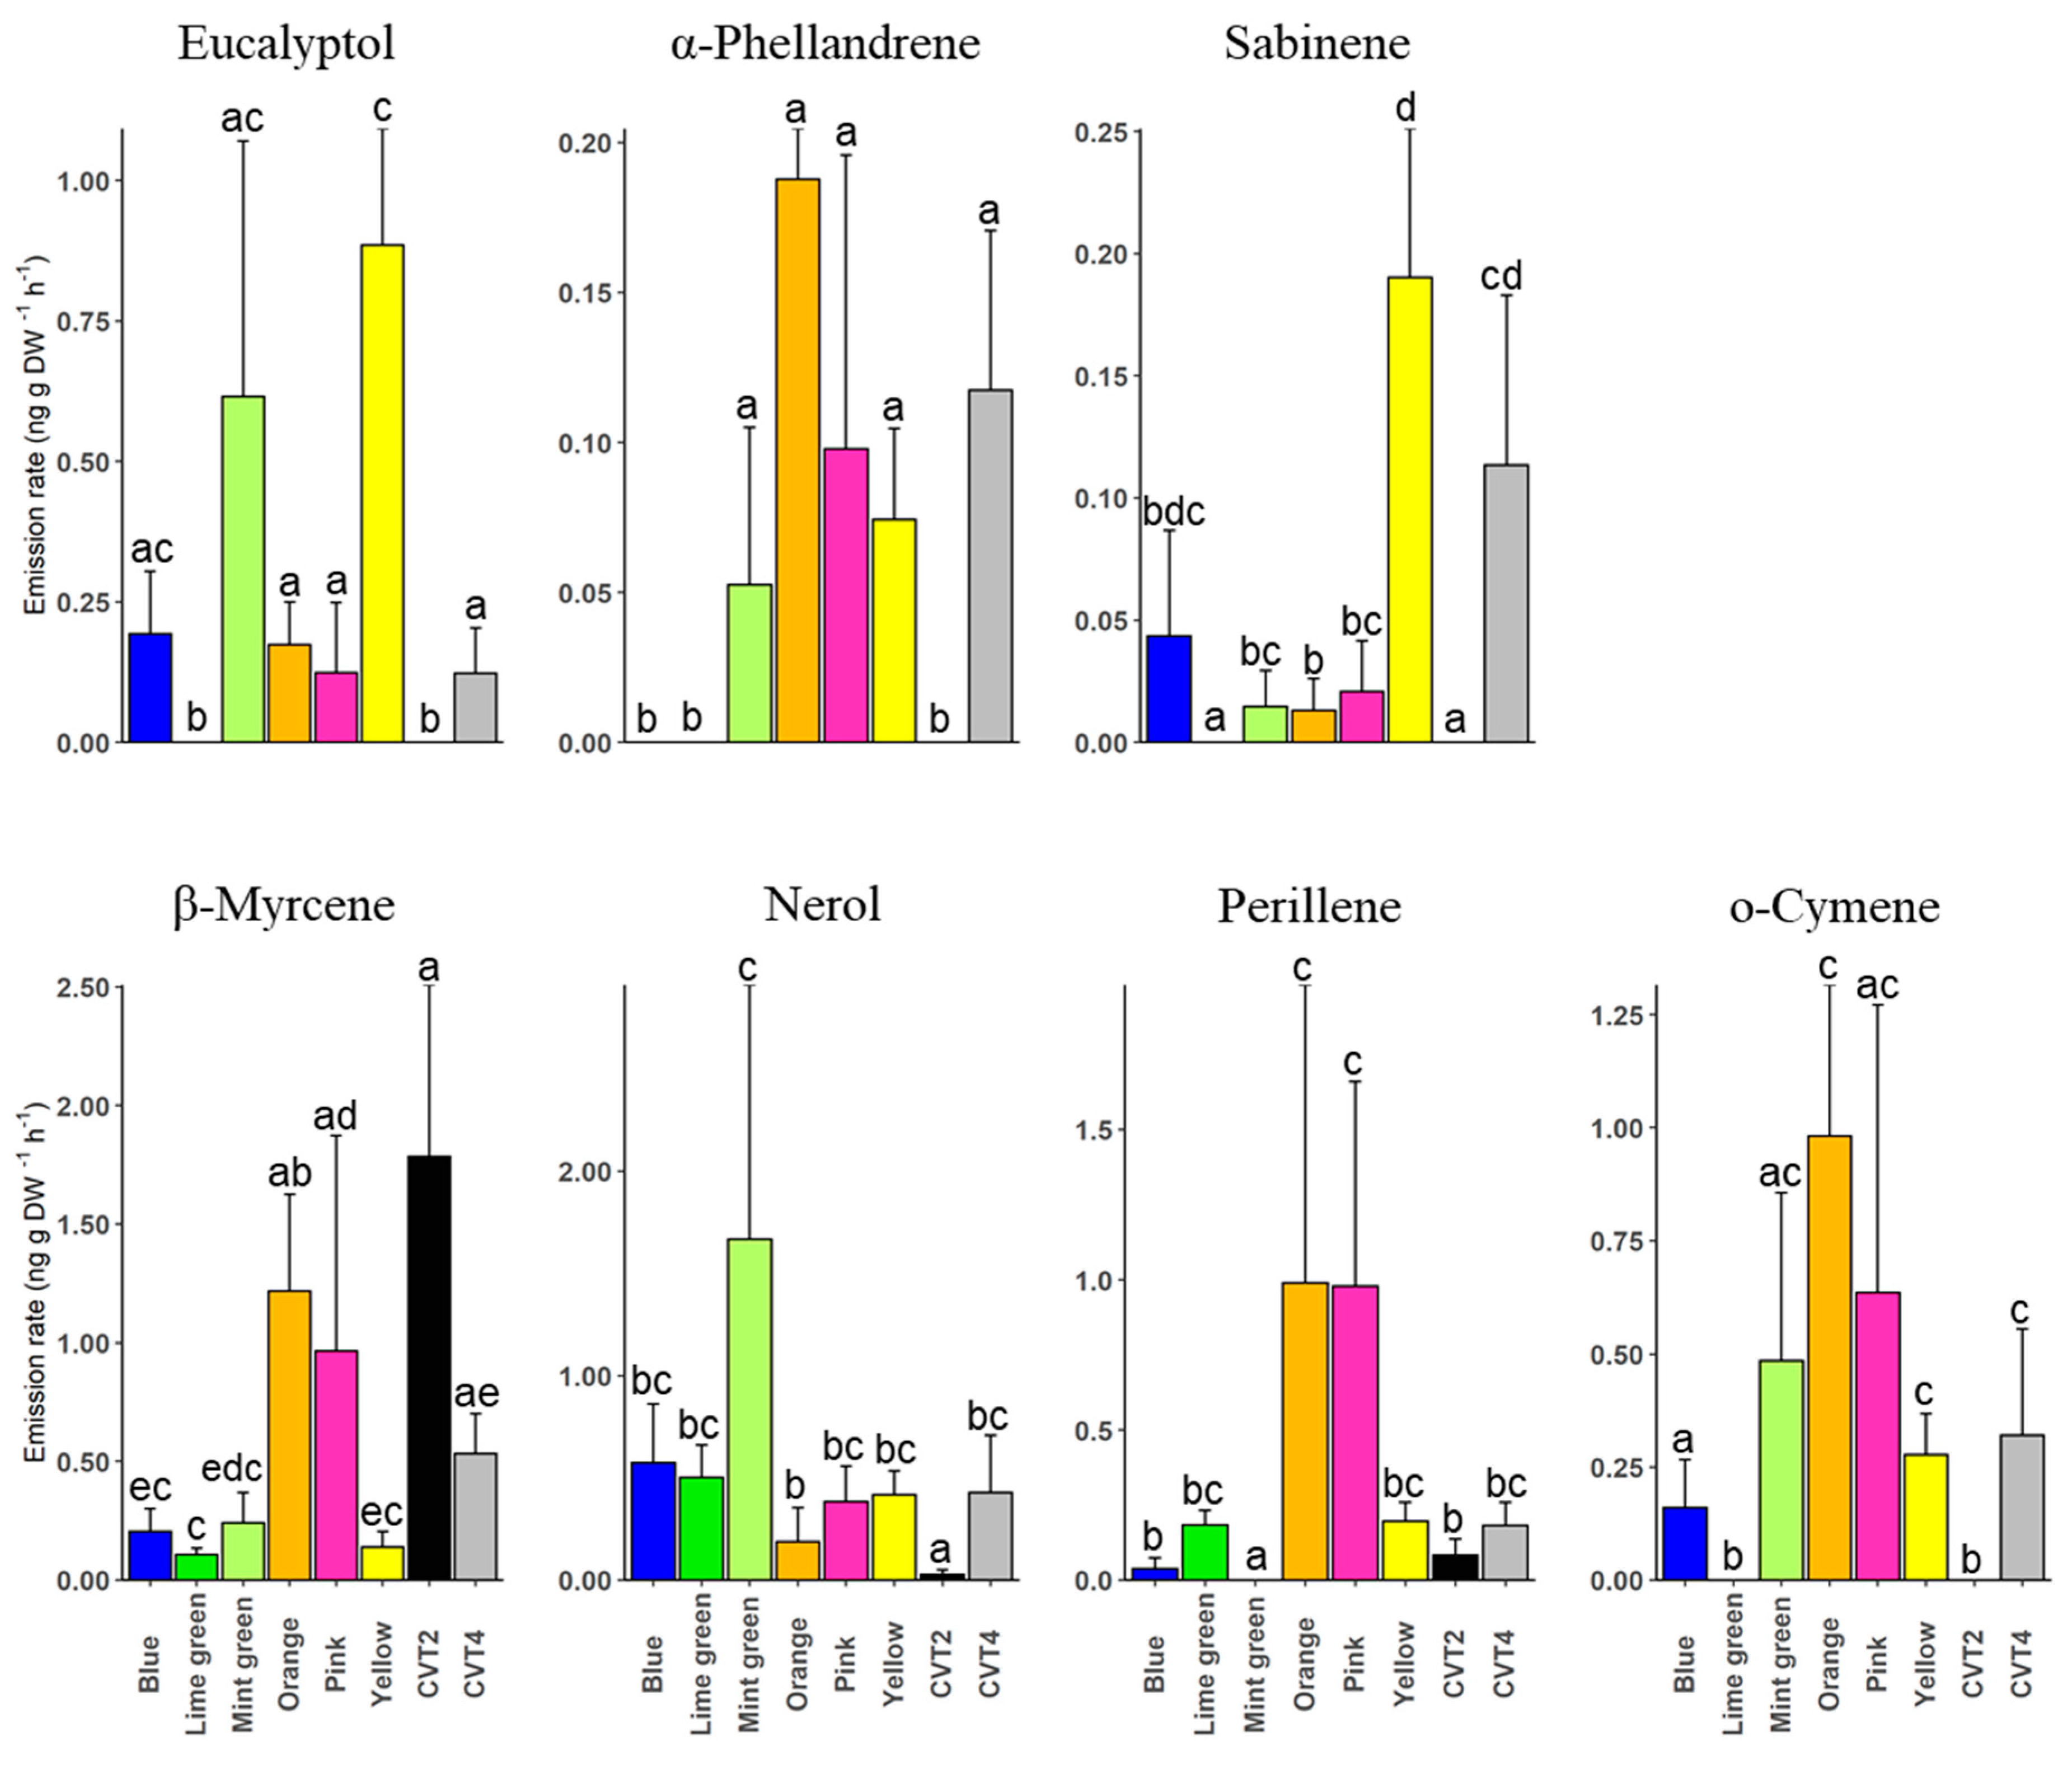
3. Results
4. Discussion
5. Conclusions
Supplementary Materials
Author Contributions
Funding
Data Availability Statement
Acknowledgments
Conflicts of Interest
References
- Pichersky, E.; Gershenzon, J. The formation and function of plant volatiles: Perfumes for pollinator attraction and defense. Curr. Opin. Plant Biol. 2002, 5, 237–243. [Google Scholar] [CrossRef]
- Clavijo McCormick, A.; Unsicker, S.B.; Gershenzon, J. The specificity of herbivore-induced plant volatiles in attracting herbivore enemies. Trends Plant Sci. 2012, 17, 303–310. [Google Scholar] [CrossRef]
- Clavijo McCormick, A. Can plant–natural enemy communication withstand disruption by biotic and abiotic factors? Ecol. Evol. 2016, 6, 8569–8582. [Google Scholar] [CrossRef]
- Effah, E.; Holopainen, J.K.; McCormick, A.C. Potential roles of volatile organic compounds in plant competition. Perspect. Plant Ecol. Evol. Syst. 2019, 38, 58–63. [Google Scholar] [CrossRef]
- Pettersson, J.; Ninkovic, V.; Ahmed, E. Volatiles from different barley cultivars affect aphid acceptance of neighbouring plants. Acta Agric. Scand. B—Plant Soil Sci. 1999, 49, 152–157. [Google Scholar]
- Keskitalo, M.; Pehu, E.; Simon, J.E. Variation in volatile compounds from tansy (Tanacetum vulgare L.) related to genetic and morphological differences of genotypes. Biochem. Syst. Ecol. 2001, 29, 267–285. [Google Scholar] [CrossRef]
- Vivaldo, G.; Masi, E.; Taiti, C.; Caldarelli, G.; Mancuso, S. The network of plants volatile organic compounds. Sci. Rep. 2017, 7, 11050. [Google Scholar] [CrossRef] [Green Version]
- Moreira, X.; Abdala-Roberts, L. Specificity and context-dependency of plant–plant communication in response to insect herbivory. Curr. Opin. Insect Sci. 2019, 32, 15–21. [Google Scholar] [CrossRef]
- Effah, E.; Barrett, D.P.; Peterson, P.G.; Godfrey, A.J.R.; Potter, M.A.; Holopainen, J.K.; Clavijo McCormick, A. Natural variation in volatile emissions of the invasive weed Calluna vulgaris in New Zealand. Plants 2020, 9, 283. [Google Scholar] [CrossRef] [Green Version]
- Ronghua, Y.; Mark, A.F.; Wilson, J.B. Aspects of the ecology of the indigenous shrub Leptospermum scoparium (Myrtaceae) in New Zealand. N. Z. J. Bot. 1984, 22, 483–507. [Google Scholar] [CrossRef]
- Stephens, J.M.C.; Molan, P.C.; Clarkson, B.D. A review of Leptospermum scoparium (Myrtaceae) in New Zealand. N. Z. J. Bot. 2005, 43, 431–449. [Google Scholar] [CrossRef]
- Derraik, J.G. New Zealand manuka (Leptospermum scoparium; Myrtaceae): A brief account of its natural history and human perceptions. N. Z. Gard. J. 2008, 11, 4–8. [Google Scholar]
- Dawson, M. A history of Leptospermum scoparium in cultivation-discoveries from the wild. New Plantsman 1997, 4, 51–59. [Google Scholar]
- Primack, R.B.; Lloyd, D.G. Andromonoecy in the New Zealand montane shrub manuka, Leptospermum scoparium (Myrtaceae). Am. J. Bot. 1980, 67, 361–368. [Google Scholar] [CrossRef]
- Mavric, E.; Wittmann, S.; Barth, G.; Henle, T. Identification and quantification of methylglyoxal as the dominant antibacterial constituent of Manuka (Leptospermum scoparium) honeys from New Zealand. Mol. Nutr. Food Res. 2008, 52, 483–489. [Google Scholar] [CrossRef] [PubMed]
- Alvarez-Suarez, J.M.; Gasparrini, M.; Forbes-Hernández, T.Y.; Mazzoni, L.; Giampieri, F. The composition and biological activity of honey: A focus on manuka honey. Foods 2014, 3, 420–432. [Google Scholar] [CrossRef] [Green Version]
- Niaz, K.; Maqbool, F.; Bahadar, H.; Abdollahi, M. Health benefits of manuka honey as an essential constituent for tissue regeneration. Curr. Drug Metab. 2017, 18, 881–892. [Google Scholar] [CrossRef]
- Williams, S.; King, J.; Revell, M.; Manley-Harris, M.; Balks, M.; Janusch, F.; Kiefer, M.; Clearwater, M.; Brooks, P.; Dawson, M. Regional, annual, and individual variations in the dihydroxyacetone content of the nectar of ma̅nuka (Leptospermum scoparium) in New Zealand. J. Agric. Food Chem. 2014, 62, 10332–10340. [Google Scholar] [CrossRef] [PubMed]
- King, J. An Investigation of Factors That Contribute to Dihydroxyacetone Variation Observed in New Zealand Leptospermum scoparium. Ph.D. Dissertation, University of Waikato, Hamilton, New Zealand, 2013. [Google Scholar]
- Nickless, E.M. Influential Factors in Nectar Composition and Yield in Leptospermum scoparium. Ph.D. Dissertation, Massey University, Palmerston North, New Zealand, 2015. [Google Scholar]
- Bohórquez Rodríguez de Medina, J. Companion Biota Associated with Leptospermum scoparium (mānuka; Myrtaceae). Ph.D. Dissertation, Massey University, Palmerston North, New Zealand, 2018. [Google Scholar]
- Clearwater, M.J.; Revell, M.; Noe, S.; Manley-Harris, M. Influence of genotype, floral stage, and water stress on floral nectar yield and composition of mānuka (Leptospermum scoparium). Ann. Bot. 2018, 121, 501–512. [Google Scholar] [CrossRef] [PubMed] [Green Version]
- Irwin, R.E.; Adler, L.S.; Brody, A.K. The dual role of floral traits: Pollinator attraction and plant defense. Ecology 2004, 85, 1503–1511. [Google Scholar] [CrossRef]
- Ayasse, M.; Stökl, J.; Francke, W. Chemical ecology and pollinator-driven speciation in sexually deceptive orchids. Phytochemistry 2011, 72, 1667–1677. [Google Scholar] [CrossRef] [PubMed]
- Effah, E.; Barrett, D.P.; Peterson, P.G.; Potter, M.A.; Holopainen, J.K.; Clavijo McCormick, A. Seasonal and environmental variation in volatile emissions of the New Zealand native plant Leptospermum scoparium in weed-invaded and non-invaded sites. Sci. Rep. 2020, 10, 11736. [Google Scholar] [CrossRef] [PubMed]
- Sheridan, R.E. Environmental and Genetic Influences on Growth, Flowering, and Nectar Production in Mānuka (Leptospermum scoparium JR Forst. & G. Forst.). Ph.D. Dissertation, Massey University, Palmerston North, New Zealand, 2019. [Google Scholar]
- Team, R.C. R: A language and environment for statistical computing. R Foundation for Statistical Computing. Vienna, Austria. 2021. Available online: https://www.R-project.org/ (accessed on 27 December 2021).
- Dowdy, N.J.; Conner, W.E. Nonchalant flight in tiger moths (Erebidae: Arctiinae) is correlated with unpalatability. Front. Ecol. Evol. 2019, 7, 480. [Google Scholar] [CrossRef] [Green Version]
- Lê Cao, K.-A.; Boitard, S.; Besse, P. Sparse PLS discriminant analysis: Biologically relevant feature selection and graphical displays for multiclass problems. BMC Bioinform. 2011, 12, 253. [Google Scholar] [CrossRef] [Green Version]
- Rohart, F.; Gautier, B.; Singh, A.; Lê Cao, K.-A. mixOmics: An R package for ‘omics feature selection and multiple data integration. PLoS Comput. Biol. 2017, 13, e1005752. [Google Scholar] [CrossRef] [PubMed] [Green Version]
- Scala, A.; Allmann, S.; Mirabella, R.; Haring, M.A.; Schuurink, R.C. Green leaf volatiles: A plant’s multifunctional weapon against herbivoRes. and pathogens. Int. J. Mol. Sci. 2013, 14, 17781–17811. [Google Scholar] [CrossRef] [Green Version]
- ul Hassan, M.N.; Zainal, Z.; Ismail, I. Green leaf volatiles: Biosynthesis, biological functions and their applications in biotechnology. Plant Biotechnol. J. 2015, 13, 727–739. [Google Scholar] [CrossRef] [PubMed]
- Wei, J.; Kang, L. Roles of (Z)-3-hexenol in plant-insect interactions. Plant Signal. Behav. 2011, 6, 369–371. [Google Scholar] [CrossRef] [PubMed] [Green Version]
- Frost, C.J.; Mescher, M.C.; Dervinis, C.; Davis, J.M.; Carlson, J.E.; De Moraes, C.M. Priming defense genes and metabolites in hybrid poplar by the green leaf volatile cis-3-hexenyl acetate. New Phytol. 2008, 180, 722–734. [Google Scholar] [CrossRef] [PubMed]
- Williams, L.; Rodriguez-Saona, C.; Castle, S.C.; Zhu, S. EAG-active herbivore-induced plant volatiles modify behavioral responses and host attack by an egg parasitoid. J. Chem. Ecol. 2008, 34, 1190–1201. [Google Scholar] [CrossRef] [PubMed]
- Brodmann, J.; Twele, R.; Francke, W.; Hölzler, G.; Zhang, Q.-H.; Ayasse, M. Orchids mimic green-leaf volatiles to attract prey-hunting wasps for pollination. Curr. Biol. 2008, 18, 740–744. [Google Scholar] [CrossRef] [Green Version]
- Kárpáti, Z.; Knaden, M.; Reinecke, A.; Hansson, B.S. Intraspecific combinations of flower and leaf volatiles act together in attracting hawkmoth pollinators. PLoS ONE 2013, 8, e72805. [Google Scholar] [CrossRef] [PubMed]
- Byers, K.J.R.P.; Bradshaw, H.D., Jr.; Riffell, J.A. Three floral volatiles contribute to differential pollinator attraction in monkeyflowers (Mimulus). J. Exp. Biol. 2014, 217, 614–623. [Google Scholar] [CrossRef] [Green Version]
- Borg-Karlson, A.-K.; Valterová, I.; Nilsson, L.A. Volatile compounds from flowers of six species in the family Apiaceae: Bouquets for different pollinators? Phytochemistry 1993, 35, 111–119. [Google Scholar] [CrossRef]
- Haber, A.I.; Sims, J.W.; Mescher, M.C.; De Moraes, C.M.; Carr, D.E. A key floral scent component (β-trans-bergamotene) drives pollinator preferences independently of pollen rewards in seep monkeyflower. Funct. Ecol. 2019, 33, 218–228. [Google Scholar] [CrossRef]
- Zhou, W.; Kügler, A.; McGale, E.; Haverkamp, A.; Knaden, M.; Guo, H.; Beran, F.; Yon, F.; Li, R.; Lackus, N.; et al. Tissue-Specific Emission of (E)-α-Bergamotene Helps Resolve the Dilemma When Pollinators Are Also Herbivores. Curr. Biol. 2017, 27, 1336–1341. [Google Scholar] [CrossRef] [PubMed] [Green Version]
- Burkle, L.A.; Runyon, J.B. Drought and leaf herbivory influence floral volatiles and pollinator attraction. Glob. Change Biol. 2016, 22, 1644–1654. [Google Scholar] [CrossRef] [PubMed]
- Farré-Armengol, G.; Peñuelas, J.; Li, T.; Yli-Pirilä, P.; Filella, I.; Llusia, J.; Blande, J.D. Ozone degrades floral scent and reduces pollinator attraction to flowers. New Phytol. 2016, 209, 152–160. [Google Scholar] [CrossRef] [Green Version]
- Langford, V.; Gray, J.; Foulkes, B.; Bray, P.; McEwan, M.J. Application of selected ion flow tube-mass spectrometry to the characterization of monofloral New Zealand honeys. J. Agric. Food Chem. 2012, 60, 6806–6815. [Google Scholar] [CrossRef]
- Machado, A.M.; Miguel, M.G.; Vilas-Boas, M.; Figueiredo, A.C. Honey volatiles as a fingerprInt. for botanical origin—A review on their occurrence on monofloral honeys. Molecules 2020, 25, 374. [Google Scholar] [CrossRef] [PubMed] [Green Version]
- Mountford-McAuley, R.; Prior, J.; Clavijo McCormick, A. Factors affecting propolis production. J. Apic. Res. 2021, 1–9. [Google Scholar] [CrossRef]


| Genotype | Parentage | Growth Form | Image of Flower |
|---|---|---|---|
| Blue | L. scoparium var. scoparium selection × L. scoparium var incanum selection | Shrub | 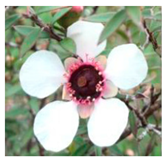 |
| Lime green | L. scoparium var. scoparium selection × L. rotundifolium cultivar | Tree | 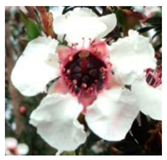 |
| Mint green | L. scoparium var. incanum selection × L. scoparium var incanum cultivar | Shrub | 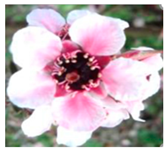 |
| Orange | L. scoparium ‘Nnicolsonii’ cultivar × L. scoparium var. scoparium selection | Shrub | 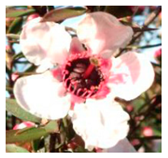 |
| Pink | L. scoparium var. scoparium selection × L. rotundifolium cultivar | Tree |  |
| Yellow | L. scoparium var. scoparium field selection | Tree | 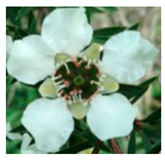 |
Publisher’s Note: MDPI stays neutral with regard to jurisdictional claims in published maps and institutional affiliations. |
© 2022 by the authors. Licensee MDPI, Basel, Switzerland. This article is an open access article distributed under the terms and conditions of the Creative Commons Attribution (CC BY) license (https://creativecommons.org/licenses/by/4.0/).
Share and Cite
Effah, E.; Min Tun, K.; Rangiwananga, N.; Clavijo McCormick, A. Mānuka Clones Differ in Their Volatile Profiles: Potential Implications for Plant Defence, Pollinator Attraction and Bee Products. Agronomy 2022, 12, 169. https://doi.org/10.3390/agronomy12010169
Effah E, Min Tun K, Rangiwananga N, Clavijo McCormick A. Mānuka Clones Differ in Their Volatile Profiles: Potential Implications for Plant Defence, Pollinator Attraction and Bee Products. Agronomy. 2022; 12(1):169. https://doi.org/10.3390/agronomy12010169
Chicago/Turabian StyleEffah, Evans, Kyaw Min Tun, Natalia Rangiwananga, and Andrea Clavijo McCormick. 2022. "Mānuka Clones Differ in Their Volatile Profiles: Potential Implications for Plant Defence, Pollinator Attraction and Bee Products" Agronomy 12, no. 1: 169. https://doi.org/10.3390/agronomy12010169
APA StyleEffah, E., Min Tun, K., Rangiwananga, N., & Clavijo McCormick, A. (2022). Mānuka Clones Differ in Their Volatile Profiles: Potential Implications for Plant Defence, Pollinator Attraction and Bee Products. Agronomy, 12(1), 169. https://doi.org/10.3390/agronomy12010169