Abstract
Deficient precipitation (dPr) in the growing season, especially in critical periods, affects plant condition and determines the quality and quantity of obtained yields. Knowledge about the variability and distribution of dPr is essential to mitigate its effect on agricultural soils and on crop and livestock production. The goal of the work is to determine the spatial and temporal distribution of spring precipitation deficiency and also to indicate the zones of risk and variability of its occurrence in Poland. It was assumed that dPr occurred when total monthly precipitation in a given year accounted for ≤75% of the total multi-year mean (1951–2018). In the spring season, the multi-year mean of the area covered by deficient precipitation (ACDP) amounted to 33% and fluctuated between approximately 31% in May and approximately 35% in March. The study distinguished four zones in Poland that vary in terms of the risk and variability of spring precipitation deficiency. The obtained results may be used, for example, to assess the needs for irrigation in the changing climate conditions, to model the growing season and yields of cultivated plants, and to select adaptation measures for agriculture in response to climate change.
1. Introduction
A lack of precipitation can give rise to meteorological drought, particularly when it is long-lasting and is accompanied by higher-than-average air temperatures and enhanced evaporation [1,2]. In addition, prolonged periods of such weather can lead to agricultural drought, during which plants suffer from water deficiency in the soil [3], or even to hydrological drought, which manifests as reduced water levels in rivers and lakes [4].
According to the Köppen climate classification, Poland is almost completely covered by a Dfb zone, except for a small area in the south that is a Dfc zone [5]. Significant changes in precipitation values are not recorded in Poland [6,7,8]. However, significant changes in air temperature are recorded, and it has been confirmed that the highest significant air temperature increases in Poland are in spring and in winter [9,10,11,12,13]. The seasonal and spatial diversity of changes in precipitation trends in Poland largely results from air circulation and nephological conditions [14,15,16,17,18]. The results of the research presented in the Fourth IPCC Report [19], which was conducted on the basis of the SRES A1B scenario, indicate that central Europe will see an increase in winter precipitation and a decrease in summer precipitation by the end of the 21st century. Similar results to those from the Fourth IPCC Report [19] were achieved by [20] for south-west Poland and east Saxony in Germany with the use of the WETTREG method, which is based on the A1B, RCP2.6 and RCP8.5 scenarios for two time horizons: 2021–2050 and 2071–2100. Romanowicz et al. [21], using not only general circulation models (GCM) but also regional climate models (RCM) and RCP4.5 scenario assumptions, stated that precipitation in Poland will increase by up to 15% by the end of the 21st century, with warming of up to 2 °C. The latest, Sixth Assessment Report of the IPCC forecasts that continued global warming will increase global water circulation and variability even more, and wet and dry events will become more intense [22].
The effect of precipitation on Poland’s agriculture is significant due to its type and characteristics, i.e., intensity, variability, temporal and spatial distribution and an ambiguous trend [23]. Precipitation in Poland, although it is one of the lowest in Europe, not only supplies soil with water but also exacerbates increasingly frequent post-winter shortages of water in soil, which determine the amount of field production of various groups of crops [24,25,26,27]. This dependence is strengthened by Poland’s poorly developed irrigation system, which covers only 0.55% of its agricultural land [28].
Therefore, precipitation, as an input in the water balance, constitutes the main source of water, which is necessary for crop plants. However, high crop plant yields result not only from adequate precipitation total, but also from precipitation distribution throughout the entire growing season [29]. Plants cultivated in arable soils mainly use rainwater stored in soil from 10 to 100 kPa, which is represented by easily accessible ground water [23]. Precipitation deficits lead to drying out of the soil, which in turn means that plants are not able to take up nutrients easily. A long-lasting lack of precipitation causes cultivated plants to develop more slowly, mature too early, and give lower yields [30,31]. It is predicted that lower yields of cereal crops caused by meteorological drought in Poland in 2041–2070 will occur more frequently than in 1981–2010 [1]. Moreover, ref. [32] forecasted reduced yields of potato and wheat in most areas of Poland as a result of drought and heatwaves. The research by [33] shows that in 1993–2013, as much as 80% of wheat yield losses in 25 member states of the EU, including Poland, were caused by drought and heatwaves.
In order to increase the effectiveness of water use in agroecosystems, it is advisable to apply various agricultural practices, including subsoiling, which improves soil infiltration and retentiveness and ensures better conditions for the development of roots. Another recommended treatment is mulching, which limits water evaporation from soil and improves the physical properties of surface soil [34]. Reduction in row spacing and diversification of crop rotation in order to enhance the resistance of the whole crop system also contribute to increased effectiveness of water use in conditions of water deficits [35]. However, it seems that the negative effects of deficient precipitation and consequent droughts in agriculture can be countered by irrigation.
Knowledge about the temporal variability of precipitation deficits and the areas of Poland in which precipitation deficits occur in spring can be used to determine how much irrigation is needed to maintain the stability of crop management in arable land. In addition, knowledge about precipitation monitoring may be useful for farmers in initial operational estimations of the demand for irrigation [23].
Monitoring precipitation deficiency and its effects in agriculture is not an easy task. However, it seems necessary as research has shown that meteorological droughts may occur more frequently in Central Europe, including Poland, in particular in spring [2,26,36]. Moreover, drought generates considerable damage and financial losses in the EU; in the last 30 years, this was estimated to be more than 100 billion euros [1]. As a result of climate change, there is increasing yield variability [37]. In addition, new threats to cultivated plants caused by pests and pathogens which did not previously occur in various parts of Europe (including Poland) have arisen [38]. The observed disappearance of snow cover in winter and an increase in air temperature, both of which lead to changes in the previous development phases of plants, cause the variability of spring conditions to have an increasing influence on the growth and development of cultivated plants. Research to date also shows that current selection breeding programs do not sufficiently prepare cereal varieties for climatic uncertainty and variability [39]. Therefore, it is necessary to temporally and spatially determine the distribution of spring precipitation deficiency and indicate the zones of risk and the variability of the occurrence of spring precipitation deficiency in Poland.
2. Materials and Methods
2.1. Meteorological Data
The study uses the following data: total monthly precipitation (Pr, mm) and the mean monthly air temperature (Ta, °C) in the spring season (MAM), i.e., March, April and May. The meteorological data were collected between 1951–2018 from 74 weather stations (Figure 1) of the Institute of Meteorology and Water Management—National Research Institute (IMGW-PIB).
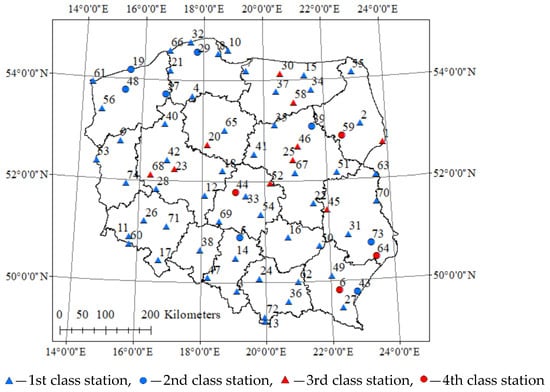
Figure 1.
Location of the weather stations considered in the research.
Some data were missing, so these were supplemented by means of linear and non-linear regression equations that describe the relationship between the series of data of the analyzed meteorological element from the two closest weather stations and those which best reflected geographical conditions. To fill the gaps in the temporal series, the study used only equations for which the coefficient of determination was at least 64% Pr and 81% Ta. Meteorological data homogeneity was checked by Bartlett’s test at a level of significance of α < 0.05 [7,40]. Distribution normality for Pr and Ta was evaluated by a Chi-squared test. Time series for different than normal Pr distributions were transformed according to the formula:
where is the transformed total monthly precipitation, Pr is the measured total monthly precipitation [41].
The study also used the spring index of North Atlantic Oscillation (NAO MAM) for 1951–2018 [42]; the NAO MAM index describes meteorological phenomena related to the global circulation of air and oceanic waters that manifest as fluctuations of, e.g., precipitation and air temperature.
Area values for Poland were calculated on the basis of 74 IMGW-PIB weather stations. The reference period (‘the norm’) was the multi-year period from 1951–2018.
2.2. Precipitation Deficits
It was assumed in the study that precipitation deficiency (dPr, mm) occurred when total monthly precipitation amounted to ≤75% of the mean multi-year precipitation (1951–2018). Monthly precipitation deficits of different degrees of intensity were distinguished: high when Pr in a given year was only <25% of the mean multi-year precipitation; medium when Pr oscillated 25–50% of the mean multi-year precipitation; and low when Pr was 50–75% of the mean multi-year precipitation [43]. The determined precipitation deficiency is presented graphically. Normal precipitation constituting 75–125% of the mean multi-year precipitation and excess precipitation > 125% of the multi-year mean were also taken into consideration.
The area of the country (Poland) covered by deficient precipitation (ACDP, %) was separately determined for each degree of intensity for three consecutive months of the spring season (March, April and May) for each year of the analyzed multi-year period, i.e., for 204 months in total. ACDP in the spring season was the three-month average from March, April and May. Calculations of the ACDP index were performed using ArcGis 10.6.1 software.
2.3. Temporal Distribution
Area spring precipitation was characterized by the following indices: the mean (, mm); standard deviation (sd, mm); the coefficient of variation (cv, %); extreme values—the lowest (min, mm) and the highest (max, mm), calculated for spring and its individual months (March, April, May) in the entire analyzed multi-year period of 1951–2018. The study determined the percentage share of monthly precipitation in spring. The linear trend (r) at a level of significance at α < 0.1 and α < 0.01 was determined by Spearman’s rank correlation coefficient. Areas of the country with precipitation deficiency (ACDP, %) were characterized by the means of the indices , sd, min, max and r, and also by consecutive years of the multi-year period, depending on the intensity of the analyzed meteorological phenomenon and the analyzed month. The value of ACDP in spring for the whole country is presented in scatter graphs in relation to the variability of precipitation, thermal and air pressure conditions in 1951–2018.
2.4. Spatial Distribution
The maps showing the statistical characteristics of precipitation conditions in different time ranges, in this case in the spring season, and by months for Poland’s 16 administrative provinces (NUTS 2) were prepared using inverse distance weighting with ArcGis 10.6.1 software. The spatial resolution of the maps was 4 × 4 km2. The critical values of Spearman’s rank correlation coefficient for the linear trend of precipitation amount to α ≤ 0.1–0.201 and α ≤ 0.01–0.311. The maps also present the frequency of precipitation deficiency based on its intensity, and air temperature expressed as a deviation from the area multi-year mean (ΔTa, °C). The study used four ranges of Ta, ΔTa > 2 °C, 2 °C ≥ ΔTa > 0 °C, 0 °C ≥ ΔTa > −2 °C, ΔTa ≤ −2 °C, for which the frequency of dPr was calculated.
The zones of risk and the variability of spring precipitation deficits in Poland were determined on the basis of the quotient of the deficit frequency (Fq, %, calculated as a three-month average from March, April and May), and the standard deviation of the deficits in 1951–2018. The four zones of risk and variability were distinguished by means of the Jenks natural breaks classification method with the use of ArcGis 10.6.1 software.
Statistical analyses were performed with STATISTICA 13.3 and Excel 2010.
3. Results
3.1. Temporal and Spatial Structure of Spring Precipitation
In 1951–2018, the area mean precipitation in Poland in the spring season was about 139 mm and fluctuated from 89 mm in 1953 to approximately 221 mm in 2010 (Figure 2, Table 1). In spring months, Pr amounted to 35.4 mm in March, 41 mm in April, and 62.5 mm in May. The highest Pr in the analyzed period was recorded in May (153.7 mm, in 2010); the lowest was in April (6.5 mm, in 2009).
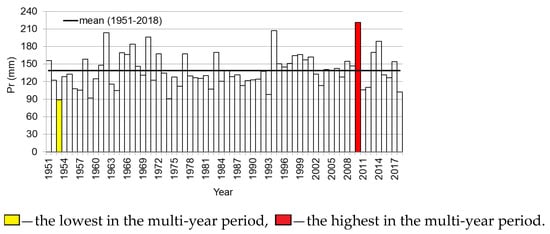
Figure 2.
Variation of spring (March–May) area precipitation in Poland. Years 1951–2018.

Table 1.
Characteristics of spring (March–May) area precipitation in Poland. Years 1951–2018.
Precipitation in May constituted the biggest share, as much as 45%, of total spring precipitation; precipitation in April was 29.5%, and the lowest share was 25.5% precipitation in March. Sd determined for the spring area precipitation total in Poland was about 29 mm and fluctuated between 13.5 mm in March and 20.3 mm in May. On the other hand, cv oscillated between 32.4% in May and 38% in March. A significant change (increase) in Pr in 1951–2018 was found only for March (r = 0.23, α < 0.1).
In the examined multi-year period, spring precipitation in Poland fluctuated between <150 mm in north and central Poland and >300 mm in the south (Figure 3). In the years with the highest or lowest values of Pr, both the value and spatial distribution of precipitation were different than in the multi-year period. In 1953, Pr mostly oscillated from <50 to >300 mm, with the lowest values in the north-east. In 2010, it fluctuated between <200 and >600 mm, with the highest values in south Poland, i.e., in high mountain areas. In March, precipitation in the north-west constituted the biggest share of the total spring precipitation (>30%); in April, the biggest share was in the north-east and central-east parts (>30%); in May, the biggest share was in the south and central-east parts (>45%) (Figure 4).
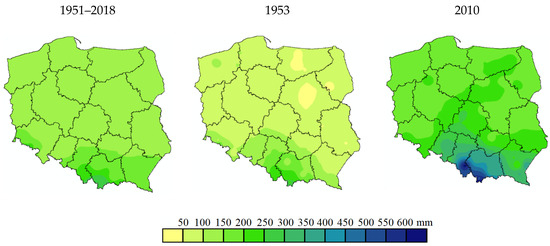
Figure 3.
Spatial distribution of total spring (March–May) precipitation in Poland between 1951–2018 (multi-year period), 1953 (the lowest in the multi-year period) and 2010 (the highest in the multi-year period).
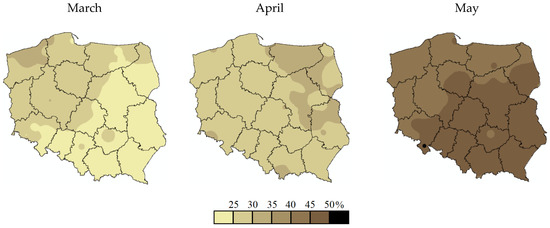
Figure 4.
Percentage of monthly precipitation in the total spring (March–May) precipitation in Poland. Years 1951–2018.
Precipitation in May even amounted to >50% of the total spring precipitation, but only locally (the Kłodzko Valley). Sd of spring precipitation was mainly within the 40–70 mm range; the highest values were found for south Poland (Figure 5).
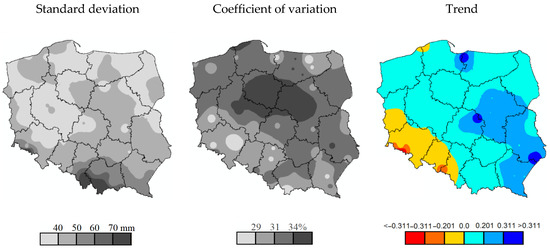
Figure 5.
Variability and trend of total spring (March–May) precipitation in Poland. Years 1951–2018.
Spatial distribution of cv for spring precipitation was different than the distribution of sd; the highest values were in central Poland, while the lowest values were mainly in some areas of south-west and north-east Poland. A significant upward trend of spring Pr in 1951–2018 was found in the east and the north.
3.2. Spatial Structure of Precipitation Deficits
Spatial distributions of monthly precipitation deficits (dPr), presented for each analyzed spring season in consecutive years of the multi-year period of 1951–2018, differ from each other both in terms of the size of areas of various precipitation deficit intensities and the location of these areas in Poland (Figure 6). Examples of distributions for 7 years (1953, 1959, 1963, 1964, 1974, 1976 and 1993), with the biggest mean area of dPr in the spring season, are shown in Figure 6. Out of these 7 examples, the largest area with high-intensity precipitation deficits was north-east Poland in March 1953; east, central and south Poland in March 1974; and north Poland in April 1974. Precipitation deficits of moderate and low intensity were found for much larger areas of the country, as is described in the sub-chapter below.
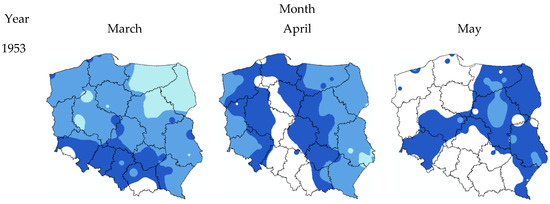
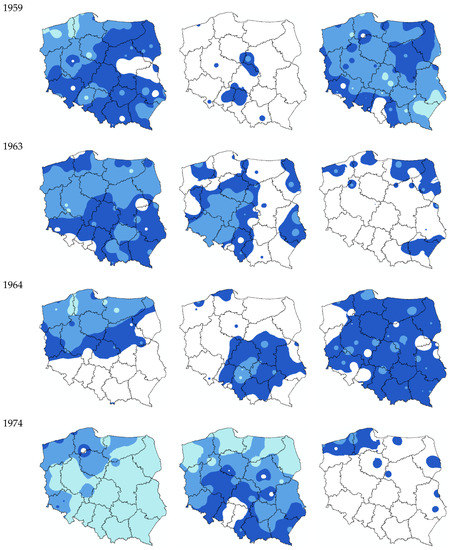
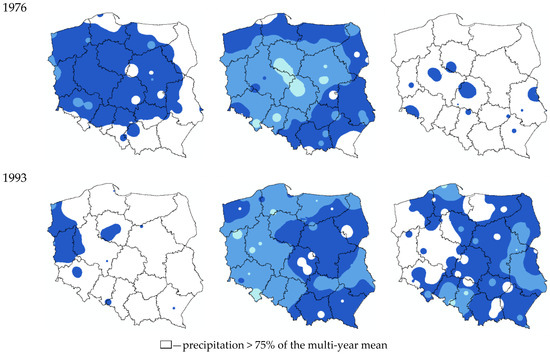
Figure 6.
Spatial distribution of spring precipitation deficits of varying intensity: high ( ), medium (
 ) and low (
 ) in selected years of the multi-year period of 1951–2018 by month from March to May in Poland.
), medium () and low () in selected years of the multi-year period of 1951–2018 by month from March to May in Poland.
3.3. Area of the Country with Precipitation Deficiency—Variability and Temporal Structure
In spring 1951–2018, the mean area covered by deficient precipitation (ACDP) amounted to 33% of Poland’s area and fluctuated from 30.7% in May to 35.1% in March (Figure 7, Table 2).
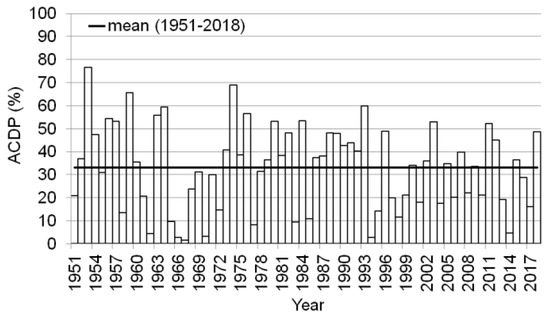
Figure 7.
Area of the country covered by spring precipitation deficits (calculated as a three-month average: March, April and May) in 1951–2018.
Table 2.
Characteristics of the area covered by spring (March–May) precipitation deficits. Years 1951–2018.
In the spring season, >55% of ACDP was determined for seven years: 1953 (76.6%), 1959 (65.6%), 1963 (55.8%), 1964 (59.3%), 1974 (68.9%), 1976 (56.5%) and 1993 (59.8%). The highest value, approximately 77%, of ACDP in the analyzed season was found for 1953; in March for 1974 (99.8%); in April for 2009 (100%); and in May for 1956 (99.9%). The lowest value of ACDP in the spring season was calculated for 1967 and was only about 2%. In some years, the monthly ACDP amounted to 0%. This was the value of ACDP in March 1967, 1994, 1977, 1979, 2000 and 2009; in April 1970, 1980 and 2001; and in May 1962, 1996 and 2010. Sd in the spring season calculated for ACDP was about 18% and oscillated between 28.8% in May and 33.8% in March. A significant negative ACDP trend was found only for March (r = −0.24, α < 0.05). In the other analyzed periods (spring, April and May) the trend was not significant even at α < 0.1.
Monthly ACDP in 1951–2018 was, as expected, dependent on the value of Pr (Figure 8).
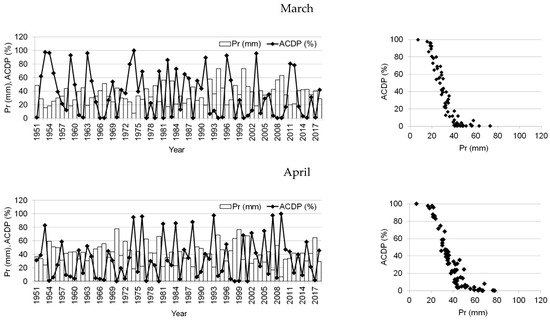
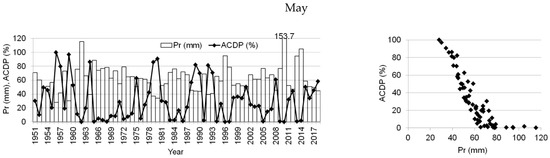
Figure 8.
The changing areas of Poland affected by deficient precipitation (ACDP) against the variability of monthly area precipitation (Pr) in Poland (the left side of the figure), and the dependence of ACDP from Pr (the right side of the figure). Years 1951–2018.
For instance, in March 1974 with an area total precipitation of only 7.6 mm, the value of ACDP was as much as 99.8%. Similarly, in April 2009, with an area total precipitation of only 6.5 mm, the value of ACDP was as much as 100%; in May 1956, with an area precipitation of 27.9 mm, the ACDP value was as much as 99.9%. The lowest values of ACDP, <3%, were accompanied by Pr within a range of 40.4–73.3 mm for March, 55.7–77.9 mm for April, and 65.4–153.7 mm for May.
The value of ACDP in particular months of the spring season and the analyzed years varied (Figure 9).
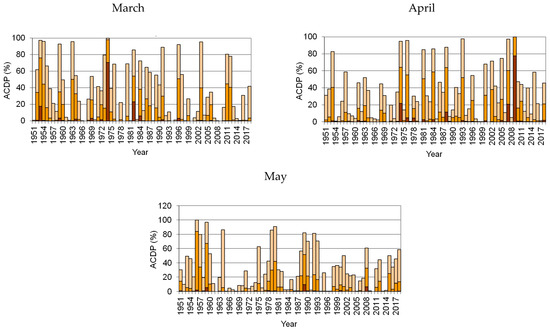
Figure 9.
Area of the country affected by deficient precipitation (ACDP) by months of different intensity: high ( ), medium (
 ) and low (
 ). Years 1951–2018.
), medium () and low (). Years 1951–2018.
The highest values of ACDP, ≥90%, were in March for the years 1953, 1954, 1959, 1963, 1974, 1996 and 2003 (from 92.2 to 99.8%). In April the highest values of ACDP were for the years 1974, 1976, 1993, 2007 and 2009 (from 94.8 to 100%); in May, the highest values of ACDP were for the years 1956, 1959 and 1980 (from 90.7 to 99.9%). In March, the largest area of the country with high intensity of deficient precipitation was recorded in 1974 (as much as about 71% of the country’s area); the largest area with medium intensity of deficient precipitation was recorded in 1953 (at approximately 58% of the country’s area); and the largest areas with low intensity of deficient precipitation were recorded in the years 1954, 1955, 1959, 1973, 1976, 1980, 1991, 1997 and 2003 (from 50.4 to 66.4% of the area of Poland). In April, ACDP with dPr of high intensity fluctuated between 0% in as many as 43 years and approximately 78% in 2009; dPr of medium intensity fluctuated between 0% in 11 years and approximately 56% in 1984; dPr of low intensity fluctuated between 0% only in 3 years and approximately 56% in 2015. Finally in May, the highest value of ACDP of high intensity was only about 10% in 1989; of medium intensity, 82% in 1956; of low intensity, 81% in 1964.
3.4. Thermal and Pressure Determinants of Poland’s Area Covered by Precipitation Deficiency
All identified values of ACDP in spring that amounted to >55% were accompanied by total area precipitation in a given year below the multi-year mean: from 64.1% of the mean multi-year precipitation (∆Pr) in 1953 to 83.1% of this mean in 1963 (Figure 10). The highest values of ACDP were calculated with area air temperature below the multi-year mean, in 1963, 1964, 1974 and 1976 (∆Ta from −0.3 °C in 1974 to −1.9 °C in 1964), and also above the multi-year mean, from 0.1 °C in 1953 to 0.8 °C in two years (1959 and 1993). The situation is different in the case of the NAO MAM index. In the negative phase of NAO, >55% of ACDP was calculated only in 1953 (NAO MAM: −1.4); in the positive phase of NAO, >55% of ACDP were calculated in six years: 1959, 1963, 1964, 1974, 1976 and 1993 (NAO MAM from 0.0 in 1974 to 3.0 in 1976).
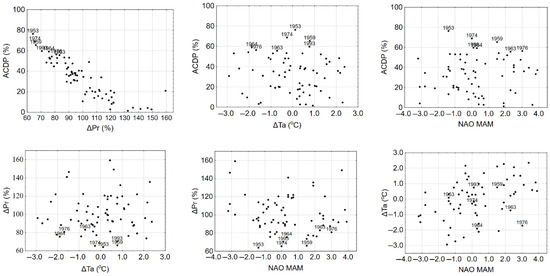
Figure 10.
Spring value of ACDP in Poland against precipitation variability (ΔPr), thermal conditions of air (ΔTa) and air pressure conditions (NAO MAM) in 1951–2018 and the dependence of ΔPr on ΔTa and NAO MAM, and the dependence of ΔTa on NAO MAM (the charts only indicate the 9 years with the highest value of ACDP). Notes: ACDP—area of the country covered by deficient precipitation (%), NAO MAM—the North Atlantic Oscillation index in spring, ΔTa—deviation of mean area air temperature from the multi-year mean in spring (°C), ΔPr—area spring precipitation expressed as a percentage of the mean multi-year precipitation (%).
For example in 1953 and 1974, when the spring value of ACDP in Poland was the highest in the multi-year period of 1951–2018 (respectively, approximately 77 and 69% of Poland’s area), meteorological conditions were different (Figure 10). The Pr index expressed as % of the total multi-year precipitation (ΔPr, %) was similar for both years and was approximately 64–66%; the Ta index expressed as a deviation of the mean areal air temperature from the multi-year period (ΔTa, °C) was 0.1 °C in 1953 and −0.3 °C in 1974; the NAO index was −1.4 in 1953 and 0.0 in 1974.
On the other hand, in two other years, 1963 and 1976, when the value of ACDP was about 56–57%, ΔPr was at a level of approximately 83 and 81%, respectively; ΔTa was −0.7 and −1.7 °C, respectively; and NAO was 2.3 and 3.0, respectively.
In the years of the highest values of ACDP, >55%, the spatial distribution of the deviation of spring air temperature from the multi-year mean in Poland was fairly diverse and mainly fluctuated from <−2.0 to >1.5 °C (Figure 11).
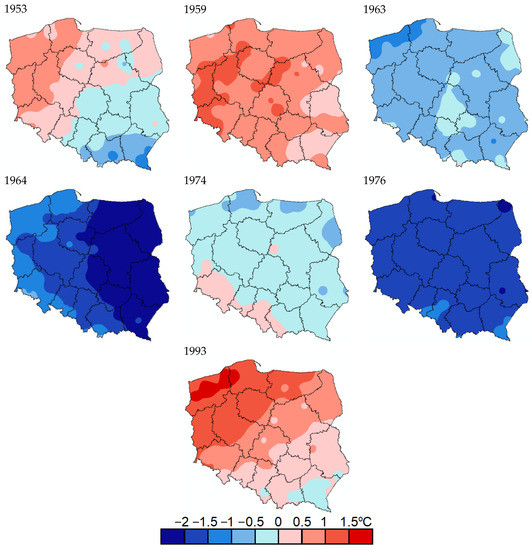
Figure 11.
Spatial distribution of air temperature deviations in spring from the multi-year mean in the years when deficient precipitation covered the largest area of Poland.
In most parts of Poland, positive ΔTa was determined for 1953, 1959, 1993; negative ΔTa was determined for 1963, 1964, 1974 and 1976. Air temperature at least 1.0 °C higher than the multi-year mean was recorded mostly in west Poland; lower temperature (at least −1 °C) was recorded mostly in south-east Poland, and in almost the entire country in 1964 and 1976. The distribution of ΔTa in 1953 was also unusual: temperatures of at least ±1 °C difference from the mean occurred simultaneously; higher temperatures in the north-west, and lower temperatures in the south-east.
3.5. Risk of Precipitation Deficiency
The frequency of dPr of high intensity fluctuated in Poland in consecutive months of the spring season only from 0 to 7.5% (Figure 12).
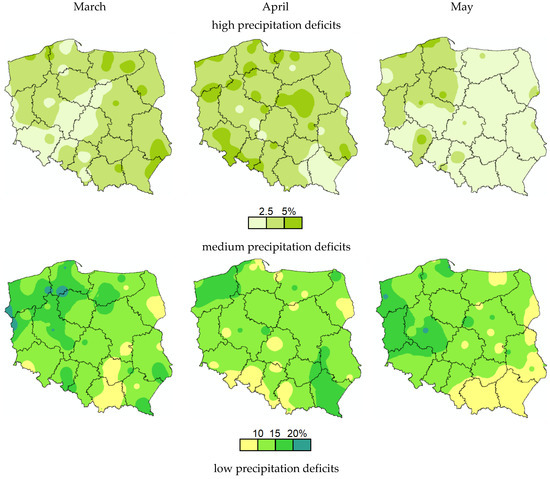
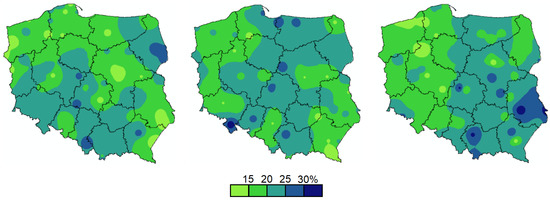
Figure 12.
Frequency of precipitation deficits in Poland in consecutive months of spring (from March to May) of different degrees of intensity: high, medium and low. Years 1951–2018.
More often, but only within a range of >5%, dPr of high intensity was recorded in east and north-east Poland in March; in north, west and central Poland in April; and in north-west and west Poland in May. dPr of medium intensity occurred much more frequently, within the range from 5 to 25%. With such intensity, precipitation deficits were recorded more often than normally, at a level of 15–25%, mostly in north-west and central-west Poland in all spring months. Apart from the western part of Poland, dPr of medium intensity was also recorded in south and south-east Poland in March and April. Least often, namely <10%, dPr of medium intensity was mainly recorded in south and south-east Poland in all spring months. Small precipitation deficiencies (i.e., precipitation within a range of 50–75% of the multi-year mean) from March to May occurred frequently (at a level of 25–30%) in south and central Poland, and also in April and May in the north. Locally, dPr of low intensity was recorded even with a frequency of >30%, mainly in central Poland.
The frequency of dPr was also determined in relation to ΔTa (Figure 13).
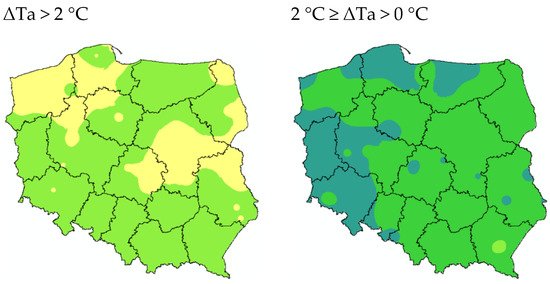
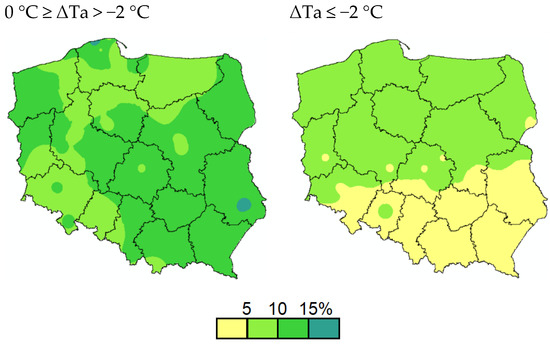
Figure 13.
Frequency of spring (from March to May) precipitation deficits in Poland, depending on air temperature, expressed as deviation from the area multi-year mean (ΔTa). Years 1951–2018.
With ΔTa amounting to >2 °C, precipitation deficits occurred with a frequency from 0 to 10%. Higher risk of dPr mainly occurs in south, central-west, central and north-east Poland; lower risk of dPr occurs in central-east and north-west Poland. With ΔTa within a range from 0 to 2 °C, precipitation deficiency was recorded with a frequency from 10 to 20%; most often it occurred in west and north Poland. dPr was also recorded with Ta below the norm. With ΔTa amounting to <−2 °C, dPr occurred with a frequency of only 0–10%, and with ΔTa within a range from 0 to −2 °C dPr occurred with a frequency from 10 to 20%. In the latter case, the phenomenon was mostly identified only locally in central-east Poland.
3.6. Zones of Risk and Variability of Precipitation Deficits
The study determined four zones of spring precipitation deficiency in Poland. The zone of the highest mean frequency of dPr, approximately 40%, is marked as IV and encompassed about 34% of the country’s area (Table 3). Zone IV is located in north, north-west and central-west Poland (Figure 14). The other three zones, III, II and I, covered approximately 43, 15 and 8% of the country’s area, respectively. The average frequency of dPr in Zones III, II and I was approximately 38, 35, and 31%, respectively.
Table 3.
Characteristics of the zones of risk and variability of spring (from March to May) precipitation deficits in Poland. Years 1951–2018.
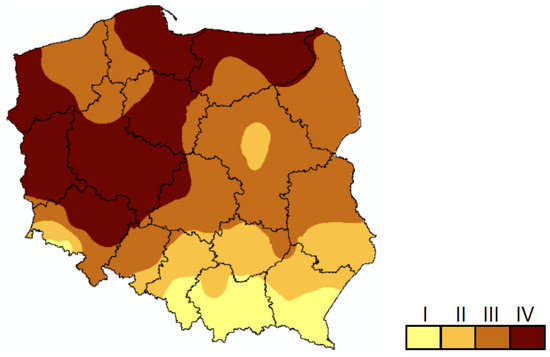
Figure 14.
The zones of risk and variability of spring (from March to May) precipitation deficits in Poland. Years 1951–2018.
Zone III was situated mainly in north-west, north-east and central-east Poland, and in the central strip of the country stretched longitudinally east of Zone IV. Zones II and I were located in the south-west and the south of Poland; Zone I directly bordered Czechia and Slovakia (Figure 14).
The higher the risk of dPr, the lower the spring precipitation. Pr oscillated from about 118 mm in Zone IV to about 243 mm in Zone I, and the variability of Pr expressed as a standard deviation varied from about 37 mm in Zone IV to about 74 mm in Zone I.
4. Discussion
The factors which cause lower total precipitation in relation to the mean from 1951–2018 in central and north Poland are the lie of the land and also location in a rain shadow. On the other hand, higher total precipitation is recorded in the mountain areas in the south of Poland. The spring value of Pr for the analyzed multi-year period (approximately 139 mm) is similar to the results obtained by [6,7,44,45]. According to [6,14,15,45,46], Pr in March increases, which is also shown in this work on the basis of the multi-year period of 1951–2018, excluding south-west Poland. A slight Pr positive or negative trend in the spring season, combined with confirmed global warming, increases the risk of water deficiency in Poland [11,15,32,47]. According to [15], in the last 20 years of the 20th century and at the beginning of the 21st century, the rate of warming in the winter-spring season increased considerably.
Poland is seeing a shift of atmospheric drought from summer to spring and autumn [7]. In this study, it was proved that spring precipitation deficiency in Poland was characterized by a different degree of intensity in individual years and a varying size of the area of its occurrence and distribution. The research also shows that the type of precipitation has changed [48]. Instead of long-lasting precipitation, more and more frequently it is possible to witness short torrential rains, which are often separated from each other by long rainless periods that result in atmospheric droughts.
According to the ACDP index calculated for Poland for 1951–2018, the largest area, i.e., >55%, covered by deficient precipitation in the spring season was determined for 1953,1959, 1963, 1964, 1974, 1976 and 1993. In the same years, precipitation below the multi-year mean was also recorded by other researchers in various regions of Poland, e.g., in March in 1963, 1964, 1974, 1976 and 1993 [8,49]; in April in 1974, 1976 and 1993 [49]; and in May in 1963, 1964 and 1974 [49]. Precipitation deficiency occurs with varying frequency, depending on the degree of its intensity and the region of occurrence, both of which are conditioned by climatic factors [50]. This study shows that deficient precipitation most frequently occurs in central-west and north Poland. This study also determined the frequency of dPr depending on its intensity and the variation of thermal conditions, at temperatures both below and above multi-year means. To date, such an approach has not yet been the subject of analyses relating to the whole country.
Unfavorable precipitation conditions lead to reduced field crop production, especially in regions of Poland where irrigation of crop plants is insufficient. The fact that Poland has only a small area of irrigated fields is caused not only by a lack of water resources, but also by the absence of irrigation systems and equipment [51]. According to [28], less than 1% of farms in Poland possess irrigation equipment. Out of the crops of the largest acreage, spring cereals and winter cereals are most exposed to deficient precipitation in the spring season, particularly in April and May [52]. In the 2020/2021 growing season, cereals covered approximately 8 million ha of Poland’s area [53].
For example, in spring after the sowing of spring cereals, spring barley and maize also emerge; spring wheat emerges and tillers; and oats emerge, and tiller and shoot [54]. Insufficient supply of water in these phenological phases of spring crops often results in sparse growth, uneven emergence, poor tillering, and a shallow, poorly developed root system [52]. After winter cereals resume in the growing season in spring, winter rye, winter wheat and winter barley undergo shooting and tillering [54]. In the period of shooting-heading, i.e., when winter crops need a lot of water, dPr in the spring season may lead to a reduction of the assimilation surface and worse yields of these plants [52,55]. It is worth noting that the problem of supplying winter crops with water in spring will intensify with the continuing disappearance of snow cover in winter, which results in decreasing water levels in soil. Moreover, not without significance are changes in the phenophases of cultivated crops that take place due to increased air temperature. Possible acceleration of the growth and development of plants changes the calendar dates of the periods which are critical in terms of water demand.
The negative effect of dPr on the growth, development and yield of cultivated plants can be partly reduced by efficient monitoring of meteorological conditions, including precipitation, taking into consideration soil conditions and cultivation of particular plants. The data obtained as part of such monitoring could help to determine not only the value of dPr in the growing season but also its varying intensity, variability in time and space, and even a trend of various time horizons. Additionally, monitoring based on a simple indicator that describes dPr variation should make it possible to specify irrigation needs in agricultural parts of Poland. Moreover, this could help farmers and managers of agri-food companies to undertake actions that prevent lower agricultural production, which could lead to crop failures and, consequently, to supply chain disruptions.
5. Conclusions
The paper shows that spring precipitation deficiency may take place in any part of Poland, and its intensity varies in particular years. There is no statistically confirmed trend of total precipitation in spring and monthly precipitation in April and May. However, a positive trend of total precipitation in March and a negative trend of the size of area covered by deficient precipitation in this month were determined. On average, deficient precipitation in spring occurs in more than a third of Poland’s area. Out of the three spring months, it has the biggest range in March, covering approximately 35% of the country. Except for March, in the subsequent spring months, there is no clear trend of the size of the area with deficient precipitation. It is worth noting that, in three years in April and May, precipitation deficiency did not occur anywhere in Poland, and in March it only occurred in six of the analyzed 68 years.
Intensification of deficient precipitation was determined, taking into account the relationship between the total precipitation in a given analyzed period and the value of the multi-year mean, adopting the following criteria: precipitation <25% of the total multi-year mean indicated high deficiency; precipitation from 25 to 50% of the total multi-year mean indicated medium deficiency; and precipitation from 50 to 75% of the total multi-year mean indicated low deficiency. Out of the three spring months, high precipitation deficiency most often occurred in April; it was slightly less frequent in May and even less frequent in March.
High intensity of dPr was recorded most frequently in east Poland in March; in north, central and west Poland in April; and in north-west Poland in May. Medium intensity dPr was recorded most frequently in west Poland and also in April in the south-east. Low intensity dPr was recorded most frequently in east and central Poland. The observations confirmed a high spatial diversity of deficient precipitation. Precipitation deficiency occurred with the same frequency in years when the temperature was below or above the multi-year mean, but the places of its occurrence were changeable.
Such a high diversity of the location and time of deficient precipitation in Poland leads to high uncertainty as regards specifying the needs for irrigation and implementation of other agricultural measures to adapt to climate change. The determined zones of risk and variability of spring precipitation deficiency and the frequency of dPr of various intensity and in various thermal conditions may be used to assess the needs for irrigation in the changing climate conditions and also to model the growing season and the yield of cultivated plants. This research on the temporal and spatial distribution of Pr, dPr and ACDP should be continued and even conducted in other seasons of the year as climatic instability and variability predicted by climatologists for the coming decades may significantly affect them and, in consequence, influence the agrarian structure in Poland.
Author Contributions
Conceptualization, R.K.; methodology, R.K. and E.K; formal analysis, E.K. and R.K.; data curation, R.K.; writing—original draft preparation, R.K. and E.K.; writing—review and editing, R.K.; visualization, R.K.; supervision, E.K. All authors have read and agreed to the published version of the manuscript.
Funding
The APC is co-financed by Wrocław University of Environmental and Life Sciences.
Institutional Review Board Statement
Not applicable.
Informed Consent Statement
Not applicable.
Data Availability Statement
Publicly available datasets were analyzed in this study. This data can be found here: https://danepubliczne.imgw.pl/apiinfo (accessed on 4 February 2021); https://dane.imgw.pl/ (accessed on 4 February 2021).
Conflicts of Interest
The authors declare no conflict of interest.
References
- Spinoni, J.; Naumann, G.; Vogt, J.V.; Barbosa, P. Meteorological Droughts in Europe: Events and Impacts–Past Trends and Future Projections; Publications Office of the European Union: Luxembourg, 2016; p. 134. [Google Scholar] [CrossRef]
- Ionita, M.; Nagavciuc, V.; Kumar, R.; Rakovec, O. On the curious case of the recent decade, mid-spring precipitation deficit in central Europe. NPJ Clim. Atmos. Sci. 2020, 3, 49. [Google Scholar] [CrossRef]
- Pińskwar, I.; Choryński, A.; Kundzewicz, Z.W. Severe Drought in the Spring of 2020 in Poland—More of the Same? Agronomy 2020, 10, 1646. [Google Scholar] [CrossRef]
- Karamuz, E.; Bogdanowicz, E.; Senbeta, T.; Napiórkowski, J.; Romanowicz, R. Is It a Drought or Only a Fluctuation in Precipitation Patterns?—Drought Reconnaissance in Poland. Water 2021, 13, 807. [Google Scholar] [CrossRef]
- Beck, H.E.; Zimmermann, N.E.; McVicar, T.R.; Vergopolan, N.; Berg, A.; Wood, E.F. Present and future Köppen-Geiger climate classification maps at 1-km resolution. Sci. Data 2018, 5, 180214. [Google Scholar] [CrossRef]
- Pińskwar, I.; Choryński, A.; Graczyk, D.; Kundzewicz, Z. Observed changes in precipitation totals in Poland. Geogr. Sb. Ceske Geogr. Spol. 2019, 124, 237–264. [Google Scholar] [CrossRef]
- Ziernicka-Wojtaszek, A.; Kopcińska, J. Variation in Atmospheric Precipitation in Poland in the Years 2001–2018. Atmosphere 2020, 11, 794. [Google Scholar] [CrossRef]
- Kalbarczyk, R.; Kalbarczyk, E. Precipitation variability, trends and regions in Poland: Temporal and spatial distribution in the years 1951–2018. Acta Geogr. Slov. 2021, 61, 41–71. [Google Scholar] [CrossRef]
- Pospieszyńska, A.; Przybylak, R. Air temperature changes in Toruń (central Poland) from 1871 to 2010. Theor. Appl. Climatol. 2019, 135, 707–724. [Google Scholar] [CrossRef]
- Ziernicka-Wojtaszek, A.; Krużel, J. The Diversification of Air Temperature Trends in Poland (1981–2010). Pol. J. Environ. Stud. 2016, 25, 2205–2209. [Google Scholar] [CrossRef]
- Kalbarczyk, R.; Kalbarczyk, E.; Ziemiańska, M.; Raszka, B. Assessment of Air Thermal Conditions in the Lowland Part of South-Western Poland for Agriculture Development Purposes. Atmosphere 2018, 9, 215. [Google Scholar] [CrossRef]
- Canales, F.; Jadwiszczak, P.; Jurasz, J.; Wdowikowski, M.; Ciapała, B.; Kaźmierczak, B. The impact of long-term changes in air temperature on renewable energy in Poland. Sci. Total. Environ. 2020, 729, 138965. [Google Scholar] [CrossRef] [PubMed]
- Ziernicka-Wojtaszek, A. Pluviothermal Regionalization of Poland in Light of Present-Day Climate Change. Pol. J. Environ. Stud. 2019, 29, 989–996. [Google Scholar] [CrossRef]
- Degirmendžić, J.; Kożuchowski, K.; Żmudzka, E. Changes of air temperature and precipitation in Poland in the period 1951-2000 and their relationship to atmospheric circulation. Int. J. Clim. 2004, 24, 291–310. [Google Scholar] [CrossRef]
- Żmudzka, E. Contemporary changes of climate of Poland [Współczesne zmiany klimatu Polski]. Acta Agrophys. 2009, 13, 555–568. (In Polish) [Google Scholar]
- Twardosz, R.; Niedźwiedź, T.; Łupikasza, E. The influence of atmospheric circulation on the type of precipitation (Kraków, southern Poland). Theor. Appl. Clim. 2010, 104, 233–250. [Google Scholar] [CrossRef]
- Bartoszek, K.; Skiba, D. Circulation types classification for hourly precipitation events in Lublin (East Poland). Open Geosci. 2016, 8, 214–230. [Google Scholar] [CrossRef]
- Młyński, D.; Cebulska, M.; Wałęga, A. Trends, Variability, and Seasonality of Maximum Annual Daily Precipitation in the Upper Vistula Basin, Poland. Atmosphere 2018, 9, 313. [Google Scholar] [CrossRef]
- IPCC. Climate Change 2007: Synthesis Report. Contribution of Working Groups I, II and III to the Fourth Assessment Report of the Intergovernmental Panel on Climate Change; Core Writing Team, Pachauri, R.K., Reisinger, A., Eds.; IPCC: Geneva, Switzerland, 2007; p. 104. Available online: https://www.ipcc.ch/report/ar4/syr/ (accessed on 10 November 2021).
- Pluntke, T.; Schwarzak, S.; Kuhn, K.; Lünich, K.; Adynkiewicz-Piragas, M.; Otop, I.; Miszuk, B. Climate analysis as a basis for a sustainable water management at the Lusatian Neisse. Meteorol. Hydrol. Water Manag. 2016, 4, 3–11. [Google Scholar] [CrossRef]
- Romanowicz, R.J.; Bogdanowicz, E.; Debele, S.E.; Doroszkiewicz, J.; Hisdal, H.; Lawrence, D.; Meresa, H.K.; Napiórkowski, J.J.; Osuch, M.; Strupczewski, W.G.; et al. Climate Change Impact on Hydrological Extremes: Preliminary Results from the Polish-Norwegian Project. Acta Geophys. 2016, 64, 477–509. [Google Scholar] [CrossRef]
- Summary for Policymakers. In Climate Change: The Physical Science Basis. Contribution of Working Group I to the Sixth Assessment Report of the Intergovernmental Panel on Climate Change; Masson-Delmotte, V., Zhai, P., Pirani, A., Connors, S.L., Péan, C., Berger, S., Caud, N., Chen, Y., Goldfarb, L., Gomis, M.I., et al., Eds.; Cambridge University Press: Cambridge, UK, 2021; Available online: https://report.ipcc.ch/ar6wg1/pdf/IPCC_AR6_WGI_SPM.pdf (accessed on 15 November 2021).
- Łabędzki, L.; Ostrowski, J. Precipitation Preventing a Deficit of Readily Available Soil Water in Arable Soils in Poland. Atmosphere 2018, 9, 121. [Google Scholar] [CrossRef]
- Kalbarczyk, R. Temporal and spatial diversity of the occurrence of atmospheric drought in Poland (1966–2005) and its effect of yield of pickling cucumber (Cucumis sativus L.). Span. J. Agric. Res. 2010, 8, 1147. [Google Scholar] [CrossRef]
- Kalbarczyk, E.; Kalbarczyk, R.; Raszka, B. Risk to Onion (Allium cepa L.) Field Cultivation in Poland from Precipitation Deficiency. Not. Bot. Horti Agrobot. Cluj-Napoca 2011, 39, 214–218. [Google Scholar] [CrossRef]
- Ostrowski, J.; Łabędzki, L.; Kanecka-Geszke, E. Parameterization and cartographic presentation of water deficits of cultivated plants. Int. Agrophysics 2015, 29, 341–351. [Google Scholar] [CrossRef]
- Kuśmierek-Tomaszewska, R.; Żarski, J.; Dudek, S. Assessment of Irrigation Needs in Sugar Beet (Beta vulgaris L.) in Temperate Climate of Kujawsko-Pomorskie Region (Poland). Agronomy 2019, 9, 814. [Google Scholar] [CrossRef]
- Kalbarczyk, E. Analysis of land resources in good agricultural condition [Analiza zasobów gruntów w dobrej kulturze rolnej]. In Spatial Differentiation of Agriculture [Zróżnicowanie Przestrzenne Rolnictwa]; Głębocki, B., Ed.; GUS: Warszawa, Poland, 2014; pp. 178–199. Available online: https://stat.gov.pl/obszary-tematyczne/rolnictwo-lesnictwo/psr-2010/powszechny-spis-rolny-2010-zroznicowanie-przestrzenne-rolnictwa,14,1.html (accessed on 10 January 2021). (In Polish)
- Kalbarczyk, R. Climatic risk of field cultivation of cucumber (Cucumis sativus L.) in Poland. Not. Bot. Horti Agrobot. Cluj-Napoca 2010, 38, 157–168. [Google Scholar] [CrossRef]
- Włodek, S.; Biskupski, A.; Pabin, J. The Amount of Precipitation Shortage on Productivity of Crops Grown in Simplified Systems of Tillage. Soil Sci. Annu. 2012, 63, 49–54. [Google Scholar] [CrossRef]
- Rolbiecki, S.; Rolbiecki, R.; Jagosz, B.; Ptach, W.; Stachowski, P.; Kazula, M. Water needs of asparagus plants in the different regions of Poland. Annual Set Environ. Prot. 2019, 21, 1227–1237. [Google Scholar]
- Szwed, M.; Karg, G.; Pińskwar, I.; Radziejewski, M.; Graczyk, D.; Kędziora, A.; Kundzewicz, Z. Climate change and its effect on agriculture, water resources and human health sectors in Poland. Nat. Hazards Earth Syst. Sci. 2010, 10, 1725–1737. [Google Scholar] [CrossRef]
- Van Der Velde, M.; Baruth, B.; Bussay, A.; Ceglar, A.; Condado, S.G.; Karetsos, S.; Lecerf, R.; Lopez, R.; Maiorano, A.; Nisini, L.; et al. In-season performance of European Union wheat forecasts during extreme impacts. Sci. Rep. 2018, 8, 15420. [Google Scholar] [CrossRef]
- Lordan, J.; Pascual, M.; Villar, J.M.; Fonseca, F.; Papió, J.; Montilla, V.; Rufat, J. Use of organic mulch to enhance water-use efficiency and peach production under limiting soil conditions in a three-year-old orchard. Span. J. Agric. Res. 2015, 13, e0904. [Google Scholar] [CrossRef]
- Hatfield, J.L.; Dold, C. Water-Use Efficiency: Advances and Challenges in a Changing Climate. Front. Plant Sci. 2019, 10, 103. [Google Scholar] [CrossRef]
- Spinoni, J.; Vogt, J.V.; Naumann, G.; Barbosa, P.; Dosio, A. Will drought events become more frequent and severe in Europe? Int. J. Climatol. 2018, 38, 1718–1736. [Google Scholar] [CrossRef]
- Górski, T.; Kozyra, J.; Doroszewski, A. Field crop losses in Poland due to extreme weather conditions-case studies. In The Influence of Extreme Phenomena on the Natural Environment and Human Living Conditions; Liszewski, S., Ed.; Łódzkie Towarzystwo Naukowe: Łódź, Poland, 2008; pp. 35–49. [Google Scholar]
- Roos, J.; Hopkins, R.; Kvarnheden, A.; Dixelius, C. The impact of global warming on plant diseases and insect vectors in Sweden. Eur. J. Plant Pathol. 2010, 129, 9–19. [Google Scholar] [CrossRef]
- Kahiluoto, H.; Kaseva, J.; Balek, J.; Olesen, J.E.; Ruiz-Ramos, M.; Gobin, A.; Kersebaum, K.C.; Takáč, J.; Ruget, F.; Ferrise, R.; et al. Decline in climate resilience of European wheat. Proc. Natl. Acad. Sci. USA 2019, 116, 123–128. [Google Scholar] [CrossRef] [PubMed]
- Kömüşcü, A.U. Homogeneity analysis of long-term monthly precipitation data of Turkey. Fresenius Environ. Bull. 2010, 19, 1220–1230. [Google Scholar]
- Łabędzki, L. Categorical Forecast of Precipitation Anomaly Using the Standardized Precipitation Index SPI. Water 2017, 9, 8. [Google Scholar] [CrossRef]
- The Climate Data Guide: Hurrell North Atlantic Oscillation (NAO) Index (Station-Based); Hurrell, J., Ed.; National Center for Atmospheric Research Staff: Boulder, CO, USA, 2020; Available online: https://climatedataguide.ucar.edu/climate-data/hurrell-north-atlantic-oscillation-nao-index-station-based (accessed on 15 November 2021).
- Tomaszewska, T. Atmospheric droughts over the past forty years [Susze atmosferyczne na przestrzeni ostatniego czterdziestolecia]. In Proceedings of the XXV Zjazd Agrometeorologów, Mierki, Poland, 27–29 September 1994; Wydaw. ART: Olsztyn, Poland, 1994; pp. 169–178. (In Polish). [Google Scholar]
- Kirschenstein, M.; Baranowski, D. Total precipitation in Poland in the years 1951–1995 [Sumy opadów atmosferycznych w Polsce w latach 1951–1995]. Bad. Fizjogr. Pol. Zach. A Geogr. Fiz. 2005, 56, 55–72. (In Polish) [Google Scholar]
- Czarnecka, M.; Nidzgorska-Lencewicz, J. Multiannual variability of seasonal precipitation in Poland [Wieloletnia zmienność sezonowych opadów w Polsce]. Woda–Sr.–Obsz. Wiej. 2012, 12, 45–60. [Google Scholar]
- Szwed, M. Variability of precipitation in Poland under climate change. Theor. Appl. Clim. 2018, 135, 1003–1015. [Google Scholar] [CrossRef]
- Wibig, J. The variability of daily precipitation totals in Poland (1951–2000). Geogr. Pol. 2009, 82, 21–32. [Google Scholar] [CrossRef]
- Wartalska, K.; Kotowski, A. Model Hyetographs of Short-Term Rainfall for Wrocław in the Perspective of 2050. Atmosphere 2020, 11, 663. [Google Scholar] [CrossRef]
- Michalska, B.; Kalbarczyk, E. Longterm changes in air temperature and precipitation on Szczecińska Lowland. Electron. J. Pol. Agric. Univ. Ser. Environ. Dev. 2005, 1, 17. Available online: http://www.ejpau.media.pl/volume8/issue1/art-17.html (accessed on 15 November 2021).
- Ojo, O.I.; Ilunga, M.F. The Rainfall Factor of Climate Change Effects on the Agricultural Environment: A Review. Am. J. Appl. Sci. 2017, 14, 930–937. [Google Scholar] [CrossRef][Green Version]
- Stachowski, P.; Markiewicz, J. The need of irrigation in central Poland on the example of Kutno County [Potrzeba nawodnień w centralnej Polsce na przykładzie powiatu kutnowskiego]. Rocz. Ochr. Śr. 2011, 13, 1453–1472. (In Polish) [Google Scholar]
- Chmura, K.; Chylińska, E.; Dmowski, Z.; Nowak, L. The role of the water factor in shaping the yield of selected field plants [Rola czynnika wodnego w kształtowaniu plonu wybranych roślin polowych]. Infrastruct. Ecol. Rural. Areas 2009, 9, 33–44. (In Polish) [Google Scholar]
- Grain Market in Poland [Rynek zbóż w Polsce]; Krajowy Ośrodek Wsparcia Rolnictwa: Warszawa, Poland, 2020. Available online: https://www.kowr.gov.pl/uploads/pliki/wydawnictwa/2020/Broszura_Rynek_zboz_w_Polsce_12.2020.pdf (accessed on 15 November 2021).
- Koźmiński, C.; Michalska, B. (Eds.) Atlas of Climatic Risk to Crop Cultivation in Poland; University of Szczecin: Szczecin, Poland; University of Agriculture in Szczecin: Szczecin, Poland, 2001; p. 81. [Google Scholar]
- Podolska, G. Yield and grain quality of winter wheat grown in conditions of high temperature and drought stress [Plon i jakość ziarna pszenicy ozimej uprawianej w warunkach wysokiej temperatury oraz stresu suszy]. Stud. Rap. IUNG-PIB 2018, 57, 9–21. (In Polish) [Google Scholar] [CrossRef]


Publisher’s Note: MDPI stays neutral with regard to jurisdictional claims in published maps and institutional affiliations. |
© 2022 by the authors. Licensee MDPI, Basel, Switzerland. This article is an open access article distributed under the terms and conditions of the Creative Commons Attribution (CC BY) license (https://creativecommons.org/licenses/by/4.0/).