Article

Short-Term Impact of Multi-Cropping on Some Soil Physical Properties and Respiration

by
Kęstutis Romaneckas
1,*,
Jovita Balandaitė
1,
Aušra Sinkevičienė
1,
Rasa Kimbirauskienė
1,
Algirdas Jasinskas
2,
Ugnius Ginelevičius
1,
Andrius Romaneckas
1 and
Rita Petlickaitė
2
1
Department of Agroecosystems and Soil Sciences, Agriculture Academy, Vytautas Magnus University, Studentu Str. 11, Akademija, LT-53361 Kaunas Distr., Lithuania
2
Department of Agricultural Engineering and Safety, Agriculture Academy, Vytautas Magnus University, Studentu Str. 15A, Akademija, LT-53362 Kaunas Distr., Lithuania
*
Author to whom correspondence should be addressed.
Agronomy 2022, 12(1), 141; https://doi.org/10.3390/agronomy12010141
Submission received: 4 December 2021 / Revised: 23 December 2021 / Accepted: 1 January 2022 / Published: 7 January 2022
(This article belongs to the Special Issue Multi-Functional Cultivation of Crops)

Abstract

:
Growing as much crop biomass as possible in the shortest possible time is the target for most bio-energy producers. However, according to the requirements of the Green Deal, the consumption of fertilizers and crop protection products will have to be significantly reduced between 2023 and 2027. In order to meet all the necessary conditions for the production of biomass, a stationary field experiment was carried out at the Experimental Station of Vytautas Magnus University, Lithuania, in 2020–2021. Multi-cultivations of maize, hemp and faba bean were investigated. The aim of this study was to ascertain the impact of multi-cropping intensity on soil structural composition, stability, penetration resistance and gas concentration–respiration. As expected, multi-cropping stabilized the gas concentration and emission from the soil and decreased the proportion of micro-structures in the top soil layers. However, the stability of the soil decreased in all the experimental plots. Gas concentration and respiration mainly depended on soil structural composition, temperature and moisture content. The results of the experiment suggest performing investigations at a long-term scale because the intensive variation of meteorological conditions had a higher impact on the soil properties than the multi-cropping systems.

1. Introduction

Intensive farming is still popular in Lithuania and around the world, requiring large investment, and potentially causing environmental pollution problems, in order to obtain the highest possible yield and profit. The use of chemicals initiates soil erosion and degradation; loss of biodiversity, nutrients and organic matter; and an increase in greenhouse gas emissions. To avoid this, we are moving towards an EU Green Deal aimed at creating a modern and competitive economy through production that improves the quality of life of current and future generations, while minimizing the negative impact on the environment.
The EU’s circular economy aims to transform production methods and decouple economic growth from resource use. This transition requires a new approach to the use of raw materials. For many years, humanity has used fossil fuels to obtain energy. Plant biomass is currently considered to be the most promising alternative renewable energy source [1,2] that can ensure energy security [3].
At present, maize (Zea mays L.), hemp (Cannabis sativa L.), faba bean (Vicia faba L.), sugar beet (Beta vulgaris L.) and other agricultural crops have the largest biomass productivity, nutritional and energy potential in Lithuania. Growing these crops produces not only the main food and/or fodder (grains, seeds, sugar), but also secondary production from harvesting wastes, which can be used for energy purposes. For example, researchers are actively exploring the use of fibrous plants for biofuels as a substitute for petroleum fuels and gases [4].
One of the methods to increase biomass production per area unit is to increase crop functionality by sowing additional, rapidly developing agricultural crop species into the main crop [5]. Multi-crops allow high biomass yields to be achieved with less investment of time and resources in less fertile soils or with shorter vegetative seasons. The cultivation of multi-crops is often found in countries or regions where subsistence farming is still predominant and the agricultural mechanization level is low, or in low-fertile or degraded soils. For example, in Latin America, 70–90% of beans are grown as inter-crops in corn or potato main crops [6].
Most multi-crops are annuals that have clear advantages over perennials. For example, annual crops, due to their short vegetative season, allow farmers to harvest more to meet market needs [7]. Multi-crops may consist of several agricultural crops grown in the same field but differing in their biological, agro-technical or vegetation duration characteristics [8]. In general, multi-crops show better results compared to growing crops of one species [9]. According to the investigations of Smith et al. [10], a comparison of the productivity of catch crop mixtures and mono-crops showed no significant differences when comparing the amount of biomass grown or weediness. However, it was observed that the cultivation of buckwheat in the mixtures resulted in a higher amount of green biomass per area unit compared to mono-crops. Similarly, studies of different sowing proportions of rye and vetch in mixture found that canopy biomass was the same or higher in all treatments than when these crops were grown alone [11]. A similar trend was observed in crop roots. These differences are due to interspecies competition between crops and synergies between crop species and root growth [12]. In addition, multi-crops consist of several different species of agricultural plants, the roots of which are located at different depths, taking water and nutrients from different parts of the soil. The sorption capacity of roots is also different: some plants, when grown together with others, can supply more water; others, such as legumes, can supply specific nutrients, such as nitrogen [13]. Growing multi-crops, at least one of which is soil-enriching (such as beans or peas), requires less or no use of synthetic fertilizers [6]. Legume catch crops not only accumulate a large amount of biologically fixed nitrogen, but their residues are easily degraded due to the low C:N ratio. Some cereal crops have a good uptake of the nitrogen remaining in the soil after the main crops grow, so growing cereal–legume mixtures is the best strategy to maximize the benefits of catch crops [14].
The harvesting of hemp and maize seeds and the removal of crop residues from fields result in the rapid deterioration of the chemical, physical and biological properties of the soil, reducing humus and nutrients, decreasing soil structure and bioactivity, and increasing hardness. This creates the preconditions for soil degradation. Multi-crops may stabilize and restore soil fertility by enriching it with nutrients, reducing nutrient leaching into the deeper soil layers, and protecting the soil from wind and water erosion [15].
Inter-crops not only increase the productivity of total herbal biomass per area unit, but, as biodiversity increases, protect the main crop from the spread of weeds, diseases and pests [16,17,18]. In addition, the nutritional and energy qualities of the main production may also improve.
To date, little research has been performed on hemp, maize and faba bean cultivations as multi-crops, leading to insufficient analysis of their technical and technological parameters, or their effects on the environment and soil. The purpose of this study was to determine the effect of multi-crops on soil structural composition and stability, penetration resistance, moisture content, temperature and gas concentration, and emissions under the conditions of a short vegetative period. The hypothesis of the investigations was that the cultivation of multi-crops will not decrease, and may even improve, the physical properties of the soil, and will stabilize gas emissions.

2. Materials and Methods

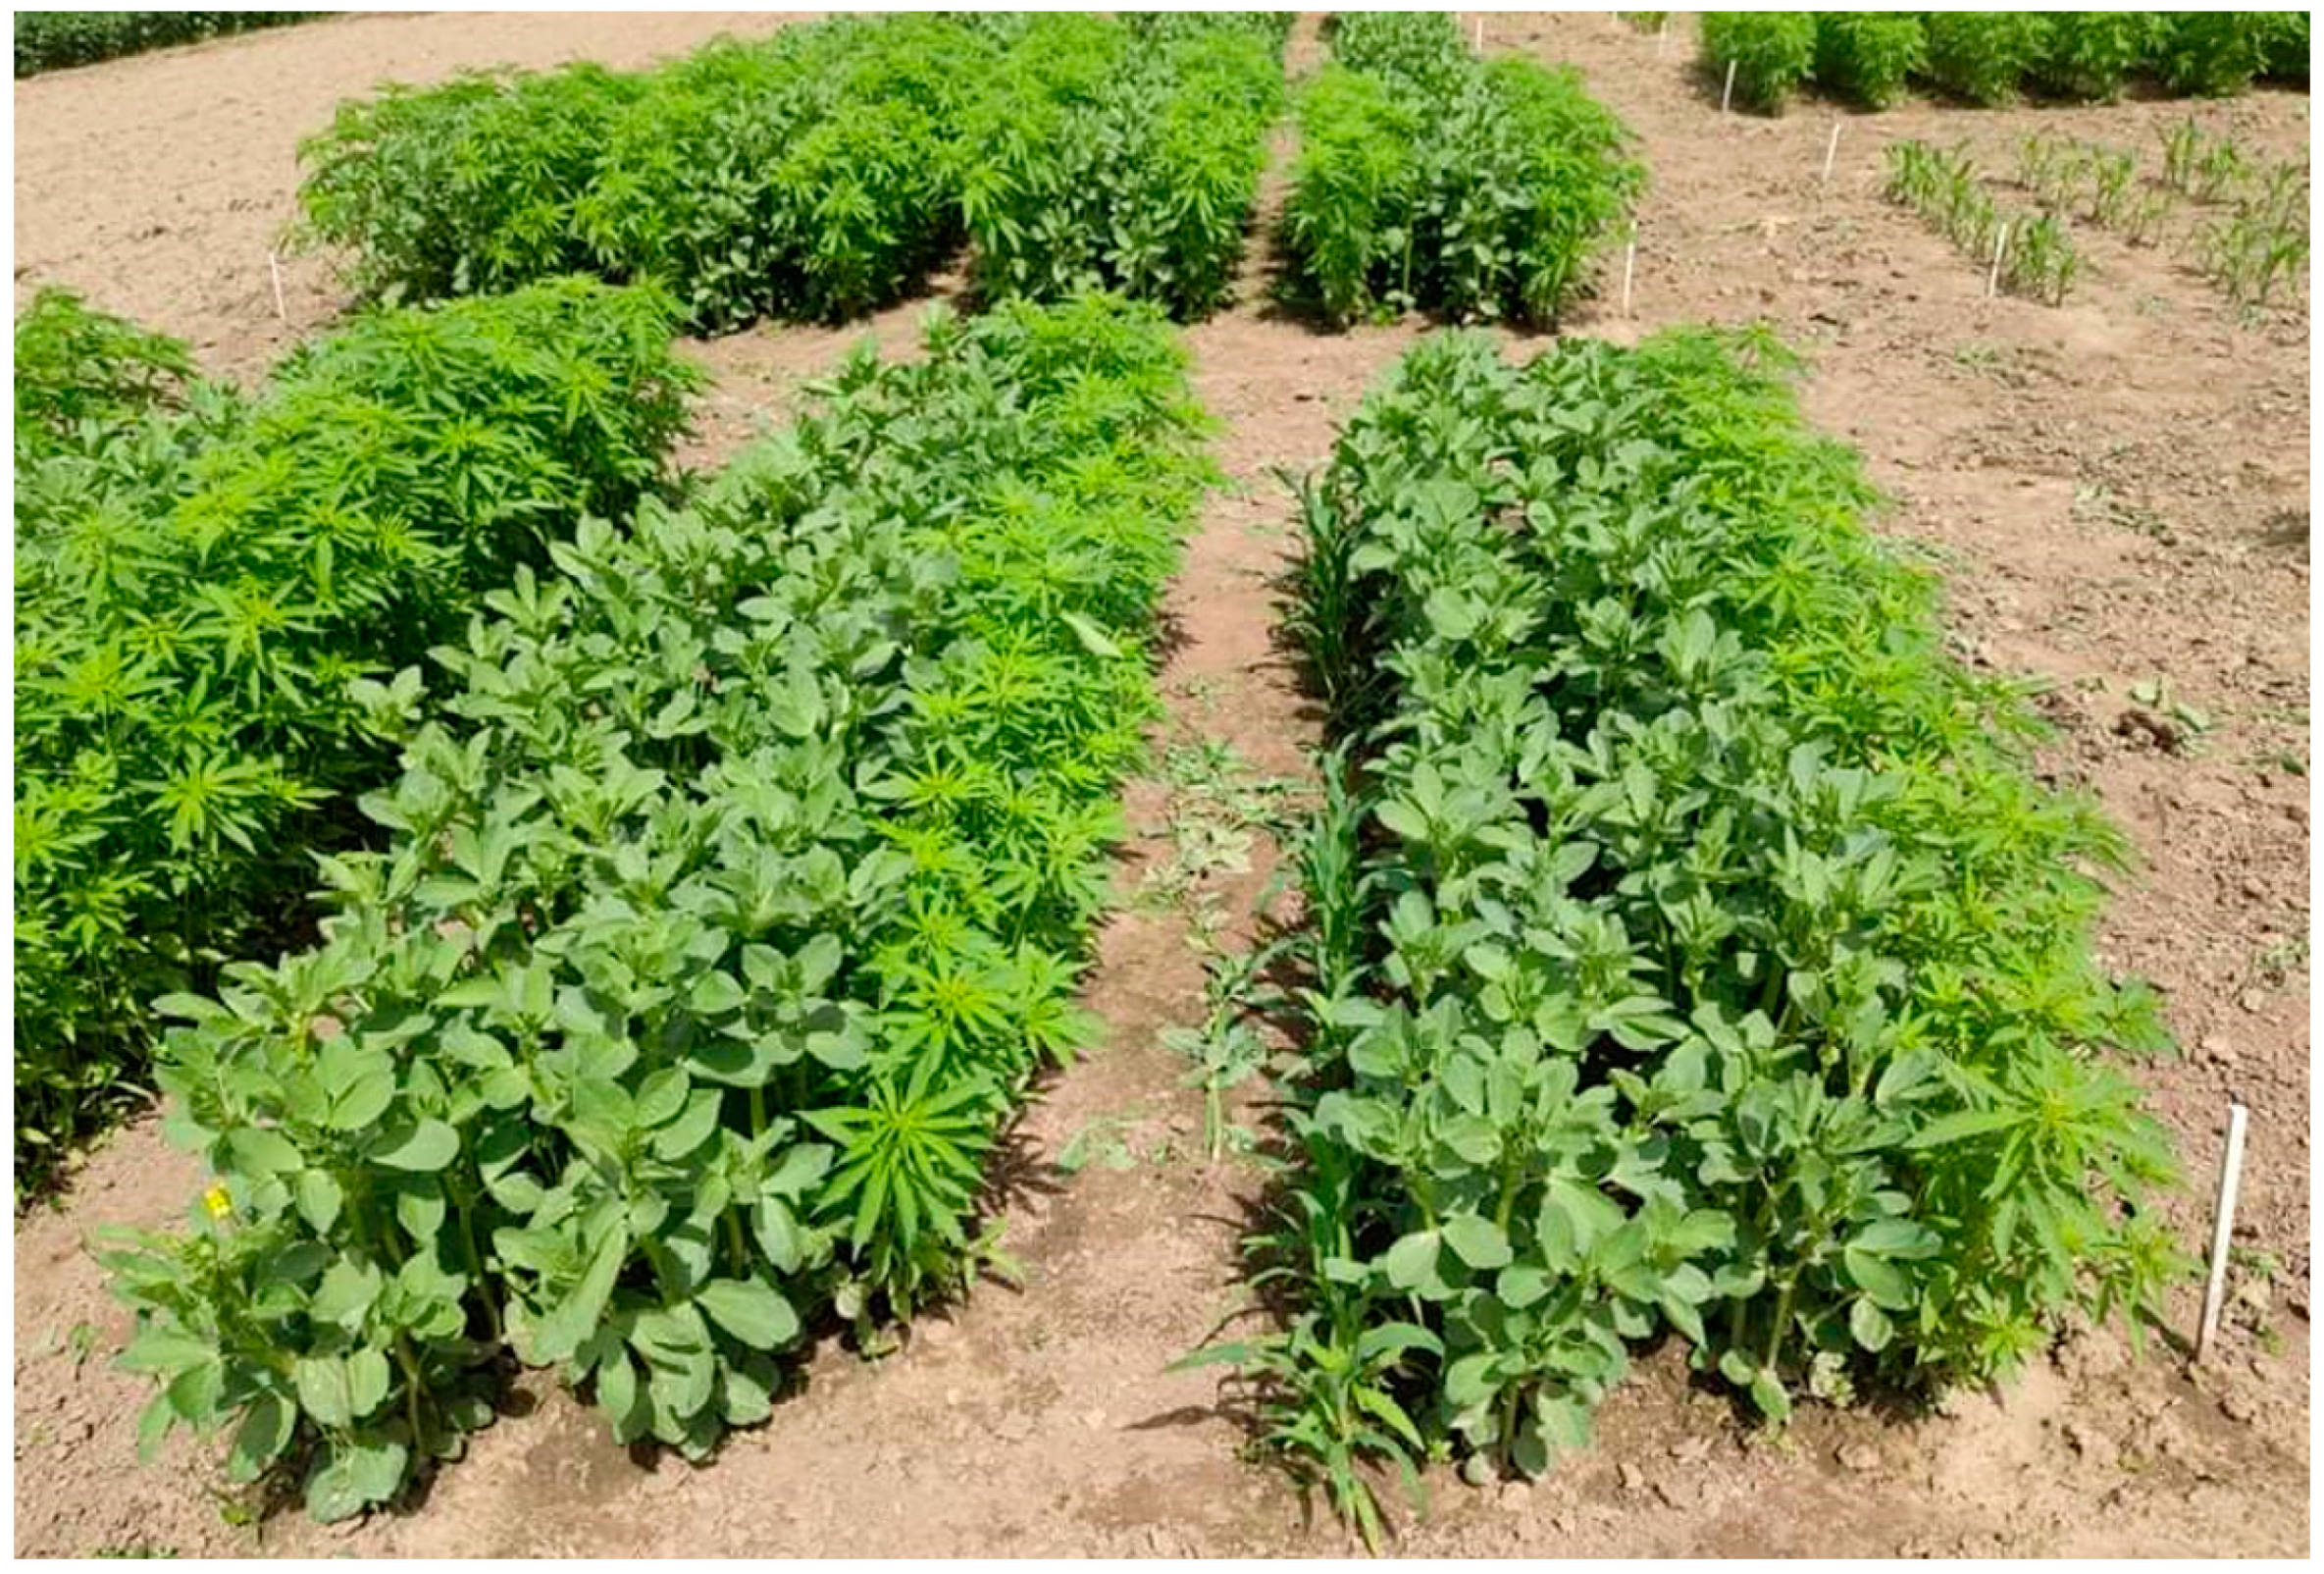
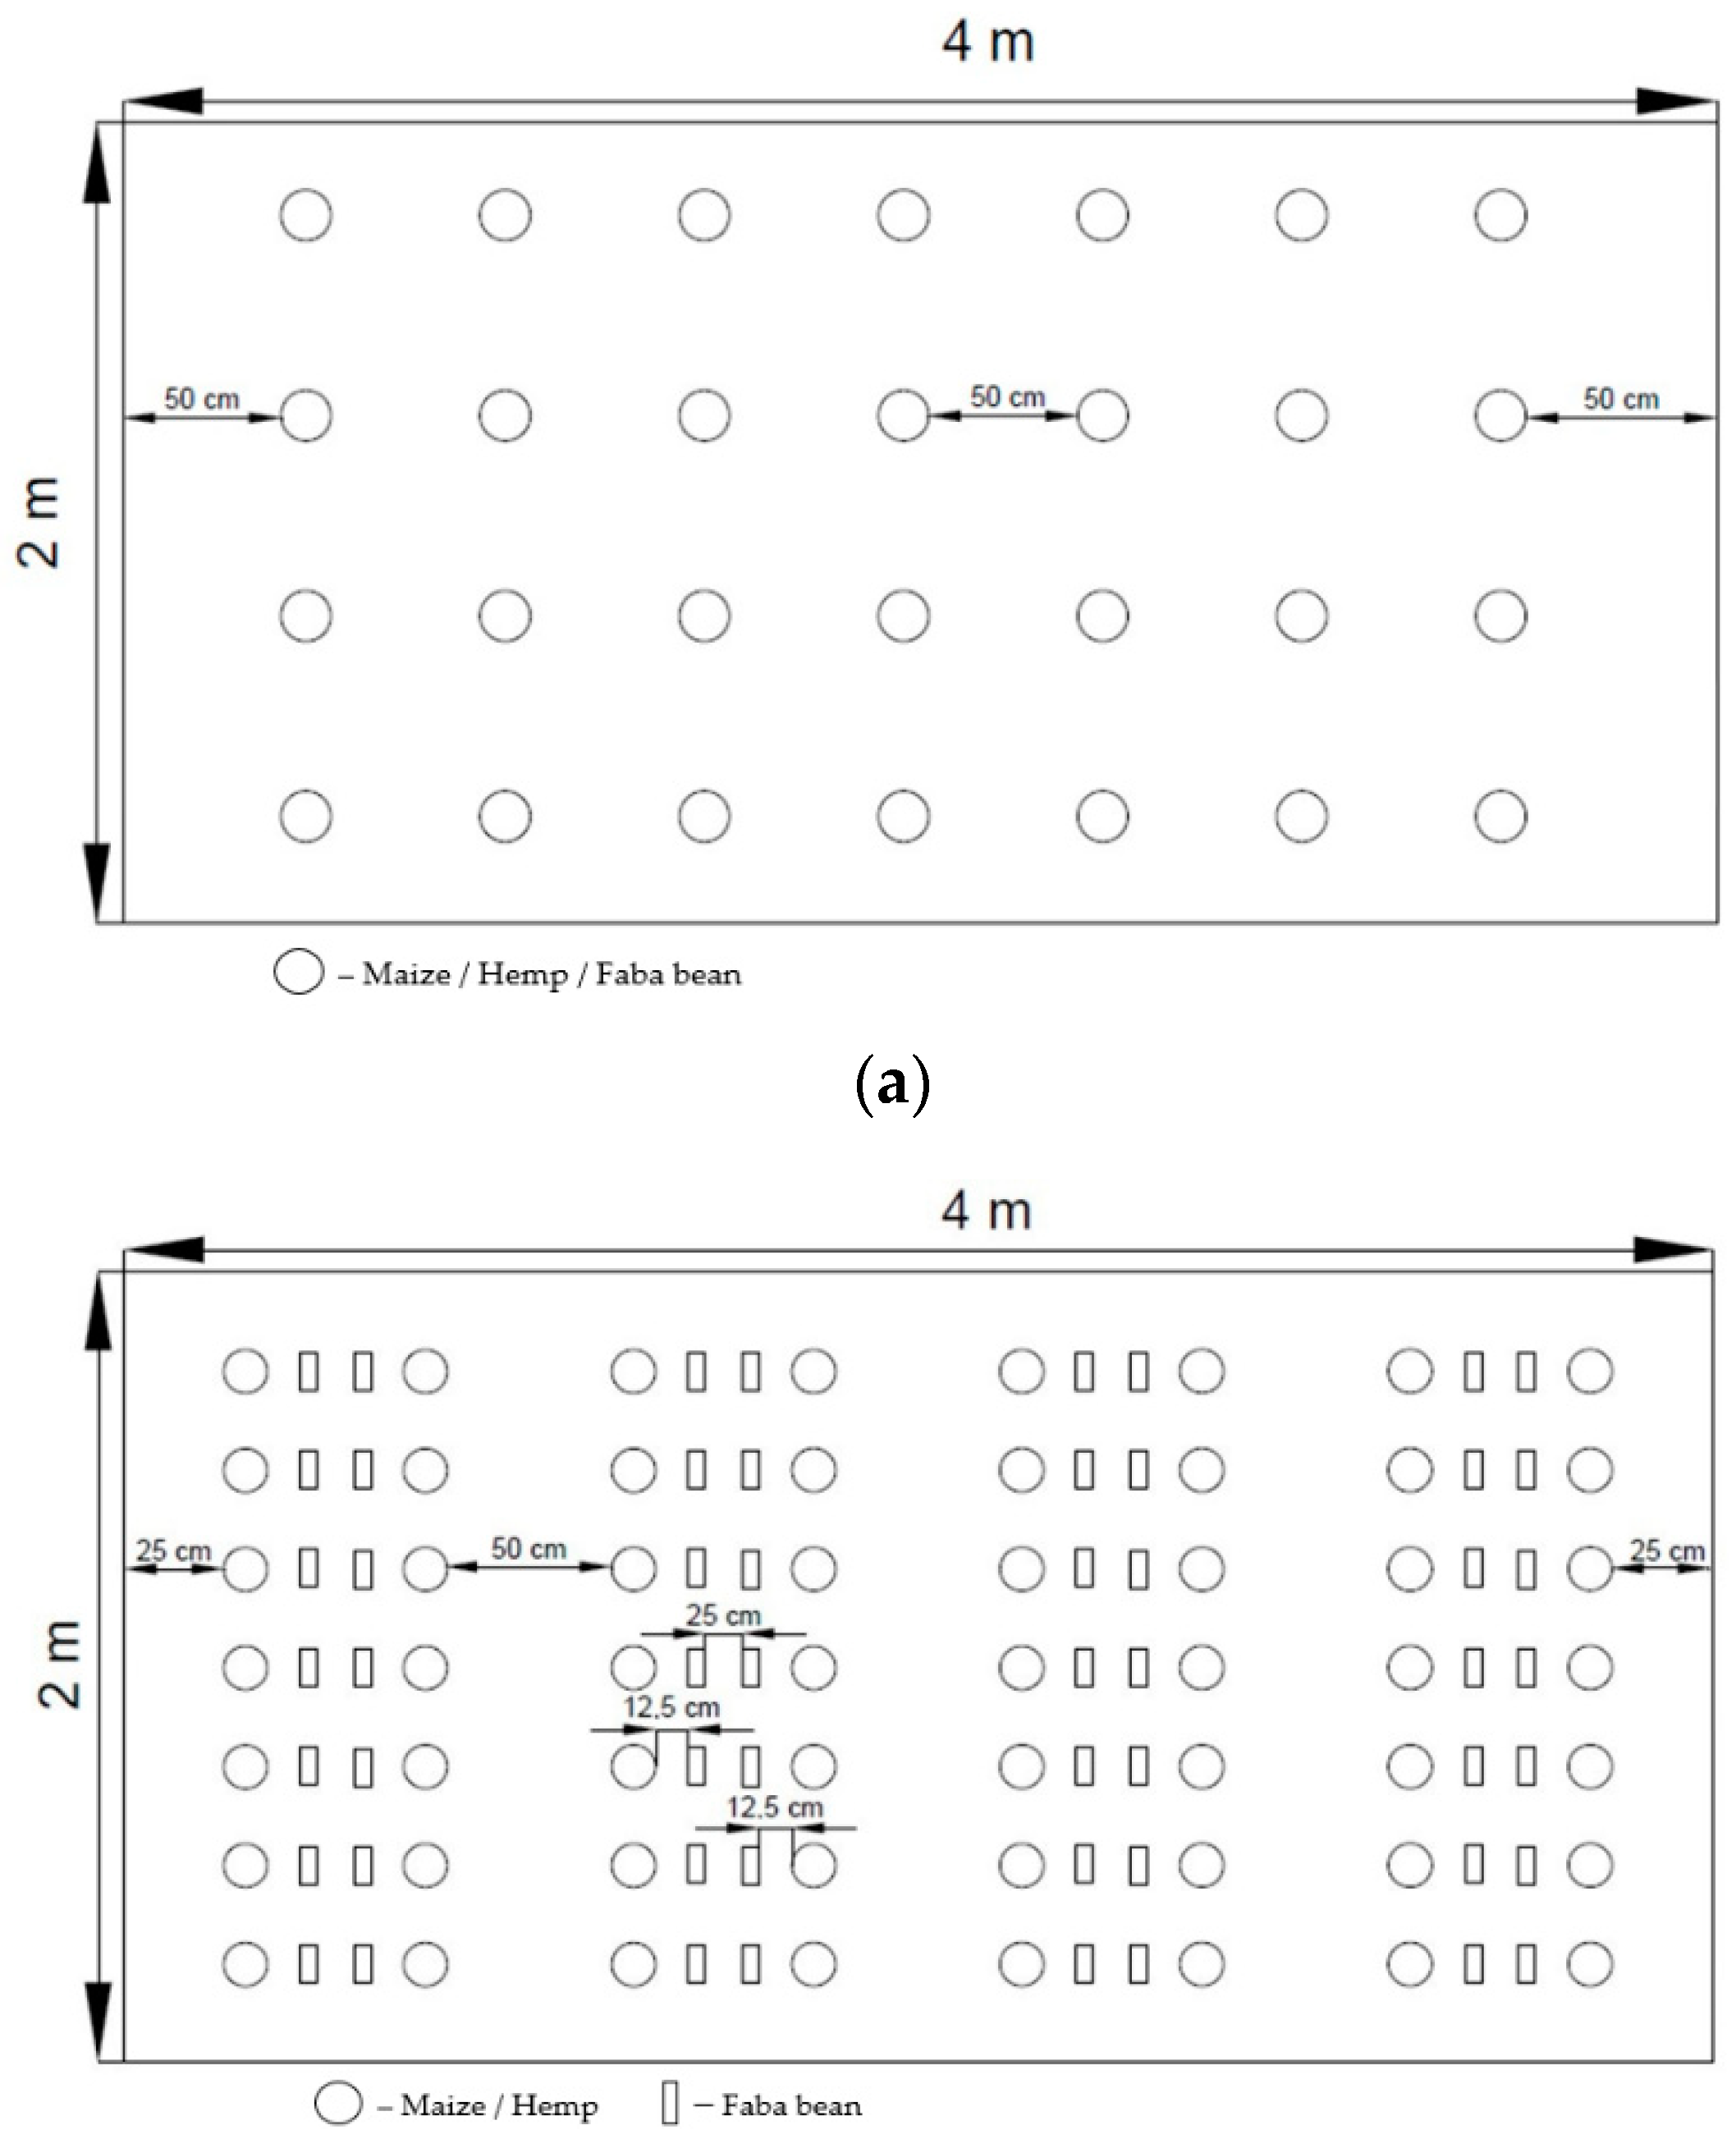
2.1. Experiment Location, Time, Treatments

A stationary field experiment was conducted in 2020–2021 at the Vytautas Magnus University, Agriculture Academy research station (54°52′ N, 23°49′ E). The research station is located 6 km from Kaunas city, on the left side of the Nemunas River. This massif belongs to an area of sandy and dusty loams, common and carbonaceous gleyic meadows, and stagnant leachate of the middle Nemunas plateau.
The crops grown in the multi-cropping experiment were: maize (Zea mays L.) (Pioneer selection), hemp (Cannabis sativa L.) (cultivar Austa SK) and faba bean (Vicia faba L.) (cultivar Vertigo), which were sown as mono, binary and ternary crops. A total of seven treatments were tested (Table 1).
The experimental plots were arranged in a randomized way with three replications (Figure 1). The initial size of the plot was 8 m2. In total, there were 21 plots in the experiment. The pre-crop was oat.

2.2. Experimental Conditions

2.2.1. Soil Characteristics

The soil of the experimental field is a deeper gleyic saturated loam (45.6% sand, 41.7% silt, 12.7% clay) Planosol (Endohypogleyic-Eutric, Ple-gln-w). Soil pHHCl varies from 7.3 to 7.8, total nitrogen content varies from 0.08 to 0.13%, humus varies from 1.5 to 1.7%, available phosphorus varies from 189 to 280 mg kg−1, available potassium varies from 97 to 118 mg kg−1, available sulfur varies from 1.2 to 2.6 mg kg−1, and magnesium varies from 436 to 790 mg kg−1. The water regime is regulated by closed drainage. The micro-relief was levelled. The arable layer of the soil was 23–27 cm thick.

2.2.2. Agro-Technics

In autumn, the soil was ploughed up to 22–25 cm depth. In the spring, when the soil reached physical maturity (i.e., the soil did not stick to the implements), it was shallowly cultivated (3–4 cm depth) with a composite cultivator. Before sowing, mineral fertilizer NPK 15:15:15 was sprinkled by hand. The fertilizer rate was 300 kg ha−1 (240 g per plot). Later, the experimental plots were sown by hand, according to the sowing scheme (Figure 2). When the weeds had germinated abundantly, the crops inter-rows were loosened 1–2 times.

2.2.3. Meteorological Conditions

The annual precipitation rate in the experimental site is 590–625 mm, and the length of the vegetative period was approximately 160 days with a rate of precipitation of 350–450 mm. The coldest month was January and the warmest and the most humid was July.
The weather temperature conditions during the 2020 and 2021 vegetative seasons varied. The month of May of both seasons, July 2020, and August 2021 were colder than usual (Table 2). Precipitation was distributed unevenly. March and April of 2020 were arid, whereas May and June saw surplus water. In 2021, as in 2020, the beginning of spring was dry, but May and August were extremely humid. Such variation of meteo-conditions could have negatively influenced the soil properties.
The length of the vegetative season in 2020 was 115 days and in 2021 it was 103 days (period from germination BBCH 09-10 to ripening BBCH 83–86 of faba bean) because June and July of 2021 were arid and overly warm.

2.3. Methods and Analysis

The granulometric soil composition (texture) was determined by sampling it with an auger in at least ten randomized spots per experimental plot (at least 200 samples per experiment). The twenty-one composite samples were tested. Soil texture was analyzed by laser diffraction with the Mastersizer 2000 Hydro 2000 MU laser diffraction system (Malvern Panalytical Ltd., Malvern, UK) in the laboratory of Agriculture Academy of Vytautas Magnus University.
The CO2 and O2 concentrations were measured in 0–15 cm soil layers by the closed-chamber method. The CO2 respiration (emission flux) was measured above the ground. A portable infrared CO2 analyzer LiCor-6400 (LiCor, Nebraska, USA) attached to a data logger by the IRGA (infrared gas analyzer) method was used. LI-8100A portable soil respirator systems with an 8100-103 camera were also used. Soil surface moisture content was determined at the same time as CO2 respiration by the 8100-204 device accessory, and soil temperature was determined by an 8100-203 accessory in the 0–10 cm soil layer. The measurements were conducted between 9 a.m. and 2 p.m. Rings of 20 cm in diameter and 20 cm in height were hammered to the soil after the sowing of the crops. The measurements (four replications per each ring) were taken three times according to the faba bean vegetative stages: at the beginning (BBCH 25–30), in the middle (BBCH 60–65), and at the end of the vegetative period (BBCH 83–86).
Samples for soil aggregation and stability determination were taken after sowing, before inter-row loosening, and at the end of vegetative season in a layer of soil 0–25 cm deep in at least 4–5 spots per each plot. Composite samples were taken. A Retsch screening apparatus (Retsch GmbH, Haan, Germany) and a set of sieves were used to determine the soil aggregate composition. The sieves used had hole diameters of 10, 7.1, 5.6, 4, 2, 1, 0.5 and 0.25 mm. The stability of the soil aggregates (wet sieving) was determined with a Retsch wet sieving device from a previously sifted dry soil fraction of 1–2 mm. The optimal expressions of soil structural composition were: mega structure (soil aggregates larger than 10 mm) of no more than 5%; macro structure (diameter from 0.25 to 10 mm) of more than 90%; and micro structure or silt (aggregates smaller than 0.25 mm) of not more than 5%. From an agronomic point of view, the crumbly structure (0.5–5 mm aggregates) was the best; due to the sufficient number of gaps, the pores were filled with air and water and maintained a good air–water ratio, thus creating suitable conditions for plants. The soil has optimal structural stability when 50% or more does not decompose when exposed to water [19,20,21,22].
Soil penetration resistance was determined at the same time with CO2 and O2 concentration measurements. The measurements were performed with an Eijkelkamp electronic penetrometer (penetrologer) (Royal Eijkelkamp, Giesbeek, The Netherlands). At least four measurements per experimental plot were performed.
The experimental data were analyzed by one-way ANOVA, and the treatment effect was estimated using the F- test and the least significant difference (LSD). The correlation analysis matrix included data on soil stability for water, temperature, moisture content, CO2 respiration, and CO2 and O2 underground concentrations. Programmes ANOVA (vers. 4.0) and STAT_ENG (vers. 1.55) in SELEKCIJA software (vers. 5.00, author dr. Pavelas Tarakanovas. Lithuanian Institute of Agriculture, Akademija, Kedainiu Distr., Lithuania) was employed.

3. Results and Discussion

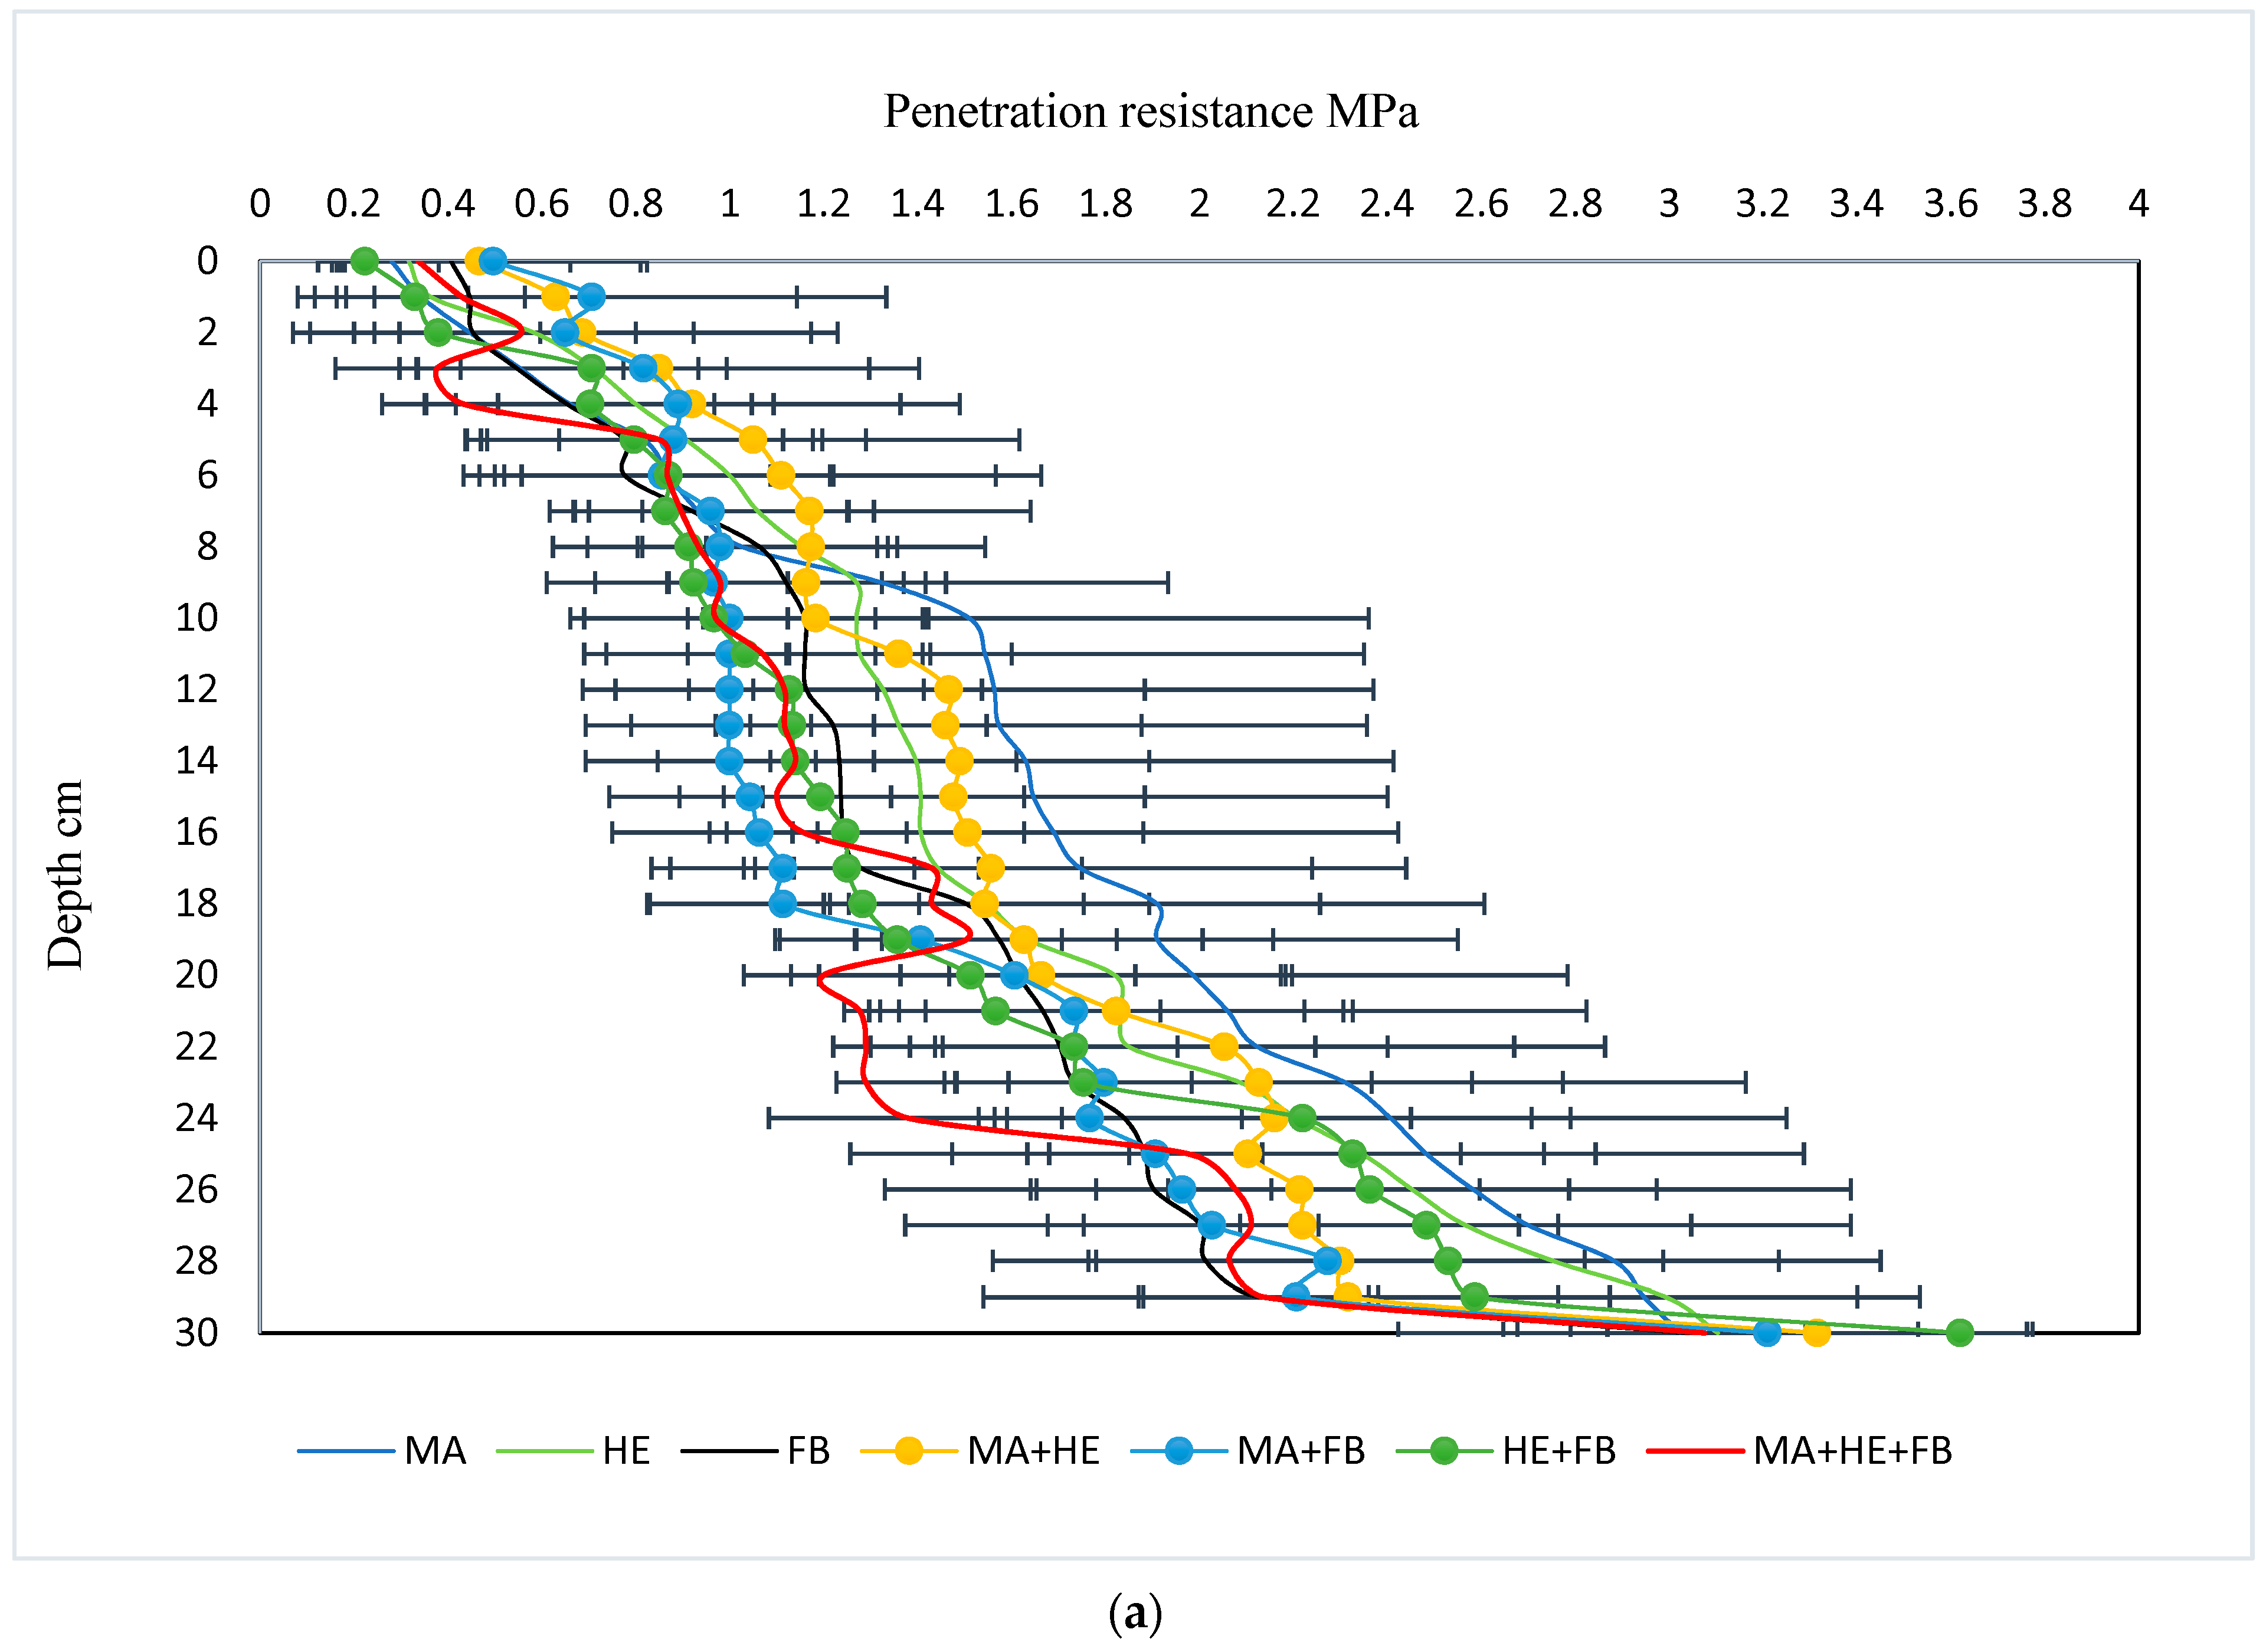
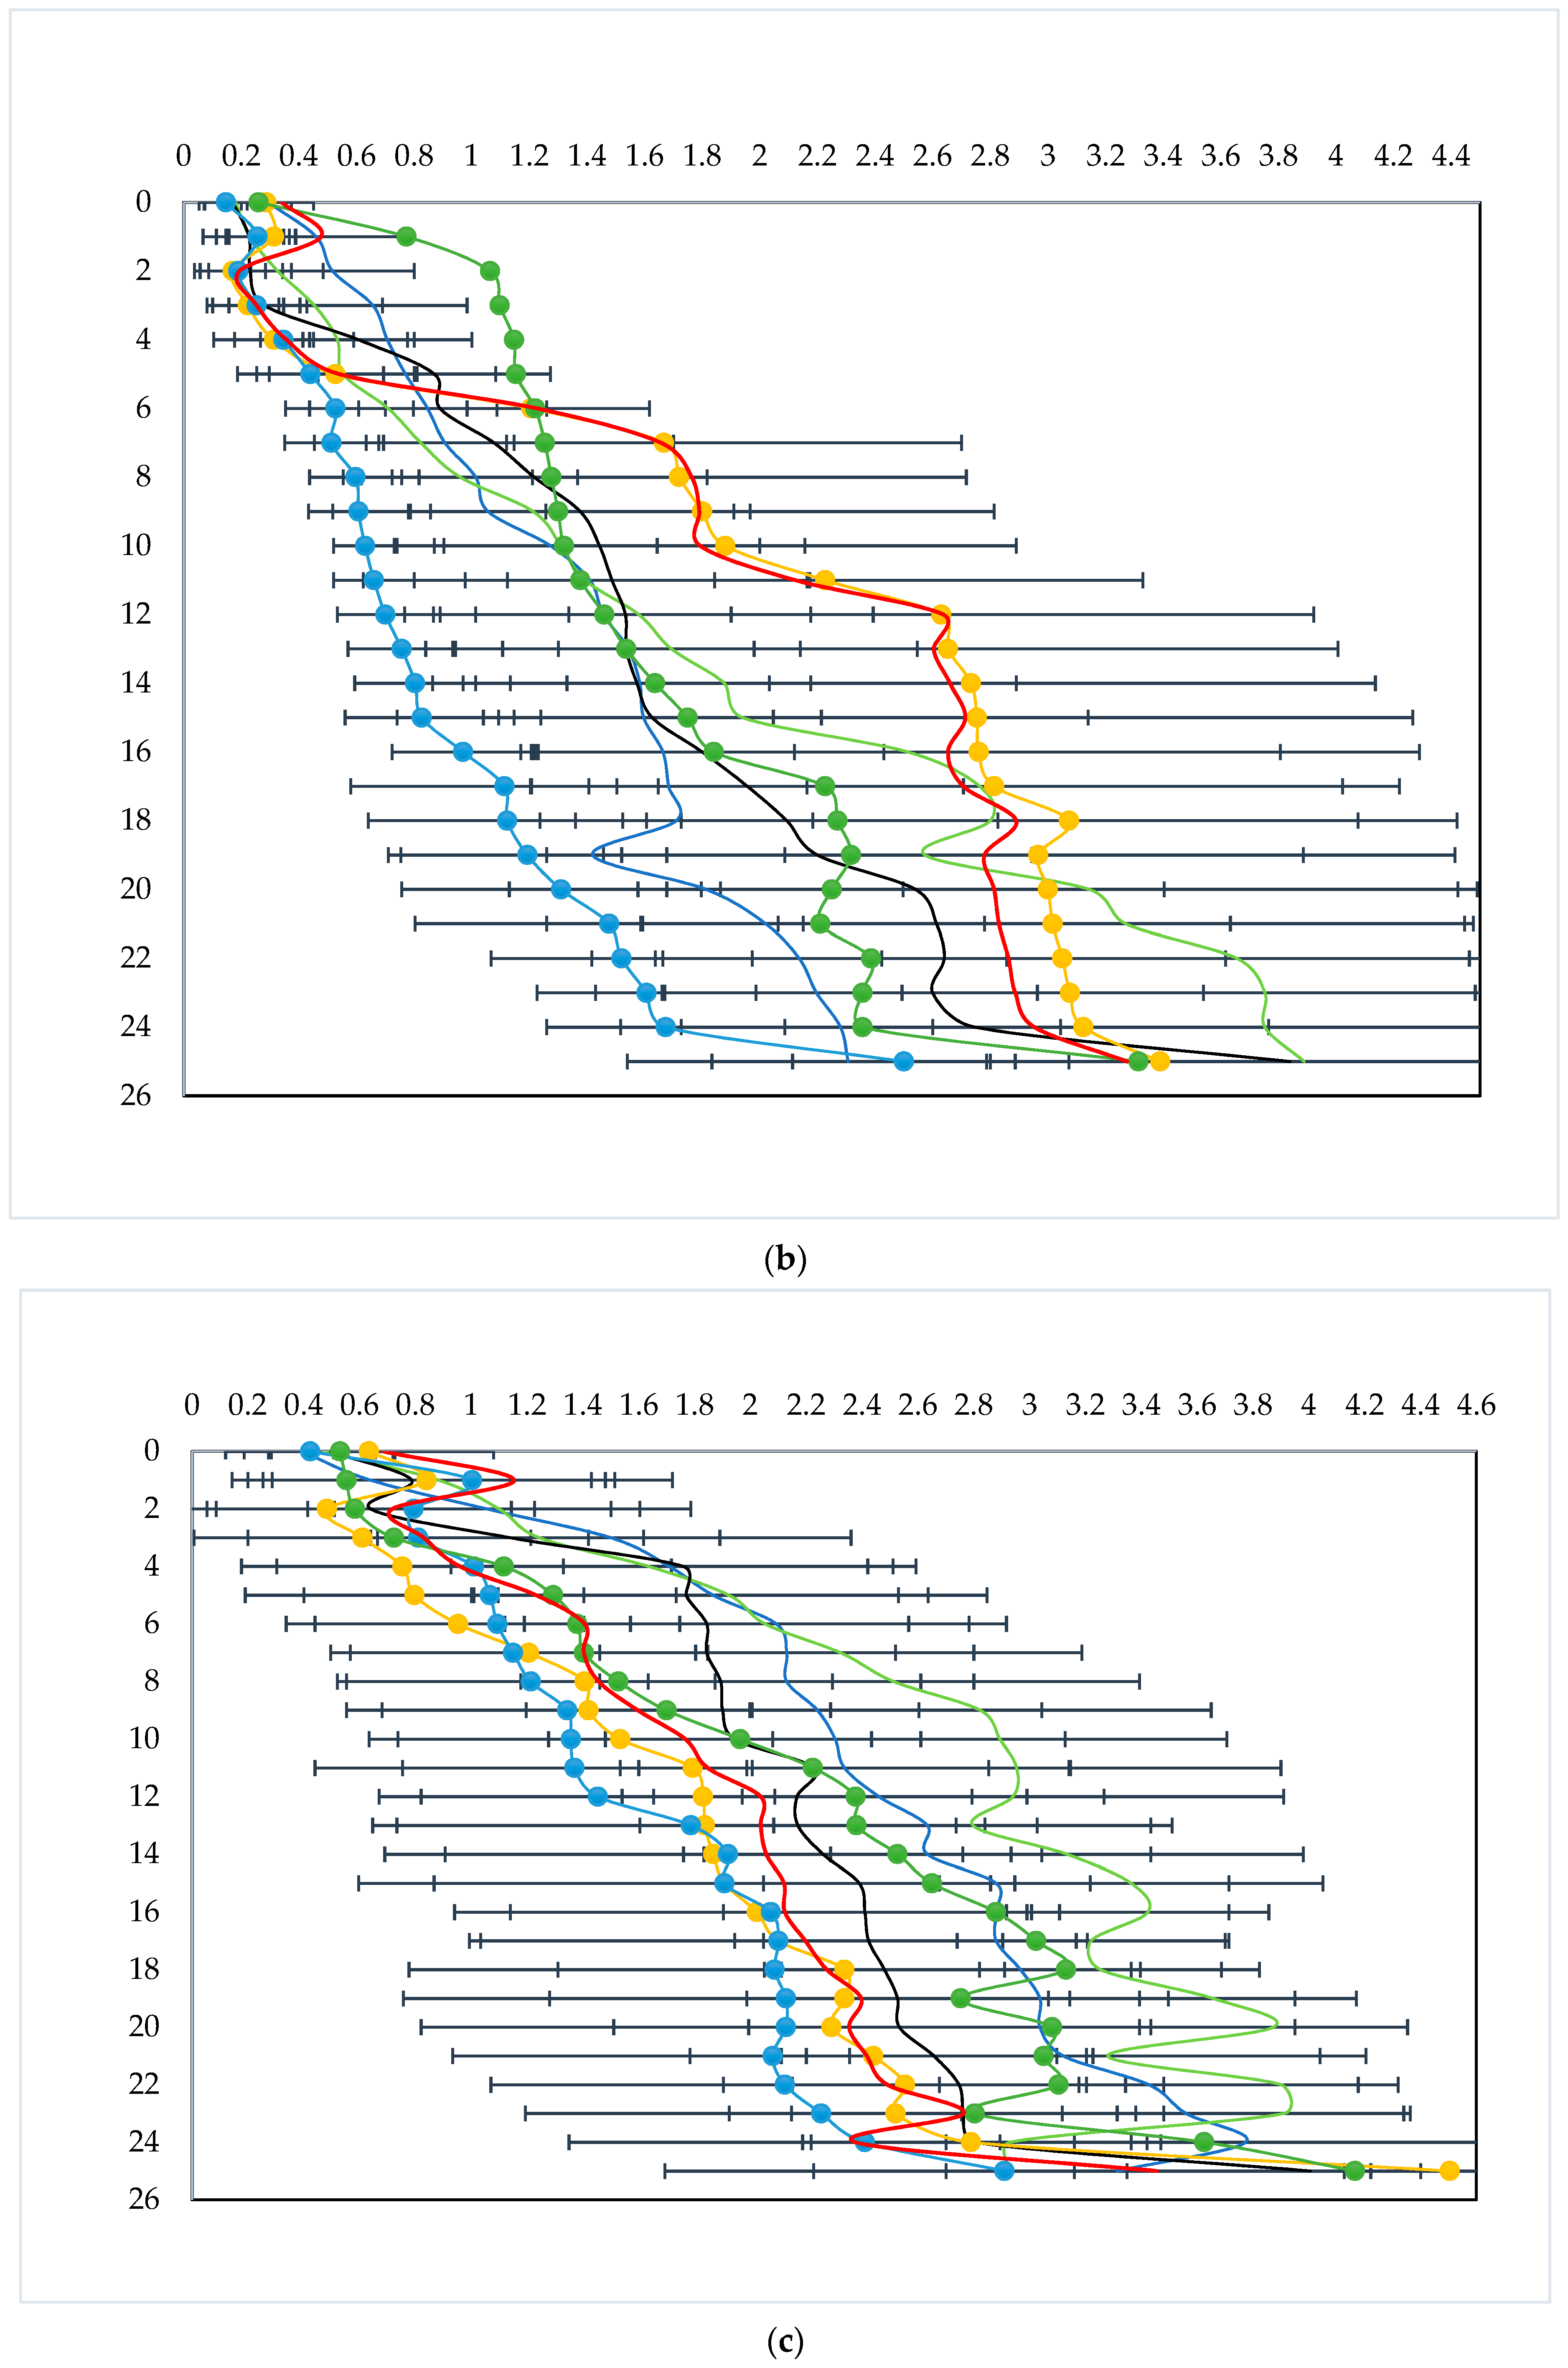
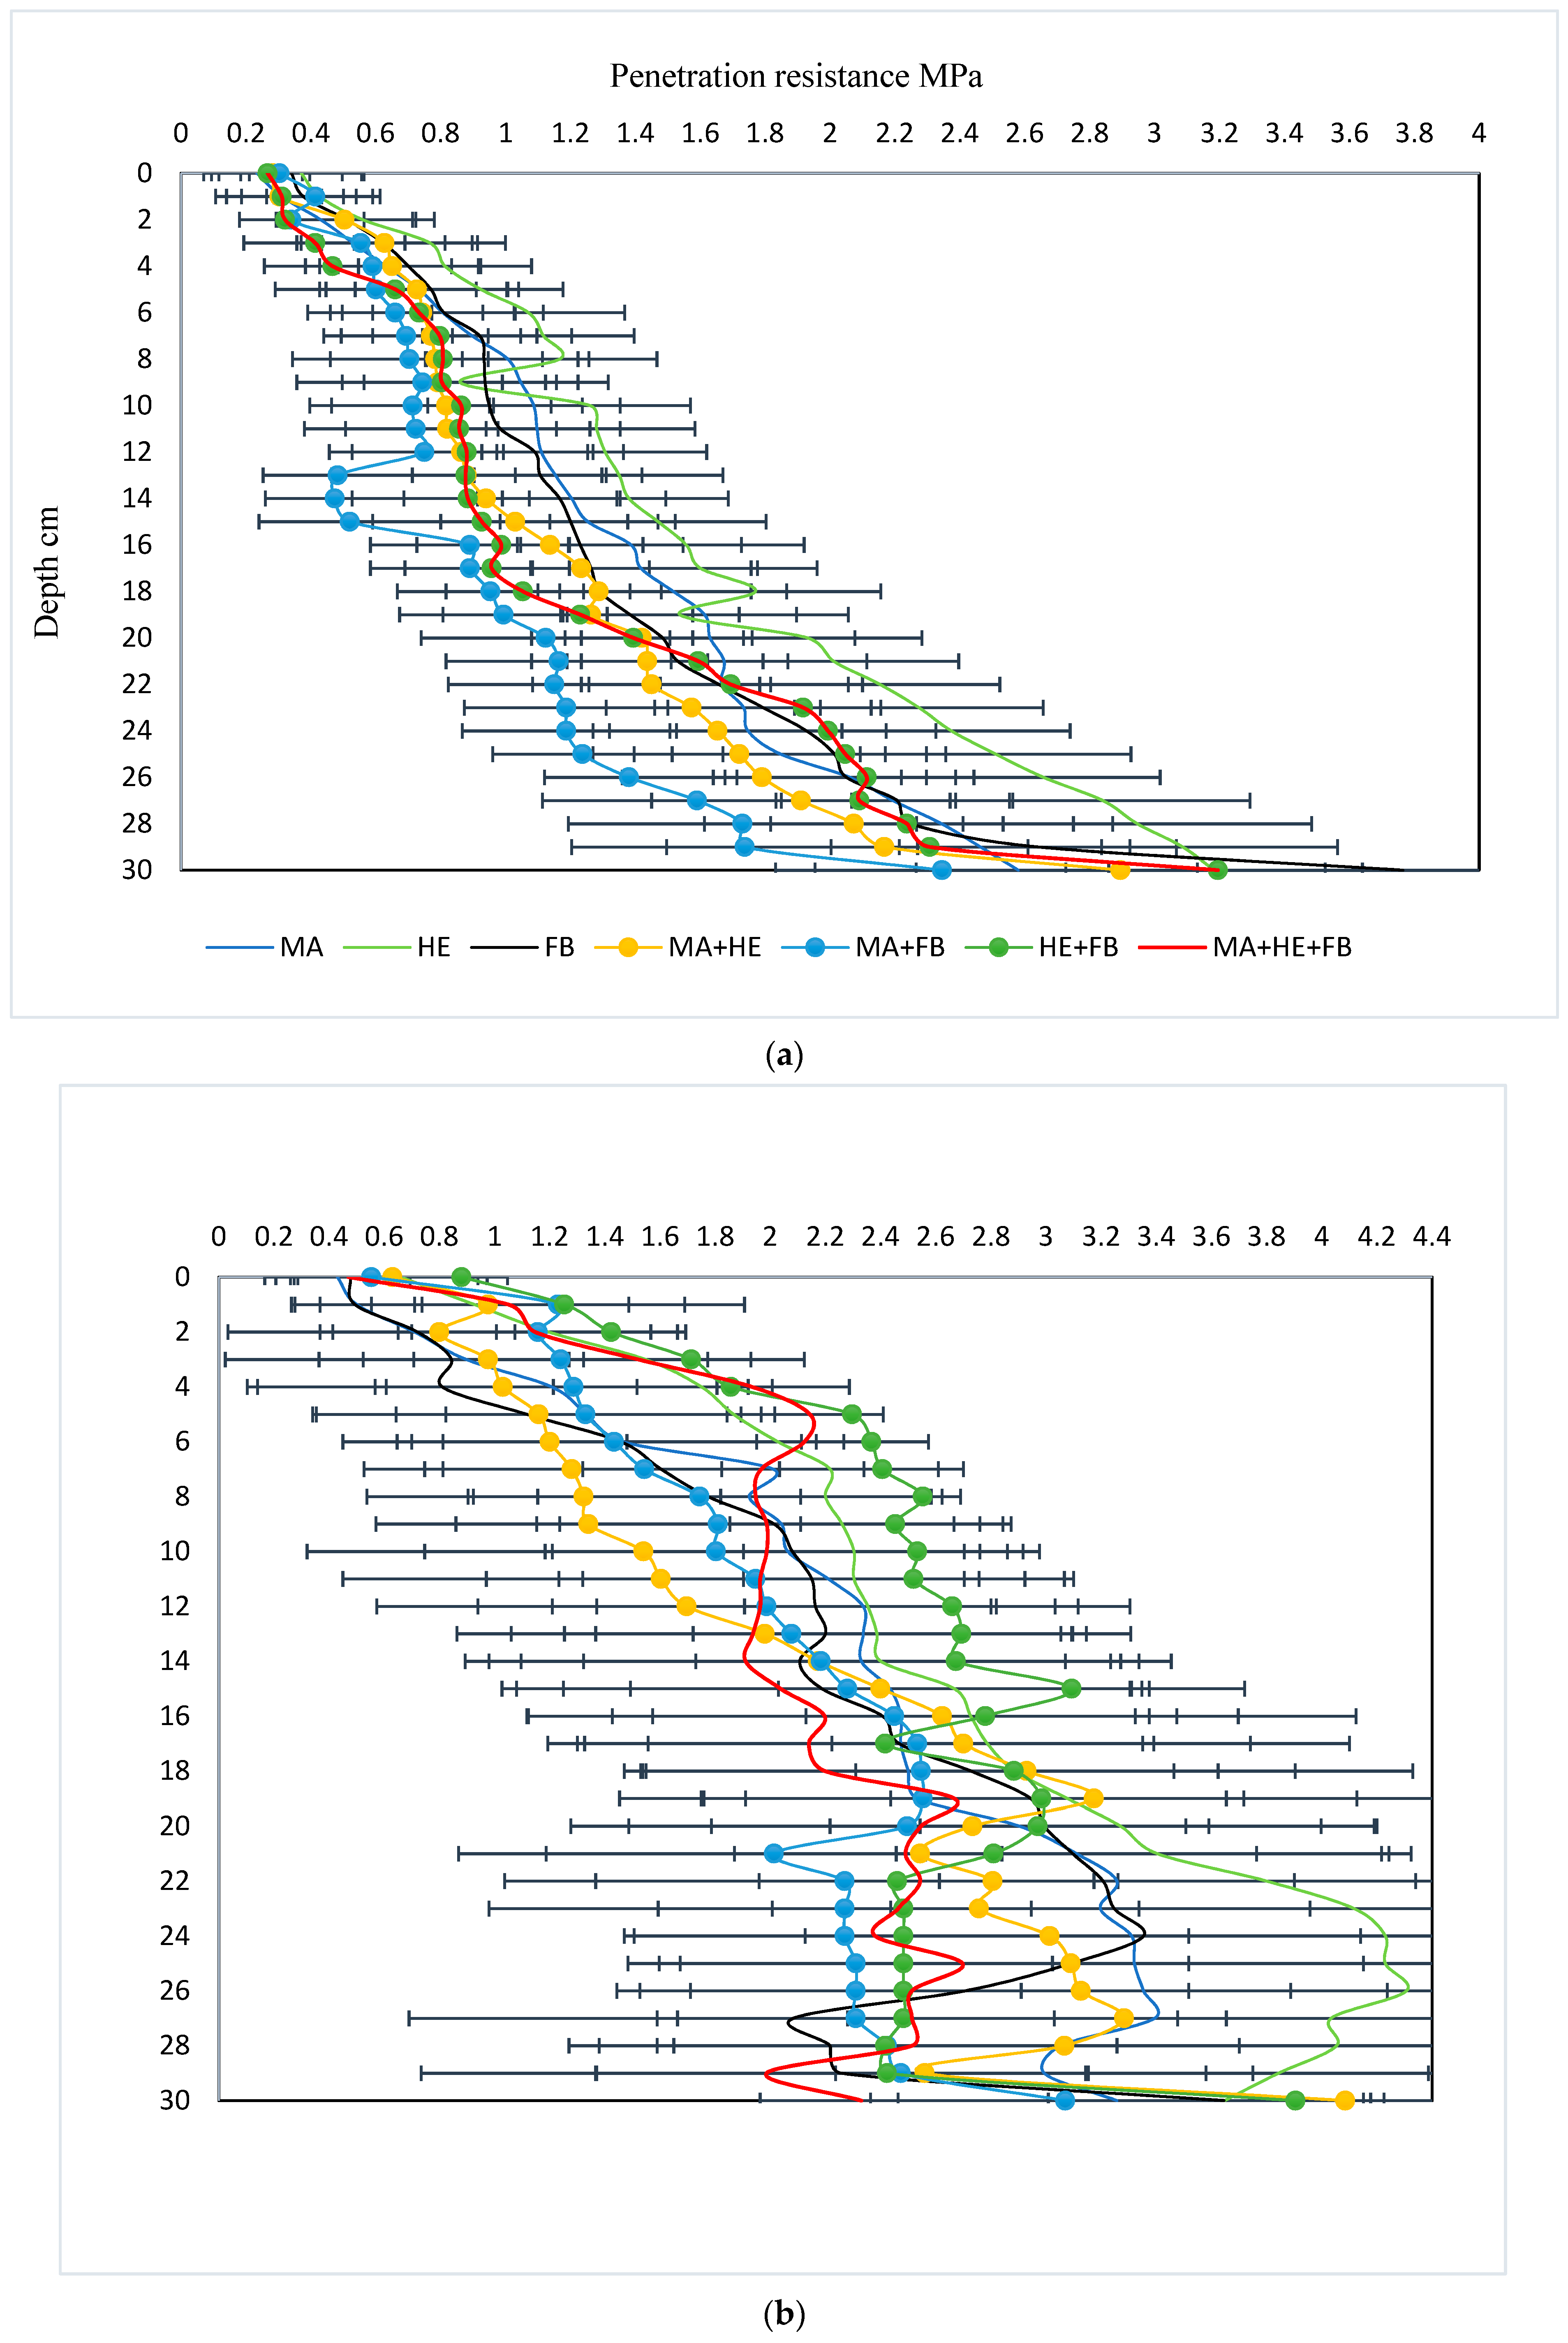
3.1. Soil Penetration Resistance

The soil penetration resistance mainly depended on soil texture, moisture content, amount of organic matter and crops grown. In our experiment, in 2020, at the beginning of the vegetative season and the experimentation, the penetration resistance of the top 0–10 cm soil layer was similar in all plots (Figure 3a). In the deeper layers, the penetration resistance increased and mainly depended on the difference in sub-soil texture. Some spots with soil hardpan formations were also observed (for example red curve, 16–20 cm layer) as the impact of the ploughing technology used. The maximum soil penetration reached 3.6 MPa.
In the middle of vegetative season, the differences between plots and treatments became more marked. The highest penetration resistance in the 0–5 cm soil layer was observed in the HE + FB plots, but in deeper layers, the MA + HE and MA + HE + FB soils were most hardened (Figure 3b). The fluffiest soil was observed in the MA + FB binary-crop. Seidel et al. [23,24] found that inter-cropped maize decreases soil penetration resistance. The maximum soil penetration resistance in our experiment was observed at the 25 cm depth in the hemp mono-crop.
At the end of vegetative season, the most compacted soil was observed in the mono-crops (Figure 3c). The MA + FB soil remained mainly fluffy. The variation between the on-plot replications of measurement was high. The maximum penetration resistance was about 4.5 MPa. Such penetration resistance is not favorable for root development. Pedrotti et al. [25] analyzed the investigations of other scientists and concluded that 4.5 MPa is considered a high resistance, but it is not necessarily a factor limiting the development of roots because the compacted soil is not like a solid mass, meaning there are also porous places in which roots can develop. Penetration resistance values up to 2.5 MPa were considered low and weakly inhibited root development. This research has shown that moisture is inversely proportional to the penetration resistance. In our experiment, the month of July was arid and the month of August was close to the long-term average. However, the distribution of precipitation was uneven. At the time of measurements, the top soil layer (0–10 cm) was moist and fluffy, but the lower layer (up to 25 cm) was hardened because precipitation water did not reach the deeper depths.
At the beginning of the 2021 vegetative season, the MA + HE and MA + FB plots were still the fluffiest, especially in the sub-soil (Figure 4a). This tendency was also observed in the middle of vegetative season. However, the MA + HE plots had the lowest penetration resistance in the upper (2–12 cm) soil layer, whereas the MA + FB plots had the lowest penetration resistance in the deeper (20–27 cm) layer (Figure 4b). In both the first and second years of the experiment, in the middle of the crop vegetative period, the fluffiest soil was in the plots where binary-crops were grown with maize. These results are consistent with those of Thériault et al. [26], where it was hypothesized that deep-rooted crops, in this case maize, may improve the physical properties of the soil, such as the resistance of the soil to penetration.
In the HE plots, some soil hardpan formation was found. At the end of the vegetative season, the most hardened soil was that of the hemp mono-crop (HE) and the fluffiest was in the faba bean mono-crop (Figure 4c). Latif et al. [27] also found that legumes significantly reduced soil penetration resistance.
According to Nunes et al. [28], the transfer of carbon to deeper soil layers using deep-rooted plants can greatly improve the physical properties of the soil. By comparison, crops sown or planted in very loose soil can grow poorly due to poor establishment, so a little increase in soil compaction is not always bad as it can improve soil–root contact and regulate energy flows.

3.2. Soil Aggregation and Stability

At the beginning of experimentation in spring, 2020, the soil aggregate composition (structure) was similar in all the tested plots (Table 3). The amount of micro-structure was up to 10 percent, nearly double the allowable norms. At the end of vegetative period, the increase in the macro-structure reduced CO2 (r = −0.610; p > 0.05) and O2 (r = −0.569; p > 0.05) concentrations in the soil. Similar trends were observed in the 2021 vegetative season. In the middle of the vegetation period, the capacity of soil macro-structure correlated with CO2 (r = −0.416; p > 0.05) and O2 (r = −0.549; p > 0.05) concentrations in the soil.
During the two years, the capacity of the micro-structure decreased 2–3 times and the lowest was in the faba bean crops. Despite these changes, the differences between the treatments were not significant. We found average correlations between amount of micro-structure and CO2 concentration in the soil at the middle and the end of 2020 vegetative season (r = 0.559 and r = 0.450; p > 0.05). Similar relations have been determined in other studies, indicating that smaller soil aggregates prevent CO2 from rising [29,30]. In 2021, the correlations between the micro-structure, soil respiration and concentration of gasses were weak.
Conversely, in 2020–2021, the stability of the soil structure decreased, especially during the 2020/2021 winter and 2021 vegetation periods (Table 3). The differences between treatments remained insignificant. The drastic decrease in soil structural stability in winter could have been caused by the positive temperature of the soil under high amounts of snow. In the vegetative period, the decrease in soil stability may have been caused by uneven precipitation distribution, as the humid and arid periods changed each other. However, we found a weak correlation (r = 0.292; p > 0.05) between precipitation rates during the months of the experiment with positive average temperatures and soil structural stability. In our experiment, the increase in crop biodiversity also increased the concentration of soil nutrients, including organic carbon, on which increases to soil stability usually depend [31].

3.3. Soil Gas Concentration and Respiration

In 2020, at the beginning of multi-crop vegetative period, the highest CO2 concentration in the 0–15 cm soil layer was measured in the HE + FB plots. In these plots, CO2 respiration also was the most intensive (Table 4).
Such results could be explained by the highest soil temperature (r = 0.640; p > 0.05) and one of the highest moisture contents (Table 5). The highest O2 concentration was found in MA + HE + FB plots, but differences between treatments were not significant. According to Kurganova et al. [32], soil annual respiration mainly depends on meteorological conditions. In a global MAT&AP&SOC model, the combination of mean annual temperature, annual precipitation and soil organic carbon are the key factors responsible for 50% of the variance in annual soil respiration [33]. Gelybó et al. [34] highlighted soil organic carbon and soil water content. In our earlier soil tillage investigations, a strong negative correlation between soil temperature and CO2 emissions was found (r = −0.98; p < 0.05) [35].
In the middle of the vegetative period, the soil temperature increased up to 22.2 °C and the differences between soil gas concentrations and respiration became weak and insignificant (Table 4). We found average and strong relations between the soil temperature and gas concentration and respiration. Higher temperatures stopped the CO2 respiration process (Table 5). Fang and Moncrieff [36] found similar correlations. Gang and Zhen-Xi [37] concluded that, generally, climate warming may decrease soil respiration. It should be noted that that annual mean temperature is a good predictor of soil respiration [38].
We also found strong correlations between gas concentrations and emissions (respiration).
At the end of the vegetative season, the concentration of gases in the soil had barely decreased compared with the beginning and middle periods. This could have been caused by the higher moisture content in the soil. Significant differences between treatments were not found (Table 4). However, the highest concentration of CO2 in the soil was in the ternary-crop plot. Peregrina [39] concluded that CO2 release intensified after precipitation, because water replaced the air from the soil pores [40].
In 2021, at the beginning of vegetative period, the highest CO2 and O2 concentrations in the soil were observed in the MA plots, where the soil was the moistest and among the warmest (Table 6), because these plots were the most open, and not yet occupied by plants. For example, in the wheat–maize cropping system, residues on the top-soil significantly decreased the net C flux [41].
We found a strong linear relation between soil moisture content and gas concentration (Table 7). In these plots, the CO2 respiration rate was also the most intensive. However, the differences were not significant. Similarly, Xiao-Dong et al. [42] found, that soil moisture content and chemical proportion had affect up to 75% of the variation in soil respiration.
In the middle of the vegetative period, the soil warmed up, and the concentration of CO2 in the soil usually decreased, but O2 increased up to 23% (Table 6). The CO2 respiration (e-flux) also increased. Differences were not significant. Negassa et al. [43] established that the sensitivity of CO2 emissions to soil temperature was higher in the plots with cover crops than in plots clear of cover crops.
We found similar tendencies at the end of the vegetative period. Significantly, the highest soil temperature was measured in the MA + HE + FB plots (Table 6). The correlation analysis showed a strong, significant correlation between soil temperature and O2 concentration (Table 7).

4. Conclusions

After the first vegetative season in 2020, the most hardened top soil layers were found in the mono-cropped plots, and the fluffiest were found in MA + HE and MA + FB plots. This tendency was also observed in the following vegetative season in 2021. However, the fluffiest soil was found in the faba bean mono-cropped plots.
The impact of multi-cropping on soil aggregation and stability was mainly not significant. However, during two vegetative seasons, the amount of micro-structure decreased two–three times. Soil structural composition was related to soil gas concentrations.
Soil gas concentration and respiration during the experiment varied little between the treatments. Gas concentration and respiration mainly depended on soil temperature and moisture content.
As expected, multi-cropping stabilized gas concentration and emission from the soil and decreased the proportion of micro-structures in the top soil layers; however, the stability of the soil decreased in all experimental plots. The results of the experiment suggest investigations should be performed at a long-term scale because the intense variations in meteorological conditions had a higher impact on the soil properties than multi-cropping.

Author Contributions

Conceptualization, K.R.; methodology, K.R. and J.B.; software, A.S., U.G., J.B. and K.R.; validation, J.B. and K.R.; formal analysis, U.G., J.B., A.S. and K.R.; investigation, J.B., A.S., K.R., R.K. and U.G.; resources, J.B., A.J., K.R., A.R., R.P. and A.S.; data curation, J.B., K.R. and U.G.; writing—original draft preparation, K.R. and J.B.; writing—review and editing, K.R., A.J. and J.B; visualization, U.G. and A.R.; supervision, K.R.; project administration, J.B. All authors have read and agreed to the published version of the manuscript.

Funding

This research was partly funded by the European Social Fund. Grant number 09.3.3-LMT-K-712-24-0174.

Institutional Review Board Statement

Not applicable.

Informed Consent Statement

Not applicable.

Data Availability Statement

All data generated or analyzed during this study are included in the present article.

Acknowledgments

The authors thank IT specialist Gintaras Romaneckas (Kaunas University of Technology, Lithuania) for valuable consultations and support in analyzing and visualizing of research data.

Conflicts of Interest

The authors declare no conflict of interest.

References

  1. Mao, G.; Huang, N.; Chen, L.; Wang, H. Research on biomass energy and environment from the past to the future: A bibliometric analysis. Sci. Total Environ. 2018, 635, 1081–1090. [Google Scholar] [CrossRef]
  2. Bhutto, A.W.; Bazmi, A.A.; Karim, S.; Abro, R.; Mazari, S.A.; Nizamuddin, S. Promoting sustainability of use of biomass as energy resource: Pakistan’s perspective. Environ. Sci. Pollut. Res. 2019, 26, 29606–29619. [Google Scholar] [CrossRef]
  3. Bielski, S.; Marks-Bielska, R.; Zielińska-Chmielewska, A.; Romaneckas, K.; Šarauskis, E. Importance of Agriculture in Creating Energy Security—A Case Study of Poland. Energies 2021, 14, 2465. [Google Scholar] [CrossRef]
  4. Dolle, K.; Kurzmann, D.E. Cannabis, the Plant of the Unlimited Possibilities. Adv. Res. 2019, 20, 1–22. [Google Scholar] [CrossRef]
  5. Franco, J.G.; King, S.R.; Masabni, J.G.; Volder, A. Plant functional diversity improves short-term yields in a low-input intercropping system. Agric. Ecosyst. Environ. 2015, 203, 1–10. [Google Scholar] [CrossRef]
  6. Brooker, R.W.; Bennett, A.E.; Cong, W.-F.; Daniell, T.J.; George, T.S.; Hallett, C.H.; Iannetta, P.P.M.; Jones, H.G.; Karley, A.J.; Li, L.; et al. Improving intercropping: A synthesis of research in agronomy, plant physiology and ecology. New Phytol. 2015, 206, 107–117. [Google Scholar] [CrossRef] [PubMed]
  7. Wang, J.; Lu, X.; Zhang, J.; Wei, H.; Li, M.; Lan, N.; Luo, H. Intercropping perennial aquatic plants with rice improved paddy field soil microbial biomass, biomass carbon and biomass nitrogen to facilitate soil sustainability. Soil Tillage Res. 2021, 208, 104908. [Google Scholar] [CrossRef]
  8. Gliessman, S.R.; Rosemeyer, M. The Conversion to Sustainable Agriculture: Principles, Processes and Practices; Taylor and Francis Group: Abingdon-on-Thames, Oxfordshire, UK, 2010; pp. 303–315. [Google Scholar]
  9. Heuermann, D.; Gentsch, N.; Boy, J. Interspecific competition among catch crops modifies vertical root biomass distribution and nitrate scavenging in soils. Sci. Rep. 2019, 9, 11531. [Google Scholar] [CrossRef] [Green Version]
  10. Smith, R.G.; Atwood, L.W.; Warren, N.D. Increased productivity of a cover crop mixture is not associated with enhanced agroecosystem services. PLoS ONE 2014, 9, e97351. [Google Scholar]
  11. Hayden, Z.D.; Ngouajio, M.; Brainard, D.C. Rye–vetch mixture proportion tradeoffs: Cover crop productivity, nitrogen accumulation, and weed suppression. Agron. J. 2014, 106, 904–914. [Google Scholar] [CrossRef]
  12. Kumar, R.; Pandey, S.; Pandey, A. Plant roots and carbon sequestration. Curr. Sci. 2006, 91, 885–890. [Google Scholar]
  13. Gill, S.; Abid, M.; Azam, F. Mixed cropping effects on growth of wheat (Triticum aestivum L.) and chickpea (Cicer arietenum L.). Pak. J. Bot. 2009, 41, 1029–1036. [Google Scholar]
  14. Fageria, N.K.; Baligar, V.C.; Bailey, B.A. Role of cover crops in improving soil and row crop productivity. Commun. Soil Sci. Plant Anal. 2005, 36, 2733–2757. [Google Scholar] [CrossRef]
  15. Yan, M.-C.; Xu, T.-T.; Song, P.-H.; Dai, J.-J. Effects of Different Cropping Patterns of Soybean and Maize Seedlings on Soil Enzyme Activities and MBC and MBN. J. Northeast Agric. Univ. 2012, 19, 42–47. [Google Scholar]
  16. Picasso, V.D.; Brummer, E.C.; Liebman, M.; Dixon, P.M.; Wilsey, B.J. Crop Species Diversity Affects Productivity and Weed Suppression in Perennial Polycultures under Two Management Strategies. Crop Sci. 2008, 48, 331–342. [Google Scholar] [CrossRef]
  17. Boudreau, M.A. Diseases in Intercropping Systems. Annu. Rev. Phytopathol. 2013, 51, 499–519. [Google Scholar] [CrossRef] [PubMed]
  18. Robačer, M.; Canali, S.; Lakenborg, K.H.; Baver, F.; Grobelnik, M.S.; Jakopa, M.; Bavec, M. Cover crops in organic field vegetable production. Sci. Hortic. 2016, 208, 104–110. [Google Scholar] [CrossRef]
  19. Nugis, E. Seedbed quality preparation in Estonia. Agron. Res. 2010, 8, 421–426. [Google Scholar]
  20. Romaneckas, K.; Šarauskis, E. The investigation by the Kritz method of sugar beet seedbed under different soil tillage and sowing patterns in Lithuania. In Proceedings of the Soil Management for Sustainability: International Soil Tillage Research Organization 16th Triennial Conference, Brisbane, Australia, 14–18 July 2003; pp. 1029–1035. [Google Scholar]
  21. Dürr, C.; Aubertot, J.N.; Richard, G.; Dubrulle, P.; Duval, Y.; Boiffin, J. A model for simulation of plant emergence predicting the effect of soil tillage and sowing operations. Soil Sci. Soc. Am. J. 2001, 65, 414–423. [Google Scholar] [CrossRef]
  22. Håkansson, I.; Arvidsson, J.; Rydberg, T. Effects of seedbed properties on crop emergence: 2. Effects of aggregate size, sowing depth and initial water content under dry weather conditions. Acta Agric. Scand. B Soil Plant Sci. 2011, 61, 469–479. [Google Scholar] [CrossRef]
  23. Seidel, E.P.; dos Reis, W.; Mottin, M.C. Effects of surface application of gypsum in corn intercropped with jack bean (’Canavalia eusiformis’) with different soil penetration resistance. Aust. J. Crop Sci. 2016, 10, 985–989. [Google Scholar] [CrossRef]
  24. Seidel, E.P.; Anschau, K.A.; Achre, D.; Mottin, M.C.; Lerner, K.L.; Vengen, A.P.; Franscziskowski, M.A.; Mattei, E. Physical properties of soil and productivity of maize intercropped with different cover plants. Afr. J. Agric. Res. 2017, 12, 2940–2945. [Google Scholar] [CrossRef] [Green Version]
  25. Pedrotti, A.I.; Aciole, F.M.S.; Silva, T.O.; Oliveira, A.E.S.; Dória, C.J.R.; Souza, J.C.; Ferreira, O.J.M.; Pauletto, E.A. Relations between Tillage Systems and Cultures in Succession on the Mechanical Resistance to Penetration on the Productivity of Sweet Corn at the End of Ten Years, in the Brazilian Northeast. In Agro Environ 2012, Proceedings of 8th International Symposium, Wageningen, The Netherlands, 1–4 May 2012. Available online: https://library.wur.nl/ojs/index.php/AE2012/article/view/12515/12600 (accessed on 5 November 2021).
  26. Thériault, L.; Dessureault-Rompré, I.; Caron, J. Short-Term Improvement in Soil Physical Properties of Cultivated Histosols through Deep-Rooted Crop Rotation and Subsoiling. J. Agron. 2019, 111, 2084–2096. [Google Scholar] [CrossRef]
  27. Latif, M.A.; Mehuys, G.R.; Mackenzie, A.F.; Alli, I.; Faris, M.A. Effects of legumes on soil physical quality in a maize crop. Plant Soil 1992, 140, 15–23. [Google Scholar] [CrossRef]
  28. Nunes, M.R.; Karlen, D.L.; Moorman, T.B. Tillage Intensity Effects on Soil Structure Indicators—A US Meta-Analysis. Sustainability 2020, 12, 2071. [Google Scholar] [CrossRef] [Green Version]
  29. Harrison-Kirk, T.; Beare, M.H.; Meenken, E.D.; Condron, L.M. Soil organic matter and texture affect responses to dry/wet cycles: Effects on carbon dioxide and nitrous oxide emissions. Soil Biol. Biochem. 2013, 57, 43–55. [Google Scholar] [CrossRef]
  30. Lenka, N.K.; Lal, R. Soil aggregation and greenhouse gas flux after 15 years of wheat straw and fertilizer management in a no-till system. Soil Tillage Res. 2013, 126, 78–89. [Google Scholar] [CrossRef]
  31. Paul, B.K.; Vanlauwe, B.; Ayuke, F.; Gassner, A.; Hoogmoed, M.; Hurisso, T.T.; Koala, S.; Lelei, D.; Ndabamenye, T.; Six, J.; et al. Medium-term impact of tillage and residue management on soil aggregate stability, soil carbon and crop productivity. Agric. Ecosyst. Environ. 2013, 164, 14–22. [Google Scholar] [CrossRef]
  32. Kurganova, I.; De Gerenyu, V.L.; Rozanova, L.; Sapronov, D.; Myakshina, T.; Kudeyarov, V. Annual and seasonal CO2 fluxes from Russian southern taiga soils. Tellus Ser. B Chem. Phys. Meteorol. 2003, 55, 338–344. [Google Scholar] [CrossRef]
  33. Shutao, C.; Jianwen, Z.; Zhenghua, H.; Haishan, C.; Yanyu, L. Global annual soil respiration in relation to climate, soil properties and vegetation characteristics: Summary of available data. Agric. For. Meteorol. 2014, 198–199, 335–346. [Google Scholar]
  34. Gelybó, G.; Barcza, Z.; Dencső, M.; Potyó, I.; Kása, I.; Horel, Á.; Pokovai, K.; Birkás, M.; Kern, A.; Hollós, R.; et al. Effect of tillage and crop type on soil respiration in a long-term field experiment on chernozem soil under temperate climate. Soil Tillage Res. 2022, 216, 105239. [Google Scholar] [CrossRef]
  35. Buragienė, S.; Šarauskis, E.; Romaneckas, K.; Adamavičienė, A.; Kriaučiūnienė, Z.; Avižienytė, D.; Marozas, V.; Naujokienė, V. Relationship between CO2 emissions and soil properties of differently tilled soils. Sci. Total Environ. 2019, 662, 786–795. [Google Scholar] [CrossRef]
  36. Fang, C.; Moncrieff, J.B. The dependence of soil CO2 efflux on temperature. Soil Biol. Biochem. 2001, 33, 155–165. [Google Scholar] [CrossRef]
  37. Fu, G.; Shen, Z.-X. Asymmetrical warming of growing/non-growing season increases soil respiration during growing season in an alpine meadow. Sci. Total Environ. 2022, 812, 152591. [Google Scholar] [CrossRef]
  38. Jian, J.; Bahn, M.; Wang, C.; Bailey, V.L.; Bond-Lamberty, B. Prediction of annual soil respiration from its flux at mean annual temperature. Agric. For. Meteorol. 2020, 287, 107961. [Google Scholar] [CrossRef]
  39. Peregrina, F. Surface soil properties influence carbon oxide pulses after precipitation events in a semiarid vineyard under conventional tillage and cover crops. Pedosphere 2016, 26, 499–509. [Google Scholar] [CrossRef]
  40. Melling, L.; Hatano, R.; Goh, K.J. Soil CO2 flux from three ecosystems in tropical peatland of Sarawak, Malaysia. Tellus Ser. B Chem. Phys. Meteorol. 2005, 57, 1–11. [Google Scholar] [CrossRef]
  41. Zhang, X.; Xin, X.; Yang, W.; Ding, D.; Ren, G.; Li, M.; Zhu, A. Soil respiration and net carbon flux response to long-term reduced/no-tillage with and without residues in a wheat-maize cropping system. Soil Tillage Res. 2021, 214, 105182. [Google Scholar] [CrossRef]
  42. Yang, X.D.; Ali, A.; Xu, Y.-L.; Jiang, L.-M.; Lv, G.-H. Soil moisture and salinity as main drivers of soil respiration across natural xeromorphic vegetation and agricultural lands in an arid desert region. Catena 2019, 177, 126–133. [Google Scholar] [CrossRef]
  43. Negassa, W.; Price, R.F.; Basir, A.; Snapp, S.S.; Kravchenko, A. Cover crop and tillage systems effect on soil CO2 and N2O fluxes in contrasting topographic positions. Soil Tillage Res. 2015, 154, 64–74. [Google Scholar] [CrossRef] [Green Version]
Figure 1. Ternary-crop plots.
Agronomy 12 00141 g001
Figure 2. The sowing scheme of mono (a), binary (b) and ternary (c) cultivations.
Agronomy 12 00141 g002aAgronomy 12 00141 g002b
Figure 3. Impact of multi-cropping on soil penetration resistance, 2020. (a) Beginning of the vegetative season; (b) middle of the vegetative season; and (c) end of the vegetative season. MA: maize, HE: hemp and FB: faba bean mono-crops; MA + HE: maize + hemp, MA + FB: maize + faba bean, and HE + FB: hemp + faba bean binary-crops; MA + HE + FB: maize + hemp + faba bean ternary-crops. Bars mean standard deviation.
Agronomy 12 00141 g003aAgronomy 12 00141 g003b
Figure 4. Impact of multi-cropping on soil penetration resistance, 2021. (a) Beginning of the vegetative season; (b) middle of the vegetative season; and (c) end of the vegetative season. MA: maize, HE: hemp, and FB: faba bean mono-crops. MA + HE: maize + hemp, MA + FB: maize + faba bean, and HE + FB: hemp + faba bean binary-crops. MA + HE + FB: maize + hemp + faba bean ternary-crop. Bars mean standard deviation.
Agronomy 12 00141 g004aAgronomy 12 00141 g004b
Table 1. Multi-cropping diversity.
Multi-Cropping IntensityCultivationAbbreviation
mono-cropmaizeMA
hempHE
faba beanFB
binary-cropmaize + hempMA + HE
maize + faba beanMA + FB
hemp + faba beanHE + FB
ternary-cropmaize + hemp + faba beanMA + HE + FB
Table 2. Average air temperature and rainfall during vegetative seasons. Data from the Kaunas meteorological station.
Months20202021Long-Term (Since 1974) Average
Air temperature °C
April6.96.26.9
May10.511.413.2
June19.019.516.1
July17.422.618.7
August18.716.517.3
Rainfall mm
April4.033.741.3
May94.4121.661.7
June99.340.376.9
July60.448.496.6
August92.8122.288.9
Table 3. Impact of multi-cropping on soil structural composition and stability, 2020–2021.
Multi-CroppingSoil Structure, %
MegaMacroMicroStability
beginning of vegetative season (2020)
MA20.7 a70.1 a9.2 a51.8 a
HE21.5 a68.4 a10.2 a57.9 a
FB21.8 a69.3 a8.9 a54.2 a
MA + HE16.9 a73.6 a9.6 a59.1 a
MA + FB21.6 a69.5 a9.0 a53.7 a
HE + FB23.0 a68.4 a8.6 a55.8 a
MA + HE + FB21.7 a69.2 a9.1 a55.8 a
end of vegetative season (2020)
MA25.4 a69.5 a5.1 a43.8 a
HE23.6 a69.0 a7.5 a47.9 a
FB29.9 a66.2 a3.9 a40.7 a
MA + HE27.6 a64.2 a8.3 a46.1 a
MA + FB28.9 a65.7 a5.4 a49.5 a
HE + FB29.4 a61.4 a9.2 a51.6 a
MA + HE + FB28.7 a65.0 a6.3 a47.0 a
beginning of vegetative season (2021)
MA37.9 a59.1 a3.1 a38.5 a
HE40.0 a57.2 a2.8 a45.4 a
FB46.8 a51.5 a1.7 a41.3 a
MA + HE31.9 a65.3 a2.7 a35.8 a
MA + FB33.7 a63.5 a2.8 a35.2 a
HE + FB38.8 a58.8 a2.5 a35.5 a
MA + HE + FB37.5 a59.8 a2.7 a40.7 a
end of vegetative season (2021)
MA21.7 a75.1 a3.2 a30.3 a
HE24.4 a70.9 ab4.7 a30.5 a
FB33.3 a64.4 ab2.3 a27.1 a
MA + HE36.9 a60.0 ab3.1 a30.4 a
MA + FB28.3 a67.8 ab3.9 a28.6 a
HE + FB39.5 a57.7 b2.8 a30.0 a
MA + HE + FB38.3 a59.1 ab2.6 a27.8 a
Notes: MA: maize, HE: hemp. and FB: faba bean mono-crops. MA + HE: maize + hemp, MA + FB: maize + faba bean, and HE + FB: hemp + faba bean binary-crops. MA + HE + FB: maize + hemp + faba bean ternary-crop. Different letters (a,b) within columns mean significant difference between treatments at p ≤ 0.05.
Table 4. Impact of multi-cropping on soil gas concentration, respiration and soil thermo-hydraulic conditions, 2020.
Multi-CroppingCO2 Concentration %O2 Concentration %CO2 Respiration Rate μmol m−2 s−1Soil Moisture Content %Soil Temperature °C
beginning of vegetative season
MA0.050 a11.400 a1.940 a13.82 a17.55 ab
HE0.110 ab11.397 a2.327 a14.32 a17.36 ab
FB0.307 ab11.347 a2.887 a13.51 a17.93 ab
MA + HE0.050 a11.430 a2.140 a14.04 a17.92 ab
MA + FB0.240 ab11.423 a1.680 a13.45 a16.91 a
HE + FB0.947 b11.000 a2.537 a14.57 a17.84 ab
MA + HE + FB0.050 a11.513 a2.373 a14.60 a18.37 b
middle of vegetative season
MA0.830 a9.110 a7.363 a16.87 a20.37 a
HE0.603 a9.183 a5.880 a14.77 a22.13 a
FB0.430 a9.233 a3.863 a15.86 a22.20 a
MA + HE0.490 a9.213 a5.043 a14.75 a22.15 a
MA + FB0.230 a9.257 a4.123 a15.21 a22.17 a
HE + FB0.153 a9.257 a5.057 a14.46 a21.98 a
MA + HE + FB0.240 a9.287 a4.723 a15.17 a22.05 a
end of vegetative season
MA0.117 a8.010 a 21.37 a18.23 a
HE0.080 a8.020 a 22.90 a17.93 a
FB0.113 a8.053 a 19.67 a17.97 a
MA + HE0.163 a8.007 a-19.63 a18.13 a
MA + FB0.080 a8.043 a 23.67 a18.07 a
HE + FB0.143 a8.060 a 18.13 a18.73 a
MA + HE + FB0.140 a8.057 a 21.43 a18.17 a
Notes: MA: maize, HE: hemp. and FB: faba bean mono-crops. MA + HE: maize + hemp, MA + FB: maize + faba bean, and HE + FB: hemp + faba bean binary-crops. MA + HE + FB: maize + hemp + faba bean ternary-crop. Different letters (a,b) within columns mean significant difference between treatments at p ≤ 0.05.
Table 5. Correlations between soil hydrothermal conditions and gasses disposition, 2020.
VariablesSoil Temperature °CSoil Moisture Content %CO2 Concentration %O2 Concentration %CO2 Respiration
μmol m−2 s−1
beginning of vegetative season
Soil temperature °C1.0000.545nn0.640
Soil moisture content %-1.000nnn
CO2 concentration %--1.000−0.957 **0.378
O2 concentration %---1.000−0.359
middle of vegetative season
Soil temperature °C1.000−0.793 *−0.6940.787 *−0.848 *
Soil moisture content %-1.0000.654−0.6330.454
CO2 concentration %--1.000−0.954 **0.775 *
O2 concentration %---1.000−0.853 *
end of vegetative season
Soil temperature °C1.000−0.6350.5130.350-
Soil moisture content %-1.000−0.782 *n
CO2 concentration %--1.000n
O2 concentration %---1.000
Note: * means significance of correlation coefficient (r) at p ≤ 0.05, **—at p ≤ 0.01; n—weak correlation.
Table 6. Impact of multi-cropping on soil gas concentrations, respiration and soil thermo-hydraulic conditions, 2021.
Multi-CroppingCO2 Concentration %O2 Concentration %CO2 Respiration Rate μmol m−2 s−1Soil Moisture Content %Soil Temperature °C
beginning of vegetative season
MA2.067 b15.303 b2.865 a14.84 a17.94 a
HE0.567 a3.405 a2.267 a13.60 a17.68 a
FB0.777 ab7.968 ab1.832 a14.03 a17.56 a
MA + HE1.343 ab9.304 ab2.545 a14.22 a17.53 a
MA + FB0.760 ab8.234 ab1.778 a14.04 a17.72 a
HE + FB0.983 ab8.733 ab2.723 a13.74 a18.21 a
MA + HE + FB0.483 a4.330 a1.857 a13.83 a17.28 a
middle of vegetative season
MA0.663 a22.333 a4.928 a14.42 a22.28 a
HE0.833 a22.172 a5.565 a17.10 a20.38 a
FB0.870 a23.000 a5.837 a15.98 a22.25 a
MA + HE0.550 a21.634 a5.655 a14.12 a22.16 a
MA + FB0.597 a22.803 a4.682 a15.19 a22.09 a
HE + FB0.460 a21.933 a4.192 a14.77 a21.99 a
MA + HE + FB1.140 a22.234 a5.208 a15.50 a22.15 a
end of vegetative season
MA0.880 a19.000 a4.587 a12.73 a15.83 a
HE0.588 a19.001 a2.977 a12.71 a16.34 ab
FB1.167 a19.073 a3.833 a14.34 a17.49 b
MA + HE1.147 a18.974 a2.417 a12.59 a15.75 a
MA + FB1.100 a18.904 a2.637 a14.12 a15.88 a
HE + FB0.823 a19.101 a1.957 a12.48 a16.86 ab
MA + HE + FB0.430 a19.069 a1.860 a14.03 a17.58 b
Notes: MA: maize, HE: hemp, and FB: faba bean mono-crops. MA + HE: maize + hemp, MA + FB: maize + faba bean, and HE + FB: hemp + faba bean binary-crops. MA + HE + FB: maize + hemp + faba bean ternary-crop. Different letters (a,b) within columns mean significant difference between treatments at p ≤ 0.05.
Table 7. Correlations between soil hydrothermal conditions and gas disposition, 2021.
VariablesSoil Temperature °CSoil Moisture Content %CO2 Concentration %O2 Concentration %CO2 Respiration
μmol m−2 s−1
beginning of vegetative season
Soil temperature °C1.000n0.4440.5070.673
Soil moisture content %-1.0000.906 **0.912 **0.433
CO2 concentration %--1.0000.943 **0.767 *
O2 concentration %---1.0000.612
middle of vegetative season
Soil temperature °C1.000−0.764 *nnn
Soil moisture content %-1.0000.5570.3920.385
CO2 concentration %--1.0000.3140.494
O2 concentration %---1.000n
end of vegetative season
Soil temperature °C1.0000.519-0.3790.801*n
Soil moisture content %-1.000nnn
CO2 concentration %--1.000−0.3910.337
O2 concentration %---1.000n
Note: * means significance of correlation coefficient (r) at p ≤ 0.05, **—at p ≤ 0.01; n—weak correlation.
Publisher’s Note: MDPI stays neutral with regard to jurisdictional claims in published maps and institutional affiliations.

