Abstract
In south-western France, sunflowers are usually grown in short rotations and after a long fallow period during which soils are left bare. This practice can favour diseases, caused by soilborne fungi, such as sunflower verticillium wilt (SVW), as well as nitrate leaching, both of which can decrease yields. Growing cover crops during a fallow period is an agroecological practice that could provide ecosystem services and mitigate SVW. A Brassicaceae cover crop that causes biofumigation produces glucosinolates and liberate biocidal compounds that might regulate SVW biologically. Moreover, the green manure effect of the Fabaceae might increase soil mineral nitrogen (SMN). To go further, mixtures of Brassicaceae and Fabaceae might mutualise the benefits that each cover crop has in sole crops. A four-year field study in south-western France tested Brassicaceae (brown mustard, turnip rape and fodder radish) and Fabaceae (purple vetch) in sole crops or a mixture with two or three species during the fallow period, followed by biofumigation, and sunflower crop. The cover crops were characterised, SMN was measured, the SVW and yield were assessed and compared to those of the crop grown on soils left bare during the fallow period. Purple vetch as a sole crop cover crop significantly increased SMN before sunflower sowing but only in 2019. Fodder radish as a sole crop reduced SVW severity significantly, overall, 80 days after sowing, except in 2019, when weather conditions were unfavourable to biofumigation. Purple vetch as a sole crop also reduced significantly SVW severity in 2017 and 2020. Finally, sunflower yields after cover crops were higher than those after bare soils, only after purple vetch as a sole crop in 2020, with a mean increase of 0.77 t ha−1. Mixtures of Brassicaceae and Fabaceae sowed at these densities resulted in an intermediate SMN level between those in sole crops and the bare soil and they did not significantly decrease SVW or increase yields. Our results suggest that cover crops, especially fodder radish or purple vetch, and biofumigation can provide ecosystem services for sunflower, instead of leaving soils bare during the fallow period. However, the extent of ecosystem services is markedly affected by soil and climatic conditions as well as other management practices.
1. Introduction
Sunflower (Helianthus annuus L.) is one of the main oilseed crops grown worldwide, reaching 57.1 million t of seed produced in 2019–2020 [1]. Mainly cultivated for its oil [2], sunflower has many agroecological benefits [3]. Sunflower is considered a drought-tolerant crop that uses limited water resources efficiently [4]. It readily captures soil nitrogen (N) not taken up by the previous crop [5] and requires few chemical inputs, except for weed control [3]. Although a sunflower crop is a favourable preceding crop for cereals [6], its productivity is reduced due to a variety of factors (e.g., birds, fungal diseases, low and uneven plant populations) [7], drought [8,9] and high temperatures [10]. Global sunflower production varies greatly from year to year [1], and mean yields in France have barely exceeded 2 t ha−1 for the last 10 years [11].
Fungal diseases are often considered a severe constraint for the stability of sunflower yield. The most widespread and detrimental diseases in sunflower production are downy mildew (Plasmopara halstedii), verticillium wilt (Verticillium dahliae), phomopsis stem canker (Phomopsis helianthi), phoma black stem (Phoma macdonaldii) and white mould (Sclerotinia sclerotiorum) [3,12]. Growing sunflower frequently during a rotation favours the proliferation of these pathogens. In south-western France, one of France’s two main basins of sunflower production [5,7], the crop is frequently grown in short rotations (mainly wheat-sunflower) [6]. The limits of this system are that (i) bare soils during the fallow period (9 months) lead to nutrient leaching and groundwater pollution [13], and (ii) reduce soil tillage after sunflower harvest increases fungal inocula, as infected stubbles remain on the soil surface [14].
In the past few years, sunflower verticillium wilt (SVW) has been observed widely in France [3,15]. Verticillium wilt is caused by the soilborne ascomycete fungus Verticillium dahliae. Typical symptoms are characterised by chlorosis and necrosis of leaves, starting from the bottom of the sunflower [16], and can occur on only one side or the entire plant [17]. These symptoms accelerate leaf senescence and decrease photosynthetic area [18,19]. V. dahlia persists in the soil through microsclerotia for up to 14 years [20], even without a susceptible host [21]. V. dahliae has a wide host range besides sunflower and can survive on vegetable crops [22,23,24] and weeds including Chenopodium sp., dandelions and white clover [25]. Experiments in south-western France estimated yield losses up to 0.25 t ha−1, or 50% in case of severe attacks [19].
In the past, the control of diseases caused by soilborne pathogens, including that of verticillium wilt, was based on the use of chemical fumigants such as methyl bromide, especially on high-value vegetable crops [26]. However, such chemical fumigants have been banned from being used in the European Union since 2005 [27]. To limit SVW, the only disease control method available to date relies on varietal resistance [19]. However, the circumvention of genetic resistance commonly occurs in sunflowers [28], and alternative crop protection methods are needed. To this aim, cover cropping and biofumigation, which can provide ecosystem services such as a biological regulation of soilborne diseases, have great potential [29]. Biofumigation is an alternative disinfection method to chemical fumigation, with in situ production of biocidal molecules by plants [30]. This consists of a form of bio-disinfection that derives from the suppressive effect of glucosinolates on soilborne pathogens through the liberation of volatile compounds, mainly isothiocyanates [30,31]. The latter are released after hydrolysis of glucosinolates by the enzyme myrosinase during tissue disruption and incorporation into the soil. Brassicaceae species have different glucosinolates concentrations and profiles, whether aromatic, aliphatic or indolyl [32,33,34,35]. In vitro experiments using synthetic isothiocyanates and pot experiments using chopped Brassicaceae tissues showed significant inhibition of V. dahliae germination or development [36,37,38]. In the field, biofumigation to control V. dahliae has more contrasting effects. It is expected to have a biocidal action on V. dahliae microsclerotia through the liberation of isothiocyanates and other volatile compounds [39]. The direct biocidal activity is limited in time as the molecules can be lost by volatilisation, sorption onto soil components, leaching and microbial degradation [40]. For instance, the viability of microsclerotia and cauliflower verticillium wilt decreased after incorporation of broccoli residues [41], whereas incorporation of brown mustard did not affect on microsclerotia in the short-term [39], or on tomato verticillium wilt [23]. In the field, Brassicaceae residues need to be chopped and quickly incorporated into the soil to liberate these biocidal compounds [40,42,43,44]. The effectiveness of biofumigation depends greatly on many factors, such as the quantity of biomass produced [45], destruction at flowering to obtain peak glucosinolates [44,46,47], along with mild temperatures and water availability [29,40,44]. The complexity of these factors that influence successful biofumigation leads to high variability in the provision of a biological regulation service against soilborne pathogens [48].
The utility of growing cover crops of Brassicaceae for their potential ecosystem service of regulating soilborne diseases could be supported by other ecosystem services, such as supporting services related to nutrient cycling. They provide catch-crop effects that decrease nitrate leaching and groundwater pollution [13]. After the destruction, their moderate C:N ratio releases nitrate into the soil slowly [49]. Thus, the duration between the destruction of Brassicaceae cover crops and sunflower sowing determine the cover crop’s green manure effect, or pre-emptive effect, due to immobilizing nitrate [50]. This pre-emptive effect could be decreased by mixing Brassicaceae and Fabaceae. Fabaceae increase soil mineral nitrogen (SMN) through N-fixing symbioses [51,52], and their low C:N ratio allows for rapid mineralisation, which releases nitrate, and an effective-green manure service [53]. An increase in SMN is favourable to sunflower development and yields [54]. Brassicaceae and Fabaceae mixtures can provide more benefits than sole cover crops [55]. Mixtures had higher effective N green-manure effects than Brassicaceae sole crops [13] and maintained the production of glucosinolates in Brassicaceae [56]. On sunflower, the only study available to date showed that crop yield increased more after Fabaceae mixtures than after fallow in a reduced-tillage system and after Brassicaceae in a no-tillage system [57].
Despite a long fallow period between wheat harvest and sunflower sowing that would be particularly suitable for cover cropping in south-western France, no field study has assessed the potential of Brassicaceae and Fabaceae cover crops, as a sole crop or in mixtures, in SVW control and sunflower productivity. Beyond characterising the performances of Brassicaceae and/or Fabaceae cover crops in sole crops or in mixture of two or three species, the main objectives of this four-year field study under conditions in south-western France were to (i) estimate the ecosystem services of cover crops for SMN, (ii) evaluate effects of cover crops and biofumigation on SVW, and (iii) assess benefits of cover crops for sunflower productivity. We hypothesized that cover crops and biofumigation would increase SMN after Fabaceae cover crops, reduce SVW severity, especially after Brassicaceae cover crops, and therefore increase sunflower yields, compared to bare soils. We also expected the Brassicaceae and Fabaceae mixtures to mutualise the benefits of each species.
2. Materials and Methods
2.1. Experimental Design and Crop-Management Systems
Field experiments were conducted at INRAE, Auzeville, near Toulouse, in south-western France (43.528° N, 1.501° E) over four years with cover crops sown in 2015, 2016, 2018 and 2019 prior to sowing a sunflower in 2016, 2017, 2019 and 2020. The year of the experiment are summarised in 2016, 2017, 2019 and 2020. Auzeville has a temperate oceanic climate (cfb) according to the Köppen climate classification. The fields selected were naturally infested with V. dahliae. The previous crop was wheat to follow the most common rotation system in south-western France, except in 2020, when the previous crop was sunflower. The previous crop, soil texture and soil organic matter content of each field are resumed in Table 1.

Table 1.
Field characteristics and crop management for the cover crops and the sunflower of the four-year experiment carried out at Auzeville, France. Cover crops were sown after a previous crop in 2015, 2016, 2018 and 2019, and the destruction was performed close to the flowering of the Brassicaceae. Sunflower cultivar (cv. 1 or cv. 2) were sown after cover crops destruction in 2016, 2017, 2019 and 2020. Irrigation and N fertilisation are for the growing season measurements from the sowing date to the date of cover crop destruction or sunflower harvest. DAS is for days after sowing.
The experimental design progressed over the four years, with one block in 2016, three blocks of non-randomised design in 2017 and three blocks of completely randomised design in 2019 and 2020. The factor tested in these experiments was the cover crops species before sunflower. The control treatment involved leaving the soil bare during the fallow period. Weeds and spontaneous emergence of the previous crop were negligible and left unmanaged. Plots were 6 m wide to allow the sowing of 12 rows of sunflower. Plot length varied from 12 m (2019 and 2020) to 50 m (2017), to 120 m (2016).
Cover crops treatments were Brassicaceae or Fabaceae commonly cultivated in south-western France. Seeds were kindly provided by Cérience (Beaufort-en-Vallée, France). The Brassicaceae species were brown mustard (Brassica juncea cv. Etamine), turnip rape (Brassica rapa subsp. oleifera cv. Chicon) and fodder radish (Raphanus sativus cv. Anaconda) and the Fabaceae species was purple vetch (Vicia benghalensis cv. Titane). The Brassicaceae were selected from preliminary screening experiments in vitro that assessed their ability to control V. dahliae, and the diversity of their glucosinolates profiles and concentrations [38,56]. Purple vetch was selected for its good green-manure effect in sole crops or mixtures Brassicaceae [13] and minimises competition with Brassicaceae [58]. These cover crops were grown in sole crops all four years, except the Fabaceae in 2016. In 2019 and 2020, mixtures of two or three species were tested. A mixture of two species contained one Brassicaceae and one Fabaceae, while a mixture of three species contained two Brassicaceae and one Fabaceae, in a substitutive design. All cover crops were compared to bare soil. Four treatments were tested in 2016, five in 2017, and ten each in 2019 and 2020.
The crops management was carried out by INRAE APC [59]. The cover crops were sown using a cereal seed drill (Kuhn, Saverne, France) in late August to mid-October depending upon the weather conditions each year. Species grown in sole crops were sown at densities recommended by the cover crop seed distributor and breeder. In a mixture of two or three species, the sowing density for each species was ½ or ⅓ of its corresponding sole-crop density (Table 1). To ensure homogeneous development, cover crops were irrigated at sowing by sprinkler except in 2016 (Table 1). Cover crops were not fertilised, and pesticide was applied when needed with an application of ferric phosphate (Certis Europe, Guyancourt, France) against slugs in 2016 and lambda-cyhalothrin (Syngenta France SAS, Saint Sauveur, France) against sawfly in 2019. The biofumigation was performed close to the flowering of the Brassicaceae. The cover crops were chopped using a flail mower (Kverneland, Klepp, Norway) and quickly incorporated into the soil using a cultivator (Agrisem International, Ancenis-Saint-Géréon, France). A roller-crimper (SEMAS & FERJU GOURDIN, Selles, France) ensured good contact between the soil and the chopped cover crops. In April or May, depending upon the weather conditions each year, a sunflower cultivar susceptible to V. dahliae was sown. In 2016 and 2017, the cultivar was the same (cv. 1). As it was no longer commercialised after 2018, another susceptible cultivar (cv. 2) was sown in 2019 and 2020. Plant density was 7.5 plants m−2 after thinning. Sunflower were cultivated following low-input management. N fertilisation was adjusted based on soil analyses before sunflower sowing and was the same for all treatments (Table 1). The quantity and timing of sprinkler irrigation were determined according to precipitation and the soil water deficit (Table 1). Weather conditions (temperatures and precipitation) during cover crop and sunflower development, as well as the day of biofumigation, varied (Table 2).
Table 2.
Climate conditions of the four-year experiment carried out at Auzeville, France. Cumulative growing degree days and precipitation values are sums of growing season measurements from the sowing date to the date of cover crop destruction, and sunflower harvest. Climate data at biofumigation are the mean day temperature at cover crops destruction and the sum of precipitation 7 days from cover crops destruction. GDD is for growing degree days, Br is for Brassicaceae, and Fb is for Fabaceae.
2.2. Cover Crop and Soil Sampling
2.2.1. Cover Crop Sampling and Partial Land Equivalent Ratio Calculation
Before cover crop destruction and incorporation (biofumigation), samples of the shoot and root biomass of Brassicaceae and Fabaceae (sole crops and mixtures) were collected from 0.5 m2 replicates in each plot, except for the roots of vetch in 2017 (wet soils at the date of sampling did not permit to properly sample the roots of vetch), and the turnip rape in mixtures of three species in 2019 (no seedling of the turnip rape). Samples came from the middle of the plots to avoid edge effects between different treatments. The number of plants of each species in sole crops and mixtures was counted to calculate densities. Shoots and roots were separated, and the root systems were washed with cold water to remove the remaining soil. Fresh samples were weighed, then dried at 80 °C for 48 h and weighed to estimate the total dry matter biomass produced per species. A sub-sample of each species per plot was ground to estimate C and N content in the tissues via elemental analyses based on the Dumas method (Elementar MicroVario Cube, Langenselbold, Germany).
In each plot, a sub-sample of Brassicaceae (4–5 plants) was cut into 2–3 cm pieces and immediately frozen at −80 °C before lyophilisation for glucosinolates analysis. Glucosinolate profiles and concentration analysis were performed in specialised laboratories (Institute for Water and Wetland Research, Radboud University, Nijmegen, The Netherlands, for 2016 and 2017 samples, and German Centre for Integrative Biodiversity Research for 2019 and 2020 samples). Both laboratories used the method detailed in [61]. The quantities of glucosinolates produced by each Brassicaceae in sole crops and mixtures were calculated by multiplying dry biomass by the concentration of each glucosinolate of each profile.
Land equivalent ratio (LER) is defined as the area of a sole crop required to reach the same biomass as a mixture [62]. It has been used to compare the performance of sole crops and mixtures for cash crops [63] and cover crops [13]. However, this index is based on the theoretical density of each species in mixtures. As densities of the mixtures in 2019 and 2020 frequently differed from the desired densities at sowing (50:50 or 33:33:33), the partial LER (LERp) for Brassicaceae or Fabaceae was calculated (1) and compared to the density ratio (DR) between sole crops and mixtures (2):
The performance of each of Brassicaceae and Fabaceae was compared (3):
If the comparison exceeded 1 (i.e., LERp > DR), then the mixtures performed better than the sole crops, and vice-versa.
2.2.2. Soil Sampling
Before sunflower sowing, six soil cores were randomly taken at depths of 0–30, 30–60 and 60–90 cm with a hydraulic core drill within each treatment and each block. The six cores for each depth were pooled, and SMN content of 12, 45 and 90 soil samples were analysed in 2016, 2017 and both 2019 and 2020, respectively. The analysis was done using a continuous flow auto-analyser (Skylar 51,000, Skalar Analytic, Erkelenz, Germany).
2.3. Sunflower Sampling and Disease Assessment
2.3.1. Assessment of Sunflower Nutrition Status
At flowering, five sunflowers per treatment were sampled and pooled to estimate the N nutrition status for each treatment. It was quantified using the Nitrogen Nutrition Index (NNI), calculated according to [64]:
where Nm is the total N concentration measured in aboveground tissues and Nc is the critical total N concentration calculated for the mass of aerial dry matter (ADM) of sunflower measured in situ (i.e., the minimum N concentration needed to obtain maximum dry matter production by the crop).
Nc was calculated according to [65] using the critical N-dilution curve for sunflower:
2.3.2. Assessment of Sunflower Verticillium Wilt Severity
Before SVW appeared, 10 sunflowers (2019 and 2020), 15 (2017) and 25 (2016) were tagged within each treatment (with three plots per treatment) for the three blocks in 2017, 2019 and 2020 and one block in 2016. Overall, 300 and 675 sunflowers were recorded in 2016 and 2017, respectively, and 900 sunflowers each in 2019 and 2020. At the first signs of SVW, 40–50 days after sowing (DAS), symptoms were assessed weekly. To describe the severity of symptoms on leaves, a rating scale from 0–4 was used: 0 = healthy plant, 1 = [0–20%], 2 = [20–50%], 3 = [50–80%] and 4 = >80% of the plant displaying wilt symptoms. Disease severity was assessed up to 96 DAS in 2016 and 2017, 91 DAS in 2019 and 92 DAS in 2020, 1 week before the onset of normal senescence. At least eight observations were made in 2016, 2019 and 2020, and nine in 2017.
Disease severity index (DSI) was calculated from the rating scale up to maturity, for each plot, according to [66]:
Disease development was also assessed by the area under disease progress curves (AUDPC) of the severity. The AUDPC was calculated according to the equation of [67]:
where n is the number of observations, y the rating scale of SVW and t is the DAS of each observation. AUDPC was calculated for each tagged sunflower and averaged per plot.
2.3.3. Sunflower Yield Estimation
At maturity, sunflowers tagged for SVW monitoring were harvested by hand in each plot and block for the four years of the experiment. The inflorescences were threshed, cleaned with a densiometric column, dried at 80 °C for 48 h and then weighed to estimate sunflower yield for each treatment.
2.4. Statistical Analysis
Within each year, mixed analyses of variance (ANOVA) were used to test the effects of treatment (cover crops and bare soil) on SMN before sunflower sowing, DSI or AUDPC of SVW at each DAS, and manual yields. Blocks were always used as random factors. This model was also applied to characterise the cover crops (biomass produced and C:N ratio). Arcsine and square root transformations were carried out on all percent data prior to applying statistical analysis to improve the homogeneity of variance [68]. The assumptions of validity of the models were checked, and if not respected, square root or log transformations were performed on the quantitative variables of the analysis. Post-hoc multiple comparisons were performed to compare among all the different treatments. Correlations of Spearman and regression models that combined data for all four years were used to assess relationships between sunflower yield and DSI or sunflower NNI at flowering. Cover crops were used pooled by botanical family or composition (i.e., bare soil, Brassicaceae sole crop, Fabaceae sole crop, mixture of two or three species). For all data analyses, differences among treatments were considered significant at α = 0.05. Statistical analyses were performed using Rstudio software v4.0.0 (R Core Team, Boston, MA, USA, 2020).
3. Results
3.1. Cover Crop Production and Characterisation
3.1.1. Cover Crop Biomass Production
Overall, Brassicaceae sole crops produced more total dry matter biomass (roots and shoots) in 2016 than in the following years (Figure 1). Fodder radish was the most productive Brassicaceae during the four years, whereas brown mustard was the least. Fodder radish biomass reached 6.1 and 4.7 t ha−1 in 2016 and 2019, respectively when sown in September (early sowing; Table 1). It produced less biomass the other years: 2.1 t ha−1 in 2017 (early sowing) and 2.2 t ha−1 in 2020 (late sowing, in October). Fodder radish produced more biomass than the Fabaceae sole crops, except in 2020, when purple vetch produced the most shoot biomass with 2.7 t ha−1 (Table A1).
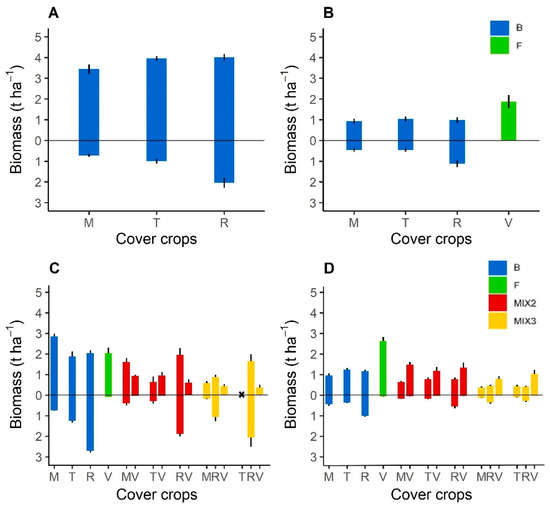
Figure 1.
Shoot (above zero) and root (below zero) dry matter biomass (t ha−1) for each Brassicaceae or Fabaceae species cover crops in sole crops or mixtures measured at the cover crop destruction in 2016 (A), 2017 (B), 2019 (C) and 2020 (D). In 2019, the turnip rape did not grow in a mixture of fodder radish and purple vetch. Abbreviation letter refers to cover crop species with M for brown mustard, T for turnip rape, R for fodder radish, and V for purple vetch. Error bars represent standard errors.
Overall, Brassicaceae or Fabaceae sole crops produced significantly (p < 0.05 or p < 0.01) more biomass than mixtures per unit area (Figure 1C,D, Table A1), as mixtures were sown at ½ or ⅓ of their sole-crop densities. Fodder radish always produced significantly (p < 0.05 or p < 0.01) more biomass in sole crops than in mixtures, but differences were inconsistent for the other cover crops. With early sowing (2019), the total biomass of Brassicaceae sole crops and mixtures was higher than those of Fabaceae (Figure 1). Conversely, with late sowing (2020), the shoot biomass of Fabaceae sole crops and mixtures was higher than those of Brassicaceae. For example, in 2019, fodder radish had highest biomass (3.83 t ha−1) when associated with purple vetch (0.61 t ha−1) in mixtures of two species. Conversely, in 2020, purple vetch had the highest biomass when associated with Brassicaceae in a mixture of two or three species (Table A1). Based on the LERp, mixtures performed better overall than sole crops in 2019, as the LERp:DR ratio exceeded 1, except for purple vetch cultivated with fodder radish and brown mustard in a mixture of three species (ratio = 0.88). Conversely, in 2020, all Brassicaceae performed better in sole crops than in mixtures (ratio < 1), whereas purple vetch always performed better in mixtures (ratio > 1).
3.1.2. Cover Crop C:N Ratio
The C:N ratio of each cover crop species in sole crops and in mixtures varied among years (Table A2). For the four sole crops, the three Brassicaceae had C:N ratios significantly (p < 0.01) higher than that of purple vetch, regardless of the year. C:N ratios of the Brassicaceae species in sole crops did not differ significantly. In mixtures, C:N ratios of the Brassicaceae were always lower than those in sole crops, and this difference was always significant (p < 0.05 or p < 0.01) in a mixture of two species (Table A2). Conversely, purple vetch had an equivalent C:N ratio in sole crops or mixtures. In 2019, C:N ratios of Brassicaceae in a mixture of two species were 57–67% of those in sole crops, and that of purple vetch in mixtures was 94% of that in sole crops. Finally, in 2019 and 2020, the C:N ratio of each species in a mixture of two or three species did not differ significantly, except for brown mustard in a mixture of three species in 2020 (Table A2).
3.1.3. Glucosinolates Production of Brassicaceae Cover Crops
The quantities of glucosinolates produced by each species of Brassicaceae per m2 of soil were calculated as the product of biomass and glucosinolates concentration in the tissues in sole crops or mixtures in 2016 and 2017 (Figure 2) and 2019 and 2020 (Figure 3). Total quantities of glucosinolates varied highly over the four years of the experimentation, in accordance with dry matter biomass production (Figure 1) and the environment. In 2017, the lyophilisation of the fodder radish samples, not totally achieved, may have induced a volatilisation of the glucosinolates. The three species of Brassicaceae had contrasting profiles and quantities of aliphatic, aromatic and indole glucosinolates. In sole crops, brown mustard and fodder radish produced the most aliphatic glucosinolates, mainly sinigrin and glucoraphasatin, respectively. Turnip rape produced less aliphatic glucosinolates but more indole glucosinolates than the other species. Glucosinolates production also differed between shoots and roots of the crops. Unlike fodder radish, which produced more glucosinolates in the roots, the other Brassicaceae produced more glucosinolates in the shoots. Brown mustard produced five times as many aliphatic glucosinolates in shoots than in roots each year, unlike fodder radish.
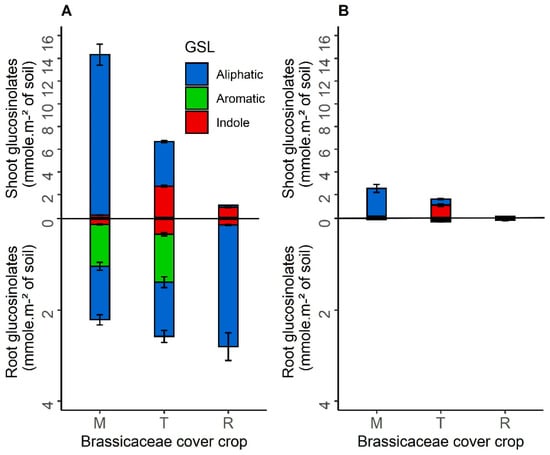
Figure 2.
Mean shoot and root glucosinolates production function of the total dry matter biomass of each species of Brassicaceae cover crop per square meter of soil (mmol m−2 of soil) in sole crops in 2016 (A) and 2017 (B). Abbreviation letter refers to Brassicaceae cover crop with M for brown mustard, T for turnip rape, R for fodder radish. Error bars represent standard errors.
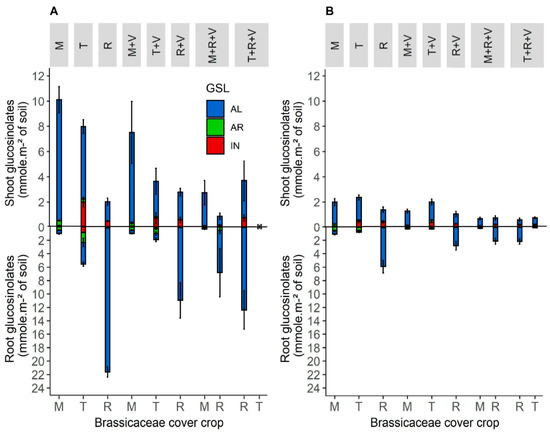
Figure 3.
Mean shoot and root glucosinolates production function of the total dry matter biomass of each species of Brassicaceae cover crop per square meter of soil (mmol m−2 of soil) in sole crops and mixture with vetch in 2019 (A) and 2020 (B). In 2019, the turnip rape did not grow in the mixture with fodder radish and purple vetch. Abbreviation letter refers to cover crop species with M for brown mustard, T for turnip rape, R for fodder radish and V for purple vetch. Error bars represent standard errors.
Regarding sole crops and mixtures, the Brassicaceae produced more glucosinolates in sole crops than in mixtures (Figure 3), as they produced more biomass in sole crops than in mixtures (Figure 1). However, the quantities of glucosinolates produced in mixtures were not ½ or ⅓ of those produced in sole crops, even though the mixtures were sown at ½ or ⅓ of the densities of the sole crops. In a mixture of two species, fodder radish produced up to 137% of the quantities produced in sole crops (glucosinolates in the shoots, Figure 3A). In a mixture of three species, it always produced at least 43% of that produced in sole crops. These trends were less consistent for brown mustard and turnip rape.
3.2. Soil Mineral Nitrogen Available for Sunflower before Sowing
Cumulative SMN in 0–90 cm soil horizons varied among years (Figure 4), and SMN in 2016 was the highest, especially after bare soil and brown mustard (100 kg N ha−1). In the following years, SMN was less than 70 kg N ha−1, regardless of the year and treatment, with the lowest SMN in 2017 (<50 kg N ha−1). Within a year, soil after Brassicaceae sole crops had less N overall than after bare soil, but the differences were not significant. Conversely, soil after purple vetch in sole crops had more SMN than that after bare soil, and the difference was significant (p < 0.01) in 2019 (Figure 4C), with a cumulative mean increase of more than 50 kg N ha−1. After a mixture of two or three species (Figure 4C,D), SMN was equal to or greater than to those after bare soil or Brassicaceae, but the differences were not significant. Soils after purple vetch in mixtures had less SMN than in sole crops. Thus, SMN after mixtures always lay between those of Brassicaceae and Fabaceae sole crops (Figure 4).
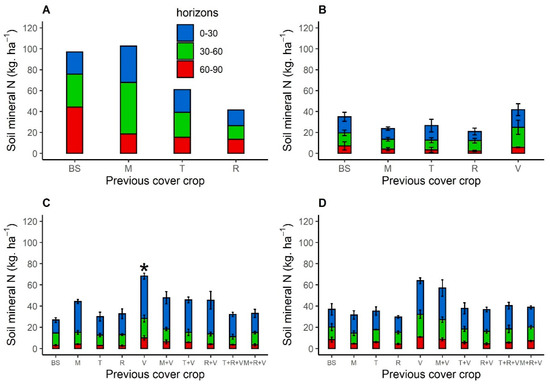
Figure 4.
Soil mineral nitrogen (kg ha−1) in the three depth soil horizons (0–30, 30–60, and 60–90 cm) measured at sunflower sowing in 2016 (A), 2017 (B), 2019 (C) and 2020 (D) after bare soil, Brassicaceae, and Fabaceae cover crops sown in sole crops (A–D) or a mixture (C,D) with one Brassicaceae and one Fabaceae, or two Brassicaceae and one Fabaceae. Abbreviation letter refers to BS for bare soil, M for brown mustard, T for turnip rape, R for fodder radish and V for purple vetch. Error bars represent standard errors. There were no blocks in 2016. Soil mineral nitrogen that differed significantly from that of bare soil are indicated by * (p < 0.05).
3.3. Effects of Cover Crops and Biofumigation on Sunflower Verticillium Wilt
The disease severity index (DSI) measured on the sunflower cultivated after bare soils reached a mean of 80% in 2016 (Figure 5A) but were only around 45% to 50% the following years (Figure 5B–F, Table S1 in Supplemental Data). This highest severity may be due to a high initial density of inoculum and the susceptibility of the cultivar (cv.1, in 2016 and 2017), which is presumably more sensitive than cv.2 in 2019 and 2020. The most effective regulations were observed in 2016, the year when the cover crops produced the highest biomass (Figure 1). Sunflower cultivated after fodder radish in sole crop tended to have lower DSI in 2016, 2017 and 2020 than that grown after bare soil, and differences were significant (p < 0.01 or p < 0.05) at 52, 75 and 81 DAS in 2016, at 84 and 96 DAS in 2017, and at 78 and 84 DAS in 2020 (Figure 5A,B,D). Sunflower cultivated after brown mustard and turnip rape had lower DSI, but it was less consistent than that grown after fodder radish. DSI was significantly lower (p < 0.01 or p < 0.05) on sunflowers following turnip rape or brown mustard in 2016 (from 52 to 81 DAS). In 2017, DSI was significantly lower following turnip rape (at 84 DAS), compared with that after bare soil. Finally, sunflowers cultivated after purple vetch also showed significantly lower DSI in 2020 at 64, 71 and 84 DAS, compared to sunflower cultivated after bare soils. Overall, sunflowers cultivated after a mixture of two or three species did not have significantly lower DSI.
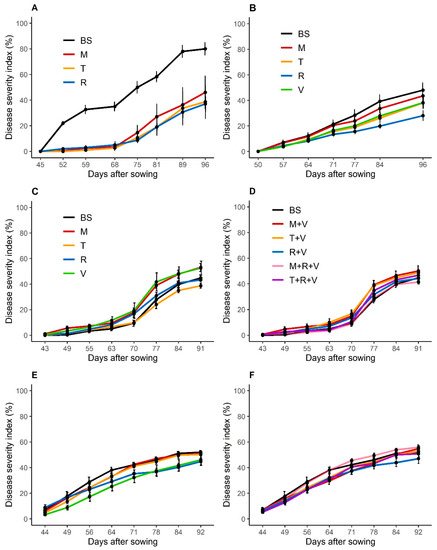
Figure 5.
Annual disease severity index (%) progress curves of sunflower verticillium wilt in 2016 (A), 2017 (B), 2019 (C,D) and 2020 (E,F). Sunflower cultivar cv. 1 (A,B) and cv. 2 (C–F) were cultivated after a bare soil, a Brassicaceae or a Fabaceae cover crop in sole crops (A–C,E), or in a mixture with one Brassicaceae and one Fabaceae, or two Brassicaceae and one Fabaceae (D,F). In 2019, the turnip rape did not grow in the mixture with fodder radish and purple vetch. The number of sunflowers recorded was 300 in 2016 (A), 675 in 2017 (B), and 900 in 2019 (C,D) and 2020 (E,F). Abbreviation letter refers to the treatments with BS for bare soil, M for brown mustard, T for turnip rape, R for fodder radish and V for purple vetch. Error bars represent standard errors.
The AUDPC values calculated from sowing to 80 to 85 DAS (following the year) ranged from 30.3 (2019) to 91.7 (2016) on sunflowers cultivated after bare soil and that were overall consistent with the DSI (Table A3). The AUDPC value was significantly (p < 0.01) lower following Brassicaceae compared to bare soil in 2016, and in 2017 after turnip rape (p < 0.05) and fodder radish (p < 0.01). After purple vetch, the AUDPC was significantly (p < 0.01) lower compared to the bare soil in 2020, whereas the AUDPC was higher in 2019. Overall, sunflowers cultivated after a mixture of two or three species did not have significantly lower AUDPC.
3.4. Effects of Individual Factors on Sunflower Yield
3.4.1. Previous Cover Crop
Regardless of the treatment (bare soil or cover crop), mean sunflower yields ranged from 2.24 t ha−1 and 3.8 t ha−1 (Figure 6). Overall, no significant increase in yields due to cover cropping before sunflower occurred, compared to those after bare soil. In 2016, the mean increase in sunflower yield was 0.9 t ha−1 following fodder radish cover cropping, but this increase was not observed in the following years (Figure 6A). In 2019, sunflower yield following turnip rape in sole crops or a mixture with purple vetch was significantly lower (p < 0.05) compared with that after bare soil or after other cover crops (Figure 6C). In 2020, a significant (p = 0.01) increase in sunflower yield (+0.77 t ha−1) after purple vetch in sole crops was observed compared to that after bare soil (Figure 6D).
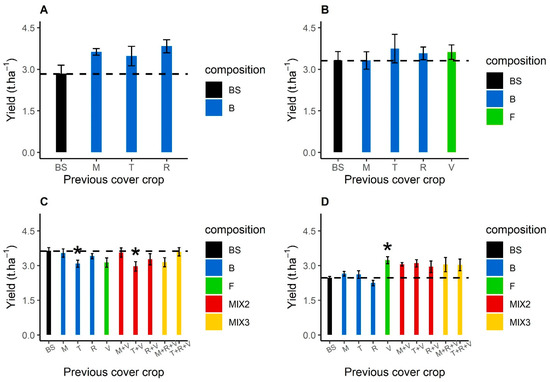
Figure 6.
Manual sunflower yields (t ha−1) from the sunflowers monitored for sunflower verticillium wilt severity after bare soil, Brassicaceae or Fabaceae cover crop in 2016 (A), 2017 (B), 2019 (C) and 2020 (D). The yield after a bare soil is in black, blue after Brassicaceae (B) sole crops, green after Fabaceae (F) sole crops, red for a mixture with one Brassicaceae and one Fabaceae (MIX2), and orange for a mixture with two Brassicaceae and one Fabaceae (MIX3). In 2019, the turnip rape did not grow in the mixture with fodder radish and purple vetch. Abbreviation letters refer to the treatment with BS for bare soil, B for Brassicaceae, F for Fabaceae, M for brown mustard, T for turnip rape, R for fodder radish and V for purple vetch. Dashed lines indicate the mean bare soil yield for the year. Error bars represent standard errors. Treatments with yields that differ significantly from that of bare soil are indicated by * (p < 0.05).
3.4.2. Nitrogen Nutrient index at Flowering and Yields
The relationship between the yield and the NNI is presented in Figure 7, with mean values per block after bare soil, Brassicaceae sole crops, Fabaceae sole crops, and mixtures of two or three species, for the four years of experiment. Mean values of the yield ranged from 2.3 t ha−1 to 4.1 t ha−1 and the NNI from 0.38 to 1.1. When all the 4-year data are considered, independent of cover crop treatments and bare soil, a significant positive Spearman’s correlation (rho = 0.54, p < 0.01) was found between sunflower yield and NNI. The linear regression between yield and NNI was also significant (p < 0.01). The yields increased with NNI increasing. However, no clear trend or consistent response was found between the treatment used and NNI values.
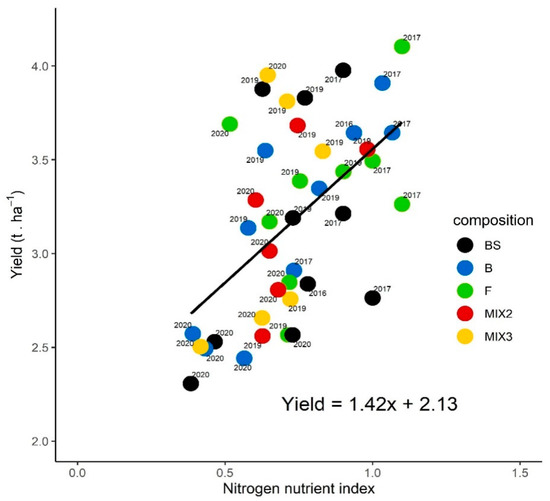
Figure 7.
The causal relationship between manual sunflower yield (t ha−1) and nitrogen nutrition index at sunflower flowering cultivated after bare soil (BS), Brassicaceae (B) sole crops, Fabaceae (F) sole crops, a mixture with one Brassicaceae and one Fabaceae (MIX2), and a mixture with two Brassicaceae and one Fabaceae (MIX3) in 2016, 2017, 2019 and 2020. Each point represents the mean values of the yield and the NNI of the composition of each year and each block. In 2019, the turnip rape did not grow in the mixture with fodder radish and purple vetch.
3.4.3. Disease Severity Index at Maturity and Yields
The relationship between the yield and the DSI is presented in Figure 8, after bare soil, Brassicaceae sole crops pooled, and Fabaceae sole crops, in 2016, 2017 and 2020. Values in 2019 and in mixtures were removed due to a lack of significance of SVW regulation. Regardless of the year or the treatment, yields mean values ranged from 1.89 t ha−1 to 4.76 t ha−1 and DSI severity from 11.66% to 70%. A significant negative Spearman’s correlation (rho = −0.67, p < 0.01) was found between sunflower yields and DSI. Linear regression between yield and DSI severity was also significant (p < 0.01). The yields decreased with DSI increasing, and the DSI tended to be higher on sunflower after bare soils, whereas sunflower following cover crops tended to have lower DSI and higher yields.
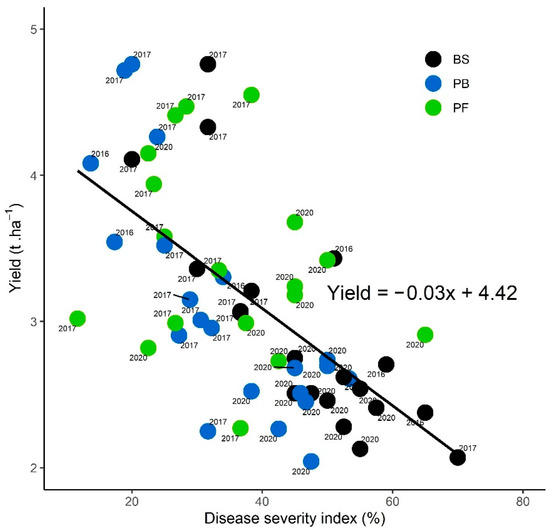
Figure 8.
Causal relationship between manual sunflower yield (t ha−1) and disease severity index (%) at sunflower maturity, for sunflowers cultivated after bare soil (BS), Brassicaceae (B) sole crops pooled per year, and Fabaceae (F) sole crops in 2016, 2017 and 2020. Each point represents the values (per blocks and plots) of the yield and the DSI of the cover crop composition per year. Data in 2019 and a mixture of two or three species in 2020 were removed from this regression because no significant regulation of SVW was observed.
4. Discussion
This study aimed to assess ecosystem services provided by Brassicaceae and Fabaceae cover crops in sole crops or a mixture of two or three species, and biofumigation, on sunflower verticillium wilt and yield, during four field experiments. Overall, no significant effect of cover crops was observed on SMN compared to that after bare soils except for purple vetch in 2019. Mixtures with Brassicaceae and a Fabaceae, tested in 2019 and 2020, did not increase significantly SMN compared to bare soil. Brassicaceae in sole crops reduced significantly the AUDPC on cv.1, in 2016 and 2017, except after brown mustard in 2017. This result was not confirmed on cv. 2, in 2019 and 2020. Sunflower cultivated after fodder radish in sole crop tended to have lower DSI in 2016, 2017 and 2020 than that grown after bare soil, and differences were significant at some monitoring dates. The inconsistent effects of cover crops either in sole crops or mixtures could be due to soil and climate conditions as well as management practices including the previous crops in the rotation and sunflower genotypes that differed among the four experimental years.
4.1. Cover Crop Effects on Soil Mineral Nitrogen Available for Sunflower
Cumulative SMN at 0–90 cm slightly varied among years due to contrasting residual N left after the previous crop in the rotation, and the cover crops that differed in biomass and C:N ratio. Soils cultivated with Fabaceae sole crops tended to have higher SMN than those grown with Brassicaceae sole crops, mixtures, and bare soil. This result agrees with a previous study [69], which highlighted higher SMN in spring in soils cropped with vetch than in bare soils. Vetch’s ability to take up nitrate from the soil and fix atmospheric N, and its low C:N ratio, favours rapid mineralisation of its residues after destruction [13,70]. Soils cultivated with mixtures always had an intermediate level of SMN between those grown with sole cover crops and bare soil as previously reported for Fabaceae and Brassicaceae mixtures [13] as well as legume and non-legume mixtures [58]. Brassicaceae in mixtures with Fabaceae may have taken up as much or more N as in sole crops, through niche complementarity with Fabaceae [13] or reduction in intraspecific competition. The level of N uptake reached by Fabaceae may have increased the N concentration of residues of the entire mixture, as already hypothesised [13], resulting in more rapid decomposition and availability of SMN for sunflower. Results of our study suggest that cover cropping with Brassicaceae, and Fabaceae mixtures may be a promising practice because SMN are at least equivalent to those after sole crop.
4.2. Cover Crops and Biofumigation Effects on Sunflower Verticillium Wilt
SVW occurred in all the experimental fields but the severity of SVW varied among years. Besides the effects of the cover crops and biofumigation, other factors may have affected the severity of the disease including previous crops in the rotation, the density of inoculum of V. dahliae in the soil and the susceptibility of the sunflower cultivar. Indeed, the incidence and severity of SVW are often related to the initial density inoculum of V. dahliae in the soil [71,72], which in turn may have shaped the disease development, in interaction with the crop genotype. Although seed companies classify both cultivars (cv. 1 in 2016 and 2017, and cv. 2 in 2019 and 2020) as “susceptible” to SVW, differences may occur. Moreover, other soil and climatic factor may have influenced the severity of SVW.
Cover crops biomass production could be involved in regulating SVW. Sole crop total dry matter biomass production greater than 0.53 t ha−1 was identified as an effective biofumigation threshold [45]. Below this threshold, biofumigation was predicted to be ineffective against various soil-borne pathogens. In our study, fodder radish produced more biomass each year in sole crops and mixtures than the other Brassicaceae, which could be due to its rapid growth and deep taproot system [73,74]. This result is important for farmers looking for cover crops that produce large quantities of biomass with low variability from year to year [75]. In 2016 and 2017, Brassicaceae cover crop before sunflower cv. 1, and more particularly fodder radish, reduced significantly the DSI (for some cover crops and overall after 80 days after sowing) and the AUDPC (except after brown mustard in 2017). In 2019 and 2020, Brassicaceae cover cropping in sole crops or mixtures before sunflower cv.2 did not significantly reduce the DSI or AUDPC compared to bare soil, except after fodder radish in 2020. Turnip rape reduced significantly DSI and AUDPC in 2016 and 2017 as previously reviewed [29]. The reduction in SVW achieved by fodder radish in our study agrees with previous results [37], which showed a significant reduction in microsclerotia germination or development following exposure to chopped fodder radish under laboratory conditions. Unlike previous reports [36,37,38,39], we did not observe a consistent effect of brown mustard on V. dahliae control, but this result corroborates the results of a previous study [23]. We showed that cover crop mixtures did not seem to regulate SVW, conversely to occasional DSI reduction following sole crops. This may be related to the reduction of Brassicaceae biomass sown at ½ or ⅓ of their densities. The quantities of glucosinolates produced in mixtures were therefore reduced, even though glucosinolates concentrations did not decrease by the ½ or ⅓ of those measured in sole crops, as also observed in a previous study [56].
Besides biomass production, the quantity and type of glucosinolates produced by the cover crop determine the regulation service targeted. The high biomass production of fodder radish produced relatively large quantities of glucosinolates, especially aliphatic profiles (mainly glucoraphasatin) in roots, which agrees with analyses of other studies [56,76]. Brown mustard produced the most aliphatic glucosinolates each year due to its high and well-known sinigrin concentrations [56,77]. Lower quantities of sinigrin produced by fodder radish than by brown mustard despite producing more biomass suggest potential biocidal effects of glucoraphasatin-hydrolysis products on V. dahliae. Nevertheless, glucoraphasatin-hydrolysis products may not be the only glucosinolates involved in regulating V. dahliae, as glucoraphasatin is not present in turnip rape tissues, which also reduced SVW. Regarding the ineffective effect of brown mustard, the sinigrin produced and its hydrolysis products may be insufficient to achieve effective control of V. dahliae and SVW in the field. This agrees with predictions suggesting that supplying at least 4 t ha−1 of brown-mustard-seed meals (containing sinigrin) to reduce V. dahliae effectively in soils with high organic carbon content [77]. In commercial fumigation, controlling V. dahliae requires a large quantity of methyl-isothiocyanates, due mainly to the aggregated cell mass of its microsclerotia, which protects the fungus from biocidal compounds [78].
Our study also showed that despite applying the same Brassicaceae cultivars, the regulation of SVW differed over years. The lack of a significant decrease in SVW after Brassicaceae in 2019 could be attributed to unfavourable weather conditions (2 °C at the destruction and incorporation of cover crops) for optimal hydrolysis of glucosinolates into isothiocyanates and other biocidal compounds. This enzymatic reaction depends on many factors, such as temperature and moisture [29,39,40]. Thus, the quantities of glucosinolates per m² of soil calculated in our study may not be related to the presence or persistence of its products of hydrolysis (e.g., isothiocyanates) in the soil. This hypothesis is supported by studies that highlight the importance of mid to high temperatures (at least above 10 °C) for isothiocyanates production [79,80].
Interestingly, purple vetch in sole crops led to contrasting effects following the year. The AUDPC significantly increased on sunflower in 2019 but was significantly lower in 2020 compared to the bare soil. In 2019, symptoms of Phoma macdonaldii and premature ripening were observed on sunflowers. A previous study showed a strong positive correlation between high nitrogen supply and premature ripening caused by P. macdonaldii [81]. The SMN measured after purple vetch in 2019 was significantly higher compared to bare soil and may have led to an increase of P. macdonaldii development which caused overexpression of V. dahliae symptoms. Conversely, a significant reduction of SVW after purple vetch was measured in 2017 and 2020 and symptoms of P. macdonaldii were scarce. This is, to our knowledge, the first study that reports a reduction of SVW after a Fabaceae cover crop. Similar results were reported on potatoes cultivated after Austrian winter pea [82,83], highlighting a significant reduction of V. dahliae inoculum density and verticillium wilt incidence, compared to fallow controls. This result raises many hypotheses between the SMN after Fabaceae, the N status of the plant and V. dahliae relationship, poorly understood to date [84]. A previous study showed a strong negative correlation between soil nitrates concentrations and V. dahliae inoculum density, after organic and inorganic soil fertilisation [85]. The reduction of V. dahliae was enhanced with livestock manure-based compost, which had the highest N composition. The authors hypothesised a direct toxic effect of ammonia and nitric acid on the membranes of microsclerotia, as also showed before [86]. In addition, the incorporation of green manure could stimulate antagonist microbial communities [82,83]. This is supported by a study that highlighted a negative correlation between the densities of Fusarium equiseti and V. dahliae, after cover crops (including Austrian winter pea) incorporation in the soil [87]. Finally, the reduction of SVW after purple vetch could also be explained by a better nutrition status of the sunflower, leading to a better defence of the plant against some pathogens, as known for several crops pathosystems [88].
4.3. Sunflower Production
Overall, no clear trend of sunflower yield increase was observed after cover crops (sole crops or mixtures), over the four-year field experiment. However, in 2020, a significant increase in sunflower yields was observed following purple vetch in sole crops. An increase in cash crop yields following Fabaceae cover crops had already been observed like for maize after hairy vetch [89]. Moreover, considering the four years of the field experiment, a significant positive relationship was highlighted between yields and NNI (Figure 7). The N supply after Fabaceae could support the positive causal relationship between NNI at sunflower flowering and the yield, as an increase in SMN is favourable to sunflower development and yields [54]. Yields after Brassicaceae sole crops did not differ significantly from those after bare soils, except in 2019, when turnip rape (in sole crops and bispecific mixtures) had significantly lower sunflower yield. Results that show an increase in cash crop yield after a Brassicaceae sole crop are inconsistent in other studies; no effects of Brassicaceae on potato tuber yields, despite a significant reduction in verticillium wilt, were reported [82,83]. Conversely, an increase in potato tuber yield after Brassicaceae, compared to that after bare soils had also been observed [90]. Negative effects of brown mustard on sunflower yield were reported [91], the authors hypothesised N immobilisation due to a large quantity of residues with a high C:N ratio. Overall, our study identified no significant increase in sunflower yields after cover crops in mixtures within a year. Finally, a negative causal relationship was found between yields and DSI with mean values in sole crops in 2016, 2017 and 2020 (Figure 8), This result, to some extent, is similar to previous studies on sunflower, potatoes and strawberry [19,92,93] suggesting that regulation of SVW is an important factor for maintaining sunflower yields.
5. Conclusions
This four-year field study provides some evidence that cover cropping and biofumigation could provide ecosystem services for sunflower, instead of leaving the soils bare during the fallow period. Fodder radish or purple vetch seems to be the most suitable species to provide services (increase in SMN or decrease in SVW). However, the susceptibility of the sunflower cultivar, soil and climate conditions seem to shape largely the potential of cover crops in providing the desired ecosystems services, as shown by the inconsistency of the results obtained over the years. Further studies are needed to fill the current knowledge gap concerning the mechanisms that drive the control of SVW by these cover crops. While, in general, the benefits of cover crops mixtures did not confirm the hypothesis of mutualisation, each sole crop species provided ecosystem services that support the utility of mixing species during the fallow period. To maximise these services in mixtures, future experiments are needed to determine optimal densities to be sown in mixtures. The contrasting weather conditions throughout the four-year experiment, especially at cover crop destruction, highlight the importance of maximising the biomass of the cover crop and performing biofumigation at mild temperatures to foster the expected regulation service and obtain a significant reduction in SVW.
Supplementary Materials
The following supporting information can be downloaded at: https://www.mdpi.com/article/10.3390/agronomy12010120/s1, Table S1: Annual disease severity index (%) progress curves of sunflower verticillium wilt recorded in 2016, 2017, 2019 and 2020. Sunflower cultivar cv. 1 (2016 and 2017) and cv. 2 (2019 and 2020) were cultivated after a bare soil, a cover crop of Brassicaceae in sole crop, Fabaceae in sole crops, or in mixtures. The number of sunflowers recorded was 300 in 2016, 675 in 2017, and 900 in 2019 and 2020. In 2019, the turnip rape didn’t grow in mixture with fodder radish and purple vetch. Numbers in brackets represent standard errors. DAS is for day after sawing.
Author Contributions
Conceptualisation, C.S. and G.D.-G.; methodology, C.S., J.D., B.G. and N.A.K.A.; software, N.A.K.A.; validation, C.S. and G.D.-G.; formal analysis, N.A.K.A.; investigation, C.S., J.D., B.G. and N.A.K.A.; resources, C.S.; data curation, J.D., B.G. and N.A.K.A.; writing—original draft preparation, B.G. and N.A.K.A.; writing—review and editing, C.S., G.D.-G.; visualisation, N.A.K.A.; supervision, C.S., G.D.-G.; project administration, C.S.; funding acquisition, C.S. All authors have read and agreed to the published version of the manuscript.
Funding
The French Ministry of Agriculture (CASDAR project no. C-2013-05) and the Occitanie Region (CLE project No. 13053068). This study was also financially supported by the seed company MAS Seeds and the National Association for Research in Technology (ANRT).
Institutional Review Board Statement
Not applicable.
Informed Consent Statement
Not applicable.
Data Availability Statement
The data presented in this study are available on request from the corresponding author.
Acknowledgments
The authors thank the seed companies Cérience and RAGT for providing cover crop seeds. We thank the technical staff (Didier Raffaillac, Eric Lecloux, Beatrice Quinquiry) and the internship students (Domitille Tissier and Coraline Reynaud) for their effective technical help with the sampling and laboratory analysis at the Auzeville site. We thank Michelle and Michael Corson for reviewing the English language. Finally, we thank the three reviewers for their comments that helped us to improve this work.
Conflicts of Interest
The authors declare no conflict of interest.
Appendix A
Table A1.
Dry matter biomass (t ha−1) of each cover crops species in sole crops and in a mixture of two or three species measured at the destruction of the cover crop, in 2016, 2017, 2019 and 2020. SE represents the standard error. Abbreviations ns, *, **, *** indicate non-significant, or significant differences at p < 0.05, 0.01 or 0.001, respectively. NA indicate non applicable (no data available to test this interaction).
| Year | Cover Crops | Biomass (t ha−1) | SE | Significance of the Comparison between the Biomass of the Cover Crop in Sole Crop and in a Mixture |
|---|---|---|---|---|
| AUZ16 | Brown mustard | 4.17 | 0.29 | / |
| Turnip rape | 4.96 | 0.19 | / | |
| Fodder radish | 6.06 | 0.30 | / | |
| AUZ17 | Brown mustard | 1.38 | 0.19 | / |
| Turnip rape | 1.50 | 0.19 | / | |
| Fodder radish | 2.11 | 0.29 | / | |
| Vetch | 1.88 | 0.31 | ||
| AUZ19 | Brown mustard | 3.58 | 0.13 | / |
| Turnip rape | 3.12 | 0.32 | / | |
| Fodder radish | 4.74 | 0.22 | / | |
| Vetch | 2.14 | 0.27 | / | |
| Brown mustard * Vetch | 2.02/0.96 | 0.12/0.05 | **/** | |
| Turnip rape * Vetch | 0.94/0.98 | 0.38/0.17 | ***/** | |
| Fodder radish * Vetch | 3.83/0.61 | 0.21/0.17 | ns/*** | |
| Brown mustard * Fodder radish * Vetch | 0.76/1.93/0.45 | 0.12/0.28/0.09 | ***/***/*** | |
| Turnip rape * Fodder radish * Vetch | NA/3.72/0.38 | NA/0.77 /0.13 | NA/ns/*** | |
| AUZ20 | Brown mustard | 1.39 | 0.17 | / |
| Turnip rape | 1.60 | 0.10 | / | |
| Fodder radish | 2.17 | 0.09 | / | |
| Vetch | 2.71 | 0.20 | / | |
| Brown mustard * Vetch | 0.80/1.54 | 0.08/0.12 | **/*** | |
| Turnip rape * Vetch | 0.95/1.22 | 0.10/0.18 | **/*** | |
| Fodder radish * Vetch | 1.31/1.37 | 0.19/0.25 | **/*** | |
| Brown mustard * Fodder radish * Vetch | 0.49/0.81/0.82 | 0.06/0.10/0.14 | ***/***/*** | |
| Turnip rape * Fodder radish * Vetch | 0.69/0.53/1.06 | 0.10/0.08/0.21 | ***/***/*** |
Table A2.
C:N ratios of each cover crops species in sole crops and in a mixture of two or three species calculated from C and N contents at the destruction of the cover crop, in 2016, 2017, 2019 and 2020. SE represents the standard error. Abbreviations ns, *, **, indicate non-significant, or significant differences at p < 0.05 or p < 0.01, respectively. NA indicate non applicable (no data available to test this interaction).
| Year | Cover Crops | C:N Ratio | SE | Significance of the Comparison of the C:N Ratios between Sole Crop and a Mixture |
|---|---|---|---|---|
| 2016 | Brown mustard | 14.64 | 0.88 | / |
| Turnip rape | 14.43 | 1.11 | / | |
| Fodder radish | 13.47 | 0.97 | / | |
| 2017 | Brown mustard | 19.61 | 1.52 | / |
| Turnip rape | 19.83 | 0.51 | / | |
| Fodder radish | 20.89 | 1.35 | / | |
| Vetch | 10.79 | 0.26 | / | |
| 2019 | Brown mustard | 28.31 | 1.4 | / |
| Turnip rape | 24.43 | 1.26 | / | |
| Fodder radish | 26.8 | 0.43 | / | |
| Vetch | 12.9 | 0.69 | / | |
| Brown mustard * Vetch | 16.25/12.13 | 2.26/0.19 | */ns | |
| Turnip rape * Vetch | 16.34/12.09 | 0.48/0.06 | */ns | |
| Fodder radish * Vetch | 17.83/11.98 | 1.97/0.11 | */ns | |
| Brown mustard * Fodder radish * Vetch | 18.54/19.75/12.58 | 3.30/2.96/0.25 | **/ns/ns | |
| Turnip rape * Fodder radish * Vetch | NA/21.14/11.8 | NA/1.98/0.26 | NA/ns/ns | |
| 2020 | Brown mustard | 22.62 | 0.7 | / |
| Turnip rape | 24.35 | 0.83 | / | |
| Fodder radish | 24.14 | 0.42 | / | |
| Vetch | 13.58 | 0.25 | / | |
| Brown mustard * Vetch | 19.78/13.89 | 0.47/0.19 | **/ns | |
| Turnip rape * Vetch | 21.78/14.15 | 0.55/0.24 | */ns | |
| Fodder radish * Vetch | 20.35/14.47 | 0.76/0.17 | **/ns | |
| Brown mustard * Fodder radish * Vetch | 22.81/22.3/14.24 | 0.54/0.51/0.27 | ns/ns/ns | |
| Turnip rape * Fodder radish * Vetch | 21.70/20.81/14.09 | 0.45/0.63/0.17 | **/**/ns |
Table A3.
Area under disease progression curve (AUDPC) of sunflower verticillium wilt severity, calculated from the appearance of symptoms up to 80–85 days after sowing, after bare soil, cover crops in sole crop and in a mixture of two or three species in 2016, 2017, 2019 and 2020. SE represents the standard error. Abbreviations ns, *, **, indicate non-significant, or significant differences at p < 0.05, 0.01, respectively between the bare soil and the cover crop.
| Year | Treatment | AUDPC | SE | Significance of the Comparison of the AUDPC of the Cover Crop to That of the Bare Soil |
|---|---|---|---|---|
| 2016 | Bare soil | 91.74 | 40.62 | / |
| Brown mustard | 30.72 | 32.27 | ** | |
| Turnip rape | 24.78 | 29.66 | ** | |
| Fodder radish | 25.07 | 33.84 | ** | |
| 2017 | Bare soil | 44.72 | 32.11 | / |
| Brown mustard | 39.82 | 30.21 | ns | |
| Turnip rape | 31.72 | 29.24 | * | |
| Fodder radish | 25.62 | 26.39 | ** | |
| Vetch | 32.77 | 26.24 | ns | |
| 2019 | Bare soil | 30.31 | 21.24 | / |
| Brown mustard | 43.12 | 26.60 | ** | |
| Turnip rape | 28.00 | 20.41 | ns | |
| Fodder radish | 35.08 | 22.19 | ns | |
| Vetch | 44.06 | 29.26 | ** | |
| Brown mustard * Vetch | 40.78 | 27.42 | ns | |
| Turnip rape * Vetch | 39.73 | 22.96 | ns | |
| Fodder radish * Vetch | 34.46 | 22.96 | ns | |
| Brown mustard * Fodder radish * Vetch | 29.53 | 17.28 | ns | |
| Turnip rape * Fodder radish * Vetch | 34.18 | 23.13 | ns | |
| 2020 | Bare soil | 73.38 | 30.89 | / |
| Brown mustard | 69.18 | 26.13 | ns | |
| Turnip rape | 67.11 | 29.77 | ns | |
| Fodder radish | 60.05 | 33.75 | ns | |
| Vetch | 53.67 | 38.64 | ** | |
| Brown mustard * Vetch | 66.02 | 30.91 | ns | |
| Turnip rape * Vetch | 67.65 | 25.49 | ns | |
| Fodder radish * Vetch | 62.77 | 33.18 | ns | |
| Brown mustard * Fodder radish * Vetch | 75.31 | 26.40 | ns | |
| Turnip rape * Fodder radish * Vetch | 65.43 | 27.62 | ns |
References
- FAO. Available online: https://www.fao.org/3/cb4479en/cb4479en.pdf (accessed on 9 November 2021).
- Le Clef, E.; Kemper, T. Sunflower seed preparation and oil extraction. In Sunflower Chemistry, Production, Processing, and Utilization, 1st ed.; Martínez-Force, E., Turgut Dunford, N., Salas, J.J., Eds.; Elsevier: Amsterdam, The Netherlands, 2015; pp. 187–226. [Google Scholar] [CrossRef]
- Debaeke, P.; Bedoussac, L.; Bonnet, C.; Bret-Mestries, E.; Seassau, C.; Gavaland, A.; Raffaillac, D.; Tribouillois, H.; Véricel, G.; Justes, E. Sunflower crop: Environmental-friendly and agroecological. OCL Oilseeds Fats Crops Lipids 2017, 24, D304. [Google Scholar] [CrossRef] [Green Version]
- Champolivier, L.; Debaeke, P.; Merrien, A. Pourquoi irriguer le tournesol, une culture réputée tolérante à la sécheresse? Innov. Agron. 2011, 14, 151–164. [Google Scholar]
- Velasco, L.; Fernández-Martínez, J.M.; Fernández, J. Sunflower production in the European Union. In Sunflower Chemistry, Production, Processing, and Utilization, 1st ed.; Martínez-Force, E., Turgut Dunford, N., Salas, J.J., Eds.; Elsevier: Amsterdam, The Netherlands, 2015; pp. 555–573. [Google Scholar] [CrossRef]
- Lecomte, V.; Nolot, J.M. Place du tournesol dans le système de culture. Innov. Agron. 2011, 14, 59–76. [Google Scholar]
- Jouffret, P.; Labalette, F.; Thibierge, J. Atouts et besoins en innovations du tournesol pour une agriculture durable. Innov. Agron. 2011, 14, 1–17. [Google Scholar]
- Alberio, C.; Izquierdo, N.G.; Aguirrezábal, L.A.N. Sunflower Crop Physiology and Agronomy. In Sunflower Chemistry, Production, Processing, and Utilization, 1st ed.; Martínez-Force, E., Turgut Dunford, N., Salas, J.J., Eds.; Elsevier: Amsterdam, The Netherlands, 2015; pp. 53–91. [Google Scholar] [CrossRef]
- Debaeke, P.; Casadebaig, P.; Flenet, F.; Langlade, N. Sunflower crop and climate change: Vulnerability, adaptation, and mitigation potential from case-studies in Europe. OCL Oilseeds Fats Crops Lipids 2017, 24, D102. [Google Scholar] [CrossRef] [Green Version]
- Harris, H.; McWilliam, J.; Mason, W. Influence of temperature on oil content and composition of sunflower seed. Aust. J. Agric. Res. 1978, 29, 1203–1212. [Google Scholar] [CrossRef]
- Franceagrimer. Available online: https://www.franceagrimer.fr (accessed on 15 June 2021).
- Seassau, C. Etiologie du Syndrome de Dessèchement Précoce du Tournesol: Implication de Phoma Macdonaldii et Interaction Avec la Conduite de Culture. Ph.D. Dissertation, Université Fédérale de Toulouse, Toulouse, France, 2010. [Google Scholar]
- Couëdel, A.; Alletto, L.; Tribouillois, H.; Justes, E. Cover crop crucifer-legume mixtures provide effective nitrate catch crop and nitrogen green manure ecosystem services. Agric. Ecosyst. Environ. 2018, 254, 50–59. [Google Scholar] [CrossRef]
- Poisson-Bammé, B.; Pérès, A. Survie du phoma du tournesol (Leptosphaeria lindquistii) sur les résidus de récolte. In Proceedings of the 6th International Conference on Plant Diseases, AFPP, Tours, France, 6–8 December 2000; pp. 331–338. [Google Scholar]
- Mesteries, E. Lutter contre le verticillium grâce aux variétés. Perspect. Agric. 2013, 406, 24–28. [Google Scholar]
- Uppal, A.; El Hadrami, A.; Adam, L.; Tenuta, M.; Daayf, F. Biological control of potato Verticillium wilt under controlled and field conditions using selected bacterial antagonists and plant extracts. Biol. Control 2008, 44, 90–100. [Google Scholar] [CrossRef]
- Rowe, R.C.; Powelson, M.L. Potato Early Dying: Management Challenges in a Changing Production Environment. Plant Dis. 2002, 86, 1184–1193. [Google Scholar] [CrossRef] [Green Version]
- Soesanto, L. Ecology and Biological Control of Verticillium dahliae. Ph.D. Dissertation, Wageningen University, Wageningen, The Netherlands, 2000. [Google Scholar]
- Mestries, E.; Lecomte, V. Tournesol et verticillium: État des lieux et moyens de lutte dans le Sud-Ouest. In Proceedings of the Réunion Technique Régionale CETIOM, Ondes, France, 7 December 2012; pp. 1–12. [Google Scholar]
- Wilhem, S. Longevity of the Verticillium wilt fungus in the laboratory and field. Phytopathology 1995, 45, 180–181. [Google Scholar]
- Lloyd, M.G.; McRoberts, N.; Gordon, T.R. Cryptic Infection and Systemic Colonization of Leguminous Crops by Verticillium dahliae, the Cause of Verticillium Wilt. Plant Dis. 2019, 103, 3166–3171. [Google Scholar] [CrossRef]
- Pegg, G.F.; Brady, B.L. Verticillium Wilts, 1st ed.; CABI: Wallingford, UK, 2002; 552p. [Google Scholar] [CrossRef]
- Hartz, T.; Johnstone, P.; Miyao, E.; Davis, R. Mustard Cover Crops Are Ineffective in Suppressing Soilborne Disease or Improving Processing Tomato Yield. HortScience 2005, 40, 2016–2019. [Google Scholar] [CrossRef] [Green Version]
- Larkin, R.P.; Honeycutt, C.W.; Olanya, O.M. Management of Verticillium Wilt of Potato with Disease-Suppressive Green Manures and as Affected by Previous Cropping History. Plant Dis. 2011, 95, 568–576. [Google Scholar] [CrossRef] [Green Version]
- Woolliams, G.E. Host range and symptomatology of Verticillium dahliae in economic, weed, and native plants in interior British Columbia. Can. J. Plant Sci. 1966, 46, 661–669. [Google Scholar] [CrossRef]
- Duniway, J.M. Status of Chemical Alternatives to Methyl Bromide for Pre-Plant Fumigation of Soil. Phytopathology 2002, 92, 1337–1343. [Google Scholar] [CrossRef] [PubMed] [Green Version]
- Villarino, M.; Larena, I.; Melgarejo, P.; De Cal, A. Effect of chemical alternatives to methyl bro-mide on soil-borne disease inci-dence and fungal populations in Spanish strawberry nurseries: A long-term study. Pest Manag. Sci. 2021, 77, 766–774. [Google Scholar] [CrossRef] [PubMed]
- Debaeke, P.; Bret-Mestries, E.; Aubertot, J.N.; Casadebaig, P.; Champolivier, L.; Dejoux, J.F.; Seassau, C. Sunflower agronomy: 10 years of research in partnership within the “Sunflower” Technological Joint Unit (UMT) in Toulouse. OCL Oilseeds Fats Crops Lipids 2020, 27, 14. [Google Scholar] [CrossRef] [Green Version]
- Ait Kaci Ahmed, N.; Dechamp-Guillaume, G.; Seassau, C. Biofumigation to protect oilseed crops: Focus on management of soilborne fungi of sunflower. OCL Oilseeds Fats Crops Lipids 2020, 27, 59. [Google Scholar] [CrossRef]
- Kirkegaard, J.A.; Gardner, P.A.; Desmarchelier, J.M.; Angus, J.F. Biofumigation: Using Brassica species to control pests and dis-eases in horticulture and agriculture. In Proceedings of the 9th Australian Research Assembly on Brassicas, Wagga Wagga, Australia, 5–7 October 1993; pp. 1–77. [Google Scholar]
- Kirkegaard, J.A.; Matthiessen, J.N. Developing and refining the biofumigation concept. Agroindustria 2004, 3, 233–239. [Google Scholar]
- Fenwick, G.R.; Heaney, R.K.; Mullin, W.J.; VanEtten, C.H. Glucosinolates and their breakdown products in food and food plants. Crit. Rev. Food Sci. Nutr. 1983, 18, 123–201. [Google Scholar] [CrossRef]
- Brown, P.D.; Morra, M.J. Control of Soil-Borne Plant Pests Using Glucosinolate-Containing Plants. In Advances in Agronomy; Elsevier: Amsterdam, The Netherlands, 1997; Volume 61, pp. 167–231. [Google Scholar]
- van Dam, N.M.; Tytgat, T.O.G.; Kirkegaard, J.A. Root and shoot glucosinolates: A comparison of their diversity, function and interactions in natural and managed ecosystems. Phytochem. Rev. 2009, 8, 171–186. [Google Scholar] [CrossRef] [Green Version]
- Mithen, R. Glucosinolates—Biochemistry, genetics and biological activity. Plant Growth Regul. 2001, 34, 91–103. [Google Scholar] [CrossRef]
- Olivier, C.; Vaughn, S.F.; Mizubuti, E.S.G.; Loria, R. Variation in Allyl Isothiocyanate Production Within Brassica Species and Correlation with Fungicidal Activity. J. Chem. Ecol. 1999, 25, 2687–2701. [Google Scholar] [CrossRef]
- Neubauer, C.; Heitmann, B.L.; Müller, C. Biofumigation potential of Brassicaceae cultivars to Verticillium dahliae. Eur. J. Plant Pathol. 2014, 140, 341–352. [Google Scholar] [CrossRef]
- Seassau, C.; Desserr, D.; Desplanques, J.; Mestries, E.; Dechamp-Guillaume, G.; Alletto, L. Control of Verticillium dahliae causing sunflower wilt using Brassica cover crops. In Proceedings of the 19th International Sunflower Conference, Edirne, Turkey, 29 May–3 June 2016; p. 1230. [Google Scholar]
- Michel, V.V. Ten years of biofumigation research in Switzerland. In Proceedings of the 5th International Symposium of Biofumigation, Newport, UK, 9 September 2014; Volume 126, pp. 1–5. [Google Scholar]
- Matthiessen, J.N.; Kirkegaard, J. Biofumigation and Enhanced Biodegradation: Opportunity and Challenge in Soilborne Pest and Disease Management. Crit. Rev. Plant Sci. 2006, 25, 235–265. [Google Scholar] [CrossRef]
- Subbarao, K.V.; Hubbard, J.C.; Koike, S.T. Evaluation of Broccoli Residue Incorporation into Field Soil for Verticillium Wilt Control in Cauliflower. Plant Dis. 1999, 83, 124–129. [Google Scholar] [CrossRef] [PubMed] [Green Version]
- Matthiessen, J.N.; Warton, B.; Shackleton, M.A. The importance of plant maceration and water addition in achieving high Bras-sica-derived isothiocyanate levels in soil. Agroindustria 2004, 3, 277–281. [Google Scholar]
- Gimsing, A.; Kirkegaard, J. Glucosinolate and isothiocyanate concentration in soil following incorporation of Brassica biofumigants. Soil Biol. Biochem. 2006, 38, 2255–2264. [Google Scholar] [CrossRef]
- Michel, V.V. Biofumigation – principe et application. Rev. Suisse Vitic. Arboric. Hortic. 2008, 40, 95–99. [Google Scholar]
- Morris, E.K.; Fletcher, R.; Veresoglou, S. Effective methods of biofumigation: A meta-analysis. Plant Soil 2020, 446, 379–392. [Google Scholar] [CrossRef]
- Booth, E.J.; Walker, K.C.; Griffiths, D.W. A time-course study of the effect of sulphur on glucosinolates in oilseed rape (Brassica napus) from the vegetative stage to maturity. J. Sci. Food Agric. 1991, 56, 479–493. [Google Scholar] [CrossRef]
- Sarwar, M.; Kirkegaard, J.A. Biofumigation potential of brassicas II: Effect of environment and ontogeny on glucosinolate production and implications for screening. Plant Soil 1998, 201, 91–101. [Google Scholar] [CrossRef]
- Motisi, N.; Doré, T.; Lucas, P.; Montfort, F. Dealing with the variability in biofumigation efficacy through an epidemiological framework. Soil Biol. Biochem. 2010, 42, 2044–2057. [Google Scholar] [CrossRef]
- Justes, E.; Mary, B.; Nicolardot, B. Quantifying and modelling C and N mineralization kinetics of catch crop residues in soil: Parameterization of the residue decomposition module of STICS model for mature and non mature residues. Plant Soil 2009, 325, 171–185. [Google Scholar] [CrossRef]
- Alonso-Ayuso, M.; Gabriel, J.L.; Quemada, M. The Kill Date as a Management Tool for Cover Cropping Success. PLoS ONE 2014, 9, e109587. [Google Scholar] [CrossRef] [PubMed]
- Phillips, D.A. Efficiency of symbiotic nitrogen fixation in legumes. Annu. Rev. Plant Physiol. 1980, 31, 29–49. [Google Scholar] [CrossRef]
- Peoples, M.B.; Brockwell, J.; Herridge, D.F.; Rochester, I.J.; Alves, B.J.R.; Urquiaga, S.; Boddey, R.M.; Dakora, F.D.; Bhattarai, S.; Maskey, S.L.; et al. The contributions of nitrogen-fixing crop legumes to the productivity of agricultural systems. Symbiosis 2009, 48, 1–17. [Google Scholar] [CrossRef]
- Tonitto, C.; David, M.; Drinkwater, L. Replacing bare fallows with cover crops in fertilizer-intensive cropping systems: A meta-analysis of crop yield and N dynamics. Agric. Ecosyst. Environ. 2006, 112, 58–72. [Google Scholar] [CrossRef]
- Massignam, A.; Chapman, S.; Hammer, G.; Fukai, S. Physiological determinants of maize and sunflower grain yield as affected by nitrogen supply. Field Crops Res. 2009, 113, 256–267. [Google Scholar] [CrossRef]
- Couëdel, A.; Kirkegaard, J.; Alletto, L.; Justes, É. Crucifer-legume cover crop mixtures for biocontrol: Toward a new multi-service paradigm. In Advances in Agronomy; Elsevier: Amsterdam, The Netherlands, 2019; Volume 157, pp. 55–139. [Google Scholar]
- Couëdel, A.; Alletto, L.; Kirkegaard, J.; Justes, É. Crucifer glucosinolate production in legume-crucifer cover crop mixtures. Eur. J. Agron. 2018, 96, 22–33. [Google Scholar] [CrossRef]
- Rosner, K.; Bodner, G.; Hage-Ahmed, K.; Steinkellner, S. Long-term Soil Tillage and Cover Cropping Affected Arbuscular Mycorrhizal Fungi, Nutrient Concentrations, and Yield in Sunflower. Agron. J. 2018, 110, 2664–2672. [Google Scholar] [CrossRef]
- Tribouillois, H.; Cohan, J.-P.; Justes, E. Cover crop mixtures including legume produce ecosystem services of nitrate capture and green manuring: Assessment combining experimentation and modelling. Plant Soil 2016, 401, 347–364. [Google Scholar] [CrossRef]
- APC; INRAE. Crop Phenotyping and AgroEcology Experimental Facility; INRAE: Castanet-Tolosan, France, 2018. [Google Scholar] [CrossRef]
- Tribouillois, H.; Dürr, C.; Demilly, D.; Wagner, M.-H.; Justes, E. Determination of Germination Response to Temperature and Water Potential for a Wide Range of Cover Crop Species and Related Functional Groups. PLoS ONE 2016, 11, e0161185. [Google Scholar] [CrossRef]
- de Graaf, R.M.; Krosse, S.; Swolfs, A.E.; Brinke, E.T.; Prill, N.; Leimu, R.; van Galen, P.M.; Wang, Y.; Aarts, M.G.; van Dam, N.M. Isolation and identification of 4-α-rhamnosyloxy benzyl glucosinolate in Noccaea caerulescens showing intraspecific variation. Phytochemistry 2015, 110, 166–171. [Google Scholar] [CrossRef] [Green Version]
- Willey, R.W. Intercropping—Its importance and research need: Part 1. Competition and yield advantages. Field Crop Abstr. 1979, 32, 1–10. [Google Scholar]
- Bedoussac, L.; Justes, E. A comparison of commonly used indices for evaluating species interactions and intercrop efficiency: Application to durum wheat–winter pea intercrops. Field Crops Res. 2011, 124, 25–36. [Google Scholar] [CrossRef]
- Lemaire, G.; Gastal, F. N uptake and distribution in plant canopies. In Diagnosis of the Nitrogen Status in Crops, 1st ed.; Lemaire, G., Ed.; Springer: Berlin/Heidelberg, Germany, 1997; pp. 3–43. [Google Scholar] [CrossRef]
- Debaeke, P.; Raffaillac, D. Normalized SPAD index and Nitrogen Nutrition Index (NNI): Two indicators of plant N status for sunflower crop. In Proceedings of the 9th ESA Congress, Varsovie, Poland, 4–7 September 2006; pp. 83–84. [Google Scholar]
- Li, X.; Zhang, Y.; Ding, C.; Xu, W.; Wang, X. Temporal patterns of cotton Fusarium and Verticillium wilt in Jiangsu coastal areas of China. Sci. Rep. 2017, 7, 12581. [Google Scholar] [CrossRef] [Green Version]
- Campbell, C.L.; Madden, L.V. Introduction to Plant Disease Epidemiology; John Wiley & Sons: New York, NY, USA, 1990. [Google Scholar]
- Ahrens, W.H.; Cox, D.J.; Budhwar, G. Use of the Arcsine and Square Root Transformations for Subjectively Determined Percentage Data. Weed Sci. 1990, 38, 452–458. [Google Scholar] [CrossRef]
- Zhou, Y.; Roosendaal, L.; Van Eerd, L.L. Increased nitrogen retention by cover crops: Implications of planting date on soil and plant nitrogen dynamics. Renew. Agric. Food Syst. 2020, 35, 720–729. [Google Scholar] [CrossRef]
- Sievers, T.; Cook, R.L. Aboveground and Root Decomposition of Cereal Rye and Hairy Vetch Cover Crops. Soil Sci. Soc. Am. J. 2018, 82, 147–155. [Google Scholar] [CrossRef]
- Paplomatas, E.J.; Bassett, D.M.; Broome, J.C.; DeVay, J.E. Incidence of Verticillium wilt and yield losses of cotton cultivars (Gossypium hirsutum) based on soil inoculum density of Verticillium dahliae. Phytopathology 1992, 82, 1417–1420. [Google Scholar] [CrossRef]
- Harris, D.C.; Yang, J.R. The relationship between the amount of Verticillium dahliae in soil and the incidence of strawberry wilt as a basis for disease risk prediction. Plant Pathol. 1996, 45, 106–114. [Google Scholar] [CrossRef]
- Thorup-Kristensen, K. Are differences in root growth of nitrogen catch crops important for their ability to reduce soil nitrate-N content, and how can this be measured? Plant Soil 2001, 230, 185–195. [Google Scholar] [CrossRef]
- Thorup-Kristensen, K.; Magid, J.; Jensen, L.S. Catch crops and green manures as biological tools in nitrogen management in temperate zones. In Advances in Agronomy; Elsevier: Amsterdam, The Netherlands, 2003; pp. 227–302. [Google Scholar]
- Elhakeem, A.; Bastiaans, L.; Houben, S.; Couwenberg, T.; Makowski, D.; van der Werf, W. Do cover crop mixtures give higher and more stable yields than pure stands? Field Crops Res. 2021, 270, 108217. [Google Scholar] [CrossRef]
- Castro-Torres, I.G.; De la O Arciniega, M.; Gallegos-Estudillo, J.; Naranjo-Rodríguez, E.B.; Domínguez-Ortíz, M. Ángel Raphanus sativus L. var niger as a source of Phytochemicals for the Prevention of Cholesterol Gallstones. Phytother. Res. 2014, 28, 167–171. [Google Scholar] [CrossRef] [PubMed]
- Neubauer, C.; Hüntemann, K.; Heitmann, B.; Müller, C. Suppression of Verticillium dahliae by glucosinolate-containing seed meal amendments. Eur. J. Plant Pathol. 2015, 142, 239–249. [Google Scholar] [CrossRef]
- Klose, S.; Ajwa, H.A.; Browne, G.T.; Subbarao, K.; Martin, F.N.; Fennimore, S.A.; Westerdahl, B.B. Dose Response of Weed Seeds, Plant-Parasitic Nematodes, and Pathogens to Twelve Rates of Metam Sodium in a California Soil. Plant Dis. 2008, 92, 1537–1546. [Google Scholar] [CrossRef] [PubMed] [Green Version]
- Matthiessen, J.N.; A Shackleton, M. Biofumigation: Environmental impacts on the biological activity of diverse pure and plant-derived isothiocyanates. Pest Manag. Sci. 2005, 61, 1043–1051. [Google Scholar] [CrossRef]
- Gimsing, A.L.; Kirkegaard, J. Glucosinolates and biofumigation: Fate of glucosinolates and their hydrolysis products in soil. Phytochem. Rev. 2009, 8, 299–310. [Google Scholar] [CrossRef]
- Seassau, C.; Dechamp-Guillaume, G.; Mestries, E.; Debaeke, P. Nitrogen and water management can limit premature ripening of sunflower induced by Phoma macdonaldii. Field Crops Res. 2010, 115, 99–106. [Google Scholar] [CrossRef]
- Ochiai, N.; Powelson, M.L.; Dick, R.P.; Crowe, F.J. Effects of Green Manure Type and Amendment Rate on Verticillium Wilt Severity and Yield of Russet Burbank Potato. Plant Dis. 2007, 91, 400–406. [Google Scholar] [CrossRef]
- Davis, J.R.; Huisman, O.C.; Westermann, D.T.; Hafez, S.L.; Everson, D.O.; Sorensen, L.H.; Schneider, A.T. Effects of green manures on Verticillium wilt of potato. Phytopathology 1996, 86, 444–453. [Google Scholar] [CrossRef]
- Wheeler, T.A.; Bordovsky, J.P.; Keeling, J.W.; Mullinix, J.B.G. Effects of Crop Rotation, Cultivar, and Irrigation and Nitrogen Rate on Verticillium Wilt in Cotton. Plant Dis. 2012, 96, 985–989. [Google Scholar] [CrossRef] [PubMed] [Green Version]
- Cocozza, C.; Abdeldaym, E.A.; Brunetti, G.; Nigro, F.; Traversa, A. Synergistic effect of organic and inorganic fertilization on the soil inoculum density of the soilborne pathogens Verticillium dahliae and Phytophthora spp. under open-field conditions. Chem. Biol. Technol. Agric. 2021, 8, 24. [Google Scholar] [CrossRef]
- Tenuta, M.; Lazarovits, G. Ammonia and Nitrous Acid from Nitrogenous Amendments Kill the Microsclerotia of Verticillium dahliae. Phytopathology 2002, 92, 255–264. [Google Scholar] [CrossRef] [Green Version]
- Davis, J.R.; Huisman, O.C.; Everson, D.O.; Nolte, P.; Sorensen, L.H.; Schneider, A.T. Ecological Relationships of Verticillium Wilt Suppression of Potato by Green Manures. Am. J. Potato Res. 2010, 87, 315–326. [Google Scholar] [CrossRef]
- Huber, D.; Römheld, V.; Weinmann, M. Relationship between Nutrition, Plant Diseases and Pests. In Marschner’s Mineral Nutrition of Higher Plants, 3rd ed.; Marschner, P., Ed.; Elsevier Inc.: Amsterdam, The Netherlands, 2012; pp. 283–298. [Google Scholar] [CrossRef]
- Parr, M.; Grossman, J.M.; Reberg-Horton, S.C.; Brinton, C.; Crozier, C. Nitrogen Delivery from Legume Cover Crops in No-Till Organic Corn Production. Agron. J. 2011, 103, 1578–1590. [Google Scholar] [CrossRef]
- Larkin, R.P.; Griffin, T.S.; Honeycutt, C.W. Rotation and Cover Crop Effects on Soilborne Potato Diseases, Tuber Yield, and Soil Microbial Communities. Plant Dis. 2010, 94, 1491–1502. [Google Scholar] [CrossRef] [PubMed] [Green Version]
- Adeux, G.; Cordeau, S.; Antichi, D.; Carlesi, S.; Mazzoncini, M.; Munier-Jolain, N.; Bàrberi, P. Cover crops promote crop productivity but do not enhance weed management in tillage-based cropping systems. Eur. J. Agron. 2020, 123, 126221. [Google Scholar] [CrossRef]
- Davis, J.R.; Huisman, O.C.; Everson, D.O.; Schneider, A.T. Verticillium wilt of potato: A model of key factors related to disease severity and tuber yield in Southeastern Idaho. Am. J. Potato Res. 2001, 78, 291–300. [Google Scholar] [CrossRef]
- Zavatta, M.; Muramoto, J.; Milazzo, E.; Koike, S.; Klonsky, K.; Goodhue, R.; Shennan, C. Integrating broccoli rotation, mustard meal, and anaerobic soil disinfestation to manage verticillium wilt in strawberry. Crop Prot. 2021, 146, 105659. [Google Scholar] [CrossRef]
Publisher’s Note: MDPI stays neutral with regard to jurisdictional claims in published maps and institutional affiliations. |
© 2022 by the authors. Licensee MDPI, Basel, Switzerland. This article is an open access article distributed under the terms and conditions of the Creative Commons Attribution (CC BY) license (https://creativecommons.org/licenses/by/4.0/).