Suitability of Image Analysis in Evaluating Air and Water Permeability of Soil


Abstract
:
1. Introduction
2. Materials and Methods
2.1. Material
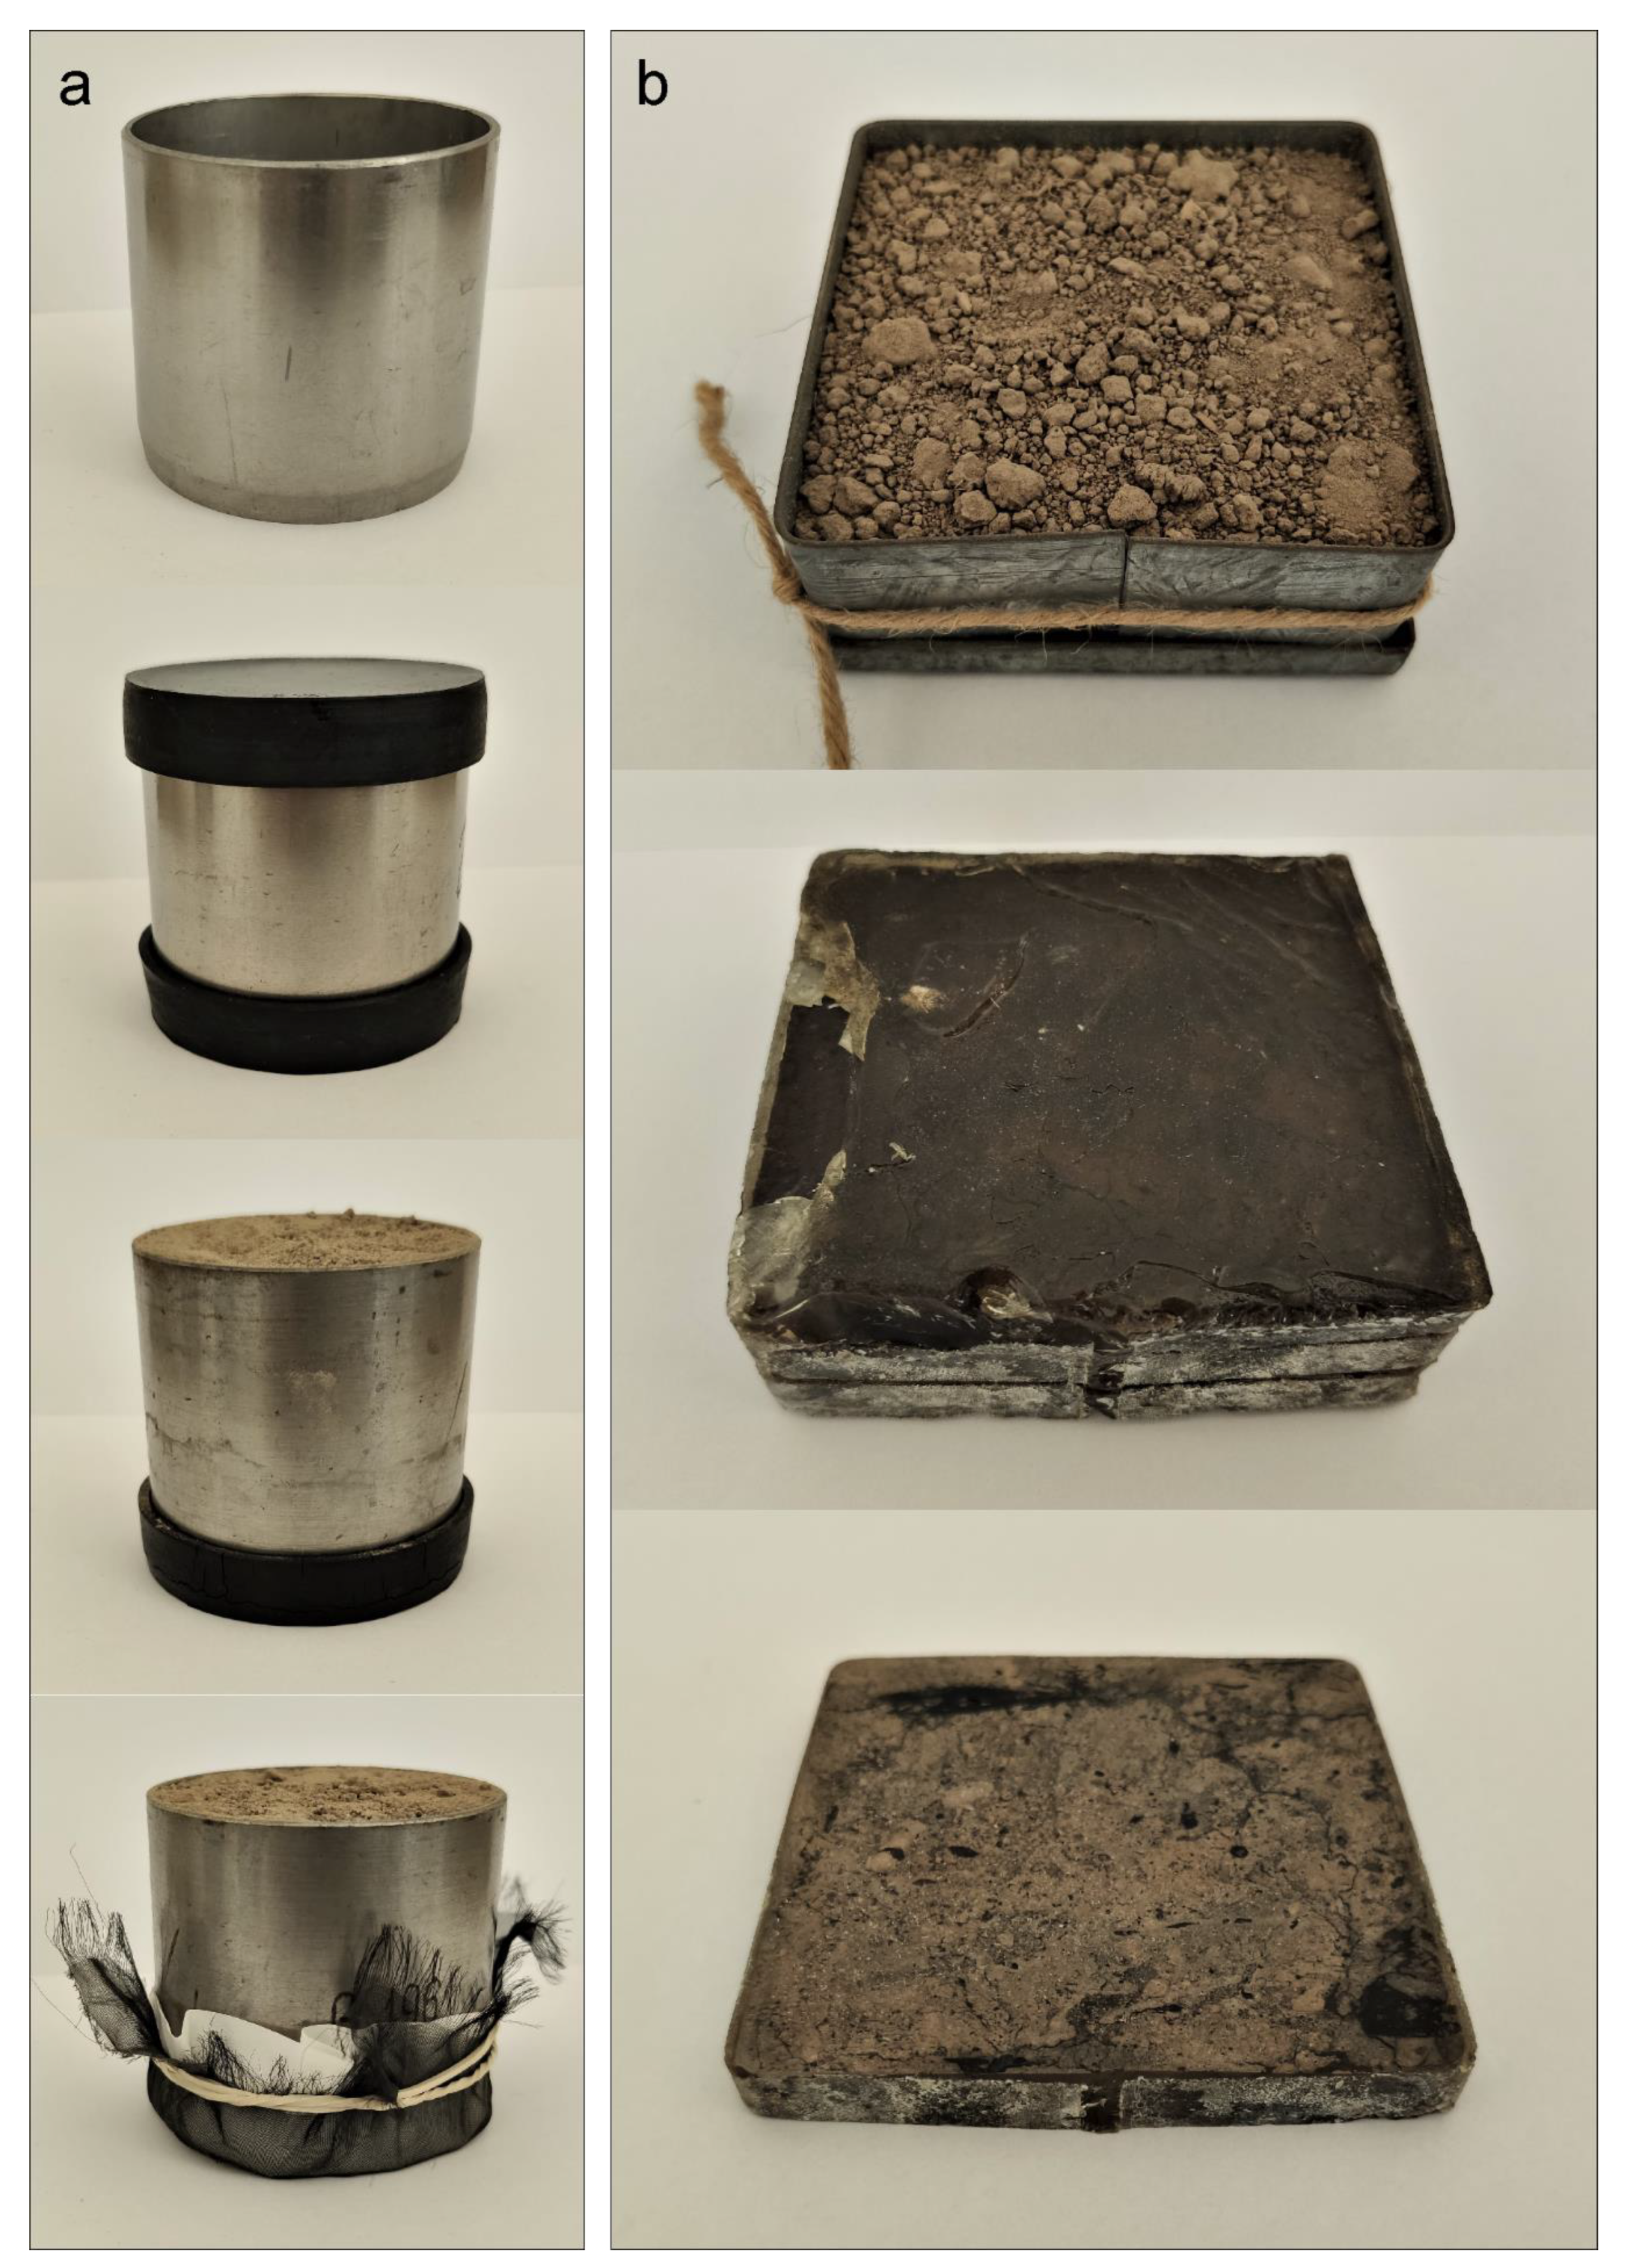
2.2. Laboratory Tests
2.3. Preliminary Image Analysis
2.4. Extended Image Analysis
2.5. Statistical Analyses Laboratory Tests
3. Results
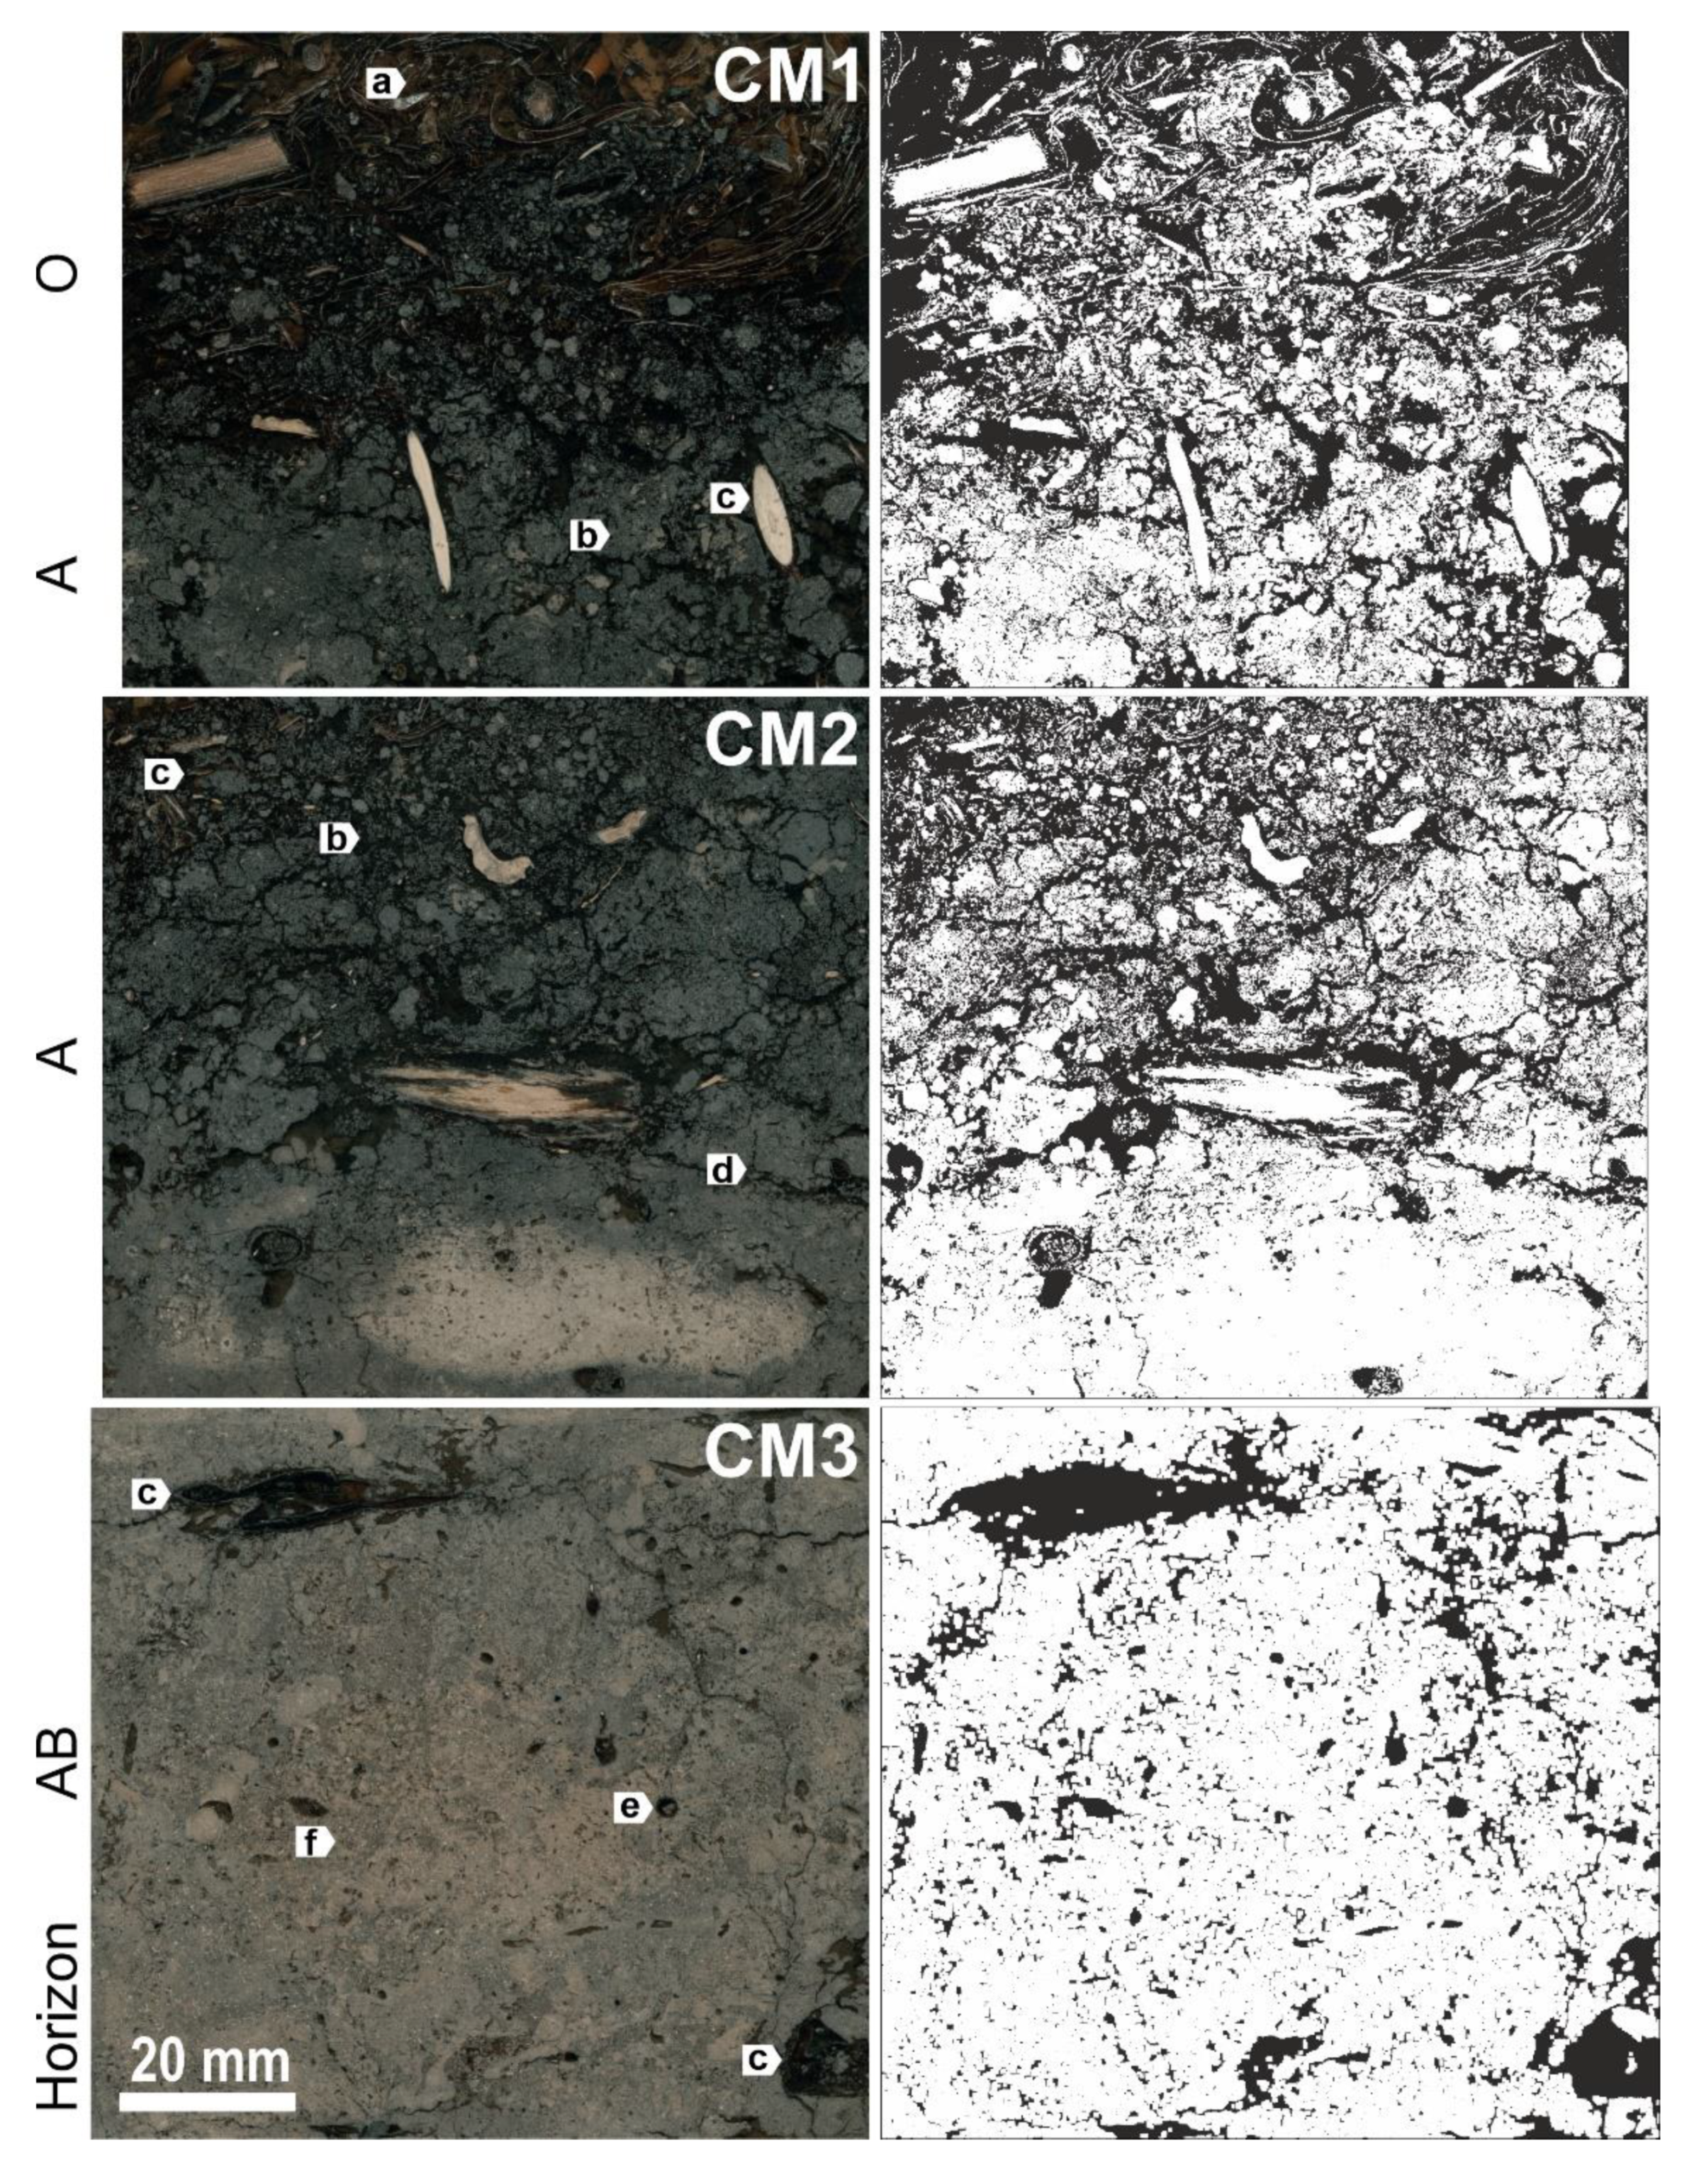
3.1. Macrostructure
3.2. Chemical and Physical Properties
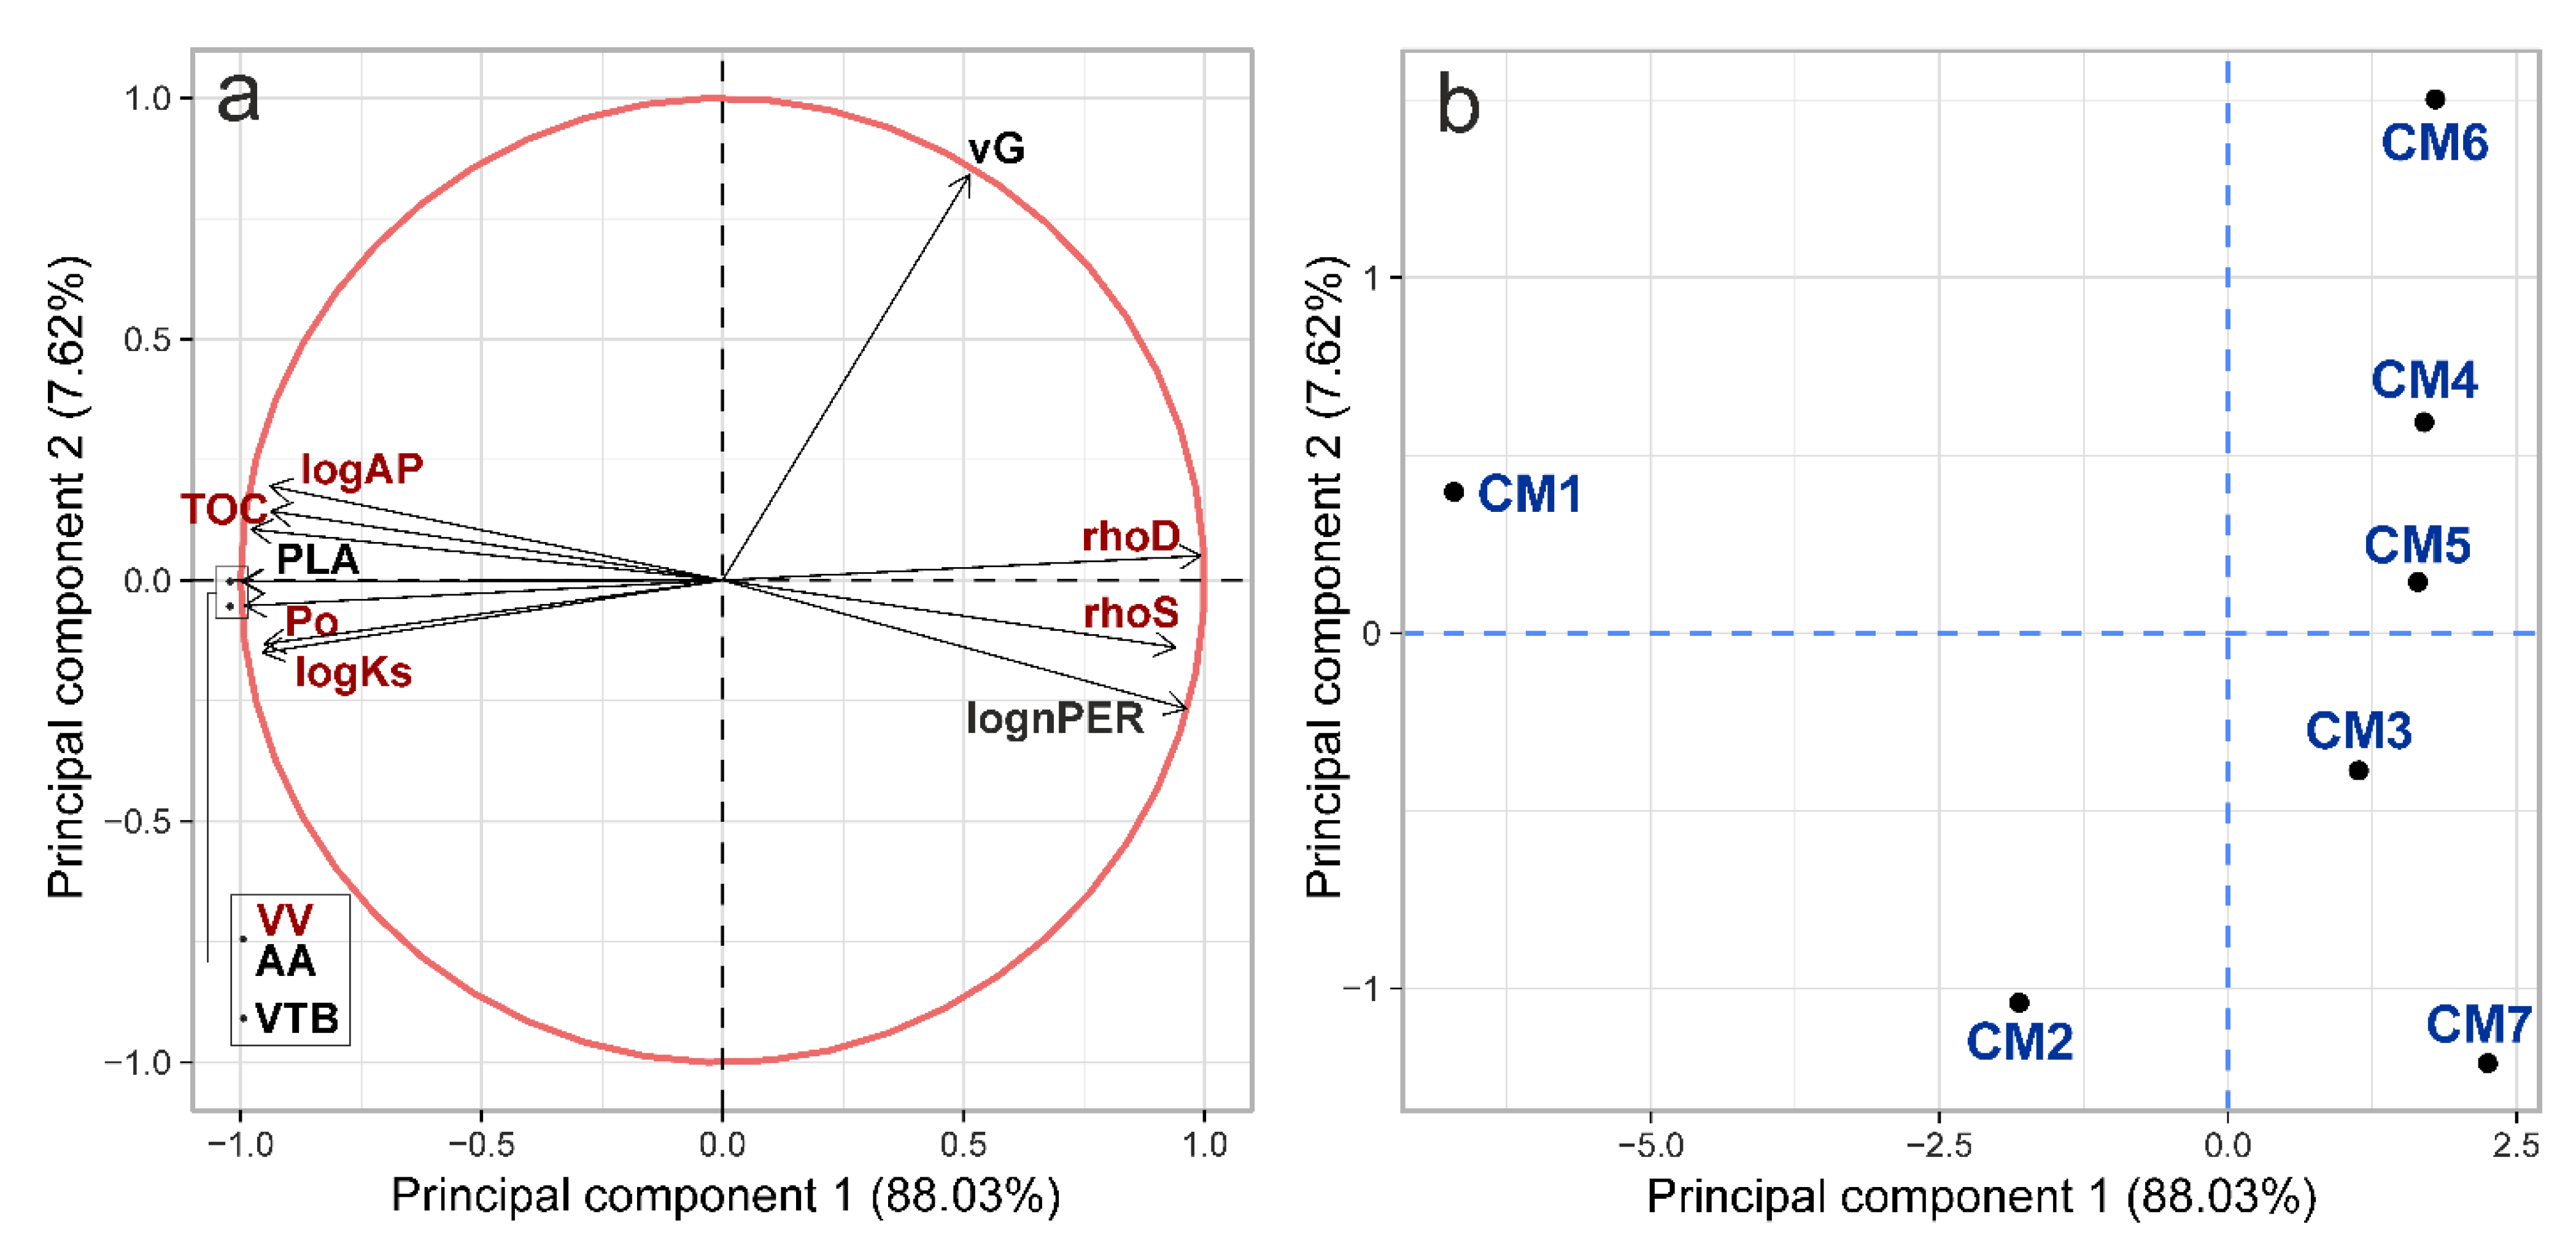
3.3. Morphometric Characteristics of Soil Pores and Their Relationship with Chemical and Physical Soil Properties
4. Discussion
5. Conclusions
Author Contributions
Funding
Data Availability Statement
Conflicts of Interest
Abbreviations
References
- Keesstra, S.; Sannigrahi, S.; López-Vicente, M.; Pulido, M.; Novara, A.; Visser, S.; Kalantari, Z. The role of soils in regulation and provision of blue and green water. Philos. Trans. R. Soc. B-Biol. Sci. 2021, 376, 20200175. [Google Scholar] [CrossRef] [PubMed]
- Wösten, J.H.M.; Lilly, A.; Nemes, A.; Le Bas, C. Development and use of a database of hydraulic properties of European soils. Geoderma 1999, 90, 169–185. [Google Scholar] [CrossRef]
- Jarvis, N.; Koestel, J.; Messing, I.; Moeys, J.; Lindahl, A. Influence of soil, land use and climatic factors on the hydraulic conductivity of soil. Hydrol. Earth Syst. Sci. 2013, 17, 5185–5195. [Google Scholar] [CrossRef] [Green Version]
- Murphy, C.P.; Banfield, C.F. Pore space variability in a subsurface horizon of two soils. J. Soil Sci. 1978, 29, 156–166. [Google Scholar] [CrossRef]
- Koppi, A.J.; McBratney, A.B. A basis for soil mesomorphological analysis. J. Soil Sci. 1991, 42, 139–146. [Google Scholar] [CrossRef]
- Pagliai, M.; Lamarca, M.; Lucamante, G. Micromorphometric and micromorphological investigations of a clay loam soil in viticulture under zero and conventional tillage. J. Soil Sci. 1983, 34, 391–403. [Google Scholar] [CrossRef]
- FitzPatrick, E.A. Micromorphology of Soils; Springer: Berlin/Heidelberg, Germany, 1984; p. 457. [Google Scholar]
- Ringrose-Voase, A.J. Measurement of soil macropore geometry by image analysis of sections through impregnated soil. Plant Soil 1996, 183, 27–47. [Google Scholar] [CrossRef]
- Słowińska-Jurkiewicz, A.; Bryk, M.; Kołodziej, B.; Jaroszuk-Sierocińska, M. Macrostructure of Soils in Poland; AWR Magic: Lublin, Poland, 2012. [Google Scholar]
- Schon, N.L.; Gray, R.A.; Mackay, A.D. Quantification of soil macro pore size and shape using resin impregnation. N. Z. J. Agric. Res. 2012, 55, 309–315. [Google Scholar] [CrossRef]
- Bryk, M. Macrostructure of diagnostic B horizons relative to underlying BC and C horizons in Podzols, Luvisol, Cambisol, and Arenosol evaluated by image analysis. Geoderma 2016, 263, 86–103. [Google Scholar] [CrossRef]
- Sauzet, O.; Cammas, C.; Gilliot, J.M.; Bajard, M.; Montagne, D. Development of a novel image analysis procedure to quantify biological porosity and illuvial clay in large soil thin sections. Geoderma 2017, 292, 135–148. [Google Scholar] [CrossRef]
- Gutiérrez-Castorena, M.C.; Gutiérrez-Castorena, E.V.; González-Vargas, T.; Ortiz-Solorio, C.A.; Suástegui- Méndez, E.; Cajuste-Bontemps, L.; Rodríguez-Mendoza, M.N. Thematic micro-maps of soil components using high-resolution spatially referenced mosaics from whole soil thin sections and image analysis. Eur. J. Soil Sci. 2018, 69, 217–231. [Google Scholar] [CrossRef]
- Moran, C.J.; Koppi, A.J.; Murphy, B.W.; McBratney, A.B. Comparison of the macropore structure of a sandy loam surface soil-horizon subjected to two tillage treatments. Soil Use Manag. 1988, 4, 96–102. [Google Scholar] [CrossRef]
- Crawford, J.W.; Matsui, N.; Young, I.M. The relation between the moisture-release curve and the structure of soil. Eur. J. Soil Sci. 1995, 46, 369–375. [Google Scholar] [CrossRef]
- Lamandé, M.; Hallaire, V.; Curmi, P.; Pérès, G.; Cluzeau, D. Changes of pore morphology, infiltration and earthworm community in a loamy soil under different agricultural managements. Catena 2003, 54, 637–649. [Google Scholar] [CrossRef]
- Kodešová, R.; Vignozzi, N.; Rohošková, M.; Hájková, T.; Kočárek, M.; Pagliai, M.; Kozák, J.; Šimůnek, J. Impact of varying soil structure on transport processes in different diagnostic horizons of three soil types. J. Contam. Hydrol. 2009, 104, 107–125. [Google Scholar] [CrossRef]
- Rasa, K.; Eickhorst, T.; Tippkötter, R.; Yli-Halla, M. Structure and pore system in differently managed clayey surface soil as described by micromorphology and image analysis. Geoderma 2012, 173, 10–18. [Google Scholar] [CrossRef]
- Bouma, J.; Jongerius, A.; Schoonderbeek, D. Calculation of saturated hydraulic conductivity of some pedal clay soils using micromorphometric data. Soil Sci. Soc. Am. J. 1979, 43, 261–264. [Google Scholar] [CrossRef]
- Vogel, H.J.; Roth, K. A new approach for determining effective soil hydraulic functions. Eur. J. Soil Sci. 1998, 49, 547–556. [Google Scholar] [CrossRef]
- Vogel, H.J.; Roth, K. Quantitative morphology and network representation of soil pore structure. Adv. Water Resour. 2001, 24, 233–242. [Google Scholar] [CrossRef]
- Pagliai, M.; Marsili, A.; Servadio, P.; Vignozzi, N.; Pellegrini, S. Changes in some physical properties of a clay soil in Central Italy following the passage of rubber tracked and wheeled tractors of medium power. Soil Tillage Res. 2003, 73, 119–129. [Google Scholar] [CrossRef]
- Pagliai, M.; Vignozzi, N.; Pellegrini, S. Soil structure and the effect of management practices. Soil Tillage Res. 2004, 79, 131–143. [Google Scholar] [CrossRef]
- Pagliai, M.; Kutílek, M. Soil micromorphology and soil hydraulics. In New Trends in Soil Micromorphology; Kapur, S., Mermut, A., Stoops, G., Eds.; Springer: Berlin/Heidelberg, Germany, 2008; pp. 5–18. [Google Scholar]
- Quinton, W.L.; Hayashi, M.; Carey, S.K. Peat hydraulic conductivity in cold regions and its relation to pore size and geometry. Hydrol. Process. 2008, 22, 2829–2837. [Google Scholar] [CrossRef]
- Bryk, M. Resolving compactness index of pores and solid phase elements in sandy and silt loamy soils. Geoderma 2018, 318, 109–122. [Google Scholar] [CrossRef]
- Fernández, R.; Frasier, I.; Quiroga, A.; Noellemeyer, E. Pore morphology reveals interaction of biological and physical processes for structure formation in soils of the semiarid Argentinean Pampa. Soil Tillage Res. 2019, 191, 256–265. [Google Scholar] [CrossRef]
- Bryk, M.; Kołodziej, B. Assessment of water and air permeability of chernozem supported by image analysis. Soil Tillage Res. 2014, 138, 73–84. [Google Scholar] [CrossRef]
- Soil Science Society of Poland. Particle size distribution and textural classes of soils and mineral materials—Classification of Polish Society of Soil Sciences 2008. Rocz. Glebozn.-Soil Sci. Annu. 2009, 60, 5–16. [Google Scholar]
- ISO 14235. Soil Quality—Determination of Organic Carbon by Sulfochromic Oxidation; International Organization for Standardization: Vernier, Geneva, Switzerland, 1998. [Google Scholar]
- ISO 10390. Soil Quality—Determination of pH; International Organization for Standardization: Vernier, Geneva, Switzerland, 2005. [Google Scholar]
- ISO 10693. Soil Quality—Determination of Carbonate Content—Volumetric Method; International Organization for Standardization: Vernier, Geneva, Switzerland, 1995. [Google Scholar]
- ISO 11508. Soil Quality—Determination of Particle Density; International Organization for Standardization: Vernier, Geneva, Switzerland, 2017. [Google Scholar]
- Aguilar, J.; Dorronsoro-Fdez, C.; Fernández, J.; Dorronsoro Diaz, C.; Martin, F.; Dorronsoro, B. Interactive Multimedia Programme for Self-Studying Soil Thin Section Description. Available online: http://edafologia.ugr.es/micgraf/indexw.htm (accessed on 8 August 2021).
- ADCIS and AAI Inc. Aphelion Imaging Software Suite, version 4.0.8; ADCIS: Saint-Contest, France, 2010. [Google Scholar]
- Russ, J.C.; Dehoff, R.T. Practical Stereology, 2nd ed.; Springer: Berlin/Heidelberg, Germany, 2000. [Google Scholar]
- Vogel, H.J. Morphological determination of pore connectivity as a function of pore size using serial sections. Eur. J. Soil Sci. 1997, 48, 365–377. [Google Scholar] [CrossRef]
- Vogel, H.J.; Weller, U.; Schlüter, S. Quantification of soil structure based on Minkowski functions. Comput. Geosci. 2010, 36, 1236–1245. [Google Scholar] [CrossRef]
- Schlüter, S.; Weller, U.; Vogel, H.J. Soil-structure development including seasonal dynamics in a long-term fertilization experiment. J. Plant Nutr. Soil Sci. 2011, 174, 395–403. [Google Scholar] [CrossRef]
- Ghanbarian-Alavijeh, B.; Hunt, A.G. Unsaturated hydraulic conductivity in porous media: Percolation theory. Geoderma 2012, 187, 77–84. [Google Scholar] [CrossRef]
- Hunt, A.; Ewing, R. Percolation Theory for Flow in Porous Media, 2nd ed.; Springer: Berlin/Heidelberg, Germany, 2009; Volume 674, p. 337. [Google Scholar]
- R Core Team. R: A Language and Environment for Statistical Computing; R Foundation for Statistical Computing: Vienna, Austria, 2021. [Google Scholar]
- Dexter, A.R.; Czyż, E.A.; Gaţe, O.P. Soil structure and the saturated hydraulic conductivity of subsoils. Soil Tillage Res. 2004, 79, 185–189. [Google Scholar] [CrossRef]
- Luo, L.F.; Lin, H.; Schmidt, J. Quantitative relationships between soil macropore characteristics and preferential flow and transport. Soil Sci. Soc. Am. J. 2010, 74, 1929–1937. [Google Scholar] [CrossRef]
- Patil, N.G.; Singh, S.K. Pedotransfer functions for estimating soil hydraulic properties: A review. Pedosphere 2016, 26, 417–430. [Google Scholar] [CrossRef]
- Zhang, Y.G.; Schaap, M.G. Estimation of saturated hydraulic conductivity with pedotransfer functions: A review. J. Hydrol. 2019, 575, 1011–1030. [Google Scholar] [CrossRef]
- Vereecken, H.; Weynants, M.; Javaux, M.; Pachepsky, Y.; Schaap, M.G.; van Genuchten, M.T. Using pedotransfer functions to estimate the van Genuchten-Mualem soil hydraulic properties: A review. Vadose Zone J. 2010, 9, 795–820. [Google Scholar] [CrossRef]
- Keesstra, S.; Nunes, J.P.; Saco, P.; Parsons, T.; Poeppl, R.; Masselink, R.; Cerdà, A. The way forward: Can connectivity be useful to design better measuring and modelling schemes for water and sediment dynamics? Sci. Total Environ. 2018, 644, 1557–1572. [Google Scholar] [CrossRef] [PubMed]
- López-Vicente, M.; Kramer, H.; Keesstra, S. Effectiveness of soil erosion barriers to reduce sediment connectivity at small basin scale in a fire-affected forest. J. Environ. Manag. 2021, 278, 111510. [Google Scholar] [CrossRef] [PubMed]
- Gerke, K.M.; Skvortsova, E.B.; Korost, D.V. Tomographic method of studying soil pore space: Current perspectives and results for some Russian soils. Eurasian Soil Sci. 2012, 45, 700–709. [Google Scholar] [CrossRef]
- Rabot, E.; Wiesmeier, M.; Schlüter, S.; Vogel, H.J. Soil structure as an indicator of soil functions: A review. Geoderma 2018, 314, 122–137. [Google Scholar] [CrossRef]
- Bayabil, H.K.; Dile, Y.T.; Tebebu, T.Y.; Engda, T.A.; Steenhuis, T.S. Evaluating infiltration models and pedotransfer functions: Implications for hydrologic modeling. Geoderma 2019, 338, 159–169. [Google Scholar] [CrossRef]


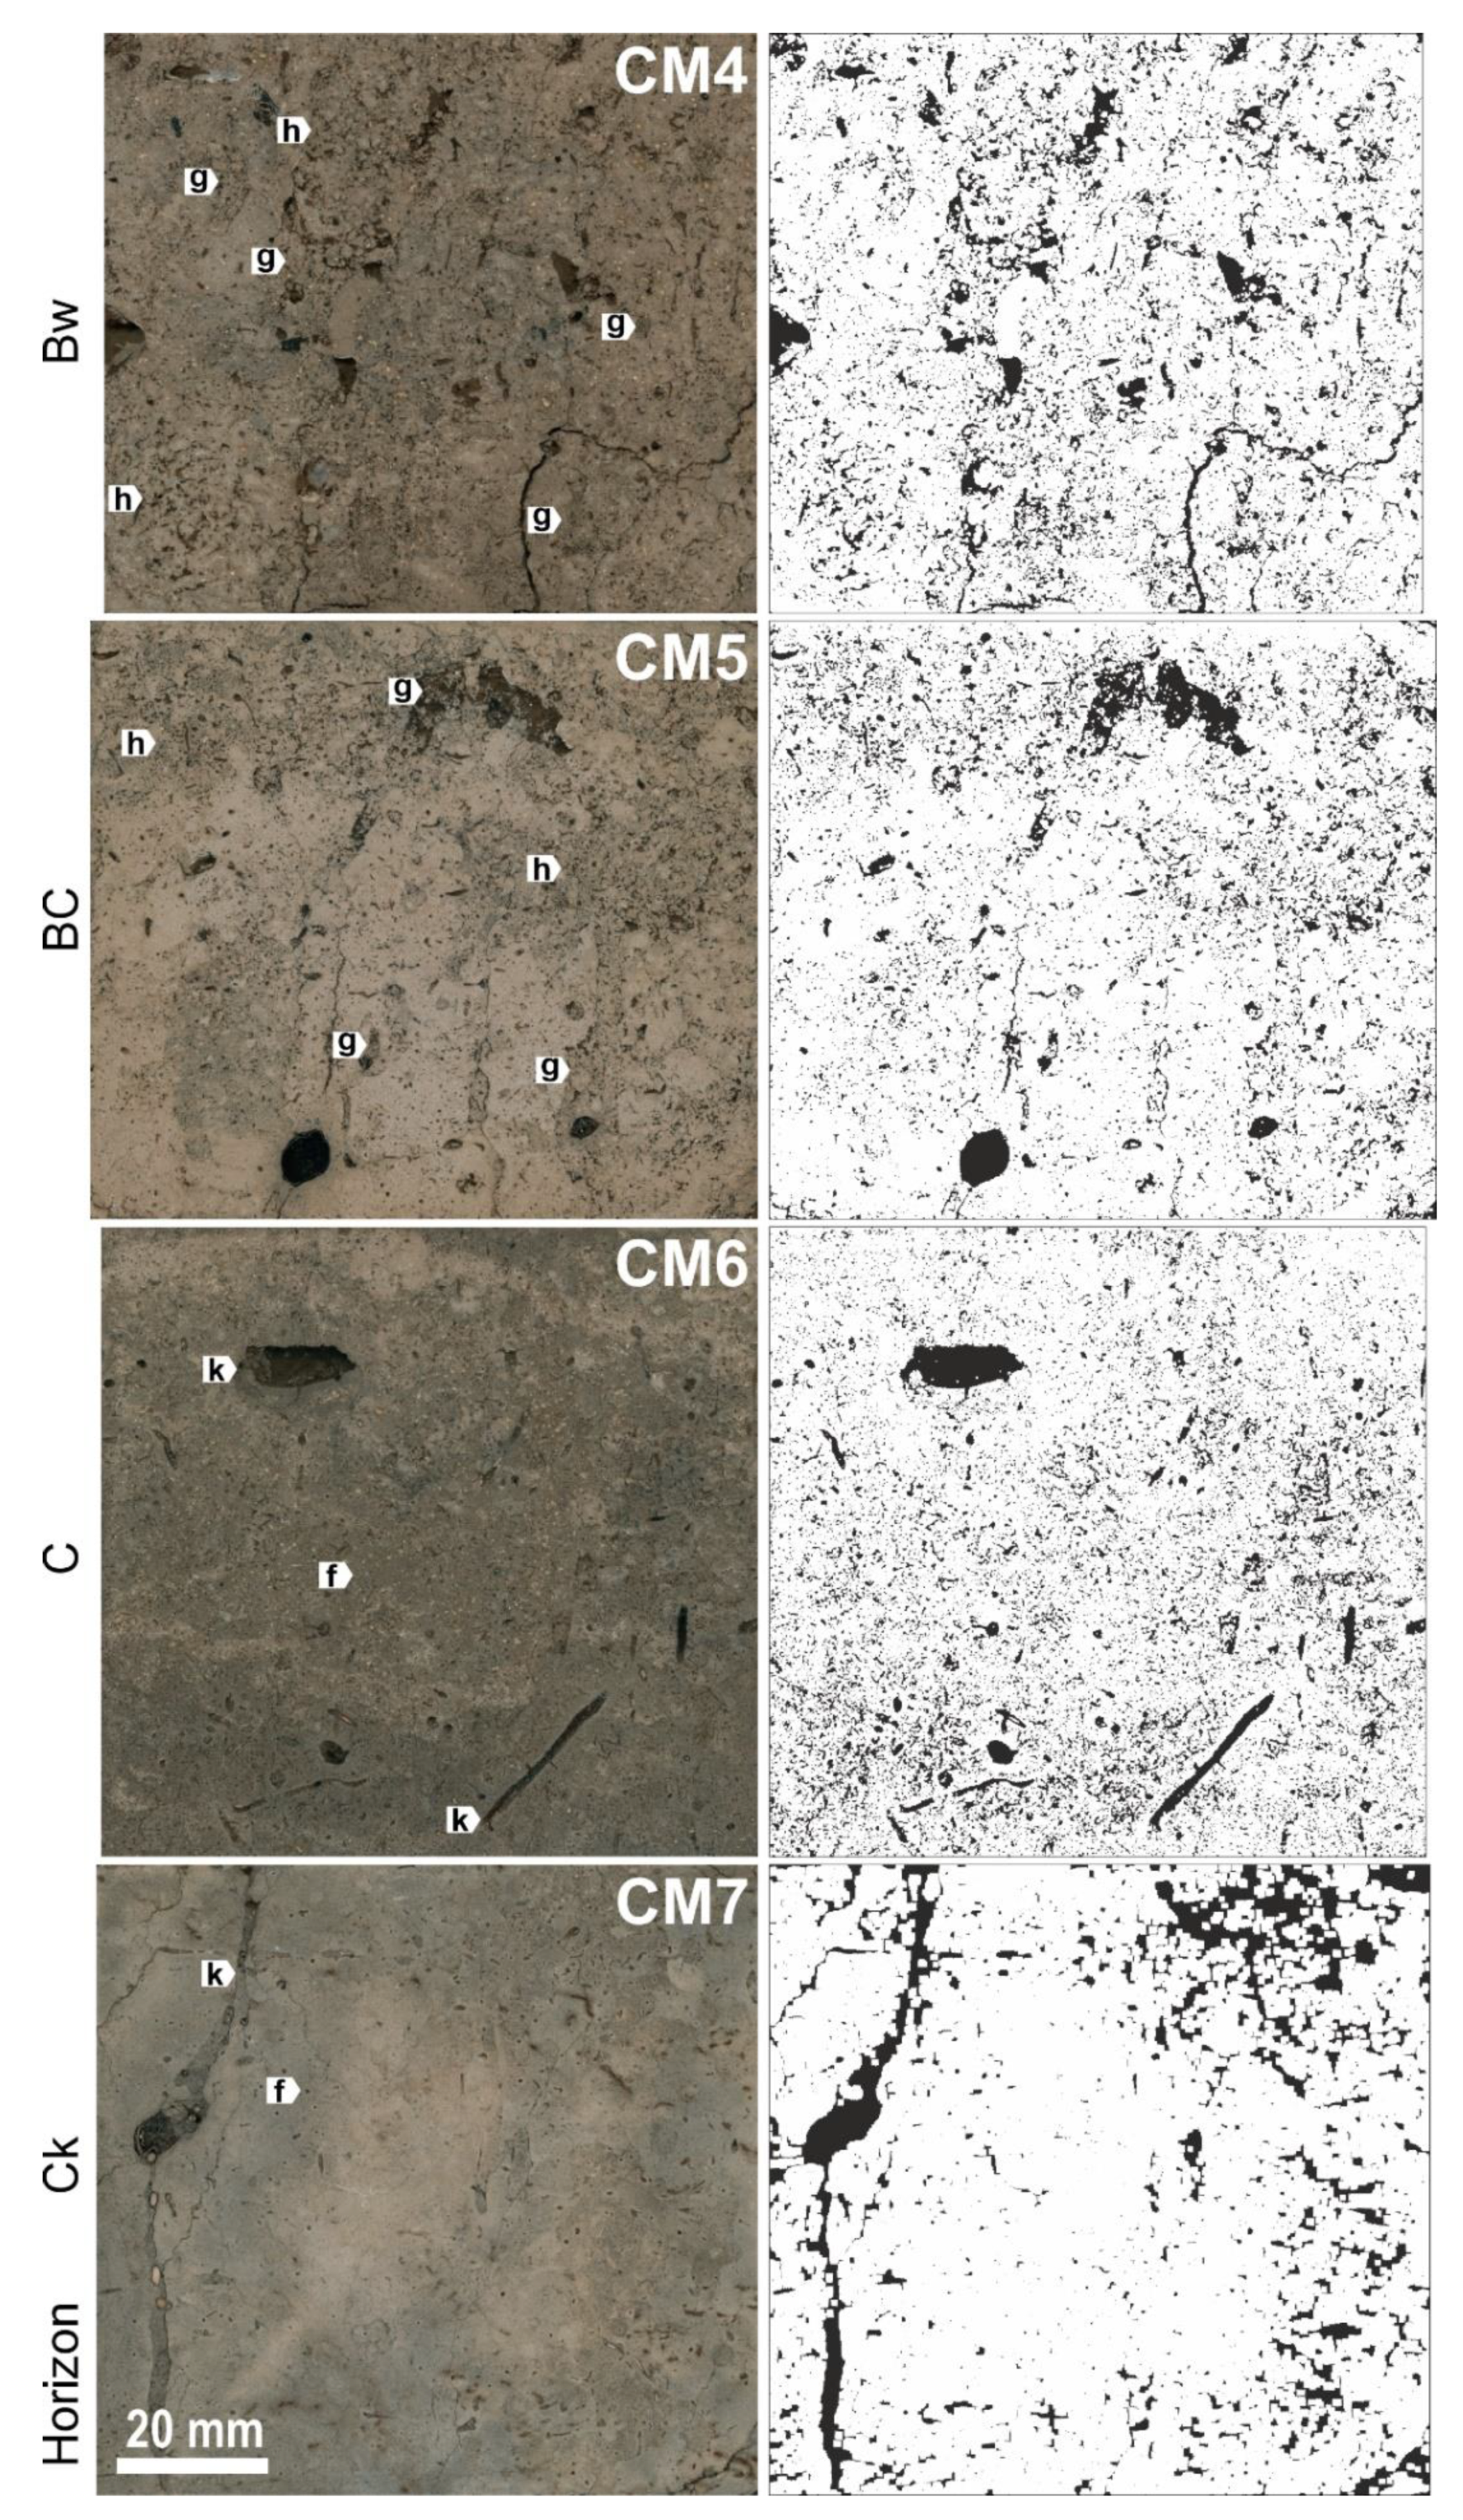
| Layer | CM1 | CM2 | CM3 | CM4 | CM5 | CM6 | CM7 |
|---|---|---|---|---|---|---|---|
| Horizon | O-A | A | AB | Bw | BC | C | Ck |
| Horizon depth (cm) | 0–5 – 5–10/15 | 5–10/15 | 10/15–30/45 | 30/45–67 | 67–85 | 85–120/135 | >120/135 |
| Sampling depth (cm) | 0–8 | 6–14 | 20–28 | 50–58 and 54–62 | 70–78 and 74–82 | 100–108 | 138–146 |
| Sand, cS (g g−1) | – | 0.210 | 0.180 | 0.180 | 0.170 | 0.180 | 0.130 |
| Silt, cSI (g g−1) | – | 0.720 | 0.720 | 0.590 | 0.650 | 0.665 | 0.750 |
| Clay, cC (g g−1) | – | 0.070 | 0.100 | 0.230 | 0.180 | 0.155 | 0.120 |
| TOC (mg g−1) | 316.8 | 26.3 | 6.3 | 2.9 | 2.9 | 1.6 | 3.5 |
| CaCO3 (mg g−1) | 0 | 0 | 0 | 0 | 0 | 0 | 110 |
| pHH2O | 5.68 | 5.72 | 4.77 | 5.51 | 6.07 | 6.52 | 8.17 |
| pHKCl | 5.37 | 5.21 | 4.06 | 4.16 | 4.71 | 5.03 | 7.95 |
| Bulk density, ρD (g cm−3) | 0.44 ± 0.10 | 0.90 ± 0.07 | 1.31 ± 0.04 | 1.44 ± 0.01 | 1.44 ± 0.01 | 1.38 ± 0.04 | 1.45 ± 0.03 |
| Particle density, ρS (g cm−3) | 1.48 | 2.55 | 2.61 | 2.62 | 2.66 | 2.66 | 2.65 |
| Total porosity, PO (cm3 cm−3) | 0.703 | 0.647 | 0.498 | 0.450 | 0.459 | 0.481 | 0.453 |
| Layer | Horizon | Macroporosity by Image Analysis, AA (cm3 cm–3) | Air Capacity, VV (cm3 cm–3) | Air Permeability, logAP | Hydraulic Conductivity, logKS | Relative Length of Pore Path, PLA (cm cm–2) | Relative Volume of Pores overlapping the Top and Bottom Edge of the Image, VTB (cm3 cm–3) | Pore-Network Growth-Rate, vG (×10–3 cm3 cm–3) | Percolation Number, nPER |
|---|---|---|---|---|---|---|---|---|---|
| CM1 | O-A | 0.5183 ± 0.0379 | 0.332 ± 0.064 | 3.278 ± 0.609 | 3.710 ± 0.290 | 22.558 ± 0.600 | 0.4624 ± 0.0577 | 6.40 ± 1.36 | 0.26 ± 0.45 |
| c | c | c | c | d | c | ab | a | ||
| CM2 | A | 0.2905 ± 0.1038 | 0.224 ± 0.052 | 1.956 ± 1.046 | 3.092 ± 1.386 | 13.770 ± 4.383 | 0.1874 ± 0.1276 | 6.07 ± 1.93 | 3.93 ± 3.19 |
| b | b | b | bc | c | b | a | b | ||
| CM3 | AB | 0.1681 ± 0.0459 | 0.165 ± 0.016 | 1.354 ± 0.852 | 1.900 ± 0.860 | 3.835 ± 0.976 | 0.0482 ± 0.0472 | 8.51 ± 1.32 | 12.22 ± 2.67 |
| a | ab | ab | ab | ab | a | ab | d | ||
| CM4 | Bw | 0.1391 ± 0.0287 | 0.141 ± 0.016 | 1.603 ± 0.187 | 1.427 ± 0.854 | 5.168 ± 0.965 | 0.0093 ± 0.0101 | 10.91 ± 1.85 | 9.31 ± 1.61 |
| a | a | b | a | b | a | bc | cd | ||
| CM5 | BC | 0.1262 ± 0.0224 | 0.131 ± 0.008 | 1.329 ± 0.193 | 1.985 ± 1.110 | 4.960 ± 0.815 | 0.0030 ± 0.0019 | 9.99 ± 2.30 | 9.32 ± 1.63 |
| a | a | ab | ab | b | a | abc | cd | ||
| CM6 | C | 0.1341 ± 0.0216 | 0.135 ± 0.024 | 1.099 ± 0.396 | 1.611 ± 0.127 | 6.501 ± 0.853 | 0.0100 ± 0.0184 | 14.60 ± 2.55 | 6.72 ± 0.92 |
| a | a | ab | ab | b | a | c | bc | ||
| CM7 | Ck | 0.1179 ± 0.0288 | 0.117 ± 0.020 | 0.458 ± 0.046 | 1.514 ± 0.148 | 1.890 ± 0.257 | 0.0353 ± 0.0410 | 6.38 ± 1.18 | 23.25 ± 2.60 |
| a | a | a | a | a | a | ab | e |
| Linear Regression Equations | R2 | p | Linear Regression Equations | R2 | p |
|---|---|---|---|---|---|
| VV = −0.163 ** ρS + 0.578 *** | 0.823 | 0.0027 | lognPER = 1.376 ** ρS − 2.640 ** | 0.869 | 0.0014 |
| VV = −0.197 *** ρD + 0.413 *** | 0.981 | <0.0001 | lognPER = 1.543 ** ρD − 1.097 * | 0.856 | 0.0018 |
| VV = 0.708 *** PO − 0.195 * | 0.900 | 0.0007 | lognPER = −5.356 ** PO + 3.571 ** | 0.720 | 0.0098 |
| VV = 0.876 *** cS | 0.977 | <0.0001 | lognPER = 5.271 ** cS | 0.846 | 0.0021 |
| VV = 6.0×10⁻⁴ ** TOC + 0.147 *** | 0.811 | 0.0036 | lognPER = −0.005 ** TOC + 1.009 *** | 0.869 | 0.0014 |
| logKS = −2.207 *** ρD + 4.813 *** | 0.925 | 0.0003 | AA = 1.911 *** VV − 0.126 *** | 0.990 | <0.0001 |
| logKS = 8.290 *** PO − 2.194 ** | 0.948 | 0.0001 | PLA = 92.370 *** VV − 8.046 ** | 0.930 | 0.0003 |
| logKS = 11.077 *** cS | 0.946 | 0.0001 | PLA = 41.870 *** AA | 0.965 | <0.0001 |
| logAP = −1.783 ** ρS + 5.972 ** | 0.734 | 0.0086 | VTB = 2.169 *** VV − 0.278 *** | 0.960 | 0.0001 |
| logAP = −2.079 ** ρD + 4.066 *** | 0.797 | 0.0043 | VTB = 1.144 *** AA − 0.136 *** | 0.988 | <0.0001 |
| logAP = 0.007 * TOC + 1.246 ** | 0.716 | 0.0102 | VTB = 0.022 *** PLA − 0.078 | 0.897 | 0.0008 |
| logAP = 7.623 *** cS | 0.943 | 0.0002 | lognPER = −7.875 *** VV + 2.147 *** | 0.887 | 0.0010 |
| AA = −0.320 ** ρS + 1.000 *** | 0.872 | 0.0013 | lognPER = −4.134 *** AA + 1.629 *** | 0.903 | 0.0006 |
| AA = −0.379 *** ρD + 0.666 *** | 0.981 | <0.0001 | lognPER = −0.085 *** PLA + 1.456 *** | 0.935 | 0.0002 |
| AA = 1.345 ** PO − 0.496 ** | 0.880 | 0.0011 | lognPER = −3.526 ** VTB + 1.127 *** | 0.861 | 0.0016 |
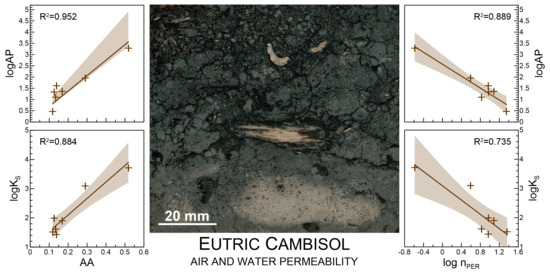
| AA = 0.947 *** cS | 0.920 | 0.0004 | logAP = 9.166 *** VV | 0.968 | <0.0001 |
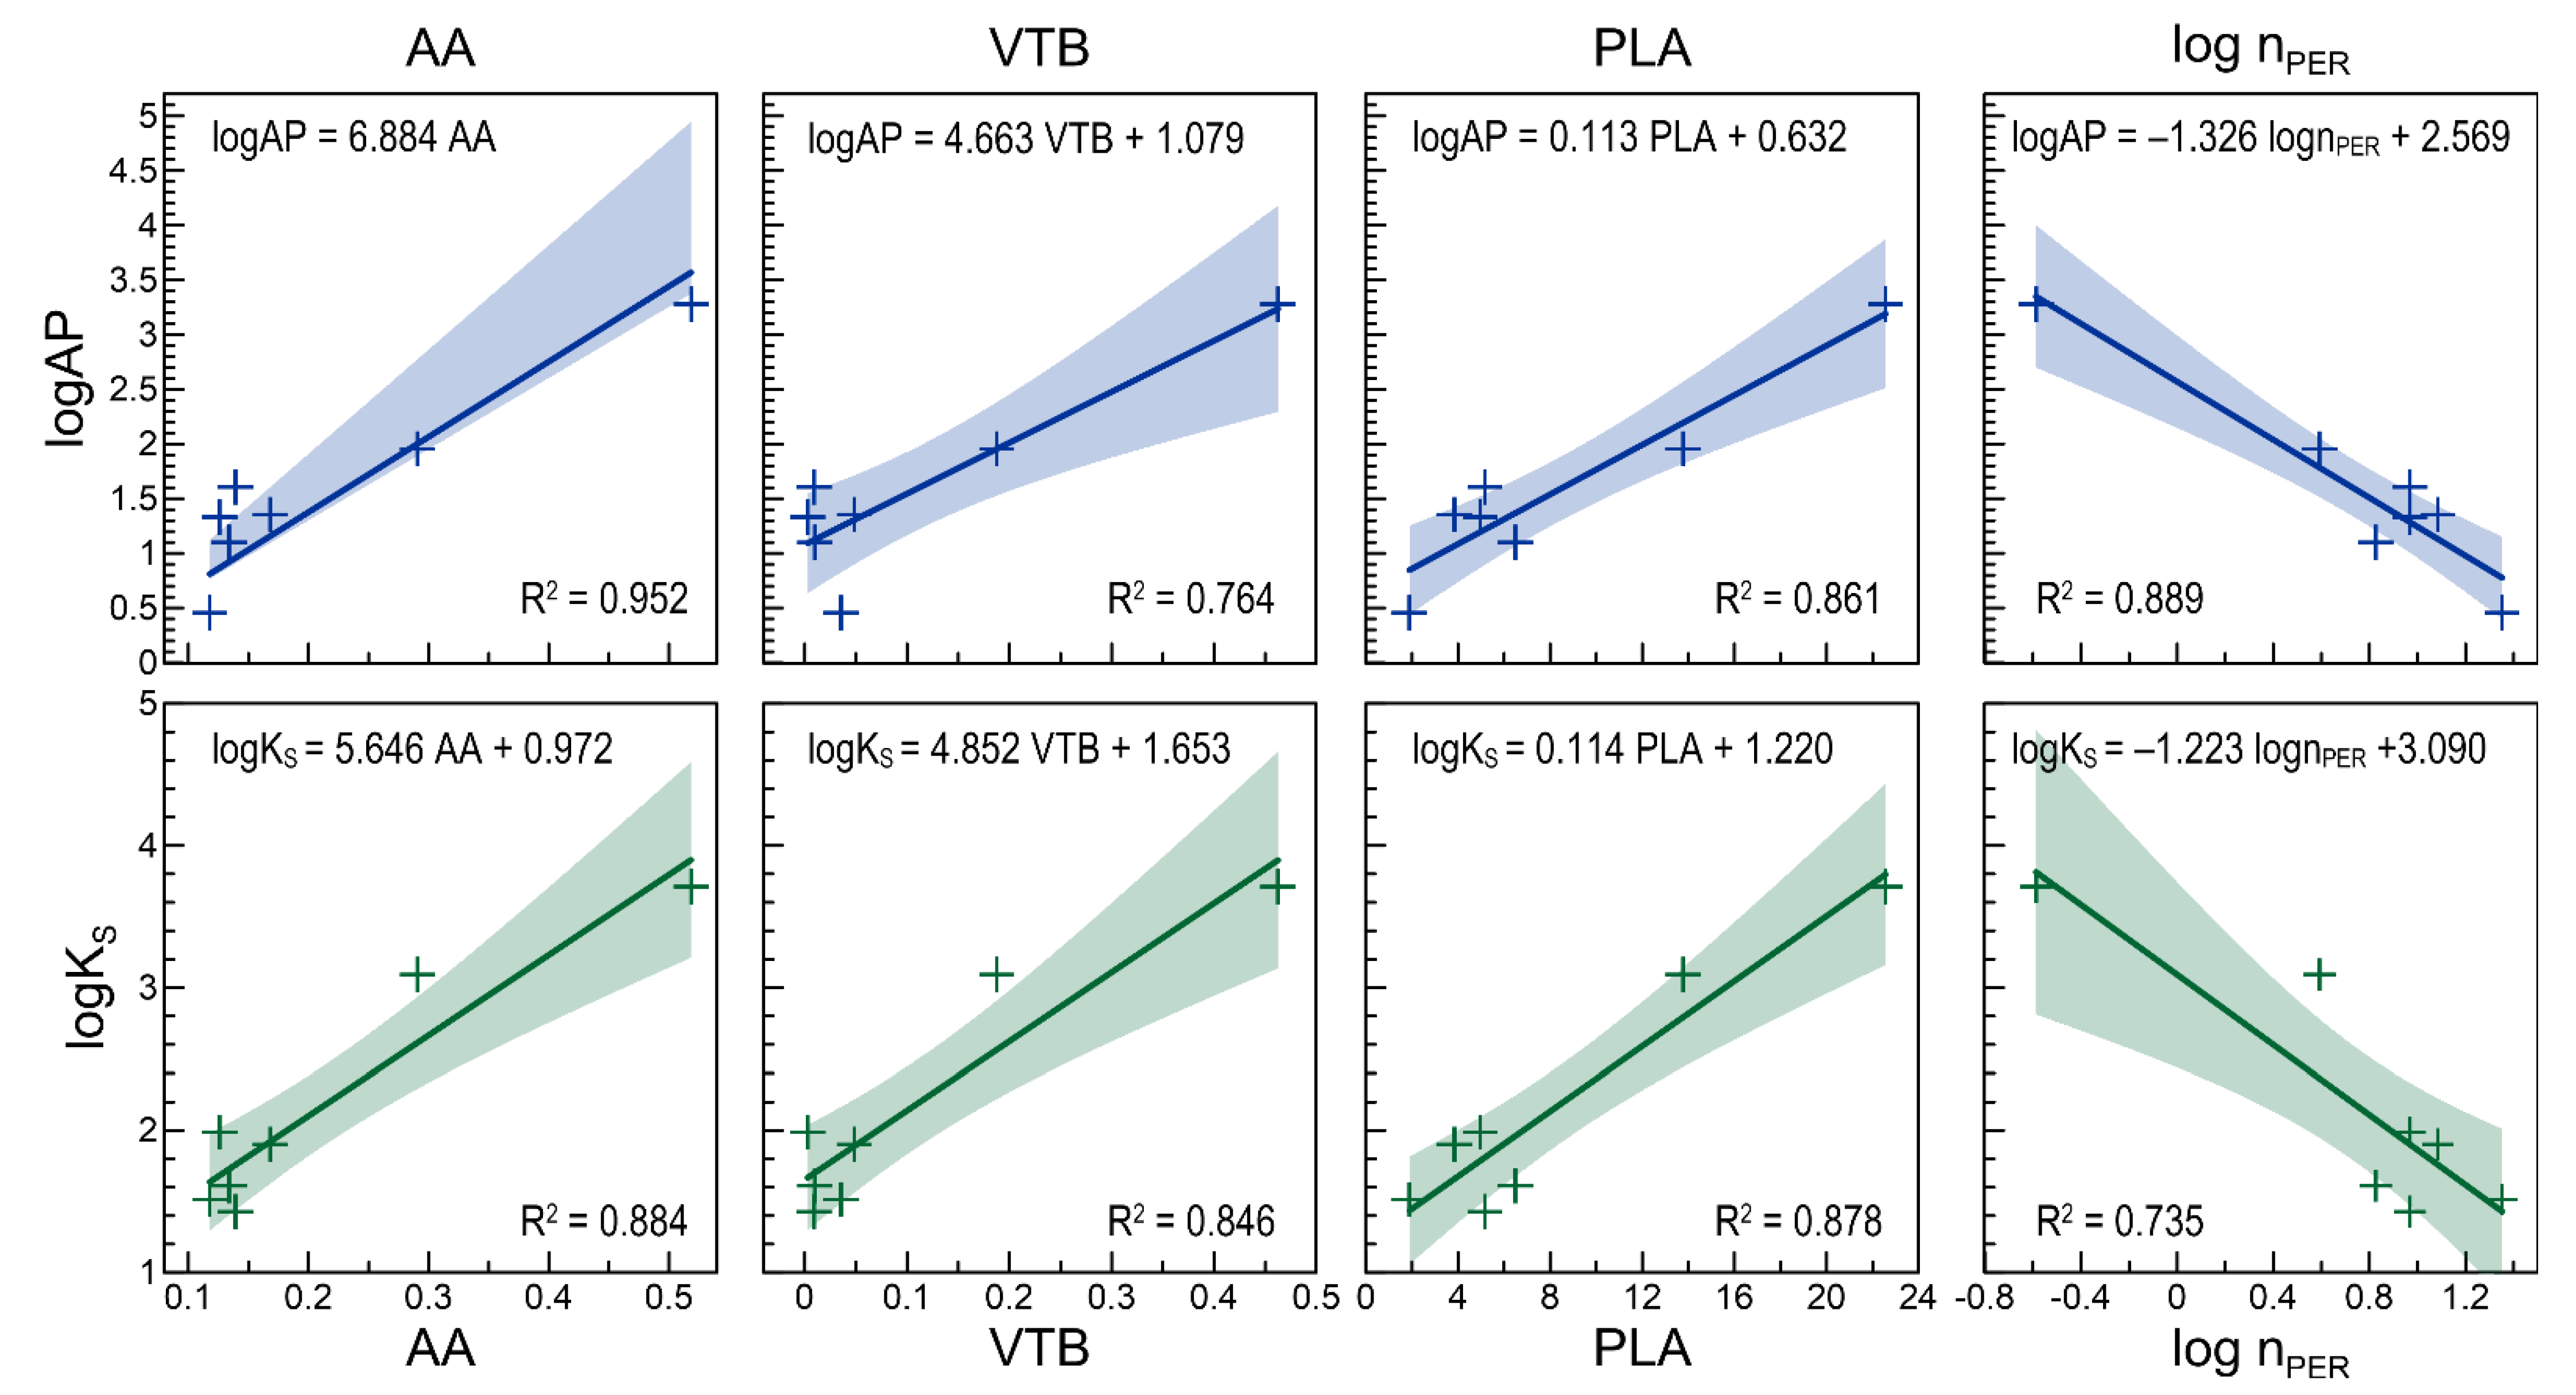
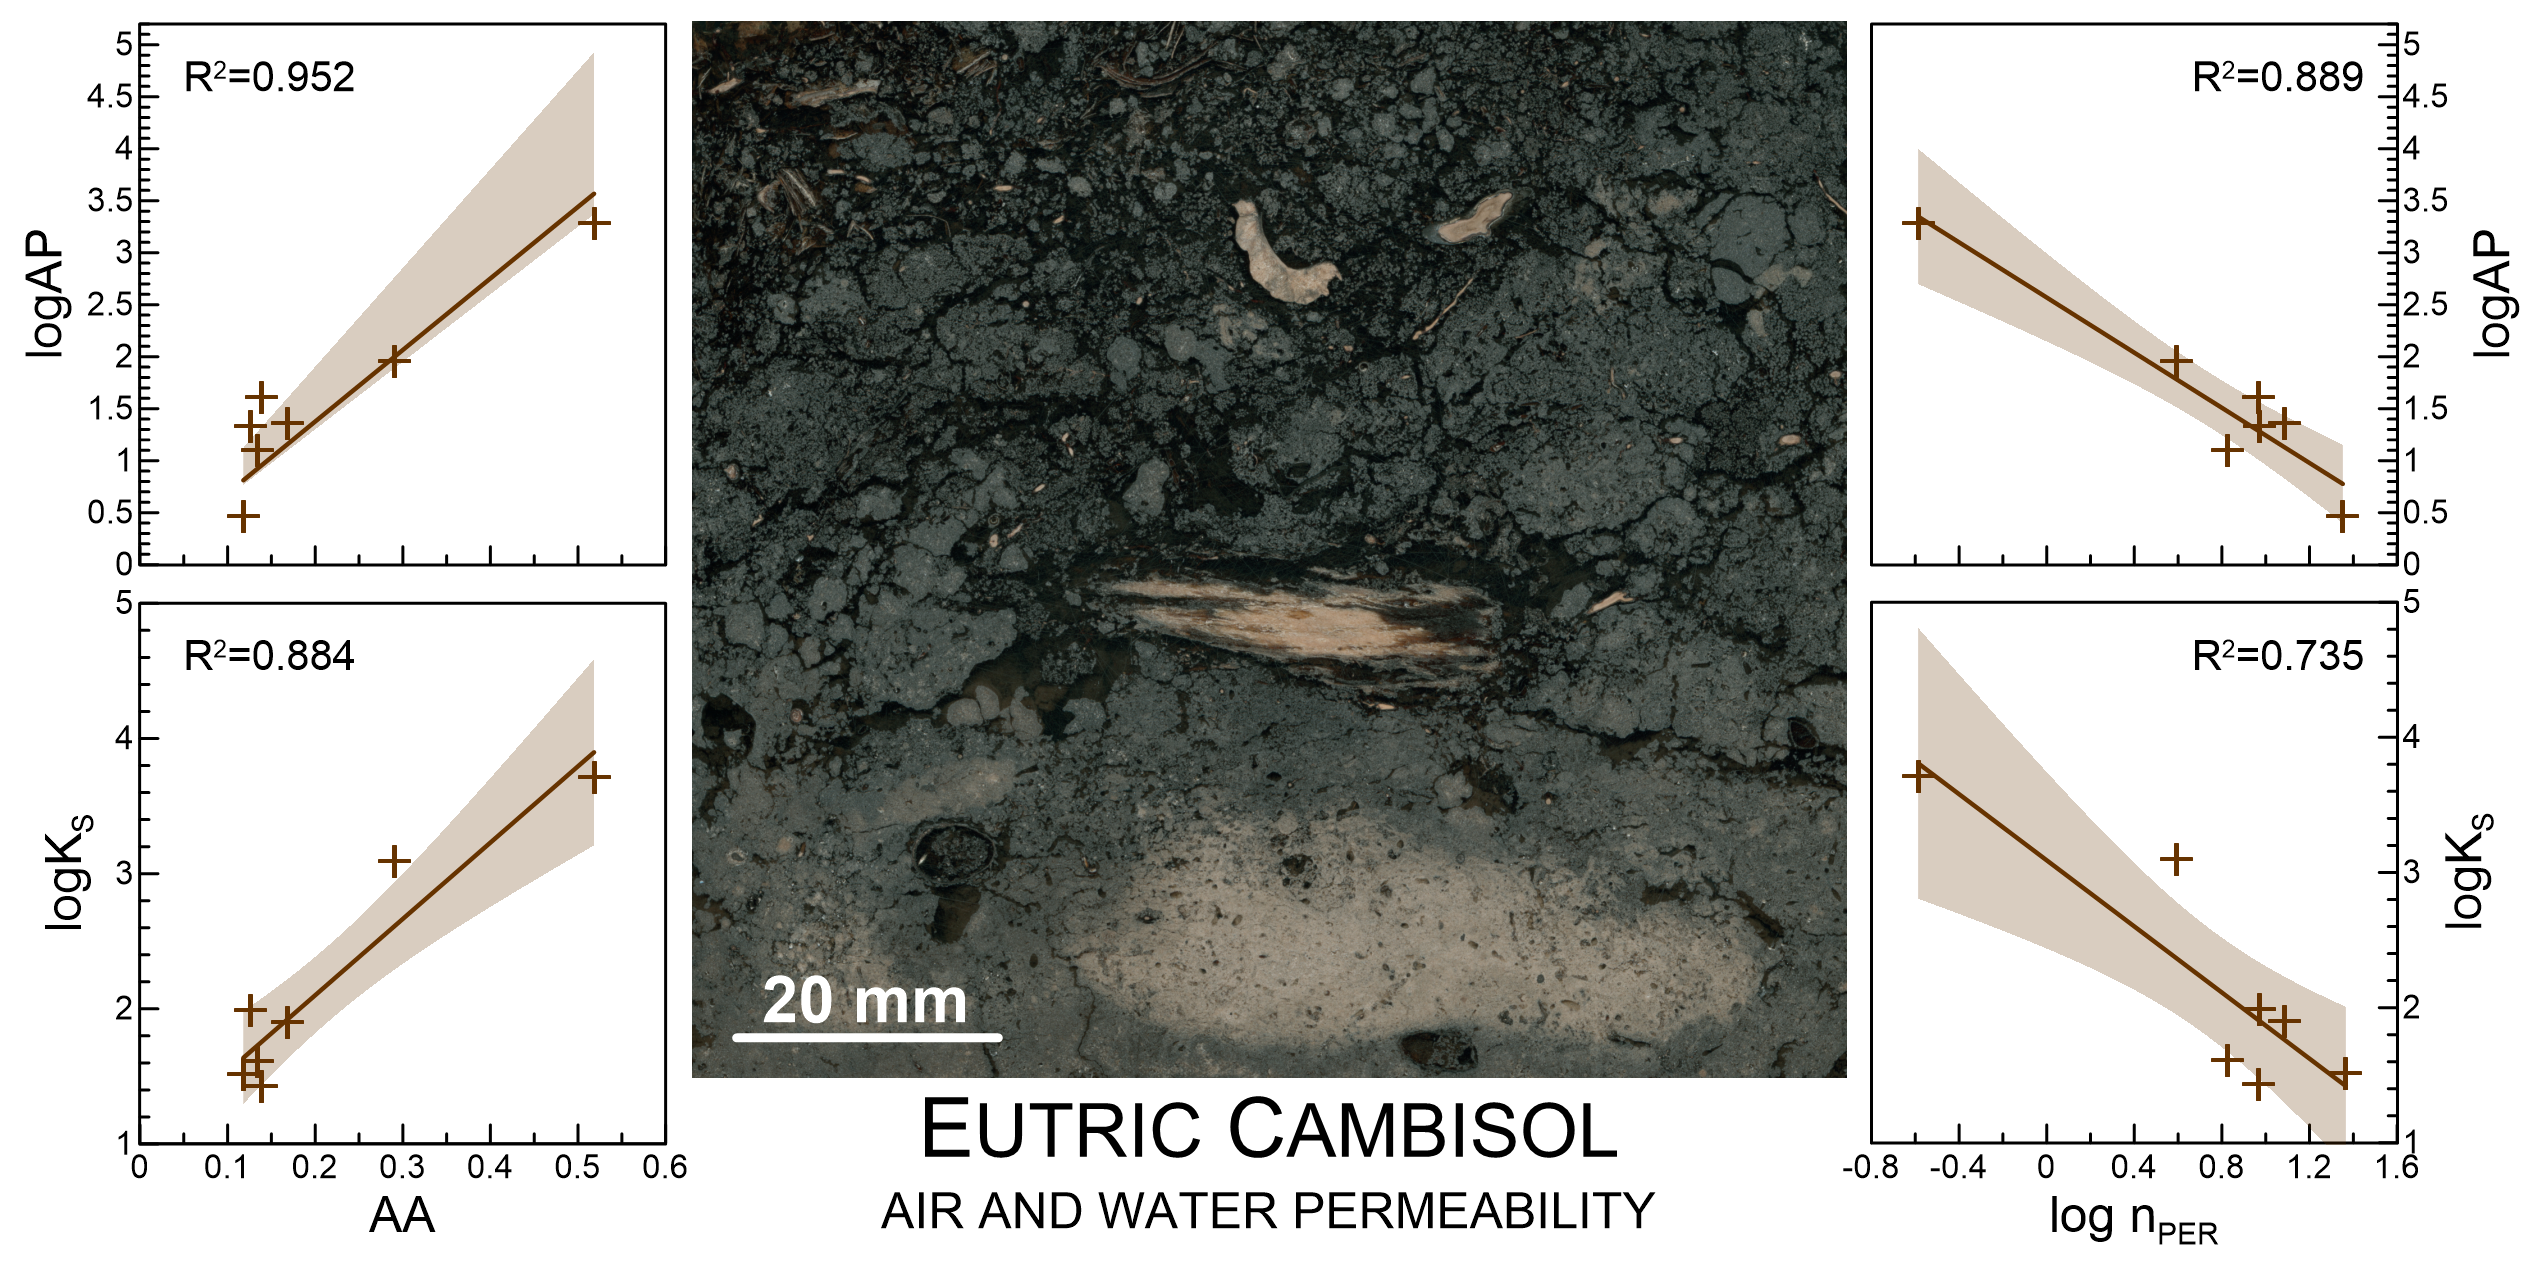
| AA = 0.001 ** TOC + 0.152 ** | 0.864 | 0.0015 | logAP = 6.884 *** AA | 0.952 | <0.0001 |
| PLA = −14.918 ** ρS + 45.104 ** | 0.750 | 0.0073 | logAP = 0.113 ** PLA + 0.632 * | 0.861 | 0.0016 |
| PLA = −18.486 *** ρD + 30.461 *** | 0.946 | 0.0002 | logAP = 4.663 ** VTB + 1.079 ** | 0.764 | 0.0063 |
| PLA = 67.129 *** PO − 27.013 ** | 0.893 | 0.0008 | logAP = −1.323 *** lognPER + 2.570 *** | 0.891 | 0.0009 |
| PLA = 36.191 ** cS | 0.776 | 0.0055 | logKS = 12.057 *** VV | 0.985 | <0.0001 |
| PLA = 0.055 ** TOC + 5.542 * | 0.749 | 0.0074 | logKS = 5.646 ** AA + 0.972 ** | 0.872 | 0.0013 |
| VTB = −0.370 *** ρS + 1.019 *** | 0.889 | 0.0009 | logKS = 0.114 ** PLA + 1.220 ** | 0.878 | 0.0012 |
| VTB = −0.432 *** ρD + 0.624 *** | 0.965 | <0.0001 | logKS = 4.852 ** VTB + 1.653 *** | 0.846 | 0.0021 |
| VTB = 1.527 ** PO − 0.697 ** | 0.852 | 0.0019 | logKS = −1.223 ** lognPER + 3.090 *** | 0.735 | 0.0085 |
Publisher’s Note: MDPI stays neutral with regard to jurisdictional claims in published maps and institutional affiliations. |
© 2021 by the authors. Licensee MDPI, Basel, Switzerland. This article is an open access article distributed under the terms and conditions of the Creative Commons Attribution (CC BY) license (https://creativecommons.org/licenses/by/4.0/).
Share and Cite
Bryk, M.; Kołodziej, B. Suitability of Image Analysis in Evaluating Air and Water Permeability of Soil. Agronomy 2021, 11, 1883. https://doi.org/10.3390/agronomy11091883
Bryk M, Kołodziej B. Suitability of Image Analysis in Evaluating Air and Water Permeability of Soil. Agronomy. 2021; 11(9):1883. https://doi.org/10.3390/agronomy11091883
Chicago/Turabian StyleBryk, Maja, and Beata Kołodziej. 2021. "Suitability of Image Analysis in Evaluating Air and Water Permeability of Soil" Agronomy 11, no. 9: 1883. https://doi.org/10.3390/agronomy11091883
APA StyleBryk, M., & Kołodziej, B. (2021). Suitability of Image Analysis in Evaluating Air and Water Permeability of Soil. Agronomy, 11(9), 1883. https://doi.org/10.3390/agronomy11091883