Abstract
The seed pericarp of Chenopodium quinoa Willd. (quinoa) contains a mixture of triterpenoid saponins conferring undesired organoleptic properties. In this study, we evaluated saponin content and their corresponding sapogenins in 114 different quinoa accessions. Relative saponin content ranged from 0.22 to 15.04 mg/g of seed dry weight among the genotypes studied and the genotype effect was significant (p < 0.001). About 75% of the genotypes could be classified as low-saponin content lines which is promising in view of ongoing plant breeding efforts. In addition to the quantitative determination of saponins, metabolic profiling was performed by LC-FTICR-MS and LC-MS/MS. We obtained highly accurate mass estimation from ion spectra allowing the identification of twelve saponins of the oleanane type. These differ in their aglycons and in the number and type of glycoside units. Interestingly, we identified a saponin compound that, to our knowledge, had not been reported previously. Our study highlights that there is considerable variability concerning saponin content in quinoa, which contributes to the valorization of genetic resources towards the identification of genotypes that could be utilized in current and future quinoa breeding programs.
1. Introduction
Saponins, glycosylated secondary metabolites, are present in a wide range of plant species [1]. They consist of a triterpenoid (C30) or steroid (C27) aglycon (sapogenin) attached to sugar units varying by type, number, and position [2]. Saponins have been widely studied for their potential applications in agriculture due to their antifungal activity and in the food industry for use as preservatives, food additives, and flavor modifying properties [3,4]. Moreover, due to their significant role in anti-cholesterol activity and other bioactive properties including antioxidant, antiviral, antimicrobial and anti-inflammatory activities, saponins have been widely used in the cosmetic and pharmacology industry [5].
In recent years quinoa (Chenopodium quinoa Willd.), a member of the Amaranthaceae family, has gained attention for its high nutritional content [6,7,8] and its tolerance to abiotic stresses [9,10,11], showing potential to become an alternative crop to cereals, for example in defined crop rotations or on marginal lands. However, C. quinoa seeds contain a mixture of triterpenoid saponins in the seed pericarp that leads to bitterness. Saponin accumulation is not only limited to seeds but also other to plant organs including leaves, flowers, and fruits. The saponins in C. quinoa are a commixture of triterpenoid glycosides which are mainly derivatives of oleanolic acid (OA), hederagenin (HD), serjanic acid (SA), and phytolaccagenic acid (PA) [12,13,14,15]. A fifth sapogenin was characterized as 3,23,30-trihydroxy olean-12-en-28 oic acid [16]. These sapogenins carry a hydroxy and carboxylic group at C-3 and C-28 position, respectively, which are linked to sugar units. Arabinose, glucose, and galactose are the major saccharides whereas glucuronic acid and xylose are present to a minor extent [16,17,18,19,20,21,22,23]. Up to the present, nearly 140 different triterpene saponins have been identified and annotated in C. quinoa seed samples [16,20,23,24]. Saponins confer a bitter flavor and, based on their content, C. quinoa varieties have been classified into “sweet-varieties” or “low saponin varieties” (<0.11% or <0.11 g/100 g FW, and ca of ≤0.6% or ≤6.0 mg/g of DW) and “bitter-varieties” or “high saponin varieties” (≥0.11% or ≥0.11 g/100 g of FW, and ca of ≥1.0% or ≥10.00 mg/g of DW) [6,25,26,27]. Since saponin compounds confer bitterness and other organoleptic properties to C. quinoa seeds, they must be removed before seeds can be used for human consumption. In general, saponins can be removed either by simple washing due to their amphiphilic nature or by a dehulling- abrasion process [23,28,29,30]. Because these processes consume water and require the use of dedicated machinery, the development of low saponin C. quinoa varieties is an important aim of current plant breeding programs. Today, several programs are in the process of developing saponin-free or low saponins varieties to be introduced in C. quinoa cultivation practice [31,32,33]. Saponin content in C.quinoa has been assessed routinely by hemolytic, gravimetric, and foam-based approaches [25,28,34]. However, these assays are mostly qualitative or at best semi-quantitative and are likely to lead to substantial errors resulting from overestimation or low recovery of saponins [34,35]. Therefore, recently, sophisticated technologies such as low-pressure lipid chromatography (LPLC), high-pressure liquid chromatography (HPLC), gas chromatography (GC), UV–vis spectroscopy, and gas chromatography-mass spectrometry (GC-MS) have emerged as appropriate methods for saponin separation and detection [20,23,24,26,36,37,38].
For plant breeding purposes, it is important to consider both the total saponin content and the individual saponin compounds. In the current study, we hypothesized that the abundance of saponins and their composition can differ depending on the ecotypes and genetic background. Therefore, we aimed at characterizing the extent of variability in saponin content among 114 Chilean C. quinoa accessions representing variations within the coastal-lowland and salares ecotypes. The C. quinoa diversity panel also included known varieties that have been previously characterized for their high or low saponin content, as positive and negative controls, respectively. Additionally, we focused on structure elucidation of saponins and on their fragmentation spectrum which enables detection of aglycones as well as sugar moieties and their positions in the saponins for these genotypes. These resources will be used in further studies to identify underlying genomic regions linked to saponins for future plant breeding efforts.
2. Materials and Methods
2.1. Chemicals
Oleanolic acid (OA) and Hederagenin (HD) were purchased from Sigma-Aldrich/Merck, (Darmstadt, Germany), and VWR, (Darmstadt, Germany), respectively. Silyl-991 (bis(trimethylsilyl)trifluoroacetamide (BSTFA)–trimethylchlorosilane (TMCS) (99:1)) was obtained from Chromatographie Service, (Langerwehe, Germany). Methanol (LC-MS grade), ethyl acetate, acetonitrile, water (LC-MS grade), pyridine, hydrochloric acid, sodium chloride, and sodium carbonate were supplied by VWR, (Darmstadt, Germany).
2.2. C. quinoa Diversity Panel
In the reported study the saponin content was evaluated in 114 different C. quinoa accessions including advanced breeding lines of the ongoing INIA’s Quinoa Breeding Program (IQBP) in Chile. The C. quinoa diversity panel used for the experimental work was initially selected based on morphological characteristics (i.e., plant height, branching growth habit, panicle height, panicle shape) and yield traits (i.e., seed yield, seed diameter), and subsequently established by the Instituto de Investigaciones Agropecuarias (INIA), Chile. The C. quinoa panel (AZ = Arid Zones) was obtained by a combination of mass selection, self–pollination of individual lines (through at least two seasons), and panicle-furrow selection. The entire C. quinoa panel belongs to the two groups of genotype that represent variations from two different biomes in Chile: the coastal-lowland and the salares ecotypes. Here, salares genotypes are under-represented compared to the coastal-lowland type. The C. quinoa diversity panel covered 7 genotypes (salares ecotype) from the Chilean Altiplano (highlands region), 2 south Altiplano genotypes from Cancosa area, alongside 102 genotypes from the Chilean coastal-lowland regions. Most of the genotypes were cultivated and harvested from the Huasco experimental station (28°3′ S, 70°4′ W). In the studied genotypes, we also included the known C. quinoa cultivars (cv.) Titicaca (moderate to high saponin content, drought, and salinity tolerant), Vikinga (low saponin content, and drought and salinity tolerant), and ATLAS (sweet cv) [26,36,39,40]. These cultivars were provided by Dr. Sven Erik Jacobsen from the University of Copenhagen, Denmark, and INIA, Chile, respectively. Detailed information on the diversity panel and the collection of C. quinoa lines is given in Table 1.

Table 1.
Accession name, seed source, and collection region of the C. quinoa lines studied for saponin content.
2.3. Extraction and Hydrolysis of Saponins from C. quinoa Germplasm
Saponins were indirectly quantified via their corresponding sapogenins derived from hydrolysis, according to Jarvis et al. [24]. Briefly, 50 mg ground C. quinoa seeds were suspended in 1 mL methanol then vortexed for 1 min and treated in an ultrasonic bath for 10 min. After centrifugation for 2 min at 14 °C at 14,000 rpm using Eppendorf mini-spin (Hamburg, Germany), 900 µL of supernatant was withdrawn. The remaining solvent including the pellet was extracted a second time as mentioned above and the withdrawn supernatant (1000 µL) was combined with the first. The supernatant was evaporated to dryness and the residue hydrolyzed using 2 mL of 2.5 N hydrochloric acid at 90 °C for 2 h. After the addition of 0.25 g of NaCl, the solution was extracted twice with 1 mL of ethyl acetate by vigorous vortexing for 1 min. The combined ethyl acetate extracts (800 and 900 µL) were treated with 0.25 g of sodium carbonate. After centrifugation 1 mL solution was withdrawn and evaporated to dryness. For derivatization, 1 mL acetonitrile, 100 µL Silyl-991, and 100 µL pyridine were added to the residue and heated to 90 °C for 1 h. Afterward, derivatized samples were analyzed by gas chromatography-mass spectrometry (GC-MS).
2.4. Quantification of Sapogenins by Gas Chromatography-Mass Spectrometry (GC-MS) Analysis
The GC-MS system consisted of an Agilent 7890B gas chromatography and 7693 autosampler (Santa Clara, CA, USA) as well as a Jeol JMS-T200GC AccuTOF GCx mass spectrometer (Tokyo, Japan). Analytes were separated on a Zebron ZB-5 HT Inferno column (30 m × 0.25 mm i.d., 0.25 μm film thickness) (Phenomenex, Torrance, CA, USA). Helium was used as carrier gas at a constant gas flow of 1.0 mL/min. The oven temperature program employed for the analysis of silylated sapogenins was as follows: 180 °C (1 min), with 6 °C/min to 350 °C (3 min). The injector temperature was held at 340 °C, and all injections (1 µL) were made in the split mode (1:10). The mass spectrometer was used in the electron impact (EI, 70 eV) mode and scanned over the range m/z 35–750 with a sampling interval of 0.25 ns and a recording interval of 0.4 s. The GC interface and ion chamber were kept at 340 °C and 250 °C, respectively. Data processing was performed by use of the software MSAxel (Jeol) and XCalibur 2.0.7 (ThermoFisher Scientific, Waltham, MA, USA). Analysis of each quinoa genotype/cultivar was performed in duplicate. Quantification was done by the method of external calibration with standard solutions in the concentration range 25–200 µM. As phytolaccagenic acid (PA) was not commercially available, its quantification was carried out based on a linear regression equation with HD. This method was justified because of almost congruent regression lines for OA and HD.
2.5. Identification of Saponins by LC-FTICR-MS and LC-MS/MS
Liquid chromatography-Fourier transform ion cyclotron resonance mass spectrometry (LC-FTICR-MS) experiments were carried out using an Agilent 1200 series HPLC system consisting of a binary pump, autosampler, and column oven (Santa Clara, CA, USA). Saponins from the extraction with methanol (Section 2.3) were separated on an Aqua 3 µm C18 column (150 × 2 mm, 3 μm particle size) equipped with a pre-column filter from Phenomenex (Waltham, MA, USA). The mobile phase consisted of 1 mM aqueous ammonium acetate (A) and methanol + 1 mM ammonium acetate (B). Samples were separated at 40 °C and a flow rate of 0.3 mL/min using gradient elution: isocratic at 90% A for 1 min, linear gradient to 1% A over 29 min, isocratic at 1% A for 10 min, linear gradient to 90% A over 1 min and equilibration at 90% A for 4 min (total run time: 45 min). The injection volume was 10 µL. Mass spectrometry was performed using a hybrid linear ion trap-FTICR-mass spectrometer LTQ-FT Ultra (ThermoFisher Scientific, Waltham, MA, USA) equipped with a 7 T supra-conducting magnet. The electrospray ionization (ESI) source was operated in the negative mode with a spray voltage of 2.80 kV. Nitrogen was employed as both sheath gas (8.0 arbitrary) and auxiliary gas (0 arbitrary). The transfer capillary temperature was set to 275 °C. Voltages for capillary and tube lens were set to −33 V and −135 V, respectively. Mass spectra were recorded in a full scan from 150 to 1500 Da with a mass resolution of 100,000 at m/z 400 (full width at half maximum). The automatic gain control for providing a constant ion population in the ICR cell was set to 5E5 for the FTMS full scan mode. The maximum ion trap fill time was set to 10.0 ms and the maximum ICR cell fill time to 500 ms. The accurate masses of quasi-molecular ions [M–H]− were used for the calculation of chemical formulae with the Qual Browser in Xcalibur software version 2.0.7. The search algorithm contained the isotopes 1H, 12C, 13C, and 16O. Each compound had to be represented by 3 mass peaks: the base peak and the peaks of the corresponding 13C- and 13C2-isotopologues. Search results were restricted to mass errors of 3.0 ppm for the 12C- and the corresponding 13C- and 13C2-isotopologues.
Liquid chromatography-tandem mass spectrometry (LC-MS/MS) was carried out on a Waters ACQUITY® UHPLC system (binary pump, autosampler) coupled to a Waters Xevo TQ-S® triple-quadrupole mass spectrometer (Waters Technologies Corp., Milford, MA, USA). Separation of saponins from the extraction with methanol (Section 2.3) was achieved on a Nucleoshell RP18 column (100 × 4.6 mm., 2.7 µm.; Macherey-Nagel, Düren, Germany). The column was equipped with a pre-column (Macherey–Nagel, Düren, Germany). The mobile phases were water (A) and acetonitrile (B) each containing 0.1% formic acid, at a flow rate of 1.0 mL/min. The gradient program was as follows: 85% A, to 15% A within 20 min, back to 85% A within 0.1 min, and holding for 2.9 min. The injection volume was 10 µL. The electrospray ionization (ESI) interface of the mass spectrometer was driven in the negative mode. The capillary voltage was set to 2.0 kV. The cone voltage was 35 V. The desolvation temperature and source temperature were 600 °C and 150 °C, respectively. The desolvation gas flow was set to 1000 L/h and the cone gas flow at 150 L/h using nitrogen in both cases. MS/MS spectra were obtained in the daughter ion scan mode on precursor ions which were determined by LC-FTICR-MS before. Nitrogen was used as the collision gas at a flow of 0.15 mL/min and ionization voltage was set to 30 and 50 eV, respectively.
2.6. Statistical Analysis
All analyzed results are reported as mean ± standard deviation (SD) values of the independent sample extractions (n = 4). To determine the significant difference in saponin content among C. quinoa accessions, the dataset was analyzed as a one-way analysis of variance ANOVA (Tukey’s-Honestly Significant Difference multiple comparisons) using the R-package Agricolae [41]. A p-value ≤ 0.05 was considered as a statistically significant difference. Principal component analysis (PCA) and cluster analysis were done for the complete dataset to present the entire correlation distance matrix, and to group according to specific variables. Hierarchical clustering was performed based on the Euclidean distance and complete grouping method using PCA scores. The genotypic effect was defined according to a linear additive model:
where yij is the phenotypic value measured for the trait y on the plant j of the genotype i; μ corresponds to the overall mean; Gi is the random effect of genotype i representing the effect of each genotype or genotypic effect on trait y, and εij is the random residual error per plant j of the genotype i. Vg was estimated according to the restricted maximum likelihood (REML) variance components using the lme4 library of R [42]. The significance of the effects was assessed using the Akaike and Bayesian criteria and tested by the likelihood ratio.
3. Results and Discussion
3.1. Extraction and Quantification of Triterpenoid Saponins in C. quinoa Germplasm
Saponin content in C. quinoa seeds was evaluated in terms of their sapogenins (aglycons) derived from hydrolysis of seed samples. In total 114 different C. quinoa genotypes including breeding lines from the INIA breeding program and cultivars were analyzed for saponin content. Quantification of sapogenins was carried out by use of external calibration curves for OA and HD. For this analysis, standard solutions were prepared over a concentration range of 25–200 µM which were similar to those in the extracts. The obtained correlation coefficients (r2) were in the range of 0.986–0.999. Next, the calibration curve of HD was used for the quantification of PA since the calibration curves of OA and HD were almost identical.
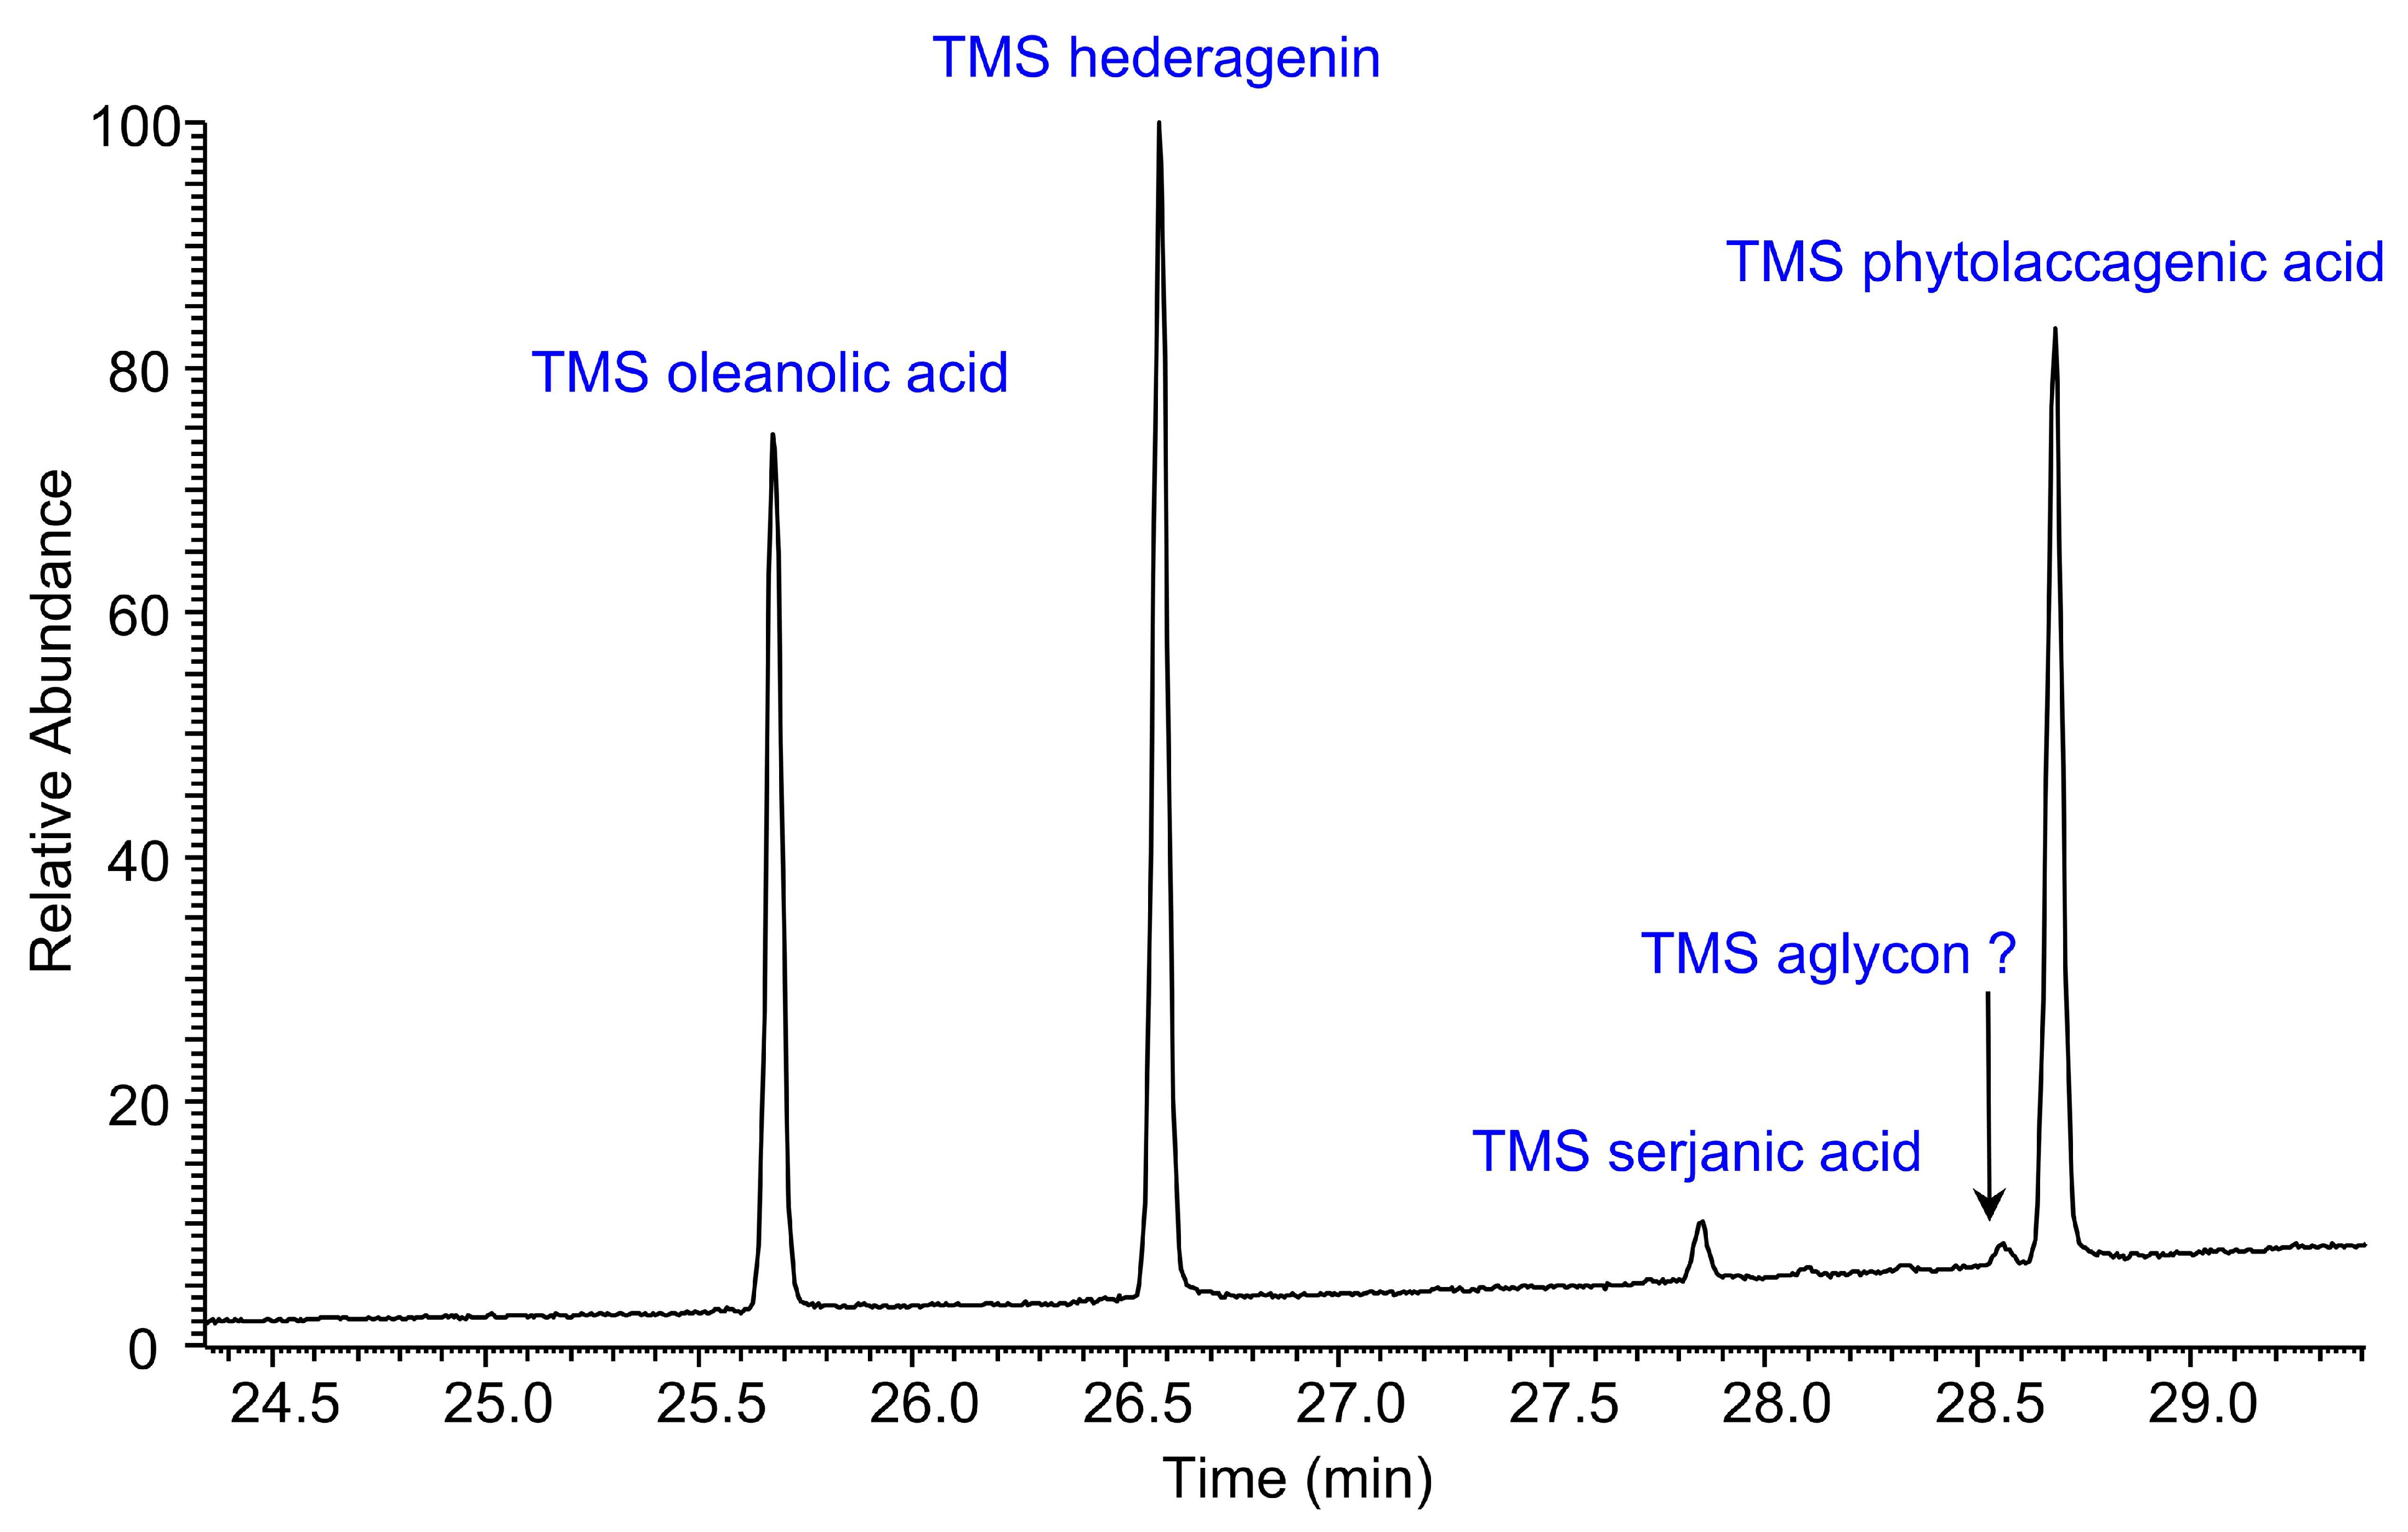
The ion mass chromatogram of silylated sapogenins from C. quinoa obtained by GC-MS is shown in Figure 1. The gas chromatogram shows three main and two minor peaks. Four of them could unambiguously be identified as silylated OA, HD, SA, and PA by comparison of their retention times (25.7, 26.6, 27.9, and 28.7 min, respectively) and mass spectra to the standard compounds and published data, respectively [15,26,36]. The mass spectrum of the fifth sapogenin was insufficient to obtain any information about its structure. Mass spectra of silylated sapogenins are characterized by very low abundances of their molecular peaks M+. Fragmentation reactions mainly occurred under the elimination of CH3, Me3SiO(H), and Me3SiOOCH. Further, the mass spectrum peaks of TMS-OA were detected at m/z 600 (M+), 585 (M+ - Me), 482 (M+ - Me3SiOOCH), and 393 (M+ - Me3SiOOCH - Me3SiO). TMS-HD fragment ions were found at m/z 688 (M+), 673 (M+ - Me), 570 (M+ - Me3SiOOCH), and 481 (M+ - Me3SiOOCH - Me3SiO). The fragmentation pattern of TMS-SA was found at m/z 644 (M+), 629 (M+ - Me), 554 (M+ - Me3SiOH), 526 (M+ - Me3SiOOCH), and 467 (M+ - Me3SiOOCH - MeOCO). TMS-PA peaks were spotted at m/z 732 (M+), 717 (M+ - Me), and 614 (M+ - Me3SiOOCH). These mass spectra are similar to those in the literature [15,26,36,43].

Figure 1.
Ion mass chromatogram of trimethylsilylated sapogenins from C. quinoa obtained by GC-MS. GC-MS chromatogram profile shows the separated sapogenins from C. quinoa seed extract. Saponins were quantified by indirect quantification of their corresponding sapogenins derived from the hydrolysis of saponins from C. quinoa seed. Mass spectra of silylated oleanolic acid, hederagenin, serjanic acid, and phytolaccagenic acid were assigned by comparison of retention times (25.7, 26.6, 27.9, and 28.7 min, respectively) and mass spectra to the corresponding standards.
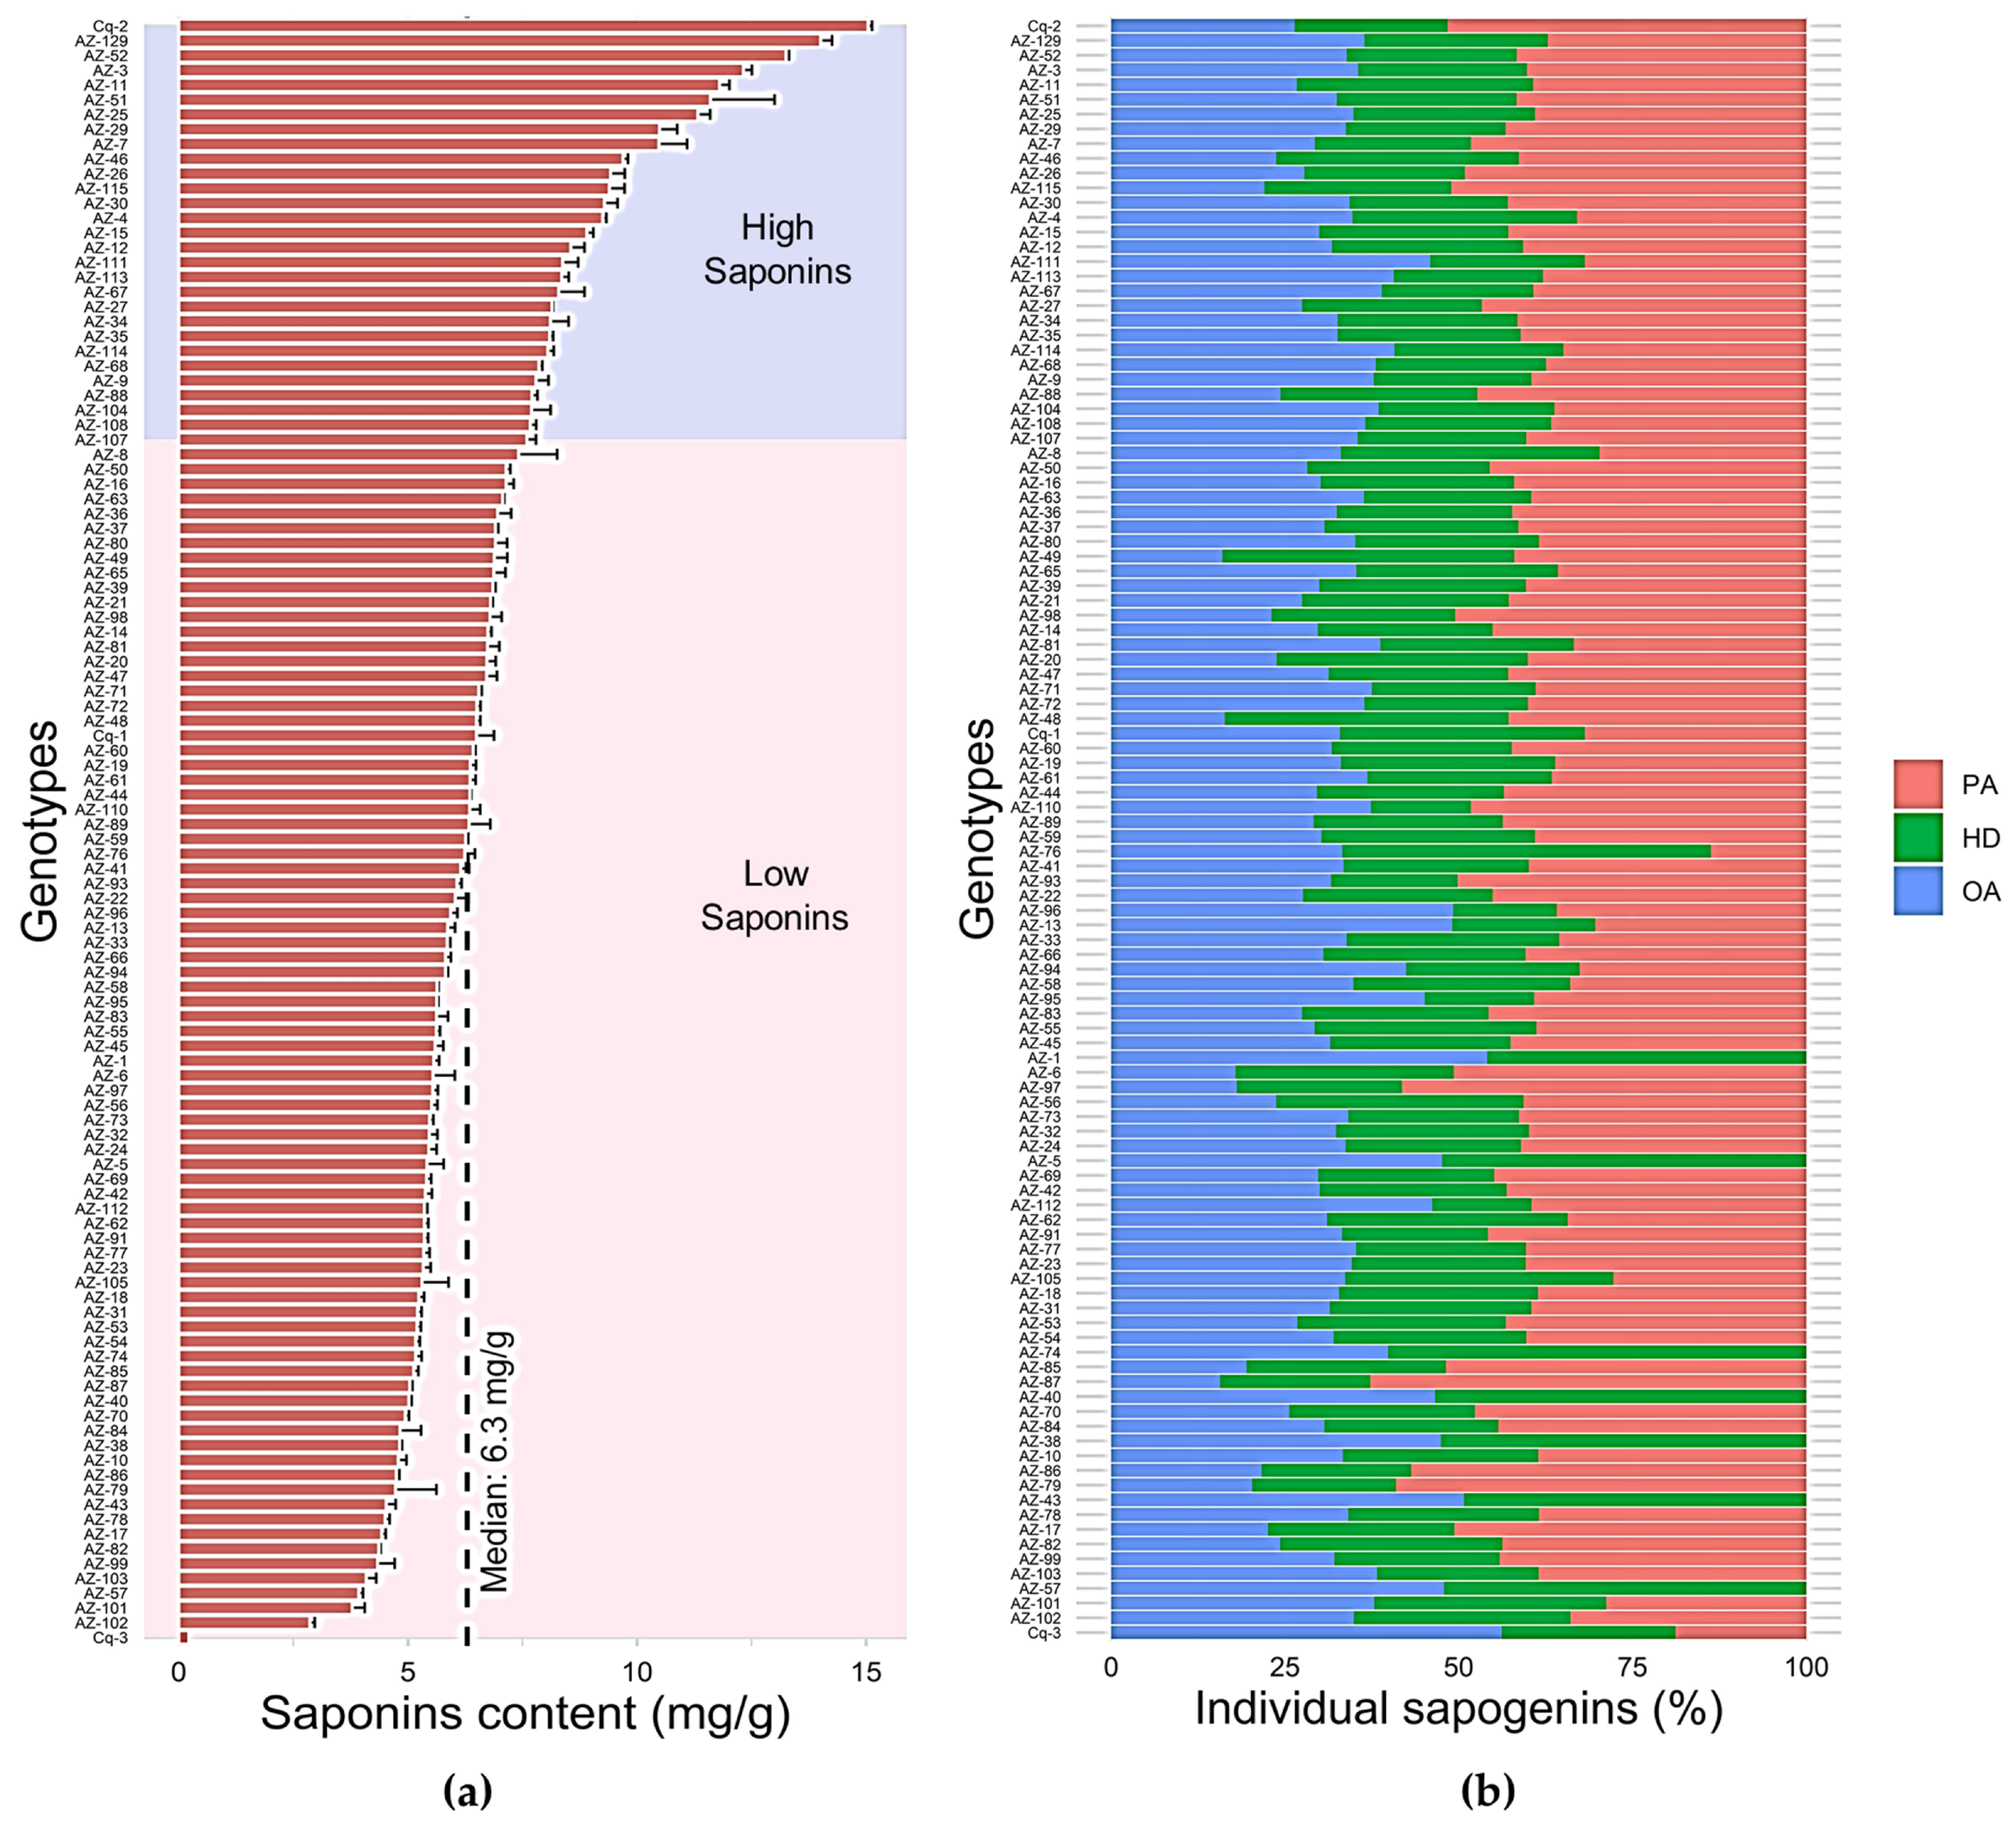
Because saponin content was, to our knowledge, never determined in earlier work, with a few exceptions, for the studied genotypes originating from Chile direct comparisons with previously published values are not currently possible for the whole dataset. However, we were able to compare our results with previously published data for the positive and negative control lines. Certain quinoa lines (AZ-18, AZ-26, AZ-47, AZ-51, AZ-62, AZ-78, AZ-97, AZ-98, and AZ-99) are advanced breeding lines of IQBP. In our experiment, 26.3% of the genotypes were noted as high saponin quinoa lines, whereas 73.6% of the genotypes were noted as low saponin quinoa lines. The relative saponin content among the genotypes studied ranged from 0.22 mg/g to 15.04 mg/g of seed dry weight. We found that variation in total saponin content was highly significant (p < 0.001) (Figure 2a, Tables S1 and S2). Considering the breeding lines we studied (Table 1), AZ-51 and AZ-26 revealed a high content of saponins with 11.60 mg/g and 9.42 mg/g of seed dry weight, respectively. In contrast, the remaining breeding lines had lower saponin content in the range of 4.33 mg/g to 6.79 mg/g of seed dry weight (Figure 2a, Table S1). Furthermore, the Danish cultivar Titicaca (Cq-2) showed very high saponin content with a concentration of 15.04 mg/g of seed dry weight among all genotypes. We detected a higher concentration of PA with 7.76 mg/g of total saponins in comparison to other sapogenins in this cultivar (Table S1). Our data is comparable with data from Medina-Meza et al. [26] in which the Titicaca variety had an average total saponin content of 16.75 mg/g. Additionally, another study also revealed a high percentage of PA compared with the other sapogenins OA and HA in the bitter variety Titicaca, which is also in agreement with our result [39]. For the few previously investigated C. quinoa genotypes, total average saponins among Cáhuil accessions AZ-4, AZ-18, AZ-103, and AZ-104 were 9.24 mg/g, 5.23 mg/g, 4.08 mg/g, and 7.69 mg/g of seed dry weight, respectively. The reported average amount of saponins in this coastal-lowland Chilean genotype was comparable to the average values reported by Medina-Meza [26] and Ward [35] (10.95 mg/g and 4.65 mg/g, respectively). However, the average saponins amount for the Cáhuil genotype in our case was higher compared with the one reported in another study (0.39 mg/g of saponins) [44]. Possible differences in the variation in total saponins reported in various studies might occur due to numerous factors including agronomical and environmental conditions as well as the handling of the standardized procedures that have been used for the extraction and quantification of saponins. Concerning these points, the seeds of the Cáhuil genotype used in Medina-Meza’s and Ward’s experiments have been cultivated at different experimental locations in the United States. Furthermore, in Miranda’s experiment, saponins were analyzed based on an HPLC procedure although seeds of the Cáhuil genotype were all collected in Chile. Moreover, another central Chilean genotype, FARO (AZ-31 and AZ-32) showed on average 5.33 mg/g of total saponins. This value was higher compared with the one found by Miranda’s study [44] (~0.30 mg/g of total saponins). Similarly, Cancosa corresponding to south Altiplano ecotype (AZ-3, AZ-5) and south Chilean coastal-lowland ecotypes from Villarrica locality (AZ-19, AZ-20) contained on average 8.87 mg/g and 6.53 mg/g of saponins, values which were higher than those reported by Miranda [44] (~0.20 mg/g and 0.89 mg/g), respectively. Such contradictory results relating to the amount of saponins can be concerned with the fact that in Miranda’s study the characterization of saponins was carried out based on the reversed-phase HPLC approach. In the studied low saponins cultivar that we included as negative controls, Vikinga (Cq-1) showed an average saponin content of 6.49 mg/g of seed dry weight, which is lower than 1% of total saponins. The relative concentration of sapogenins OA and HD in Vikinga were detected in a 1:1 ratio, while the concentration of PA was in comparison slightly lower than OA and HD (Table S1). This result is nearly identical to the findings of a previous study where the authors reported a 1:1 OA:HD ratio with a relatively low amount of PA in Vikinga [39]. Among the entire panel of genotypes, we found that cv ATLAS (Cq-3) had a very low amount of saponins, as expected (0.22 mg/g of seed dry weight). The GC-MS chromatogram of this variety had 56.2% and 24.9% of OA and HD, respectively, while PA was 18.8% of total sapogenins (Figure 2b). This result implies a high ratio of OA:HD. This result can be explained by the fact that a high ratio of OA to HD is connected, to some extent, with the sweetness of seeds and a low ratio, to some extent, with the bitterness of seeds [14,39].
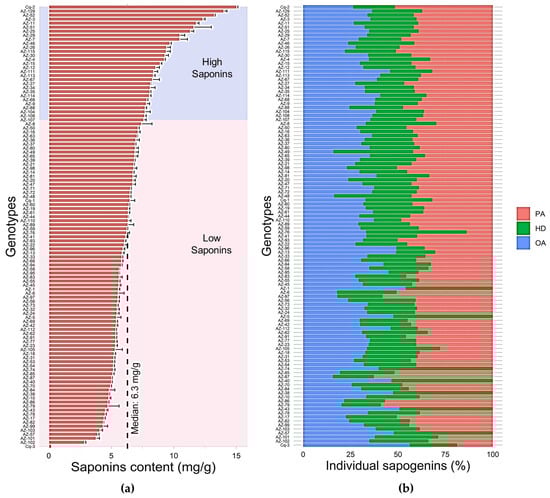
Figure 2.
Total saponin content (a) and percentage of individual sapogenins (b) in the C. quinoa panel. (a) A bar graph showing relative saponin content in different C. quinoa accessions. Quantification of saponins was indirectly performed via their corresponding sapogenins. Analyzed data are reported as mean ± standard deviation of independent sample extractions. Statistical analysis was performed by ANOVA test (Tukey’s ± HSD, α = 0.05). A significant difference (p < 0.001) in relative saponin content was noticed and saponins concentration ranged from 0.22 mg/g to 15.04 mg/g of seed DW. The median line shows the average of the total saponin content of all studied genotypes. (b) Stacked bar graph showing individual sapogenins and outlined in % of total saponins. Light blue: Oleanolic acid (OA), Green: Hederagenin (HD), and Light red: Phytolaccagenic acid (PA).
Our GC-MS results show that PA was the main compound of sapogenins as such representing 38.4% of the total saponin content followed by OA and HD with 33.0% and 28.6%, respectively (Figure 2b). This result is very similar to other previous experiments where PA was reported as the main class of sapogenins (42–43%) followed by OA (30%–34%) and HD (24–27%) in coastal-lowland ecotypes [15]. Overall, we found a positive correlation between PA and total saponins (p < 0.001, r = 0.854; (Figure S1), as previously reported [26]. It has been also noted that bitterness of C. quinoa seeds can be linked with a higher content of PA, whereby sweet C. quinoa genotypes have low or no apparent PA content [26,39,45]. However, in other studies, OA was identified as the main class of sapogenins in C. quinoa [14,36]. The variation in the relative amount of sapogenins can be linked with cross-pollination, which has been noted up to 9.9% in the C. quinoa, and its accumulation in the various portion of the grain [14,46].
In general, results revealed that the seven C. quinoa genotypes Cq-2, AZ-3, AZ-11, AZ-25, AZ-51, AZ-52, AZ-129 had a total saponin content above the threshold percentage (>1%) among the genotypes we studied in this experimental trial. We adopted this empirical threshold based on a prior study [26]. Thus, these genotypes can be categorized as bitter genotypes and need to be passed through the post-harvesting process to remove saponins before products can be used for human consumption. Besides, 22 genotypes (AZ-4, AZ-7, AZ-9, AZ-12, AZ-15, AZ-26, AZ-27, AZ-29, AZ-30, AZ-34, AZ-35, AZ-46, AZ-67, AZ-68, AZ-88, AZ-104, AZ-107, AZ-108, AZ-111, AZ-113, AZ-114, AZ-115) showed total saponins level near to this threshold percentage (close to 1%), and these can also be considered as high saponin content genotypes. The other genotypes with a lower percentage of total saponin content, i.e., below the median of ca 0.6%, can be classified as low saponins genotypes. Among all genotypes and cultivars, ATLAS (Cq-3) can be classified as a sweet genotype due to its very low percentage of total saponin content. This complete assessment was similar to that of a previous study [26].
3.2. Evaluation of Triterpenoid Saponins of C. quinoa Seeds
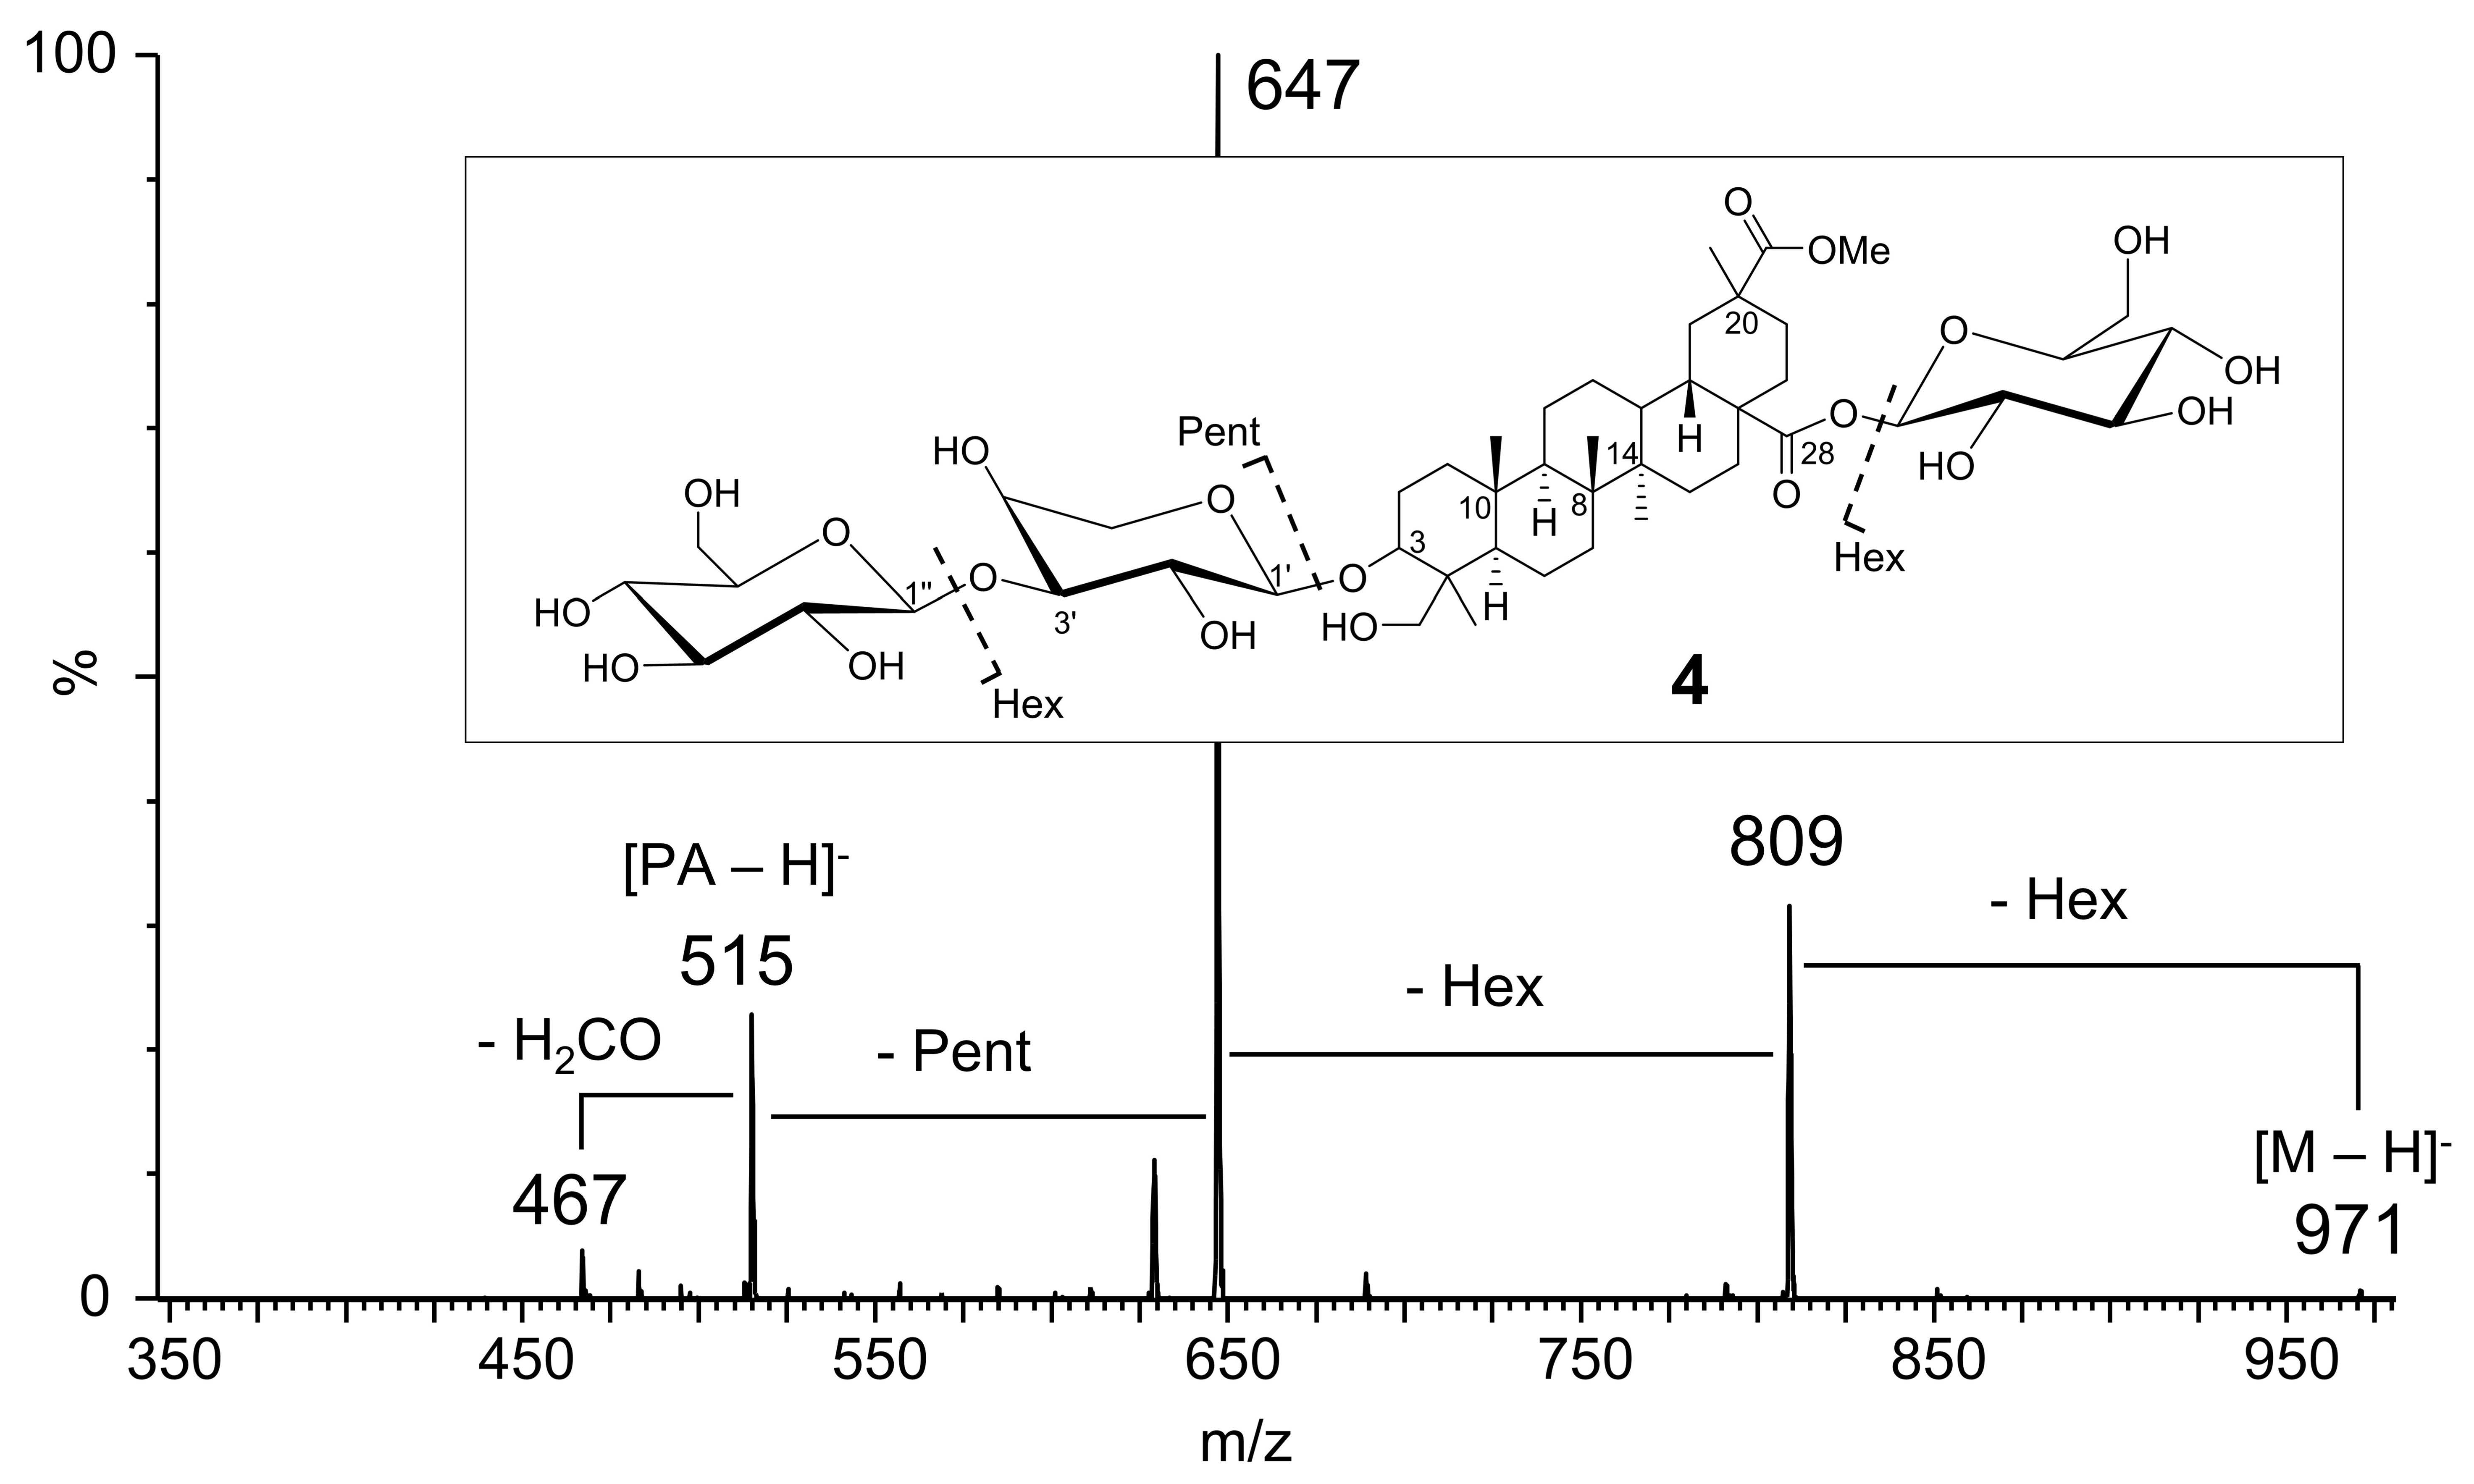
Saponins not only confer bitterness but also comprise various biological activities which include cytotoxic, immunomodulatory, hepatoprotective, antidiabetic, hypolipidemic, antiosteoporosis, antiviral, antifungal, and anthelmintic actions [47]. Therefore we also characterized saponins from C. quinoa choosing the following analytical approach. First, saponins were separated by HPLC (Figure 3) and detected by high-resolution FTICR-MS in the full scan mode. The high accurate masses obtained allowed the calculation of chemical compositions with mass deviations lower than 3.0 ppm. Additional calculation of the corresponding 13C- and 13C2-isotopologues confirmed their correctness. In consideration of the molecular ion adduct [M-H]− formed by ESI (-) ionization, molecular formulas had been derived. In the second step, LC-MS/MS was used to obtain product ion spectra from the formerly determined precursor ions [M-H]− and additionally the corresponding formate adducts [M + FA-H]−. The fragmentation patterns were used to identify the aglycones as well as the types of sugar and their sequence in the saponins. Out of the 12 identified saponins, 11 had been previously reported (Table 2). Compound 8 was assigned as a novel saponin. The product ion spectrum of compound 4 (Figure 4) chosen as an example for the other saponins is characterized by gradual neutral losses of sugar units representing their sequence and the aglycone-specific product ion m/z 515, [PA-H]−. The initial fragmentation of 4 (m/z 971) resulted in m/z 809, corresponding to [M-H-162]− or the loss of a hexose residue. The loss of 28-O-linked hexose was also observed for nine other saponins, as this is the energetically favored fragmentation pattern, in comparison to 3-O-linked saccharides [16]. However, compounds 11 and 12 differ from that pattern displaying loss of pentose [M-H-132]− as the initial step. This result might be due to the negative ESI mode, whereas published data are based on ESI (+) conditions [16]. Another possibility is a 28-O-linked pentose instead of hexose which has not been described in the literature so far. The majority of saponins bore the common aglycons OA (m/z 455), HD (m/z 471), SA (m/z 499), and PA (m/z 515). Compound 2 showed an aglycone at m/z 485 which suggests a structure similar to HD but with ethyl instead of a methyl group at C-20 [16].
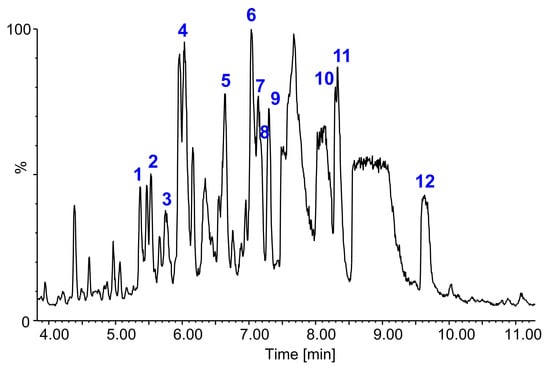
Figure 3.
LC-ESI (-)-MS chromatogram of saponins from seeds of quinoa genotype AZ-129. Available saponins in seeds of quinoa accession AZ-129 were detected by FTICR-MS. The LC-MS chromatogram shows separated saponins obtained from quinoa seeds after extraction with methanol. The saponins 1 to 12 are assigned in Table 2.
Table 2.
Existing triterpenoid saponins from seeds of C. quinoa accession AZ-129.

Figure 4.
Product ion spectrum on [M-H]− of compound 4 (m/z 971), which was identified in genotype AZ-129. The fragment ion series m/z 809, 647, and 515 show the consecutive loss of sugar units from the saponin as is indicated in the inserted structural formula. The fragment ion m/z 515 is characteristic of phytolaccagenic acid as the aglycon.
3.3. Principal Component Analysis and Clustering
Principal component analysis (PCA) was performed to find a small number of linear orthogonal combinations of all variables that captured the greatest amount of variation present in our dataset as a whole. The overall dataset of total saponins and individual sapogenins was used to outline the main axes of the principal component analysis.
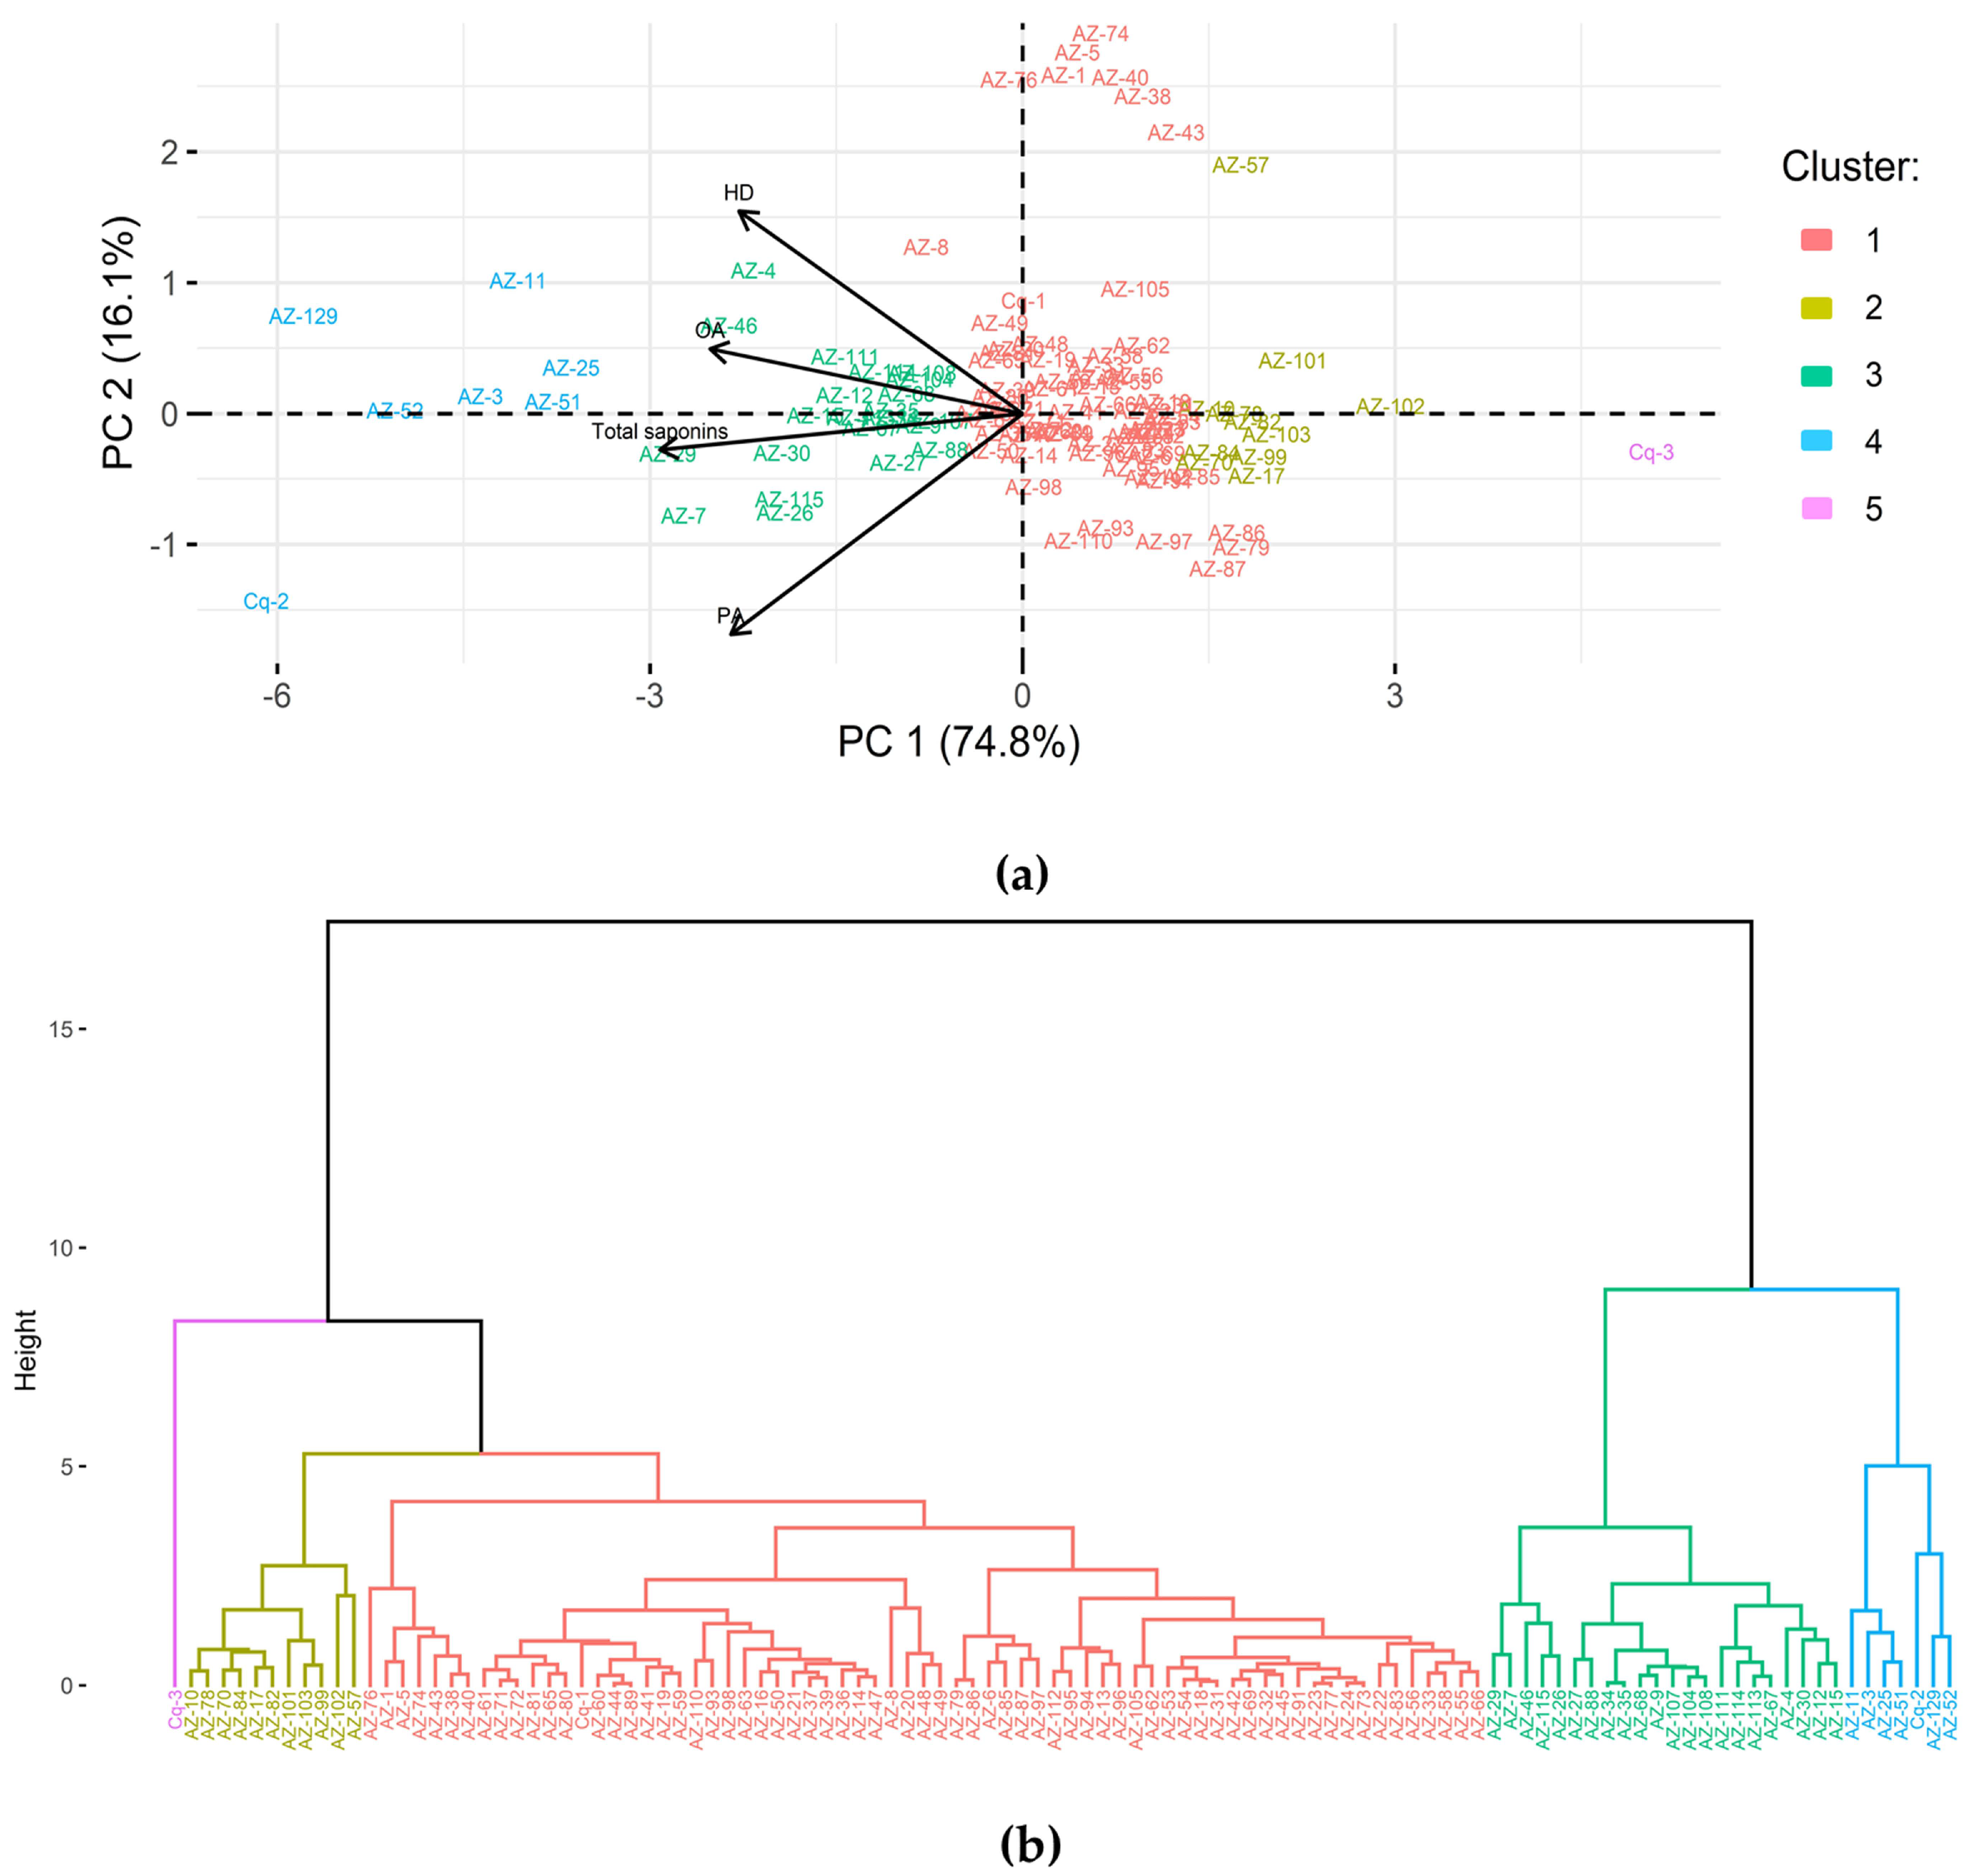
The PCA analysis revealed 74.8% of the variation for PC1 and 16.1% of the variation for PC2 among all C. quinoa genotypes studied (Figure 5a). As stated in Figure 5a, the total saponin content is well described by PC1, while the content of OA and HD are well described by PC2. Further, cluster analysis was done based on the Euclidean distance and complete grouping method using the PCA score (Figure 5b). The data output of each variable and for each of the genotypes grouped into two major clusters in proportion to the total saponin content. Based on the PCA score, cluster 4 had the lowest value for PC1. Since the main component of PC1 was negatively correlated with the PA and total saponin content, cluster 4 grouped the genotypes that have a high content of saponins. Cluster 3 pooled those genotypes that had a high amount of PA compared to the rest of the genotypes from other clusters, except cluster 4. On the contrary, cluster 5 contained a very low score PA and total saponins, which confirms the known genotypes with extremely low saponin content. Further, the remaining clusters (clusters 2 and 1) showed scattering near the core boundary of PC2. These clusters grouped those genotypes characterized with low PA contents, and thus low saponin content. Figure 5 shows uninterpreted divergence among sub-groups of the major two groups without clear separation. Interpretation of the high saponins cluster showed consistent variation within and among sub-groups, which represented accessions from both salares and coastal-lowland ecotypes (and regions). Moreover, the low saponin content genotypes scattered at a close-range distance compared with the genotypes that had high saponin content. The low saponins cluster segregated into PC1, including accessions from the coastal-lowland region and European cultivars. However, sub-groups shared some accessions from salares (AZ-14 and AZ-17) and south-altiplano (AZ-5). These data revealed an interpolation of coastal-lowland and salares genotypes in both PCA and dendogram analysis. An interpolation of genotypes in two major clusters could likely be due to the genetic similarity between highland and coastal-lowland C. quinoa genotypes [48]. Another study also revealed the existing genetic diversity within and among the different C. quinoa genotypes from different biomes of Chile, and such genetic diversity could be a primary reason for this possible variation in saponin content [49]. Therefore, it is interesting to study the genetic background of these accessions to understand potential genomic variation resulting in relative saponin content in C. quinoa.
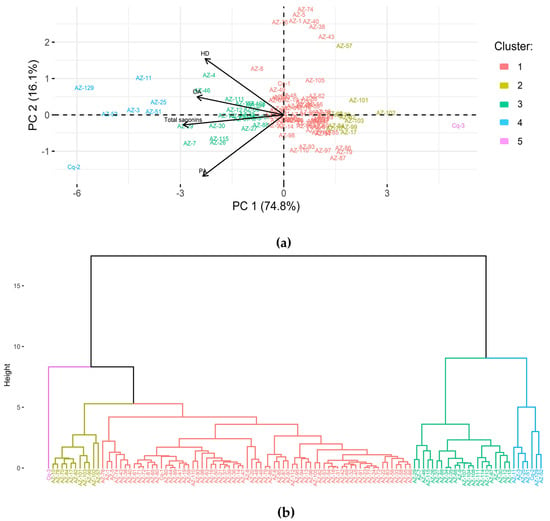
Figure 5.
Principal component analysis (a) and hierarchical cluster (b) of triterpenoid saponins of C. quinoa. Bi-plot showing that two main components PC1 and PC2 explained 90.9% of the total variation in saponin content. Arrows represent each variable and the length of arrows approximates the variance of the variables, whereas the angle between arrows indicates their correlation. The scores of each quinoa genotype are outlined as points. The distance between each point explains how similar the observations are to each other. The cluster colors correspond to the cluster numbers in the legend of a panel (a).
3.4. Variance by the Genotypic Effect
To estimate the effect of genetic diversity pattern, the percentages of variance explained by genotypic effect (Vg) in the total phenotypic variance for saponin content were estimated using a mixed linear model. This variance explained by genotypic effect (Vg) was calculated according to the restricted maximum likelihood (REML) variance components using the lme4 library of R [42]. As a result, we found a significant genotypic effect (p ≤ 0.05) which shows that each genotype expresses the phenotype of the measured traits differently, i.e., there is a genetic diversity that would explain the variation of saponin content. The significant effect of genotype represented by Vg validated the existence of genetic diversity up to 94.5% within the tested population for saponin content (Table S3).
4. Conclusions
Conclusively, the GC-MS profiling addressed the high degree of significant variance in relative saponin content, which ranges from 0.22 mg/g to 15.04 mg/g among the 114 different C. quinoa genotypes. In total 29 genotypes were categorized as high saponin content, and thus require the removal of saponins before products can be used for human consumption, while the rest of the genotypes were categorized as low-saponins or saponin-free lines. In this study, PA was reported as a prominent sapogenin, among others. Overall cluster data revealed uninterpreted divergence among sub-groups of the major two groups without clear separation. These dissimilarities in the sapogenins can be attributed to the existing genetic diversity in C. quinoa. The high percentages of variance explained by genotypic effect (Vg) in the total phenotypic variance for saponin content confirmed the existing diversity in terms of saponin content, which could become a target for future plant breeding efforts based on these accessions. Linked to this consideration, further genetic investigation such as using genome-wide association studies (GWAS) will be used in future studies to identify underlying genomic regions linked with saponin content to be employed in plant breeding of quinoa through marker-assisted selection.
Supplementary Materials
The following are available online at https://www.mdpi.com/article/10.3390/agronomy11091867/s1, Figure S1: Pearson’s correlation heat map of total saponins and individual sapogenins, Table S1: Total saponin content (mg/g) in C. quinoa lines, Table S2: Tukey’s-HSD multiple comparisons for saponin content, Table S3: Variance by genotypic effect.
Author Contributions
Conceptualization, A.P., B.T. and F.F.; methodology, software, validation, A.P. and B.T.; formal analysis, A.P.; investigation, resources, A.P.; data curation, A.P. and B.T.; writing-original draft preparation, A.P.; writing-review and editing, A.P. and B.T.; review and editing, F.F., A.Z.-S. and B.U.; visualization, A.P.; supervision, B.T. and F.F.; project administration, F.F. and B.U.; funding acquisition, F.F. and B.U. All authors have read and agreed to the published version of the manuscript.
Funding
We thank the BMBF for funding the “Quinoa Diversity” project (Fkz. 031B0239) under the Bioeconomy International funding scheme.
Institutional Review Board Statement
Not applicable.
Informed Consent Statement
Not applicable.
Data Availability Statement
The data presented in this study are available on request from the corresponding author or other co-authors.
Acknowledgments
We delight to express our thanks towards, Dalma Castillo, and Christian Alfaro at the Instituto de Investigaciones Agropecuarias (INIA) for providing the C. quinoa diversity panel and other required information in regard to the C. quinoa lines. We are also warmly grateful to Sven-Erik Jacobsen at the University of Copenhagen for providing us the known C. quinoa cultivars Titicaca and Vikinga. We also thank Nathalie Wuyts, José Correa, Uwe Rascher, Ingar Janzik, and Kathryn Dummschott for their creative suggestions and valuable support to conduct the experiments.
Conflicts of Interest
The authors declare no conflict of interest.
References
- Vincken, J.P.; Heng, L.; de Groot, A.; Gruppen, H. Saponins, classification and occurrence in the plant kingdom. Phytochem 2007, 68, 275–297. [Google Scholar] [CrossRef]
- Cheok, C.Y.; Salman, H.A.K.; Sulaiman, R. Extraction and quantification of saponins: A review. Food Res. Int. 2014, 59, 16–40. [Google Scholar] [CrossRef]
- Stuardo, M.; Martin, R.S. Antifungal properties of quinoa (Chenopodium quinoa Willd.) alkali treated saponnins against Botrytis cinerea. Ind. Crop. Prod. 2008, 27, 296–302. [Google Scholar] [CrossRef]
- FAO & CIRAD. State of the Art Report of Quinoa in the World in 2013; Bazile, D., Bertero, D., Nieto, C., Eds.; FAO & CIRAD: Rome, Italy, 2015. [Google Scholar]
- Güclü-Üstündag, Ö.; Mazza, G. Saponins: Properties, applications and processing. Crit. Rev. Food Sci. Nutr. 2007, 47, 231–258. [Google Scholar] [CrossRef] [PubMed]
- Vega-Galvez, A.; Miranda, M.; Vergara, J.; Uribe, E.; Puente, L.; Martinez, E.A. Nutrition facts and functional potential of quinoa (Chenopodium quinoa Willd.), an ancient Andean grain: A review. J. Sci. Food Agric. 2010, 90, 2541–2547. [Google Scholar] [CrossRef] [PubMed]
- Rodríguez Gómez, M.J.; Matías Prieto, J.; Cruz Sobrado, V.; Calvo Magro, P. Nutritional characterization of six quinoa (Chenopodium quinoa Willd) varieties cultivated in Southern Europe. J. Food Compos. Anal. 2021, 99, 103876. [Google Scholar] [CrossRef]
- Mhada, M.; Metougui, M.L.; El Hazzam, K.; El Kacimi, K.; Yasri, A. Variations of Saponins, Minerals and Total Phenolic Compounds Due to Processing and Cooking of Quinoa (Chenopodium quinoa Willd.) Seeds. Foods 2020, 9, 660. [Google Scholar] [CrossRef]
- Adolf, V.I.; Shabala, S.; Andersen, M.N.; Razzaghi, F.; Jacobsen, S.E. Varietal differences of quinoa’s tolerance to saline conditions. Plant Soil 2012, 357, 117–129. [Google Scholar] [CrossRef]
- Hariadi, Y.; Marandon, K.; Tian, Y.; Jacobsen, S.E.; Shabala, S. Ionic and osmotic relations in quinoa (Chenopodium quinoa Willd.) plants grown at various salinity levels. J. Exp. Bot. 2011, 62, 185–193. [Google Scholar] [CrossRef] [Green Version]
- Jacobsen, S.E.; Mujica, A.; Jensen, C.R. The resistance of quinoa (Chenopodium quinoa Willd.) to adverse abiotic factors. Food Rev. Int. 2003, 19, 99–109. [Google Scholar] [CrossRef]
- Burnoufradosevich, M.; Delfel, N.E.; England, R. Gas chromatography-mass spectrometry of olealane-type and ursane-type triterpenes—Application to chenopodium-quinoa triterpenes. Phytochem 1985, 24, 2063–2066. [Google Scholar] [CrossRef]
- Cuadrado, C.; Ayet, G.; Burbano, C.; Muzquiz, M.; Camacho, L.; Cavieres, E.; Lovon, M.; Osagie, A.; Price, K.R. Occurence of saponins and sapogenols in andean crops. J. Sci. Food Agric. 1995, 67, 169–172. [Google Scholar] [CrossRef]
- Mastebroek, H.D.; Limburg, H.; Gilles, T.; Marvin, H.J.P. Occurrence of sapogenins in leaves and seeds of quinoa (Chenopodium quinoa Willd). J. Sci. Food Agric. 2000, 80, 152–156. [Google Scholar] [CrossRef]
- Ridout, C.L.; Price, K.R.; Dupont, M.S.; Parker, M.L.; Fenwick, G.R. Quinoa saponins—Analysis and preliminary investigations into the effects of reduction by processing. J. Sci. Food Agric. 1991, 54, 165–176. [Google Scholar] [CrossRef]
- Madl, T.; Sterk, H.; Mittelbach, M. Tandem mass spectrometric analysis of a complex triterpene saponin mixture of Chenopodium quinoa. J. Am. Soc. Mass Spectrom. 2006, 17, 795–806. [Google Scholar] [CrossRef] [Green Version]
- Dini, I.; Schettino, O.; Simioli, T.; Dini, A. Studies on the constituents of Chenopodium quinoa seeds: Isolation and characterization of new triterpene saponins. J. Agric. Food Chem. 2001, 49, 741–746. [Google Scholar] [CrossRef]
- Dini, I.; Tenore, G.C.; Dini, A. Oleanane saponins in “kancolla”, a sweet variety of Chenopodium quinoa. J. Nat. Prod. 2002, 65, 1023–1026. [Google Scholar] [CrossRef]
- Dini, I.; Tenore, G.C.; Schettino, O.; Dini, A. New oleanane saponins in Chenopodium quinoa. J. Agric. Food Chem. 2001, 49, 3976–3981. [Google Scholar] [CrossRef]
- Kuljanabhagavad, T.; Thongphasuk, P.; Chamulitrat, W.; Wink, M. Triterpene saponins from Chenopodium quinoa Willd. Phytochem 2008, 69, 1919–1926. [Google Scholar] [CrossRef]
- Mizui, F.; Kasai, R.; Ohtani, K.; Tanaka, O. Saponins from bran of quinoa, Chenopodium quinoa WILLD. II. Chem. Pharm. Bull. 1990, 38, 375–377. [Google Scholar] [CrossRef] [Green Version]
- Zhu, N.Q.; Sheng, S.Q.; Sang, S.M.; Jhoo, J.W.; Bai, N.S.; Karwe, M.V.; Rosen, R.T.; Ho, C.T. Triterpene saponins from debittered quinoa (Chenopodium quinoa) seeds. J. Agric. Food Chem. 2002, 50, 865–867. [Google Scholar] [CrossRef]
- El Hazzam, K.; Hafsa, J.; Sobeh, M.; Mhada, M.; Taourirte, M.; El Kacimi, K.; Yasri, A. An Insight into Saponins from Quinoa (Chenopodium quinoa Willd): A Review. Molecules 2020, 25, 1059. [Google Scholar] [CrossRef] [Green Version]
- Jarvis, D.E.; Ho, Y.S.; Lightfoot, D.J.; Schmockel, S.M.; Li, B.; Borm, T.J.A.; Ohyanagi, H.; Mineta, K.; Michell, C.T.; Saber, N.; et al. The genome of Chenopodium quinoa. Nature 2017, 542, 307–312. [Google Scholar] [CrossRef] [PubMed] [Green Version]
- Koziol, M.J. Afrosimetric estimation of threshold saponin concentration for bitterness in quinoa (Chenopodium quinoa Willd). J. Sci. Food Agric. 1991, 54, 211–219. [Google Scholar] [CrossRef]
- Medina-Meza, I.G.; Aluwi, N.A.; Saunders, S.R.; Ganjyal, G.M. GC-MS Profiling of Triterpenoid Saponins from 28 Quinoa Varieties (Chenopodium quinoa Willd.) Grown in Washington State. J. Agric. Food Chem. 2016, 64, 8583–8591. [Google Scholar] [CrossRef] [PubMed]
- Martinez, E.A.; Veas, E.; Jorquera, C.; San Martin, R.; Jara, P. Re-Introduction of Quinoa into Arid Chile: Cultivation of Two Lowland Races under Extremely Low Irrigation. J. Agro. Crop Sci. 2009, 195, 1–10. [Google Scholar] [CrossRef]
- Chauhan, G.S.; Eskin, N.A.M.; Tkachuk, R. Nutrients and antinutrients in quinoa seed. Cereal Chem. 1992, 69, 85–88. [Google Scholar]
- Gomez-Caravaca, M.A.; Iafelice, G.; Verardo, V.; Marconi, E.; Caboni, M.F. Influence of pearling process on phenolic and saponin content in quinoa (Chenopodium quinoa Willd). Food Chem. 2014, 157, 174–178. [Google Scholar] [CrossRef]
- Lundberg, L. Saponin Removal from Quinoa by Abrasion Processing. Ph.D. Thesis, California Polytechnic State University, San Luis Obispo, CA, USA, 2019. [Google Scholar]
- Zurita-Silva, A.; Fuentes, F.; Zamora, P.; Jacobsen, S.E.; Schwember, A.R. Breeding quinoa (Chenopodium quinoa Willd.): Potential and perspectives. Mol. Breeding 2014, 34, 13–30. [Google Scholar] [CrossRef]
- van Erp, W. Marker Development for Bitter-Tasting-Saponin Gene in Quinoa (Chenopodium quinoa): Final report; Wageningen UR: Wageningen, The Netherlands, 2016; Available online: http://edepot.wur.nl/394421 (accessed on 5 May 2021).
- Murphy, K.M.; Matanguihan, J.B.; Fuentes, F.F.; Gómez-Pando, L.R.; Jellen, E.N.; Maughan, P.J.; Jarvis, D.E. Quinoa Breeding and Genomics. In Plant Breeding Reviews; Goldman, I., Ed.; Wiley: New York, NY, USA, 2018; Volume 42. [Google Scholar]
- Reichert, R.D.; Tatarynovich, J.T.; Tyler, R.T. Abrasive dehulling of quinoa (Chenopodium-quinoa)—Effect on saponin content as determined by an adapted hemolytic assay. Cereal Chem. 1986, 63, 471–475. [Google Scholar]
- Ward, S.M. Response to selection for reduced grain saponin content in quinoa (Chenopodium quinoa Willd.). Field Crops Res. 2000, 68, 157–163. [Google Scholar] [CrossRef]
- Gómez-Caravaca, A.M.; Iafelice, G.; Lavini, A.; Pulvento, C.; Caboni, M.F.; Marconi, E. Phenolic Compounds and Saponins in Quinoa Samples (Chenopodium quinoa Willd.) Grown under Different Saline and Nonsaline Irrigation Regimens. J. Agric. Food Chem. 2012, 60, 4620–4627. [Google Scholar] [CrossRef] [PubMed]
- Ruales, J.; Nair, B.M. Saponins, phytic acid, tannins and protease inhibitors in quinoa (Chenopodium quinoa, Willd) seeds. Food Chem. 1993, 48, 137–143. [Google Scholar] [CrossRef]
- Woldemichael, G.M.; Wink, M. Identification and biological activities of triterpenoid saponins from Chenopodium quinoa. J. Agric. Food Chem. 2001, 49, 2327–2332. [Google Scholar] [CrossRef]
- Ruiz, K.B.; Khakimov, B.; Engelsen, S.B.; Bak, S.; Biondi, S.; Jacobsen, S.E. Quinoa seed coats as an expanding and sustainable source of bioactive compounds: An investigation of genotypic diversity in saponin profiles. Ind. Crop. Prod. 2017, 104, 156–163. [Google Scholar] [CrossRef]
- Jacobsen, S.E. Quinoa Quality. Available online: https://www.quinoaquality.com/contact-quinoa-quality (accessed on 5 May 2021).
- de Mendiburu, F. Agricolae: Statistical Procedures for Agricultural Research. Available online: https://CRAN.R-project.org/package=agricolae (accessed on 7 April 2021).
- Bates, D.; Maechler, M.; Bolker, B.; Walker, S.; Christensen, R.H.B.; Singmann, H.; Dai, B.; Grothendieck, G.; Green, P. Package ‘lme4’: Linear Mixed-Effects Models Using ‘Eigen’ and S4. Available online: https://github.com/lme4/lme4/ (accessed on 16 April 2021).
- Verza, S.G.; Kaiser, S.; de Resende, P.E.; Ortega, G.G. Determination and Characterization of Chenopodium quinoa Willd. Saponins. Lat. Am. J. Pharm. 2017, 36, 326–331. [Google Scholar]
- Miranda, M.; Vega-Galvez, A.; Quispe-Fuentes, I.; Rodriguez, M.J.; Maureira, H.; Martinez, E.A. Nutritional aspects of six quinoa (Chenopodium quinoa Willd.) ecotypes from three geographical areas of Chile. Chil. J. Agric. Res. 2012, 72, 175–181. [Google Scholar] [CrossRef] [Green Version]
- Ng, K.G.; Price, K.R.; Fenwick, G.R. A TLC method for the analysis of quinoa (Chenopodium quinoa) saponins. Food Chem. 1994, 49, 311–315. [Google Scholar] [CrossRef]
- Ando, H.; Chen, Y.C.; Tang, H.J.; Shimizu, M.; Watanabe, K.; Mitsunaga, T. Food components in fractions of quinoa seed. Food Sci. Technol. Res. 2002, 8, 80–84. [Google Scholar] [CrossRef] [Green Version]
- Mroczek, A. Phytochemistry and bioactivity of triterpene saponins from Amaranthaceae family. Phytochem. Rev. 2015, 14, 577–605. [Google Scholar] [CrossRef]
- Christensen, S.A.; Pratt, D.B.; Pratt, C.; Nelson, P.T.; Stevens, M.R.; Jellen, E.N.; Coleman, C.E.; Fairbanks, D.J.; Bonifacio, A.; Maughan, P.J. Assessment of genetic diversity in the USDA and CIP-FAO international nursery collections of quinoa (Chenopodium quinoa Willd.) using microsatellite markers. Plant Genet. Resour. 2007, 5, 82–95. [Google Scholar] [CrossRef] [Green Version]
- Fuentes, F.F.; Martinez, E.A.; Hinrichsen, P.V.; Jellen, E.N.; Maughan, P.J. Assessment of genetic diversity patterns in Chilean quinoa (Chenopodium quinoa Willd.) germplasm using multiplex fluorescent microsatellite markers. Conserv. Genet. 2009, 10, 369–377. [Google Scholar] [CrossRef]

Publisher’s Note: MDPI stays neutral with regard to jurisdictional claims in published maps and institutional affiliations. |
© 2021 by the authors. Licensee MDPI, Basel, Switzerland. This article is an open access article distributed under the terms and conditions of the Creative Commons Attribution (CC BY) license (https://creativecommons.org/licenses/by/4.0/).