Article

Analysis of Weather-Related Growth Differences in Winter Wheat in a Three-Year Field Trial in North-East Germany

1
Helmholtz Centre Potsdam, GFZ German Research Centre for Geosciences, 14473 Potsdam, Germany
2
Geography and Natural Risk Research, University of Potsdam, 14476 Potsdam, Germany
3
Leibniz Institute of Vegetable and Ornamental Crops (IGZ), 14979 Großbeeren, Germany
4
Agricultural Meteorology, German Weather Service, 04288 Leipzig, Germany
*
Author to whom correspondence should be addressed.
Agronomy 2021, 11(9), 1854; https://doi.org/10.3390/agronomy11091854
Submission received: 14 June 2021 / Revised: 4 September 2021 / Accepted: 6 September 2021 / Published: 15 September 2021

Abstract

:
Winter wheat is the most important crop in Germany, which is why a three-year field trial (2015–2017) investigated the effects of weather on biometric parameters in relation to the phenological growth stage of the winter wheat varieties Opal, Kerubino, Edgar. In Brandenburg, there have been frequent extreme weather events in the growth phases that are relevant to grain yields. Two winter wheat varieties were grown per trial year and parts of the experimental field areas were irrigated. In addition, soil physical, biometric and meteorological data were collected during the growing season (March until end of July). There were five dry periods in 2015, six in 2016, and two in 2017 associated with low soil moisture. Notably, in 2016 the plant height was 5 cm lower and the cover was 15% lower than on irrigated plots. The grain yield was increased by 19% and 31% respectively by irrigation. However, due to irrigation costs, the net grain yield on irrigated plots was lower than on the unirrigated plots. It turned out that in dry years there were hardly any differences between winter wheat varieties. Multiple regression analysis showed a strong correlation between the biometric parameters considered here and the grain yield.

1. Introduction

In a highly industrialized society with a predominantly urban population, agriculture continues to be of fundamental importance for national food security. Especially nowadays, more and more regional products are being favored than just a few years ago. In addition, agricultural production conditions are directly dependent on regional natural conditions. The climatic and edaphic conditions are decisive. The growth of agricultural crops is mainly influenced by solar radiation, air and soil temperature, as well as by the amount of precipitation and its distribution. Due to the unusual weather variability that has occurred in recent years, several recent studies have investigated the influence of changing weather conditions on the main agricultural crops.
Several studies have looked at the climatic and soil-related influences on the growth and grain yield of winter wheat. According to Iwańska et al. [1], the soil and weather conditions of a location have a significant impact on the grain yield of winter wheat. Not only in Europe, but also worldwide, Du et al. [2] recorded grain yield losses for winter wheat due to dry stress in the period 1982–2011. In addition, Iwańska et al. [1] argue that watering in spring also leads to grain yield losses for winter wheat. Nevertheless, the winter wheat varieties used are better adapted to changing site conditions [3], so that in the future a selection of seeds with the aim of high grain-yield potential ought to be sufficient to counteract the expected increase in dry periods. On the other hand, the results of Mäkinen et al. [4] show that there was a significant drop in wheat grain yields in the period 1991–2014 due to extreme agrometeorological events throughout Europe.
In Germany, about 50% of the total area is used for agricultural production. Winter wheat is the most common crop in plant production [5]. In the current harvest year 2020, winter wheat accounted for 46% of the total area among cereals [6]. It is therefore of great importance for securing food availability in Germany. The areas cultivated and the grain yields for winter wheat vary from state to state.
Lüttger and Feike [7] investigated the influence of dry periods on the grain yield of winter wheat in Germany. They noted that there was a steady increase in dry periods between 1901 and 2010. Short and medium dry periods, such as rain-free periods of up to a maximum of 8 days, increased more strongly compared to longer dry periods (>11 days). In addition, there is a decreasing spatial grain yield variability that remains broadly stable over the three decades (1981–1990, 1991–2000, and 2001–2010). A clear spatial gradient became apparent over the period 1981–2010, with the variability in the West of Germany being significantly lower than in the East [7].
Higher air temperatures lead to higher evapotranspiration of winter wheat plants, which in turn leads to water deficits. Balla et al. [8] confirm the results of Lüttger and Feike [7] that grain yields are highly dependent on the duration of the heat period. In addition, Balla et al. [8] found that it is crucial during which phenological growth stage the dry period occurs. These results are supplemented by Bönecke et al. [9]. According to Bönecke et al. [9], all phenological growth stages except stem elongation (GS 30–39) occur earlier and have a shorter duration. In addition, their results suggest that agrometeorological changes have a strong impact on grain yield, especially during the grain-filling phase. The phenological growth stage significantly influences the grain weight and the number of reproductive ears [9]. Furthermore, grain yields at sites with higher yield potential are less prone to adverse weather conditions, according to Bönecke et al. [9], than yields at sites with lower yield potential.
This paper describes these relationships on the basis of data collected in the field. In addition, biometric parameters to this extent have not yet been considered. The aim of the research approach was to identify and analyze weather-related growth differences in winter wheat. Field trials (2015–2017) were carried out in Marquardt near Potsdam (Brandenburg). Due to the natural conditions, the lowest grain yields per hectare were achieved in Brandenburg. Brandenburg is one of the driest locations in Germany, with less than 650 mms of precipitation per year, and at the same time has low soil quality due to its glacial character [5].
In Brandenburg, weather-related extreme events, especially prolonged dry periods and heavy rainfall, have occurred more and more frequently in recent years during the grain yield-relevant development growth stages of winter wheat. Since temperatures and precipitation have a direct effect on the quantity and quality of the grain yield, this influence was investigated in the trial years. The type of winter wheat cultivated is also decisive. In the three-year field trial, the cultivation was carried out at the trial site according to good professional practice under constant soil conditions. Meteorological data and biometric parameters, such as plant height, degree of coverage, leaf area index, and chlorophyll value, and phenological data were collected. In addition, soil-physical parameters relevant for the water supply of the plants were also measured. Finally, the data were evaluated for each trial year and then across the years. The aim was to determine the effect on grain yield of weather-related differences in growth caused by drought during the growing season of winter wheat.
The present study thus provides an approach for the analysis of weather-related growth differences between three winter wheat varieties under consideration of soil-physical and biometric parameters. The following research questions are answered in the study:
  • Which differences in growth are evident depending on the weather?
  • Are there variety-specific differences in drought stress resistance and yield?
  • Does irrigation allow a constant grain yield over all years?
  • Which biometric parameters are relevant for determining the grain yield?
  • Is irrigation economical?
The aim of this study is to use these research questions to provide farmers in this region with information on drought stress-related growth differences of the considered winter wheat varieties on sandy soils in the context of climate change and to make statements on the effectiveness of irrigation. Furthermore, this information will be of high relevance for further related topics like crop growth modelling or the use of remote sensing data for precision farming.

2. Materials and Methods

2.1. Materials

2.1.1. Selected Winter Wheat Varieties

In this field trial, winter wheat varieties Kerubino (2015–2017), Opal (2015 and 2016), and Edgar (2017) were examined.
Kerubino belongs to the wheat quality group E and is a yield-safe variety [10]. It is characterized by a fast maturation, so that it passes through the phenological stages faster than Opal and Edgar. Kerubino is drought-tolerant. An upward-facing leaf position and stretched ears at the end of the stem are characteristic of Kerubino [10].
Opal is characterized by medium-yield characteristics, with the number of grains being above average. It is assigned to quality group A. Opal is also not one of the fast-maturing winter wheat varieties [11]. Opal is distinguished from Edgar and Kerubino by leaves perpendicular to the shoot axis and by an inclination of the ear. In 2014, Opal was last tested in Germany [11].
Therefore, in the following year, the winter wheat variety Edgar was used, which has similar properties to Opal [12]. As a B wheat variety, it has a crude protein content at the A wheat level. A medium to late maturity is characteristic of Edgar.
Edgar and Opal are only moderately suited for cultivation on dry sites [11,12].
The winter wheat varieties considered had the following cultivation significance in the trial years 2015–17 in Brandenburg:
  • Kerubino (E): medium cultivation significance with decreasing tendency
  • Opal (A): medium cultivation significance, stable over time
  • Edgar (B): no cultivation significance

2.1.2. Experimental Site and Setup

The experimental site is located in Marquardt (52°28′01.1″ N, 12°57′31.6″ E) near Potsdam on the grounds of the Leibniz Institute for Agriculture Technology and Bioeconomy (ATB).
Due to the glacial character of the region, sandy soils with grain sizes of 63–200 μm (fine sand) and from 200–630 μm (medium sand) predominate. The pedological investigation revealed a sand content of ~76%, silt content of ~12%, and clay content of ~12%. Thus, according to the pedological mapping instructions [13], the first 30 cm consist of a weakly clayey sand (cs3) with a field capacity of 22% vol. and a wilting point of 9% vol. [13].
In the first 30 cm, the pH value was 6.3. In the first year of the experiment, the first 30 cm contained the following nutrient content: Phosphorus (P) = 27 mg/100 g, potassium (K) = 12 mg/100 g, magnesium (Mg) = 5.3 mg/100 g, and organic carbon (Corg) = 0.837. In the second trial year, the first 30 cm contained the following nutrient content: P = 26.4 mg/100 g, K = 7.5 mg/100 g, Mg = 5.2 mg/100 g, and Corg = 0.91.
In 2017, the first 30 cm contained the following nutrient content: P = 7.5 mg/100 g, K = 10.5 mg/100 g, Mg = 4.8 mg/100 g, and Corg = 0.44.
Following the objective, a similar experimental setup was chosen for the three trial years (2015–2017). Two winter wheat varieties were grown each year. Besides the selected varieties, only the number of plots varied over the years. The number and management of the experimental plots was adjusted according to the local site characteristics and sizes of the available fields of the respective trial years. Due to the existing crop rotation, the experimental plots were planted on different fields. The soil physical properties of the fields were similar. In each trial year, the plots were set up in two rows, and each trial plot had a size of 10 × 10 m.
Due to a change of ownership of the experimental site, information on the date of seed and harvest as well as the dates of irrigation are not available for 2015. From 2016 onwards, some plots were irrigated with 10 mms on a weekly basis depending on significant precipitation and the result of a finger test (after DIN 19682-2:2007-11) on soil moisture (Table 1).
In the first year of the trial, 4 plots per row were created. Opal and Kerubino were cultivated alternately. All parcels in the second row were irrigated on certain dates. Sprinklers—irrigation—were used for small plot trials. This eliminates any influence on the adjacent areas. The irrigation was carried out under controlled conditions, because it was observed by the staff and moved over the experimental plots.
In 2016, 8 plots were created per row with Kerubino and Opal. Four parcels of the upper row and all eight parcels of the lower row were irrigated on certain dates. In the lower row Opal and Kerubino were cultivated alternately, while in the upper row the following order was chosen: Kerubino, Opal, Opal, Kerubino, Opal (irrigated), Kerubino (irrigated), Kerubino (irrigated), and Opal (irrigated). In the last trial year, 6 plots were created per row. Three plots in each of the upper and lower row were irrigated. Kerubino and Edgar were cultivated alternately.
The fields were managed by the Leibniz Institute for Agriculture Technology and Bioeconomy (ATB). Fertilization was carried out as usual. KAS and Domogran were used as N-fertilizer. Kornkali 40 was used as K/Mg fertilizer.
Triple superphosphate was also used as a P-fertilizer in the 2016/2017 season.

2.2. Methods

2.2.1. Data Collection in the Field

The meteorological data came from the weather station at the test site, which is operated by ATB. Furthermore, the soil moisture and biometric parameters were measured and phenological data were collected. The grain and straw yields were recorded per plot at the time of harvest by ATB. The soil moisture and biometric parameters were recorded monthly (Table 1). The exact number of measurements on the plots during the trial years depended on the availability of the staff.
For the biometric parameters, multitemporal measurements were made per plot. For the analysis, the mean value of these measurements is used for each plot.
The soil moisture was measured regularly at a depth of 0–10 cm using the ThetaProbe Type ML2X (LI-COR Lincoln, NE, U.S.A) and the Moisture Meter logger Type HH2 (Delta-T Devices Ltd. Cambridge, UK) [14,15], because the length of the sensor is limited to 10 cm. Five to seven measurements per plot were recorded; the mean values were used for the analysis. In addition, the soil moisture at a depth of 0–90 cm was modeled using the METVER agrometeorological soil-water balance model, which was developed by Müller and Müller in 1988, Leipzig, Germany [16].
Plant height was measured by means of a limb scale per plot on three randomly selected wheat plants along the main branch from the soil surface to the end of ear.
The degree of coverage was measured optically along the plot viewed from above, 0.5 × 0.5 m per section. For this purpose, the portion of the base area of the stand that was covered by wheat plants in percentage terms was determined [17].
The chlorophyll value of the leaves was recorded by means of a chlorophyll meter (SPAD-502 Plus, Konica Minolta Tokio, Japan). There, absorption was measured recording the transmission of radiation through the leaf. Per plot, the chlorophyll value of 10 randomly selected plants was measured and the mean value calculated [18]. The chlorophyll value was determined on the top three leaves of the plants.
The phenological growth stage (GS) was determined using the scale in Table 2 [19,20]. Within a plot, several winter wheat plants were examined with regard to the developmental characteristics of the Biologische Bundesanstalt, Bundessortenamt und CHemische Industrie (BBCH) stade.
Using an indirect measurement method by the Sunscan probe from Delta-T Devices, the leaf area index (LAI) was determined [21]. The imaging sensor works in the photosynthetically active radiation range. First, the one-meter-long probe of the device was held horizontally above the crop canopy as a reference measurement to determine the total incoming radiation. Subsequently, measurements were carried out close to the ground below the leaf surface. The device models the LAI from the relation of the radiation conditions. Light conditions that remain largely the same are required.

2.2.2. Agrometeorological Soil-Water Balance Model METVER

METVER is a complex water balance model for calculating evapotranspiration on agricultural production areas. It is based originally on a model approach developed by Müller and Müller in 1988 [16]. Since its development in the 1980s, the METVER model has been continuously tested on different soil types by means of predominantly gravimetric soil moisture measurement by the German Weather Service. The results of these checks allow an unrestricted application of the model also for the site investigated here. The model is tested on the soil types published in the publication of Müller et al. [22].
Today, it has over 40 different types of fruit and crops from agriculture and forestry. The vertical soil structure is mapped using a single-layer model at 10-cm intervals at up to 2 m in depth. In addition to the meteorological values (daily mean temperature, daily amount of precipitation, and, optionally, the duration of sunshine or of global radiation), plant parameters (biological-physiological development factors, effective root penetration depth, interception capacity) are taken into account. In addition, the soil properties, which include substrate properties, field capacity and wilting point, and the initial soil moisture are also included in the calculation. Additionally, these factors are related to the latitude of the meteorological station.
Based on Equation (1), the potential evapotranspiration in METVER is determined. Here, n is the number of days in the considered interval, t the mean temperature, wSS the true sunshine duration, and ai, bi the constants changing over the course of the year according to the extra-terrestrial radiation and astronomically possible sunshine duration.
PETTURC = (ai + bi × wSS) × (t × n)/(t + 15)
Since the actual or real evapotranspiration is usually smaller than the potential evapotranspiration, further conditions must be summarized as a degradation factor. This degradation factor depends on the biological-physiological factor (which describes the phenological development), the actual water supply of the withdrawal sector, and the available water capacity (AWC) in the withdrawal sector concerned.
It should be noted that the supplied energy in the form of radiation and temperature is first used for interception evaporation before it is used for evaporation and transpiration. The water demand is met by the withdrawal sector and corresponds to the main rooting zone. About 60% of the AWC is in the main rooting zone, and only 40% is in the secondary supply sector. The depth of the root zone depends on the root development of the stock and on the available exploitation layer.
It should also be noted that the precipitation is corrected according to Richter [23]. Precipitation in liquid form is increased by 10% and in solid form by 30%. The transition from liquid to solid precipitation is assumed if the daily mean temperature assumes values below 0 °C. In this model, leachate only occurs if the field capacity in the utilization layer is exceeded. Now, the amount of water that seeps from the secondary supply sector towards the groundwater is output.
“The soil moisture (in % AWC) always refers to the exhaustion layer” [24] (p. 22). The model calculates the water balance variables as a function of the phenological development, and either separate data sets can be provided for each year or the calculations are based on mean phenological development.
There are two different model-based variants that simulate a temperature-dependent phenological development. Finally, the root calculation describes a dynamically changing root development of the respective crop species.

2.2.3. Data Evaluation

In order to describe the agrometeorological situation in the trial years, the monthly mean was calculated from the daily values of the air temperature. Daily precipitation was added to monthly values. Both the monthly precipitation and the monthly mean air temperature were classified according to the climate reference period 1961 to 1990.
The data for the climate reference period are from the weather station on the Telegrafenberg in Potsdam (52°22′54.2″ N 13°03′52.5″ E), which is 81 m above sea level. The weather station is about 12 km from the experimental site.
First, the data collected for each experimental year were analyzed and gaps in the data on the measurement dates were filled with the help of linear interpolation or extrapolation. To check whether the results are statistically significant, a two-sided t-test is performed assuming equal variances (Equation (2)), where x1 and x2 are the sample mean values, s2 is the pooled sample variance, and n1 and n2 are the number of samples [25].
The degrees of freedom are expressed as n1 + n2 − 2. The significance level (α) is set here at α = 0.05. If the p-value of the two-sided t-test is less than α, then the results are statistically significant.
t = x ¯ 1 x ¯ 2 s 2 ( 1 n 1 + 1 n 2 ) ,   s 2 = i = 1 n 1 x i x ¯ 1 2 + j = 1 n 2 ( x i x ¯ 1 ) 2   n 1 +   n 2 2
In addition, a multiple linear regression according to Equation (3) was carried out to statistically analyze the relationship between the biometric parameters and the grain yields. In Equation (3), ŷ the equation picture indicator is the predicted or expected value of the dependent variable, X1 to Xp p are different independent or predictive variables, b0 is the value of Y if all independent variables (X1 to Xp) are zero, and b1 to bp are the estimated regression coefficients [26].
Ŷ = b0 + b1 X1 + b2×2+⋯+ bp Xp
With the help of the KTBL [27], the irrigation costs were calculated and compared to the proceeds of the grain yield. Current market prices were used to calculate the proceeds. In order to classify the trial years in terms of climate, the monthly climate water balance (CWB) was calculated based on the available meteorological data from the weather station at the experimental site. The CWB is calculated according to the following equation:
CWB [mm] = monthly amount of precipitation [mm] − monthly amount of potential evapotranspiration [mm]
As the biometric data of the trial years were only collected during the vegetation period, the daily meteorological data collected during this period were also only evaluated from 1 March to 31 July.
Due to the objective of the field trial, the focus was placed on dry periods. These were defined as follows: At minimum for 10 days in a row, less than 1 mm of precipitation must have fallen. According to Böttcher and Schmidt [28], stress situations occur for crops when soil moisture (SM) is less than 30% AWC or above 80% AWC. Depending on how long and in which phenological growth stage of the crops these values are lower or higher, yield losses have to be expected. Between 30% and 80% AWC are developmentally favorable soil moisture conditions. Within this range, between 50% and 80% AWC, the soil moisture is at its optimum.
In order to evaluate the available results in this respect, soil moisture values of the TDR probe were converted from % vol. to % AWC by means of the Soil Mapping Manual (KA5) [13].
In Table 8 (p. 344) of the KA5 [13], it can be seen that the soil type (cs3) is assumed to have the following values for field capacity (FC) and wilting point (WP):
FC = 22% vol. and WP = 9% vol.
Using the following equation, the present soil moisture values are converted from % vol. to % AWC:
SM [% AWC] = ((SM [% vol.] − WP [% vol.]) * 100)/(FC [% vol.] − WP [% vol.])

3. Results

3.1. Agrometeorological Situation in the Trial Years

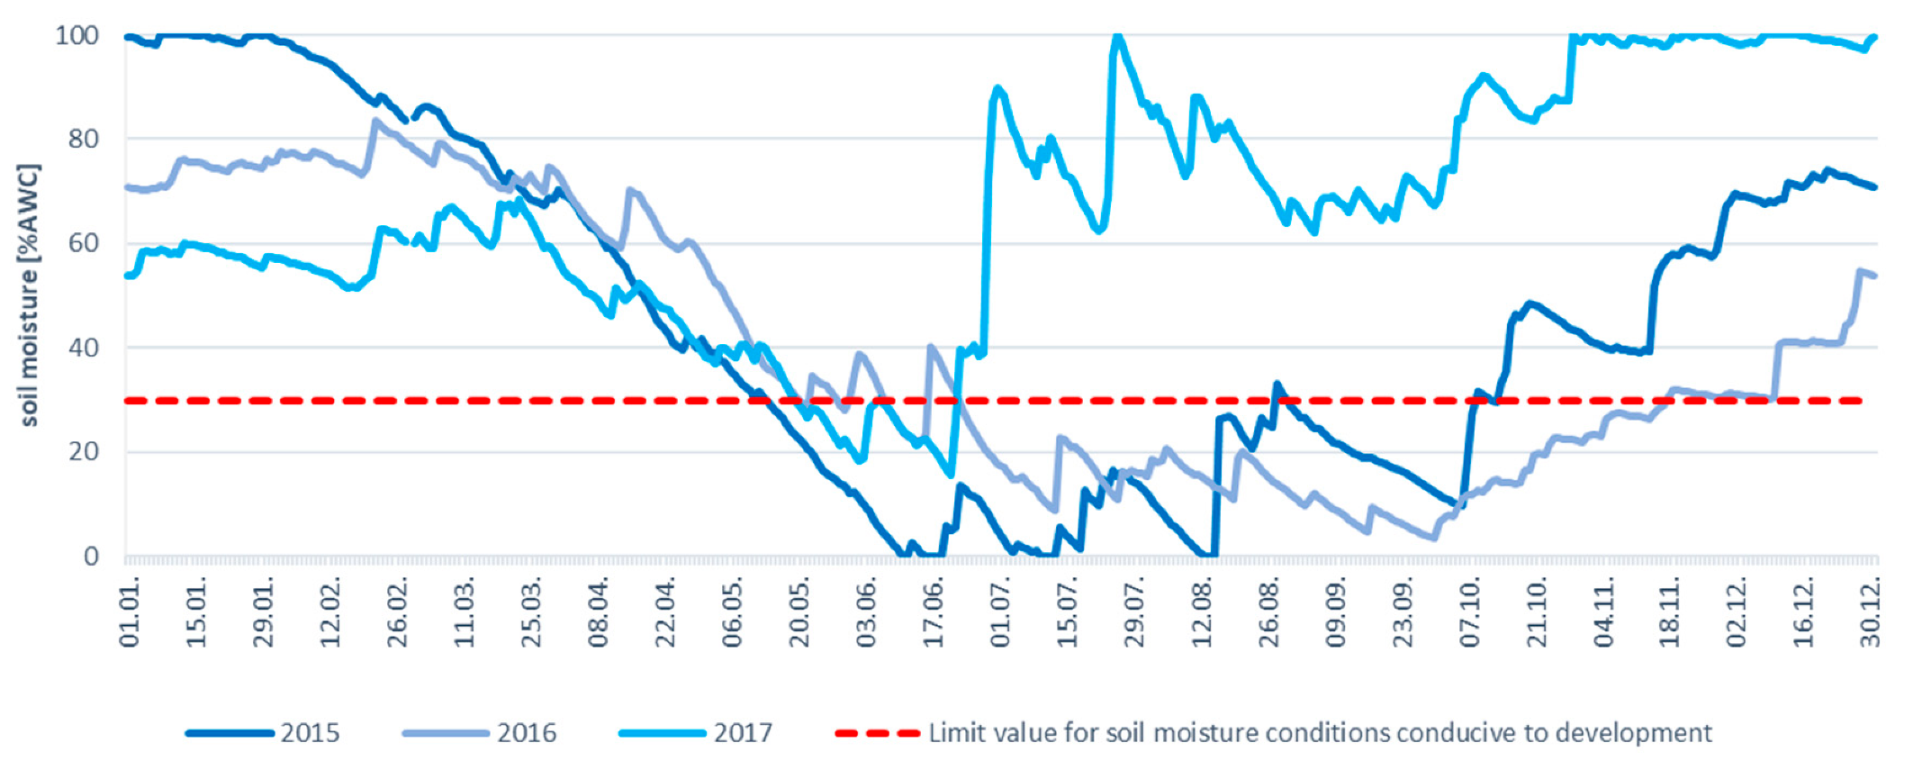
The average air temperature in 2015 was above the average for the reference period 1961–1990 in the months January to March. The amount of precipitation in these months was lower than in the reference period. Only January showed a positive climatic water balance (Figure 1). In February, in particular, there was a marked shortfall in precipitation compared with the reference period from 1961 to 1990 [29]. February was the driest month of the year with only 4.3 mms of precipitation. Nevertheless, the modeled soil moisture was above 80% AWC in January to March (Figure 2). Compared to the reference period, only a third of the average precipitation fell in April and only a quarter in May.
In addition, April was around 2 °C and May around 1 °C warmer than the long-term average. Due to the low precipitation, the modeled soil moisture values decreased steadily. This trend continued in the summer months. In June, precipitation was below the average for the reference period, whereas in July and August it was above the average for the reference period.
June was 1.1 °C and August 4.6 °C too warm compared to the reference period. In June and July, there was sometimes heavy precipitation [30], which could hardly be absorbed by the dried-out soil (<20% AWC) (Figure 2). September was 0.5 °C too warm and only 50% of the average precipitation fell. From February to September, the climatic water balance was negative. Subsequently, October and November recorded a slightly positive climatic water balance. The amount of precipitation in these months was above the long-term average. In October the mean air temperature was 0.8 °C lower than in the reference period, while in November it was 3.7 °C higher. In December, the climatic water balance was balanced (Figure 1). However, the amount of precipitation was 15 mms significantly lower than in the reference period (55 mms). With an average air temperature of 7.1 °C, December was clearly too warm. The long-term average temperature is 0.7 °C.
Due to the extreme soil moisture situation in summer 2015 and the extreme precipitation deficit of a total of 190 mms compared to the reference period, the modeled soil moisture values were not 100% AWC but ~70% AWC at the beginning of 2016 (Figure 2). In addition, the average air temperature in January to September and in December was above the long-term mean for the reference period (Table 3). The climatic water balance was almost balanced only in January and February, but in March to September it was negative (Figure 1). Due to the precipitation deficit, the modeled soil moisture values also decreased steadily from April onwards (Figure 2). In the second half of June, there was heavy precipitation, which caused the modeled soil moisture values to rise slightly. However, the precipitation deficit could not be compensated. In July, the dry conditions intensified, so that the soil moisture dropped below 30% AWC (Figure 2). The positive climatic water balance in the winter months was unable to compensate for the precipitation deficits in spring and summer [31]. The conditions for harvesting winter wheat were thus not optimal at the end of July, as there was a permanent change between wet and dry phases [31].
Overall, spring and summer were clearly too dry in 2016 (Figure 1), which is also reflected in the monthly precipitation (Table 3). This was below the long-term average in all months and the overall precipitation deficit was 243 mms compared to the reference period (Table 3).
The year 2017 also started with a rather mild weather pattern in winter [32]. January had an average air temperature of −1.0 °C by 0.2 °C cooler than the reference period (Table 3). January, February, and March recorded a slightly positive climate water balance (Figure 1). However, only one third of the average rainfall fell in January and only half in February compared to the reference period (Table 3). Due to the climatic situation in 2016 and the low rainfall in January and February, soil moisture was ~60% AWC (Figure 2). In February through December, the average air temperature was always higher than in the reference period [32]. Precipitation in March to May was lower than the long-term average (Table 3), which was shown by the negative climatic water balance in April and May (Figure 1) and also explains the decrease in modeled soil moisture in Figure 2. In June and July, there was abundant precipitation, which caused soil moisture levels to rise from July onwards. In June there was 130% and in July there was 114% more precipitation than in the reference period. Until the winter wheat harvest at the end of July, April, and May were clearly too dry in 2017 (Figure 1).
Based on the agrometeorological situation, it is clear that both 2015 and 2016 were very dry years. The amount of precipitation in these two years was below the long-term average. 2017, in contrast to the previous two years, had more precipitation (Table 3) and thus offered better growing conditions for winter wheat. The amount of precipitation was 40 mms higher than in the reference period. The mean air temperature was higher than the long-term mean in all three trial years (Table 3).
The heat sums refer to the period from 1 January to 31 July of the respective year. In the trial years it was always higher than the long-term average. It was warmest in 2016 (Table 3).

3.2. Results of Field Trial

The agrometeorological situation was described chronologically, because the climatic situation in 2015 influenced both the course of the weather and the soil moisture situation from 2016 and 2017. However, the results of the field trial are presented in the order of 2017, 2016, and 2015. Data were collected in the field more frequently in both 2017 and 2016 than in 2015.
Results2017
The average air temperature during the growing season of winter wheat (March to July) was 14.0 °C and 360 mms of precipitation fell at the experimental site (Table 1). Spring was relatively dry, while 75% of the total precipitation was spread over June and July.
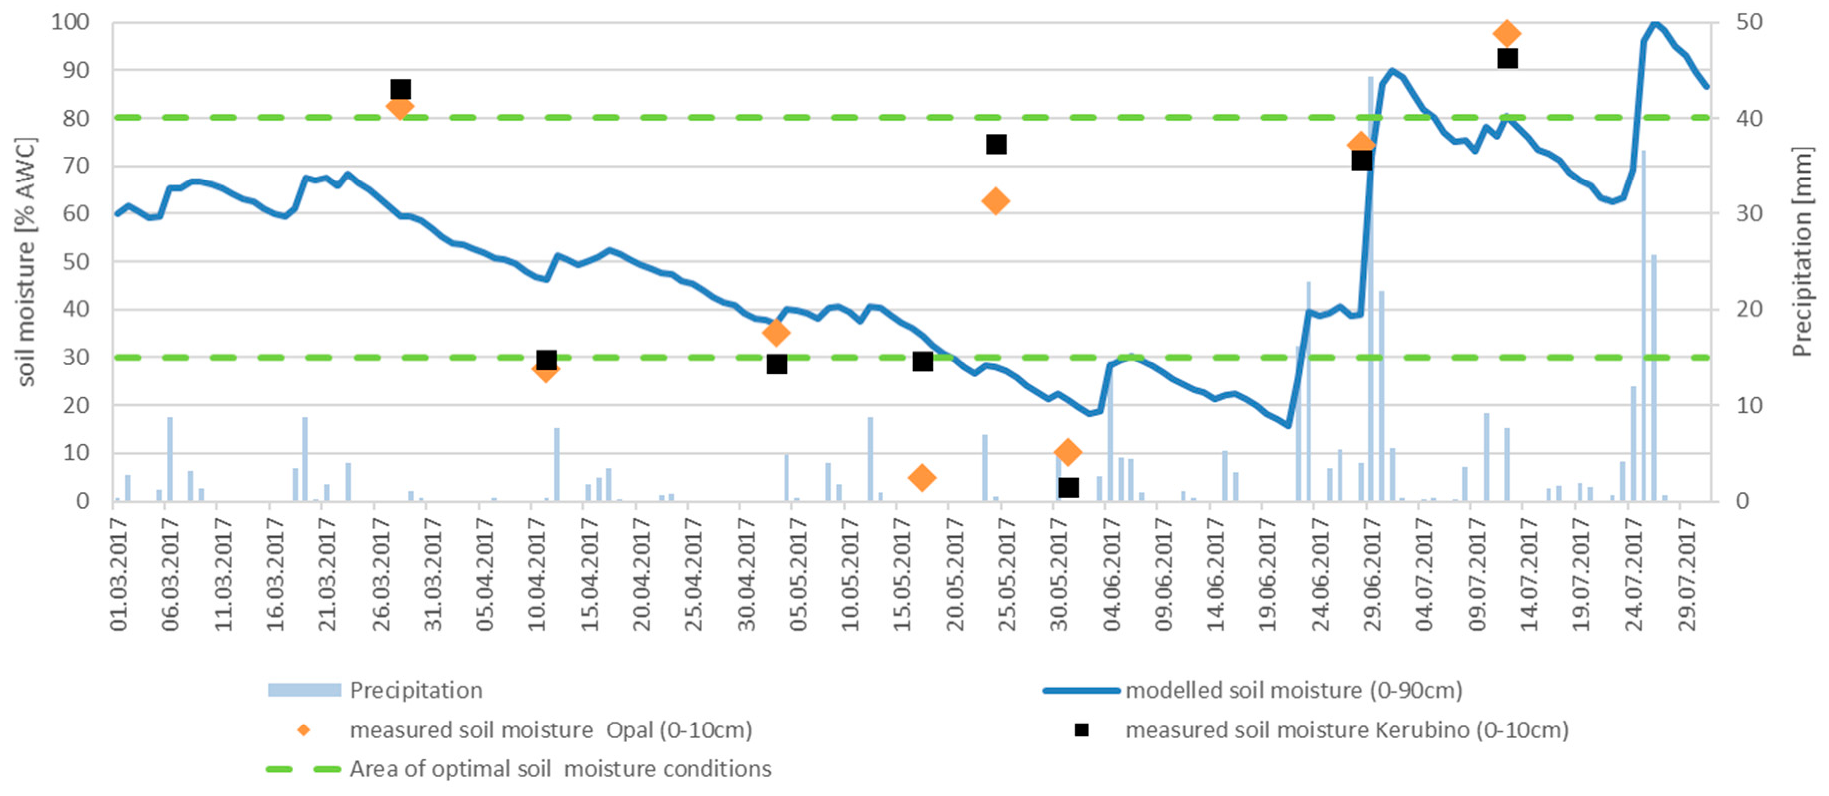
During stem elongation (GS 30–33), only two dry periods occurred in 2017 (Table 4). Within these two low-precipitation phases, the modeled soil moisture at 0–90 cm in the unirrigated plots was between 30 and 80% AWC and thus still in the area of optimal soil moisture conditions (Figure 3). From 21 May until 22 June, the 30% AWC was lower during booting (GS 40–49) and at the beginning of ear emergence (GS 50). Towards the end of June as well as at the end of July, the modeled soil moisture was above 80% AWC and was outside of the area of optimal soil moisture conditions (Figure 3).
The measurements with the mobile TDR probe at 0–10 cm varied very strongly between the measuring dates. In some cases, due to the precipitation, soil moisture values above 80% AWC were calculated on the basis of the measured values. Only during the two dry periods and on the subsequent measurement dates was it shown that the surface, with values below 30% AWC, was drier than the deeper layers (Figure 3).
A consistently developmentally favorable availability of water (30–80% AWC) was observed on the irrigated plots (Figure 4). Here, the modeled soil moisture was even above 80% AWC towards the end of June, which was due to the abundant precipitation and irrigation. Furthermore, the measurements at 0–10 cm depth using the TDR probe showed that the topsoil had a good water content. The converted soil moisture values were between 50–80% AWC. During the dry period in April and May, the 30% AWC was only briefly undershot (Figure 4).
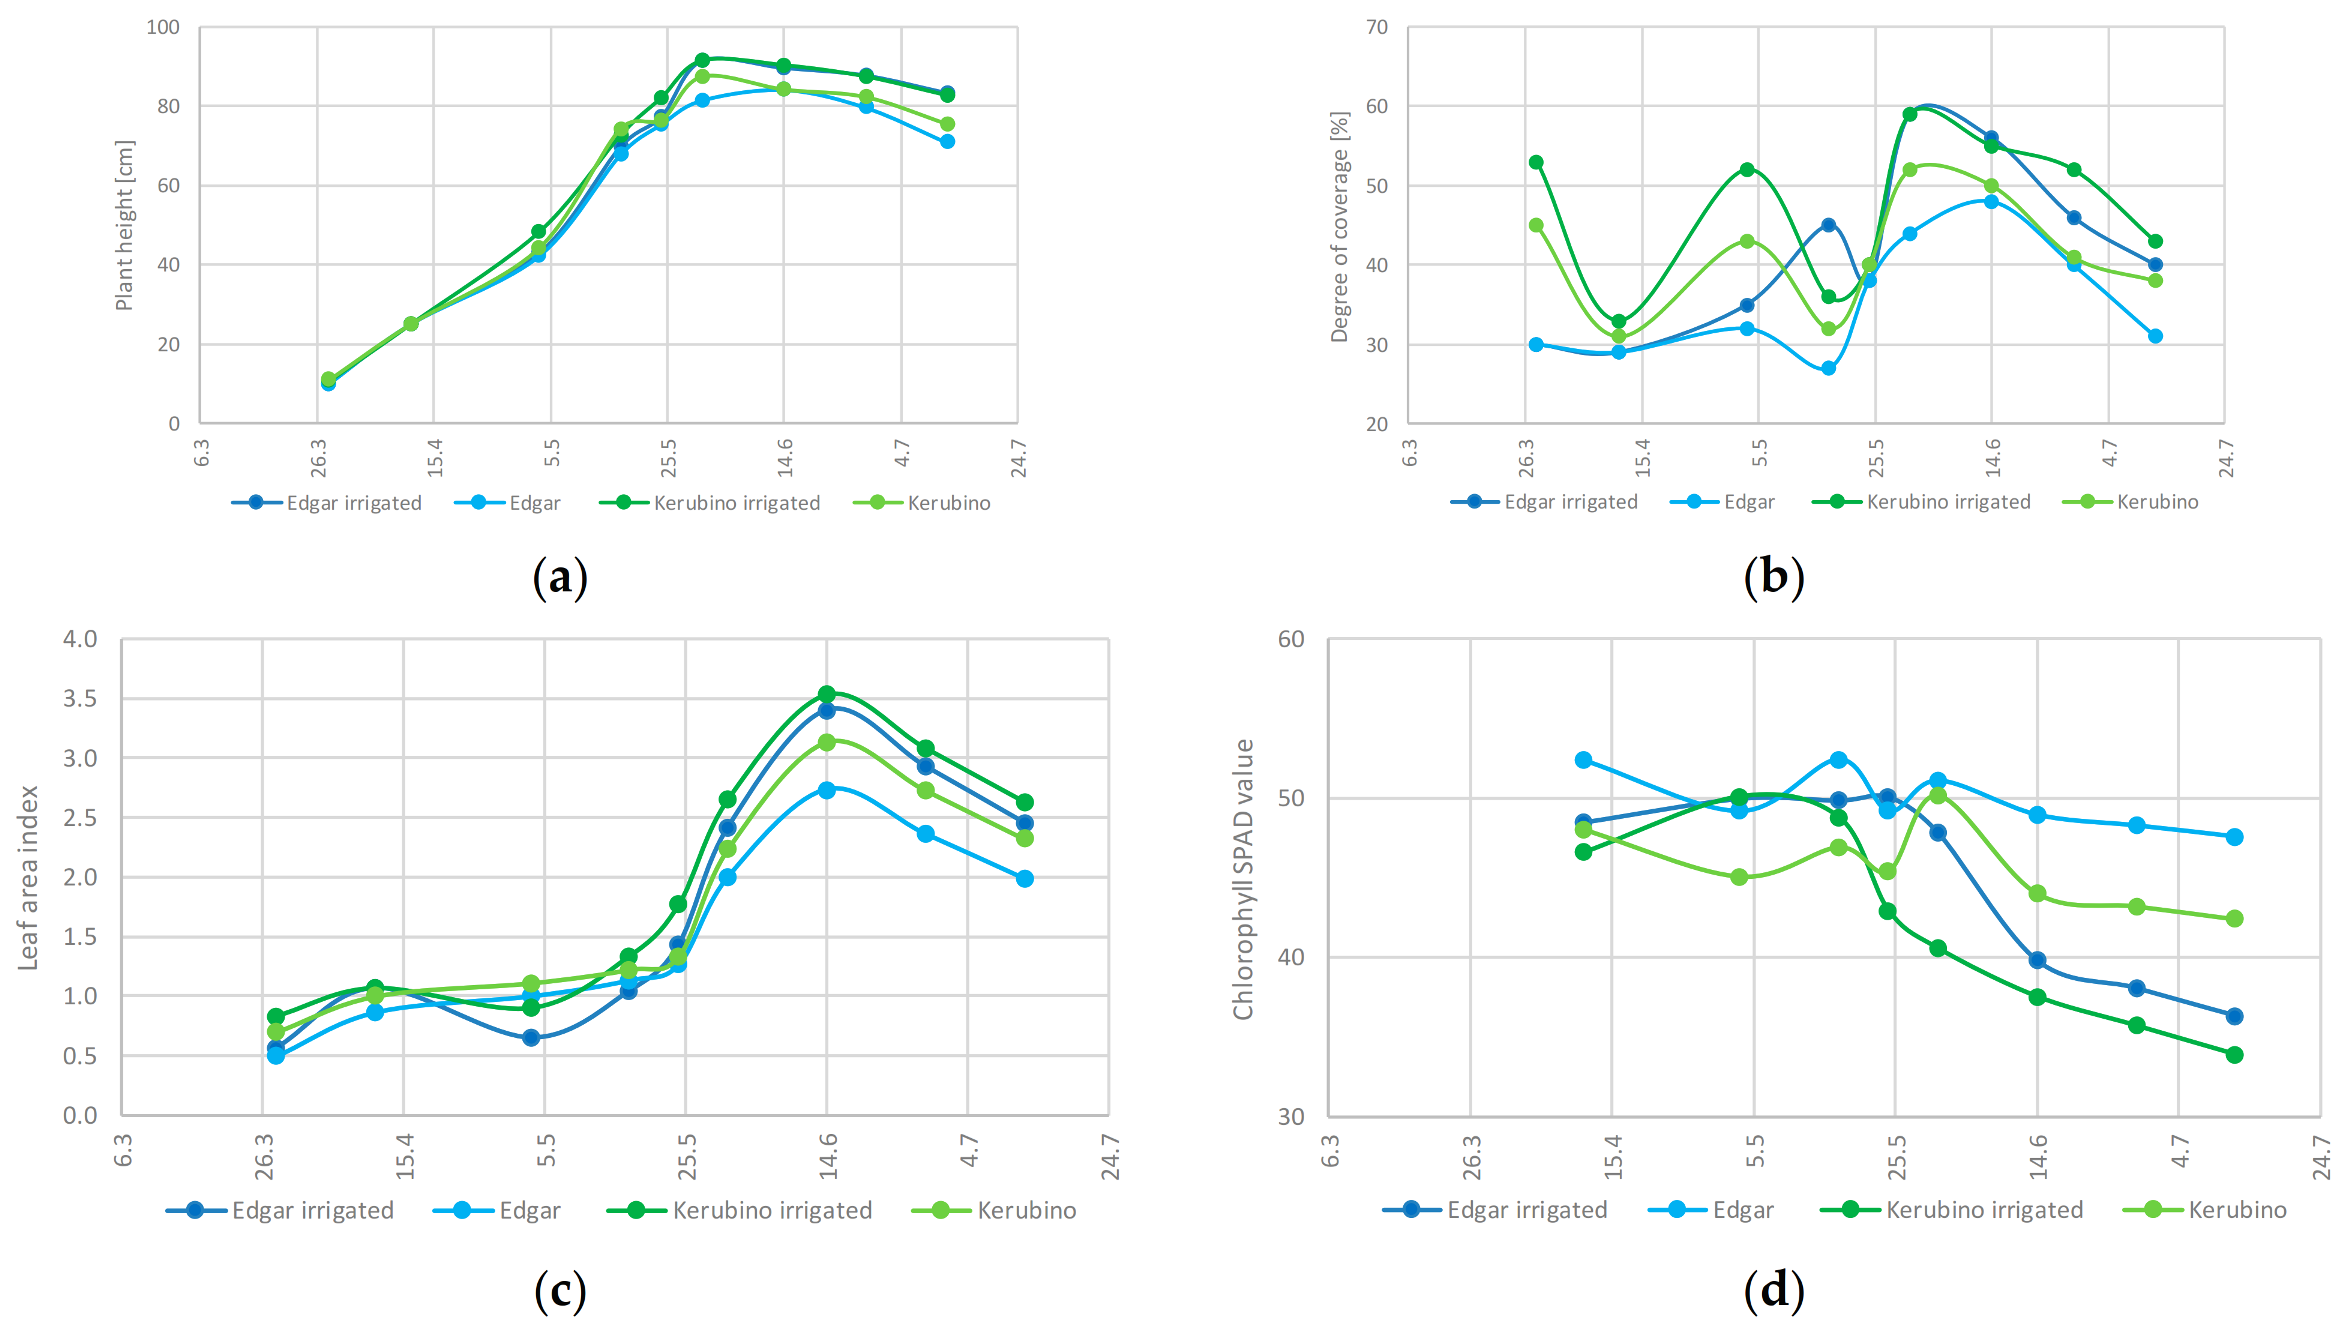
In 2017, growth differences were identified between the two varieties Kerubino and Edgar. The plant height of both winter wheat varieties was on average ~4 cm (Edgar) and ~3 cm (Kerubino) higher (Figure 5). At the end of the vegetation phase, this difference became clearer: on 12 July there was a difference of 12 cm for Kerubino and 7 cm for Edgar.
No significant differences between the irrigated and unirrigated plots of the respective winter wheat variety could be detected by the t-test. (p > 0.05). On the leaf area index, no differences were found between the irrigated and unirrigated plots of the two winter wheat varieties during the growing season. The plots with Kerubino had a slightly higher (0.2) leaf area index (Figure 5). The differences in the degree of coverage between the irrigated plots and the unirrigated plots of the two winter wheat varieties were significant on all measurement dates: p = 0.016 (Edgar) and p = 0.027 (Kerubino).
On 11 April and 17 May, a decrease in the degree of coverage was evident on the irrigated and unirrigated plots of both winter wheat varieties. This may have been caused by the dry period. The irrigated plots with Kerubino and Edgar had on average a 7% higher degree of coverage. Towards the end of the vegetation period, the irrigated plots showed a 9% (Edgar) and 5% (Kerubino) higher degree of coverage (Figure 5). Chlorophyll SPAD values were on average 3 units higher on the unirrigated plots than on the irrigated plots. In addition, they declined from mid-May onwards on the irrigated plots of both winter wheat varieties. On 14 June, the chlorophyll SPAD values on the irrigated plots were reduced by 9 units (Edgar) and 7 units (Kerubino) (Figure 5).
Using the t-test, significant differences between the irrigated and unirrigated plots were found for the winter wheat variety Edgar (p = 0.03).
In 2017, hardly any differences could be detected between the growth stages of the two winter wheat varieties (Table 5). The unirrigated plots with Kerubino and Edgar reached the growth stage 90 (Ripening) on 12 July, and the irrigated plots were simultaneously at dough development, GS 87–89 (Table 5).
The unirrigated plots with Kerubino and Edgar had almost identical straw yields, whereas the irrigated plots showed a difference of about 0.5 t/ha in straw yield. Irrigation increased the straw yield by 29% for Edgar and by 40% for Kerubino (Table 6).
The irrigated plots of both winter wheat varieties had a significantly higher grain yield than the unirrigated plots (Table 6). On the irrigated plots with Kerubino, the average grain yield was 14% higher compared to the unirrigated plots. In the irrigated plots with Edgar, the grain yield increased on average by 17% compared to the unirrigated plots. Kerubino achieved an average grain yield ca. 0.3 t/ha higher than Edgar (Table 6).
Results 2016
Similar to 2017, the average air temperature during the growing season of winter wheat (March to July) was 14.3 °C. However, 175 mms of precipitation fell during the growing season in 2016, which is half the amount of precipitation in 2017. The month with the most precipitation was June (56.6 mms), followed by July (46.2 mms). The spring was very low in precipitation.
In contrast to 2017, there were six dry periods in 2016. Two of them were at the beginning of the growing season (from 15 March on), the others during the stem elongation (GS 30–39), ear emergence (GS 50–59), and hard dough (GS 87) of winter wheat (Table 4).
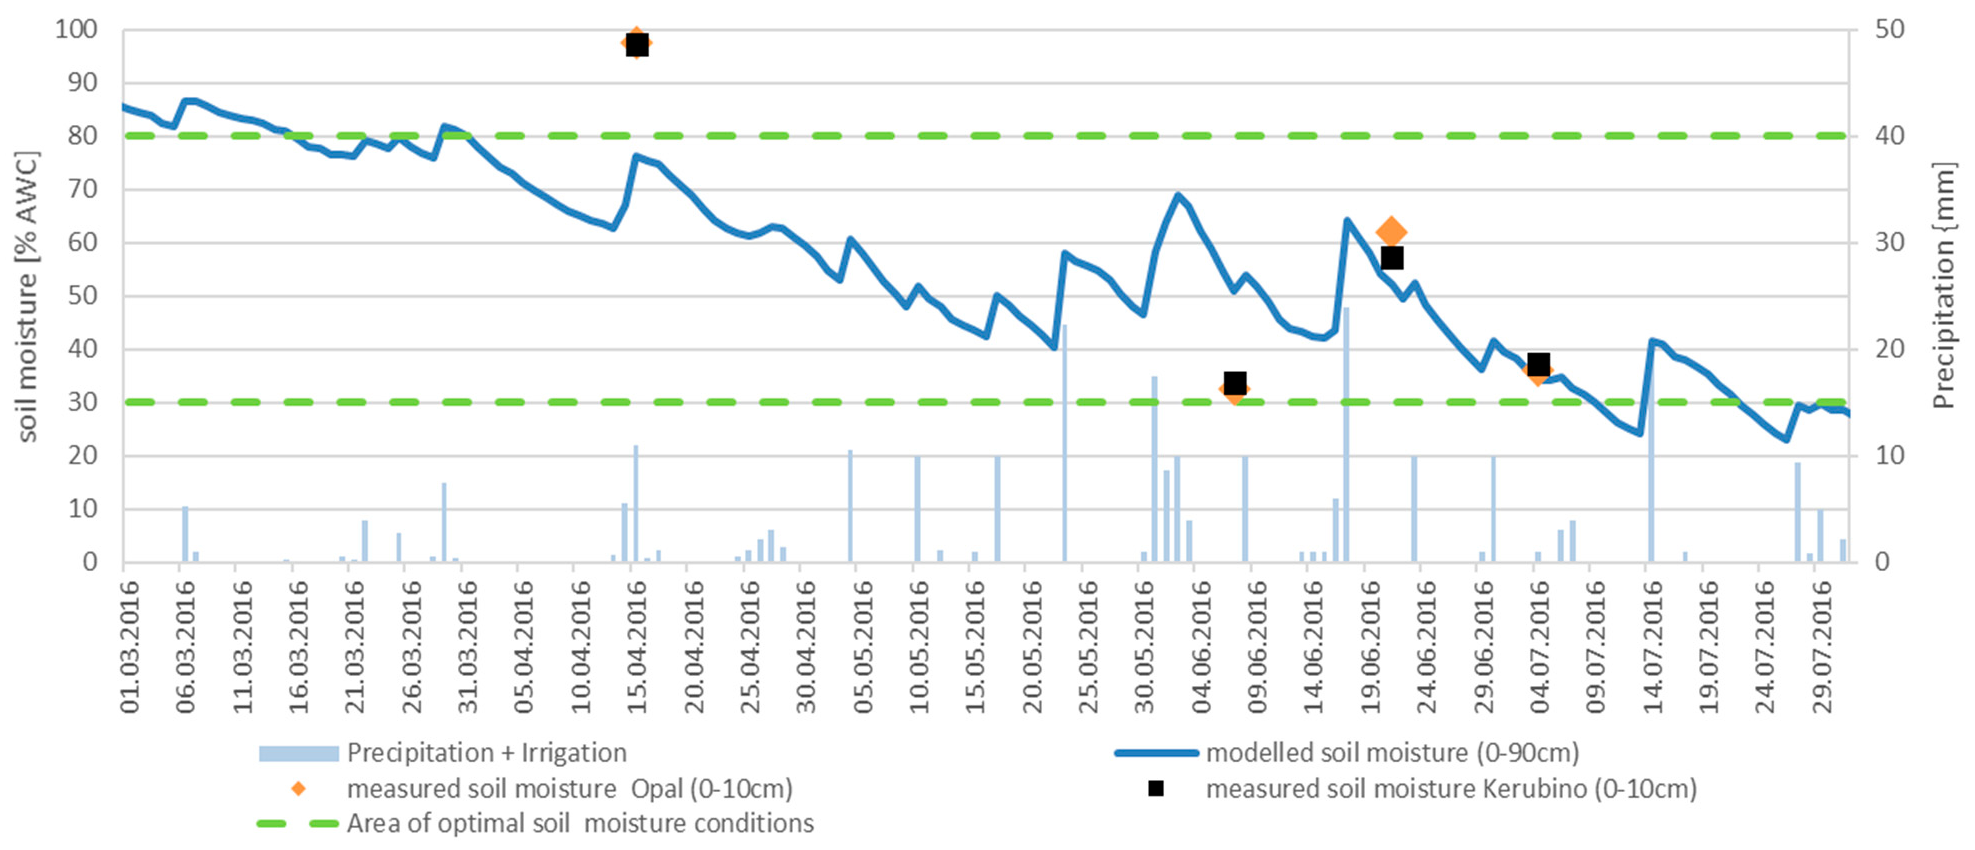
The modeled soil moisture was 80% AWC at the beginning of the growing season in March at a depth of 0–90 cm and decreased continuously from that time on (Figure 6). It was only at the beginning of ear emergence at the end of May that the modeled soil moisture of the unirrigated plots of both winter wheat varieties was temporarily lower than 30% AWC. Thus, although the dry periods at the beginning of the growing season and during stem elongation (GS 30) led to a decrease in soil moisture, there was no water shortage in the winter wheat. This occurred starting on 26 June during dough development (GS 80) of the winter wheat, because the modeled soil moisture was permanently below 30% AWC until the end of July (Figure 6). In the upper soil layer (0–10 cm), the converted soil moisture values, which are based on the measurements with the TDR probe, were above 80% AWC due to precipitation. During two dry periods, the topsoil dried out (Figure 6).
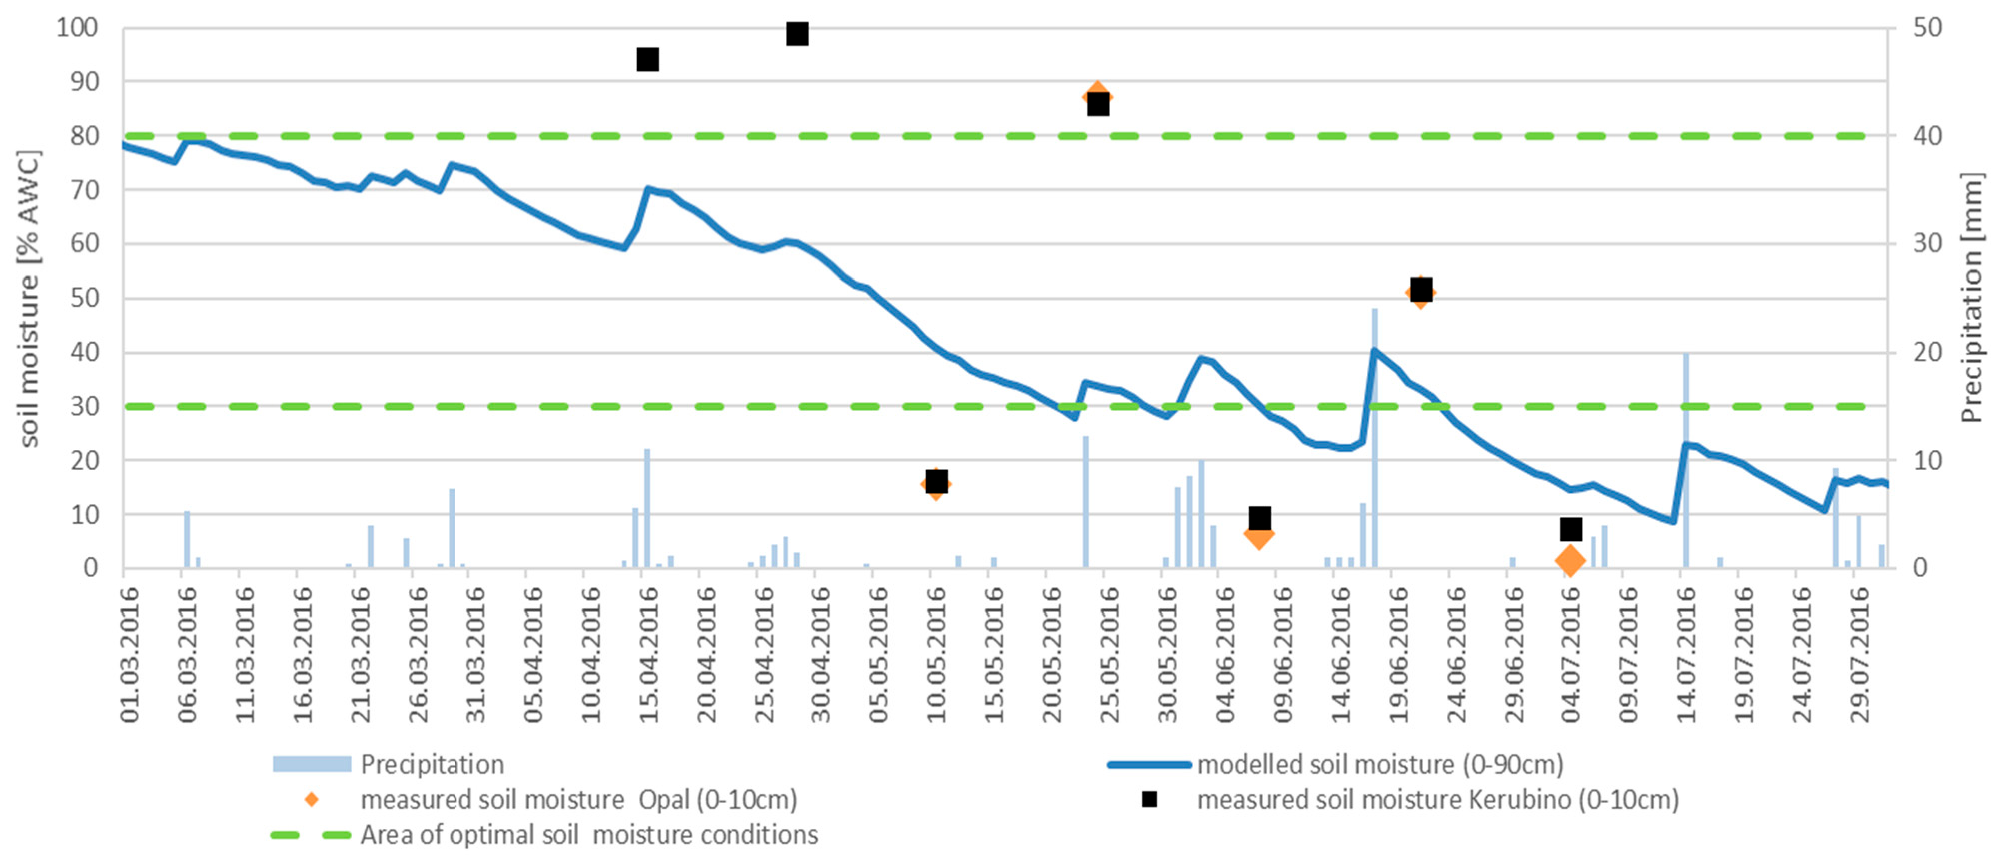
On the irrigated plots, the modeled soil moisture at 0–90 cm was between 30–80% AWC and thus in the area of optimal soil moisture conditions (Figure 7). Only in July were the values below 30% AWC for a short time. Due to the irrigation, calculated soil moisture values above 30% AWC were also achieved in the uppermost soil layer (0–10 cm) (Figure 7).
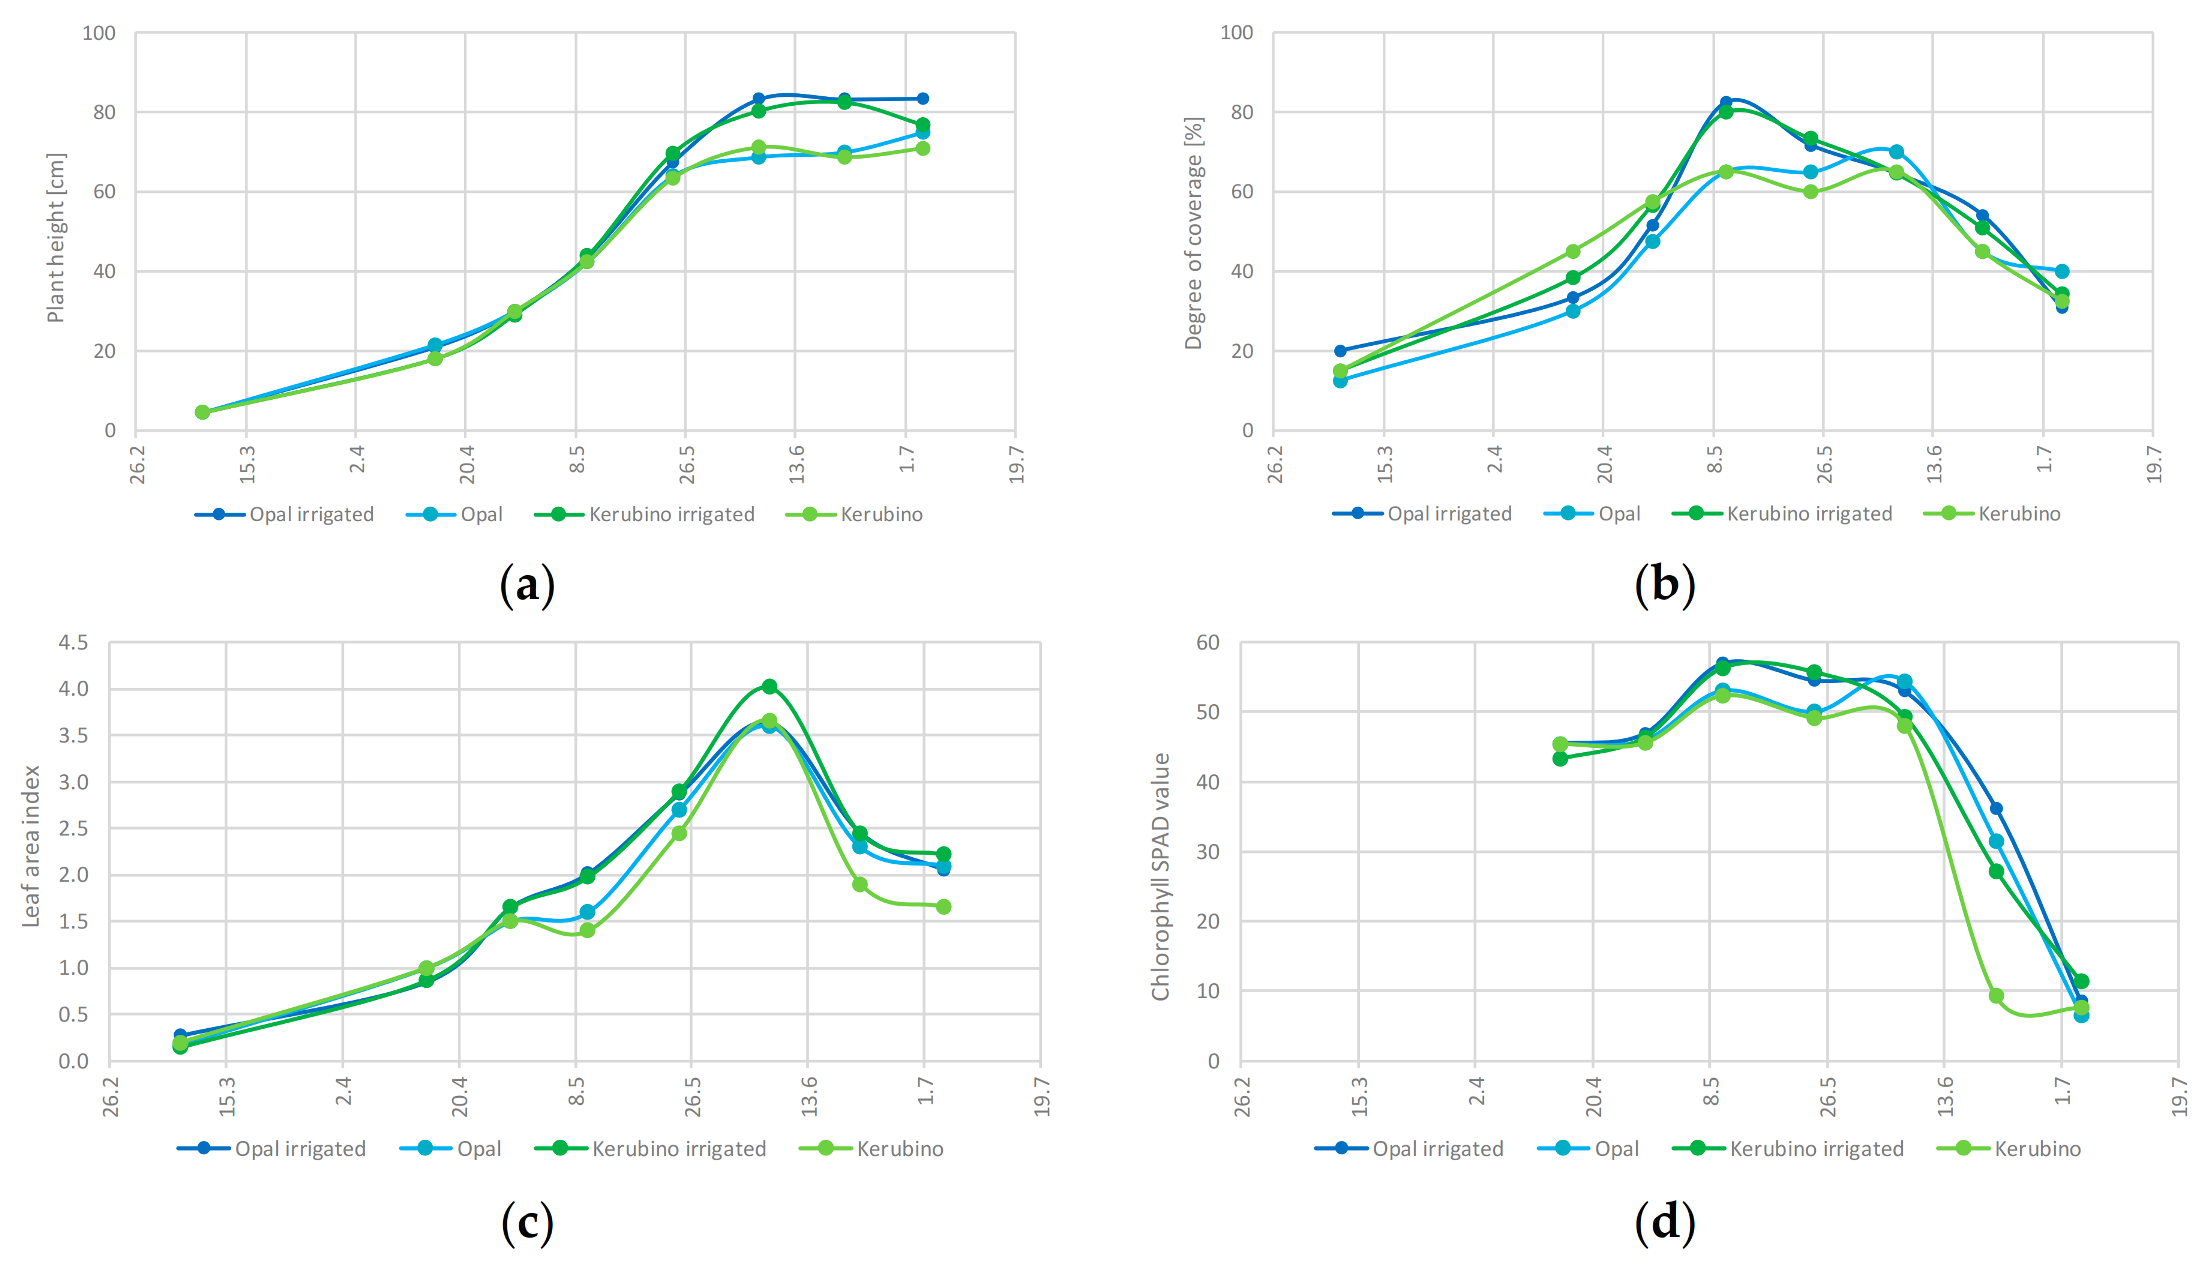
Differences between the irrigated and unirrigated plots could be seen in the biometric parameters. At the onset of flowering (GS 60) and during dough development (GS 80), the winter wheat plants on the irrigated plots were ~13 cm higher than on the unirrigated plots (Figure 8).
Averaged over the entire growing season, the irrigated plots of both winter wheat varieties were 5 cm higher. The measurements of the leaf area index showed an almost identical course. The leaf area index decreased by 0.5 units during the dry period of the stem elongation (GS 30–39) in May on the unirrigated plots. At the time of flowering (GS 60), the highest values between 3.6 and 4.0 were achieved for the leaf area index (Figure 8). No significant differences between the irrigated and unirrigated plots could be detected for either growth height or leaf area index (p > 0.05).
Further, during the dry period in May, the degree of coverage of unirrigated plots of both winter wheat varieties was on average 15% lower than on irrigated plots (Figure 8). At the beginning of the growing season up to and including 7 June, the chlorophyll values on the irrigated and unirrigated plots were the same (Figure 8). With the onset of dough development (GS 80), the chlorophyll SPAD values decreased by an average of 21 units both on the irrigated plots of both winter wheat varieties and on the unirrigated plots with Opal. The unirrigated plots with Kerubino showed a decrease of 39 units (Figure 8).
The chlorophyll SPAD values increased until hard dough on 4 July remained constant. The decisive factors for this decrease may have been the dry period from 18 June to 3 July and low soil moisture. No significant differences between the irrigated and unirrigated plots could be detected in the degree of coverage and the chlorophyll SPAD values (p > 0.05).
The growth stages of Opal and Kerubino were synchronized. On 4 July, the irrigated plots of both winter wheat varieties reached hard dough (GS 87) (Table 4). The unirrigated plots of both winter wheat varieties were at the same time at soft dough, GS 85 (Table 5).
The irrigated plots on which Kerubino was grown had a higher grain yield of an average of 0.9 t/ha compared to the irrigated plots with Opal (Table 6). The grain yield on the unirrigated plots was almost identical for both winter wheat varieties.
Irrigation increased the mean grain yield by 19% for Opal and by 31% for Kerubino (Table 6). The same can be seen in the straw yield. As a result of irrigation, this rose by 28% for Opal and by 38% for Kerubino (Table 6).
Results 2015
2015 was on average ~1 °C cooler than the other two years and was the year with the lowest amount of precipitation during the three trial years. The average air temperature during the vegetation period of the winter wheat was 13.3 °C, and the amount of precipitation was 145 mms (Table 1). As in the previous two years, June and July were the months with the heaviest rainfall, as 70% of the total rainfall was distributed over these months. The spring was also low in precipitation in 2015.
In 2015, similar to 2016, there were a total of five dry periods due to precipitation at the beginning of the growing season as well as during the stem elongation (GS 30–39), ear emergence (GS 50–59), and grain hard (GS 92) of winter wheat (Table 4).
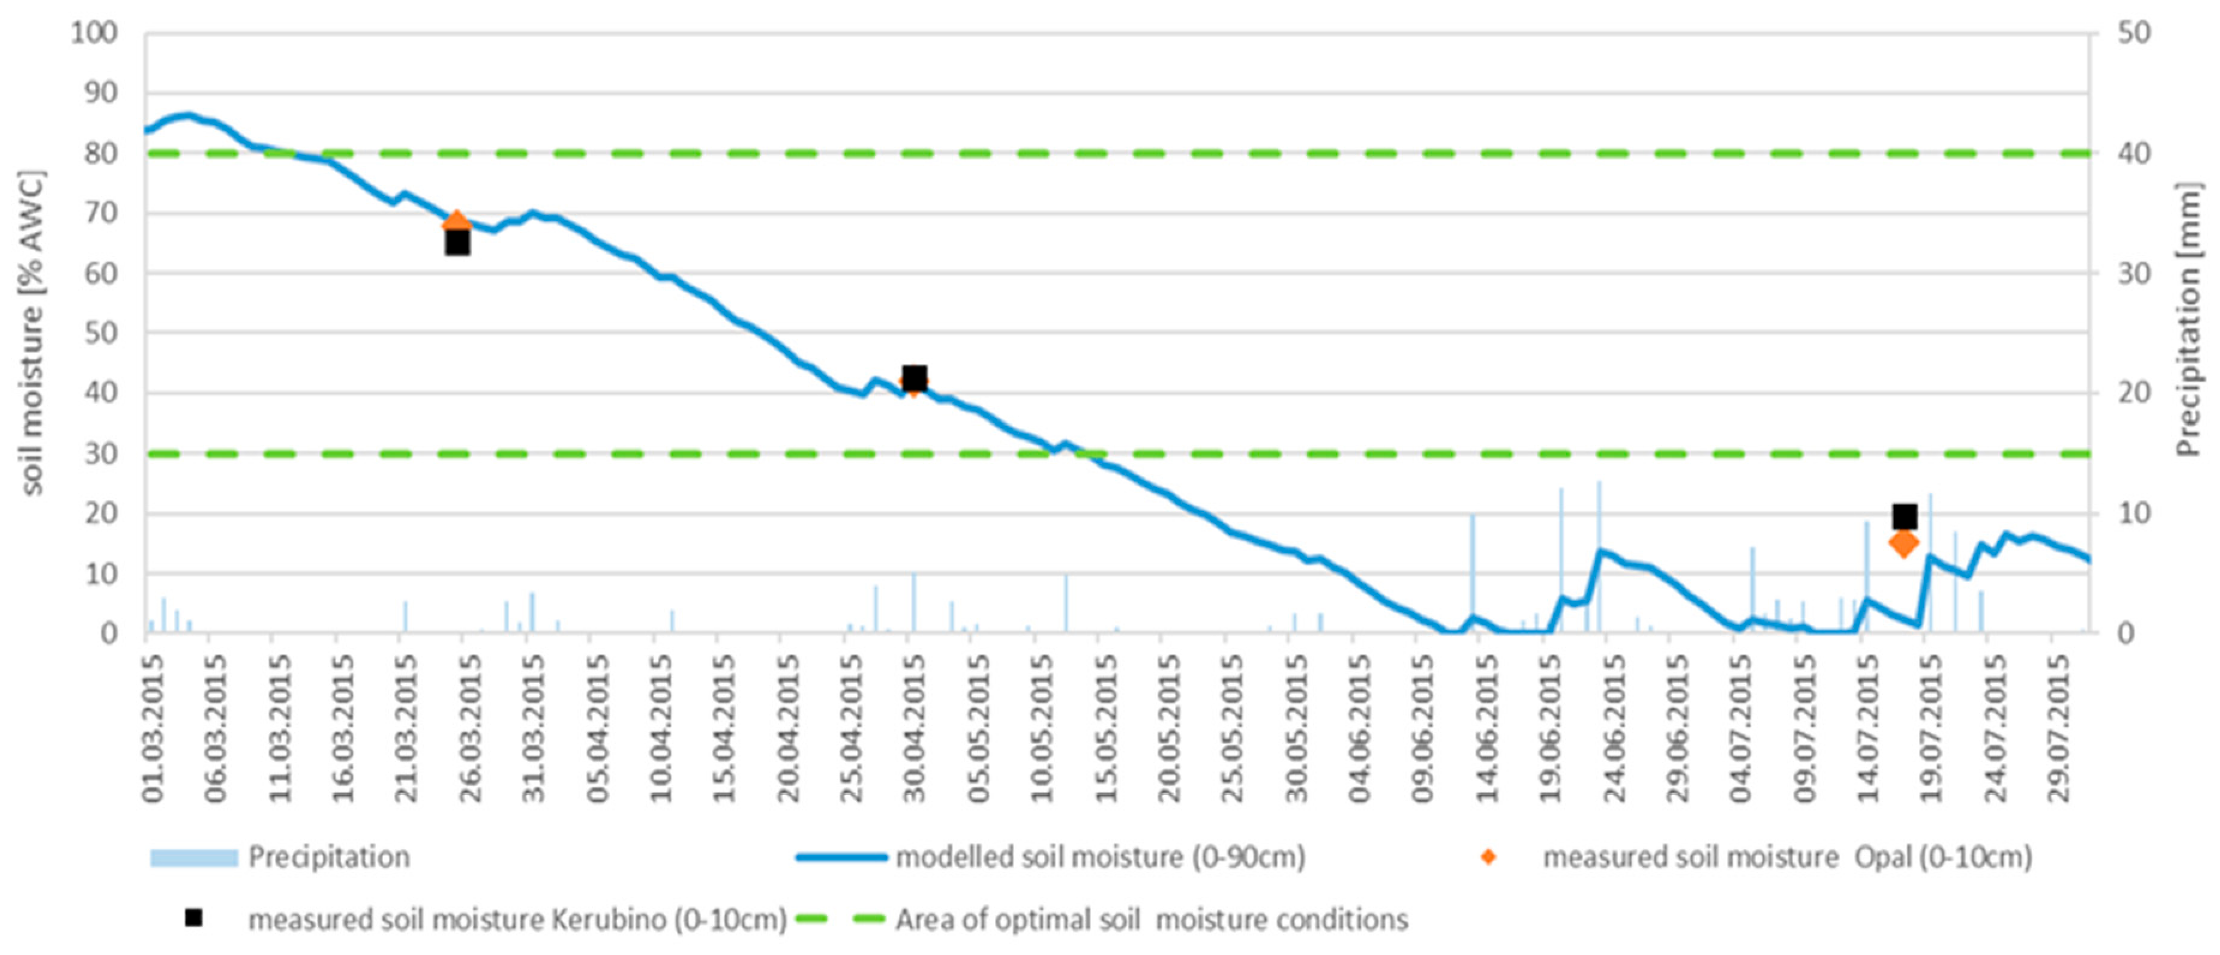
At the beginning of the growing season, the modeled soil moisture was 85% AWC and then decreased continuously. In the course of the modeled soil moisture of the unirrigated plots at a depth of 0–90 cm, the 30% AWC was permanently lowered from 15 May onwards (Figure 9). Within the uppermost soil layer (0–10 cm), the calculated soil moisture values of the unirrigated plots, which are based on the values measured with the TDR probe, were also below 30% AWC from this time on (Figure 9).
The effects of the drought periods could be seen above all in the plant height. The irrigated plots were on average 3 cm (Opal) or 5 cm (Kerubino) higher than the unirrigated plots (Figure 10). In June, at the beginning of flowering (GS 60), the highest values of the leaf area index were measured on the irrigated plots of both winter wheat varieties: on 11 June, the leaf area index on the irrigated plots was around 0.85 (Kerubino) and 0.4 (Opal) higher than on the unirrigated plots. This difference can be explained by the dry period (2 June–12 June) and the resulting low soil moisture values on the unirrigated plots. Thereafter, the leaf area index decreased continuously on both irrigated and unirrigated plots (Figure 10).
Throughout the entire growing season, the degree of coverage on the irrigated plots was on average 2–3% higher than on the unirrigated plots. A difference in the degree of coverage between the irrigated and unirrigated plots of up to 15% was found by the measurement on 29 May at the time of ear emergence (GS 50–59), as shown in Figure 10. No significant differences (p > 0.05) in the biometric parameters were found between the irrigated and unirrigated plots of both winter wheat varieties.
Table 5 shows that the irrigated plots with Opal and Kerubino did not change until reaching the stage of ear emergence (GS 50) on 29 May, while the unirrigated plots of both winter wheat varieties were already in flowering at the same time (GS 60). This difference in development can be an indication of drought stress, because under stress the growth stages are completed faster.
The unirrigated plots differed only slightly in terms of grain yield. Varietal differences were shown by the grain yields of the irrigated plots: the mean grain yield was 1.1 t/ha higher for Kerubino than for Opal (Table 6). Irrigation resulted in an average grain yield increase of 9% for Opal and 25% for Kerubino (Table 6). The straw yield of both varieties was almost identical on irrigated and unirrigated plots. Due to irrigation, straw yield increased by 6% for Opal and 25% for Kerubino (Table 6).

4. Discussion

4.1. Weather-Related Differences in Growth of the Winter Wheat Varieties Examined

The precipitation in 2015 and 2016 was 396 mm and 342 mm, respectively, well below the long-term average for the reference period 1961–2020. On the one hand, the climatic water balance during the growing season of winter wheat from March to the end of July was predominantly negative. On the other hand, this precipitation deficit was also evident in the course of modeled soil moisture up to 90 cm depth. From May (2015) and from mid-June (2016), the modeled soil moisture was predominantly below 30% AWC.
But with stem elongation (BBCH 30–39), the water consumption of winter wheat increases and is highest between ear emergence (BBCH 50–59) and flowering (BBCH 60) [31]. During these development stages, there were five and six dry periods in 2015 and 2016, respectively.
Thus, in 2015 and 2016, the water uptake by the roots on the undisturbed plots of both winter wheat varieties was limited during the yield-relevant development stages. The drought-induced stress situations on the undisturbed plots have an impact on the aboveground shoot growth, especially on leaf development [5,33]. This was shown to be the case in the two years of the experiment on the unirrigated plots. On the one hand, the plant height of both winter wheat varieties on the unirrigated plots was on average 13 cm (2015) and about 5 cm (2016) lower. On the other hand, the degree of coverage was up to 5% lower. During the dry periods in May, the degree of coverage was even 15% lower than on the irrigated plots. The leaf area index is particularly sensitive to temporary water stress [5], which is confirmed by the results of this field trial. In both 2015 and 2016, the leaf area index was lower on the unirrigated plots than on the irrigated plots of both winter wheat varieties. The lower leaf area index due to drought stress may be due to reduced leaf growth [33]. In addition, a small number of leaves per plant may lead to a lower leaf area index [34]. This can be demonstrated by the available results, as the degree of coverage on the unirrigated plots was shown to be lower than on the irrigated plots. In addition, the small leaf area limits the transpiration of the winter wheat plants [35], and thus the winter wheat plants consume less of the plant-available water in the soil.
Not only the leaf area index, but also the chlorophyll content, has an impact on photosynthesis and yield performance [36,37]. During the dry periods in May 2016, the chlorophyll value of the two winter wheat varieties was lower on the unirrigated plots. Due to high temperatures and dry stress, the photosynthetic parameters are reduced. According to Ganji Arjenaki et al. [38], there is a significant relationship between dry stress and the reduction of chlorophyll in the leaves, but this was different according to the variety. The available results confirm this relationship, but there were no varietal differences. However, the influence of photosynthetic parameters on yield formation is less than that of the leaf area index and the cover line, because the chlorophyll value can regenerate faster [36]. This field trial showed that the growth of the winter wheat varieties Kerubino and Opal on the unirrigated plots in the first two years of the trial was limited by drought stress.
This field trial showed that the growth of the winter wheat varieties Kerubino and Opal on the unirrigated plots in the first two trial years was limited by drought stress and confirmed the results of many studies on this topic [39,40,41].
On the irrigated plots in 2015 and 2016, soil moisture was mostly in the area of optimal soil moisture conditions during the dry periods, so that no dry stress occurred. This also explained the higher values of the biometric parameters on the irrigated plots with Opal and Kerubino.
Due to the drought in 2015, the ripening of both winter wheat varieties was accelerated on the unirrigated plots. The winter wheat plants of the varieties Opal and Kerubino reached flowering (GS 60) on the unirrigated plots on 29.05.2015, while the irrigated plots at the same time in the ear emergance (GS 50). In 2016, the two winter wheat varieties on the irrigated plots reached the hard dough (GS 87) on 4 July 2016, while those on the unirrigated plots were in the soft dough (GS 85) at that time.
In addition, they are particularly sensitive to drought stress in later developmental stages. Accelerated ripening has an impact on fruit formation as well as on product quality [5].
In contrast to the two previous years, the precipitation in 2017 was more pronounced, and only two dry periods occurred. The climatic water balance was negative during the winter wheat growing season in April and May. The modeled soil moisture up to 90 cm depth was lower than 30% AWC during the booting (GS 40–49) and at the beginning of the ear emergence (GS 50) on the unirrigated plots. During this time (21 May–22 June), water shortages occurred in both winter wheat varieties. On the irrigated plots, the 30% AWC was not below, but the modeled soil moisture was above 80% AWC from the end of June. As a result, there may have been oxygen deficiency in the root zone [28], which also had a negative impact on grain yield.
In the first half of the growing season, the degree of coverage was subject to significant fluctuations over time on both the unirrigated and irrigated plots. These fluctuations can be explained by the beginning of stem elongation. During stem elongation, the winter wheat plants change into longitudinal growth, and the leaf position also changes. As a result, the degree of coverage can vary considerably during this time. In terms of plant height and degree of coverage, no effects of the dry periods could be seen on the unirrigated plots. Plant height as well as leaf area index and degree of coverage were lower on the unirrigated plots throughout the growing season than on the irrigated plots of both winter wheat varieties. On the other hand, the chlorophyll SPAD values from mid-May onwards were higher on the unirrigated plots than in the irrigated plots of both winter wheat varieties.
Due to the wetter conditions in the stand of both winter wheat varieties on the irrigated plots, which may have been triggered by the irrigation, fungal infestation was reported. The fungal disease led to a yellowing of the leaves, which caused a significant decrease in chlorophyll SPAD values from mid-May onwards. It was probably a yellow or brown rust infestation.
On 12 July 2017, Edgar and Opal reached grain hard (GS 92) on the unirrigated plots, while the irrigated plots simultaneously reached hard dough (GS 87) and were at full maturity (GS 89). The somewhat faster development of both winter wheat varieties on the unirrigated plots was due to the dry period from 21 May to 22 June 2017.

4.2. Consistent Yields of the Winter Wheat Varieties through Irrigation

The available yield data for the experimental years 2015, 2016, and 2017 show that the yields also varied on the irrigated plots. In all trial years, a higher grain yield was achieved on the irrigated plots than on the unirrigated plots. The winter wheat variety Kerubino consistently achieved higher grain yields than the winter wheat varieties Opal and Edgar. Especially in the two very dry years 2015 and 2016, the grain yield was increased through irrigation by 25% and 31% for Kerubino, while for Opal the yield was increased by 9% and 19%, respectively. Due to the favorable weather during the growing season of winter wheat in 2017, the grain yields of both winter wheat varieties on the irrigated plots differed only slightly (ca. 0.1 t/ha).

4.3. Variety-Specific Differences with Regard to Drought Stress Resistance and Yield

Kerubino is described as a climate-stable variety, which is also well suited for dry locations. However, the available results showed that Kerubino also reacted to drought on the unirrigated plots. The available results of the biometric parameters of Kerubino hardly differed from the biometric data of the winter wheat variety Opal. Based on the available results, there were no variety-specific differences with regard to dry periods. Due to irrigation, especially in the two dry years 2015 and 2016, the grain yield increase was more pronounced for Kerubino than for Opal. This difference can be explained by the quality group. Kerubino is described as a high-yielding variety, which distinguishes itself when soil moisture conditions, e.g., irrigation, are favorable for growth.
In 2015, compared to the yield in the Potsdam-Mittelmark district (8.2 t/ha), below-average yields were achieved on the trial plots [42]. Depending on variety and cultivation, between 5.1 and 6.7 t/ha were achieved (Table 7).
In 2016, below-average yields were achieved on the trial plots compared to the yield in the Potsdam-Mittelmark district (7.2 t/ha) [42]. Depending on variety and cultivation, between 4.7 and 6.3 t/ha were achieved (Table 7).
In 2017, compared to the yield in the Potsdam-Mittelmark district (5.6 t/ha) [43], below-average yields were achieved on the trial plots. Depending on variety and cultivation, between 6.0 and 7.3 t/ha were achieved (Table 7).
On the trial plots, the highest grain yields in the trial years were achieved in 2017 on both irrigated and unirrigated plots of the two winter wheat varieties.

4.4. Determination of Grain Yield on the Basis of the Biometric Parameters Collected

By means of multiple linear regression, a strong correlation between grain yields and the biometric parameters recorded during the growing season could be demonstrated for the irrigated plots with Opal and Kerubino in 2016. The coefficient of determination (R2) was 0.99. Depending on the time of measurement and the winter wheat variety, individual biometric parameters have a significant influence (p < 0.05) on the grain yield. On the irrigated plots, the degree of coverage (p = 0.045) during ear emergence (GS 50–59) and flowering (GS 60) and the chlorophyll SPAD values (p = 0.032) at flowering (GS 60) and the plant height (p = 0.033) from dough development (GS 80) had a significant influence on the grain yield of Opal (Table 8).
On the irrigated plots with Kerubino, only the chlorophyll value (p = 0.0072 or p = 0.021) at the time of stem elongation (GS 30–39) and ear emergence (GS 50–59) had a significant influence on grain yield. For the other biometric parameters considered, no significant influence on the grain yield of Kerubino could be demonstrated (Table 8).
Since the chlorophyll value is an indicator of the photosynthesis performance of winter wheat plants, the present results confirm those of Bogale et al. [44]. The available results can only be considered as trends due to the limited amount of data. Nevertheless, Hlaváčová et al. [37] came to similar results.
For a multiple linear regression of the unirrigated plots in 2016 and for the irrigated and unirrigated plots in 2015 and 2017, only a small number of value pairs per measurement date were available. In 2016, the unirrigated plots of both winter wheat varieties had two pairs of values per measurement date. In 2017, there were only 3 pairs of values per measurement date for unirrigated and irrigated plots of both winter wheat varieties.
In a further study, the volume of measurement data would have to be significantly increased in order to statistically prove this relationship between biometric parameters and the grain yield.

4.5. Irrigation Efficiency

Table 7 below evaluates whether irrigation of the winter wheat varieties had a positive economic impact. For this purpose, the profit was compared with the irrigation costs according to KTBL [27]. A higher grain yield was achieved by irrigating individual plots. Thus, for the irrigated plots with Kerubino, and Opal/Edgar, a higher grain yield was measured compared to the unirrigated plots of both winter wheat varieties.
Due to the irrigation costs incurred, it became apparent for the years 2016 and 2017 that irrigating the plots of both winter wheat varieties was not economically viable. The profit less the irrigation costs was on average €200 to €300 lower per dt than for the unirrigated plots (Table 7). No statement could be made for the year 2015 in this respect, because the irrigation quantity was not known.

5. Conclusions

In the present study, weather-related differences in growth of the winter wheat varieties Kerubino, Opal, and Edgar were analyzed in three experimental years (2015–17) in Marquardt near Potsdam on sandy soils. Depending on the phenological development, meteorological, biometric and soil physical parameters were evaluated and the growth stages and yields were recorded.
Based on the annual precipitation over the three years of the experiment and comparing it with the mean rainfall over the reference period (1961–1990), it was found that 2015 and 2016 were very dry years. In 2017, the amount of precipitation was higher than the long-term average. The experimental years were significantly warmer than the reference period.
In particular, dry periods occurred in 2015 and 2016 in yield-relevant development stages of the winter wheat varieties. Despite the dry periods, there were only slight differences in biometric parameters between irrigated and unirrigated plots. The results of the biometric parameters height of growth, leaf area index, chlorophyll value, and degree of coverage showed no varietal differences.
The results showed that dry periods have a negative impact on the yield of the three winter wheat varieties considered, unless irrigation is used in dry years. Irrigation increased the yield of the three winter wheat varieties in all three trial years. On average, the grain yield of Opal and Edgar increased by 15% and on average by 34% for Kerubino.
In practice, this means that irrigation during yield-relevant development stages can significantly increase the grain yield of all three winter wheat varieties on sandy soils with low water storage capacity. However, it was found that irrigation was not worthwhile in this field trial, because the yield less irrigation costs was lower than on the unirrigated plots.
It should be noted that this study was carried out only at one site with certain soil characteristics and covers three years. Over this short period, it is not possible to make a statement about weather-related trends during the growing season of winter wheat at this location.
In order to make general statements on trends in weather-related growth differences in winter wheat, a similar field trial would have to cover a longer period of time. Other site conditions, such as soil organic matter or groundwater content, should also be taken into account.

Author Contributions

Study design: S.M., D.S.; Paper concept: A.K., S.M., F.B., D.S.; methodology: A.K., S.M., D.S.; formal analysis: A.K., S.M., D.S.; data curation: A.K., S.M., D.S.; writing—original draft preparation: A.K., S.M., F.B., D.S.; writing—review and editing: A.K., S.M., F.B., D.S.; visualization: A.K.; supervision: S.M., D.S.; project administration: S.M., D.S. All authors have read and agreed to the published version of the manuscript.

Funding

Field data and resulting data sets presented in this study are available on request from the corresponding author.

Institutional Review Board Statement

Not applicable.

Informed Consent Statement

Not applicable.

Acknowledgments

We would like to thank Hoffmann, Sarr, Walch, and Wegener for their support in collecting data in the field. Our thanks also go to the Leibniz Institute for Agricultural Engineering and Bioeconomy e. V. (ATB) for the provision and management of the experimental area.

Conflicts of Interest

The authors declare no conflict of interest.

References

  1. Iwańska, M.; Paderewski, J.; Stępień, M.; Rodrigues, P.C. Adaptation of Winter Wheat Cultivars to Different Environments: A Case Study in Poland. Agron. J. 2020, 10, 632. [Google Scholar] [CrossRef]
  2. Du, X.; Li, Q.; Wang, H.; Liu, J.; Zhao, L.; Zhang, H.; Wang, N. A simple assessment approach for winter wheat loss risk impacted by water stress. Geocarto Int. 2019, 34, 473–489. [Google Scholar] [CrossRef]
  3. Schittenhelm, S.; Kottmann, L.; Kraft, M.; Matschiner, K.; Langkamp-Wedde, T. Agronomic performance of winter wheat grown under highly divergent soil moisture conditions in rainfed and water-managed environments. J. Agron. Crop. Sci. 2019, 205, 283–294. [Google Scholar] [CrossRef]
  4. Mäkinen, H.; Kaseva, J.; Trnka, M.; Balek, J.; Kersebaum, K.C.; Nendel, C.; Gobin, A.; Olesen, J.E.; Bindi, M.; Ferrise, R.; et al. Sensitivity of European wheat to extreme weather. Field Crop. Res. 2018, 222, 209–217. [Google Scholar] [CrossRef]
  5. Schaller, M.; Weigel, H.-J. Analyse des Sachstands zu Auswirkungen von Klimaveränderungen auf die deutsche Landwirtschaft und Maßnahmen zur Anpassung. FAL Agric. Res. 2007, 316, 39–48. [Google Scholar]
  6. DESTATIS-Statistisches Bundesamt. Anbaufläche von Winterweizen im Jahr 2020 um 7% Gesunken. Available online: https://www.destatis.de/DE/Presse/Pressemitteilungen/2020/05/PD20_168_412.html (accessed on 3 November 2020).
  7. Lüttger, A.B.; Feike, T. Development of heat and drought related extreme weather events and their effect on winter wheat yields in Germany. Theor. Appl. Climatol. 2018, 132, 15–29. [Google Scholar] [CrossRef]
  8. Balla, K.; Karsai, I.; Bónis, P.; Kiss, T.; Berki, Z.; Horváth, Á.; Mayer, M.; Bencze, S.; Veisz, O. Heat stress responses in a large set of winter wheat cultivars (Triticum aestivum L.) depend on the timing and duration of stress. PLoS ONE 2019, 14, e0222639. [Google Scholar] [CrossRef] [PubMed]
  9. Bönecke, E.; Breitsameter, L.; Brüggemann, N.; Chen, T.W.; Feike, T.; Kage, H.; Kersebaum, K.C.; Piepho, H.P.; Stützel, H. Decoupling of impact factors reveals the response of German winter wheat yields to climatic changes. Glob. Chang. Biol. 2020, 26, 3601–3626. [Google Scholar] [CrossRef]
  10. I.G.Pflanzenzucht GmbH. Winterweizen: Sortenblatt für Kerubino. Available online: https://ig-pflanzenzucht.de/sorte/kerubino/ (accessed on 3 August 2020).
  11. Bundessortenamt. Beschreibende Sortenliste: Getreide, Mais, Öl- und Faserpflanzen, Leguminosen, Rüben, Zwischenfrüchte. Available online: https://www.bundessortenamt.de/bsa/media/Files/BSL/bsl_getreide_2019.pdf (accessed on 15 September 2020).
  12. KWS. Neutraler Sortenvergleich-Winterweizen. Available online: https://www.kws.com/de/de/beratung/saatgut/sortenwahl/neutraler-sortenvergleich/ (accessed on 2 November 2020).
  13. Eckelmann, W.; Sponagel, H.; Grottenthaler, W.; Hartmann, K.J.; Hartwich, R.; Janetzko, P.; Joisten, H.; Kühn, D.; Sabel, K.J.; Traidl, R. Bodenkundliche Kartieranleitung (KA5), 2nd ed.; Dynamax Inc.: Hannover, Germany, 2005; p. 344. [Google Scholar]
  14. Dynamax Inc. Theta Probe Type ML2x. Available online: https://d3pcsg2wjq9izr.cloudfront.net/files/23948/download/11438/ml2x.pdf (accessed on 2 November 2020).
  15. LI-COR. Soil Moisture Probe ML2x. Available online: https://www.licor.com/documents/md85p0ueyhvnqfm5r93n (accessed on 2 November 2020).
  16. Müller, J.; Müller, G. Berechnung der Verdunstung landwirtschaftlicher Produktionsgebiete. Beschreibung des zur Bestimmung der aktuellen Evapotranspiration von Kulturpflanzenbeständen erarbeiteten Modells. Z. für Meteorol. 1988, 38, 332–337. [Google Scholar]
  17. Knoor, D.; Weise, C. Blattflächenindex und Bedeckungsgrad. Available online: http://www.terradew.uni-jena.de/sites/lai.html (accessed on 3 July 2020).
  18. Konica Minolta. Spezifikation Chlorophyll Meter SPAD-502 Plus. Available online: https://www5.konicaminolta.eu/en/measuring-instruments/products/colour-measurement/chlorophyll-meter/spad-502plus/specifications.html (accessed on 2 November 2020).
  19. Witzenberger, A.; Hack, H.; van den Boom, T. Erläuterungen zum BBCH-Dezimal-Code für die Entwicklungsstadien des Getreides—Mit Abbildungen. Gesunde Pflanz. 1989, 41, 384–388. [Google Scholar]
  20. Lancashire, P.D.; Bleiholder, H.; Langeluddecke, P.; Stauss, R.; van den Boom, T.; Weber, E.; Witzen-Berger, A. An uniform decimal code for growth stages of crops and weeds. Ann. Appl. Biol. 1991, 119, 561–601. [Google Scholar] [CrossRef]
  21. Dynamax Inc. Sunscan Probe. Available online: https://www.delta-t.co.uk/product/sunscan (accessed on 2 November 2020).
  22. Richter, D. Verfahrenshinweiß zur Korrektur von verdichteten Werten der Niederschlagshöhe. Arb. Gutacht. des Meteorol. Dienstes der DDR 1981, 3, 1–3. [Google Scholar]
  23. Müller, J.; Jörn, P.; Thiere, J. Erarbeitung einer Karte der pflanzennutzbaren Feldkapazität für die neuen Bundesländer. Mitteilgn. Dtsch. Bodenkundl. Gesellsch. 1995, 76, 1149–1153. [Google Scholar]
  24. Bach, S. Anpassung des Agrarmeteorologischen Wasserhaushaltsmodells METVER an Aktuelle Erfordernisse vor dem Hintergrund Sich Wandelnder Klimatischer Randbedingungen und Pflanzenbaulicher Gegebenheiten; Masterarbeit University Leipzig: Leipzig, Germany, 2011. [Google Scholar]
  25. StatsDirect Limited. Unpaired (Two Sample) t Test. Available online: https://statsdirect.com/help/content/parametric_methods/unpaired_t.htm (accessed on 19 November 2020).
  26. LaMorte, W.W.; The Multiple Linear Regression Equation. Boston University School of Public Health. Available online: https://sphweb.bumc.bu.edu/otlt/MPH-Modules/BS/BS704-EP713_MultivariableMethods/BS704-EP713_MultivariableMethods2.html (accessed on 19 November 2020).
  27. KTBL, e.V. Faustzahlen für die Landwirtschaft; KTBL e.V.: Darmstadt, Germany, 2009; pp. 157–158. [Google Scholar]
  28. Böttcher, F.; Schmidt, M.; Der Boden aus Sicht der Agrarmeteorologie-Bodentemperatur und -Wasserhaushalt. Bundesministerium für Ernährung und Landwirtschaft. Available online: https://www.bmel.de/DE/themen/landwirtschaft/pflanzenbau/bodenschutz/agrarmeteorologie.html (accessed on 20 July 2020).
  29. Deutscher Wetterdienst. Deutschlandwetter im Winter 2014/15: Sehr Mild, Bei Ausgeglichenem Niederschlag und Etwas Wenig Sonne. Available online: https://www.dwd.de/DE/presse/pressemitteilungen/DE/2015/20150227_Deutschlandwetter_Winter2014_2015.pdf?__blob=publicationFile&v=3 (accessed on 16 October 2020).
  30. Deutscher Wetterdienst. Deutschlandwetter im Sommer 2015: Heiß, Trocken und Sonnig-ein Sommer mit Vielen Rekorden. Available online: https://www.dwd.de/DE/presse/pressemitteilungen/DE/2015/20150828_deutschlandwetter_sommer_2015.pdf?__blob=publicationFile&v=3 (accessed on 16 October 2020).
  31. KSB. Klimastatusbericht 2016. Available online: https://www.dwd.de/DE/leistungen/klimastatusbericht/publikationen/ksb_2016.html (accessed on 28 September 2020).
  32. KSB. Klimastatusbericht 2017. Available online: https://www.dwd.de/DE/leistungen/klimastatusbericht/publikationen/ksb_2017.html (accessed on 15 September 2020).
  33. Zhang, H.; Oweis, T.; Garabet, S.; Pala, M. Water-use efficiency and transpiration efficiency of wheat under rain-fed conditions and supplemental irrigation in a Mediterranean-type environment. Plant Soil 1998, 201, 295–305. [Google Scholar] [CrossRef]
  34. Zwidofhelangani, A. Water Stress Effects on Growth, Yield and Quality of Wheat (Triticum aestivum L.). Ph.D. Thesis, University of Pretoria, Pretoria, South Africa, 2013. Available online: https://repository.up.ac.za/xmlui/bitstream/handle/2263/24146/dissertation.pdf?sequence=1&isAllowed=y (accessed on 7 March 2021).
  35. Blum, A. Crop response to drought and the interpretation of adaptation. Plant Growth Regul. 1996, 135–248. [Google Scholar] [CrossRef]
  36. Davies, W.J. Responses of plant growth and functioning to changes in water supply in a changing climate, Morison, J.I.L., Morecroft, M.D. (pbl.). Plant Growth Clim. Chang. 2006, 96–117. [Google Scholar] [CrossRef]
  37. Hlaváčová, M.; Klem, K.; Rapantová, B.; Novotná, K.; Urban, O.; Hlavinka, P.; Smutná, P.; Horáková, V.; Škarpa, P.; Pohanková, E.; et al. Interactive effects of high temperature and drought stress during stem elongation, anthesis and early grain filling on the yield formation and photosynthesis of winter wheat. Field Crop. Res. 2018, 221, 182–195. [Google Scholar] [CrossRef]
  38. Ganji Arjenaki, F.; Jabbari, A.; Morshedi, A. Evaluation of Drought Stress on Relative Water Content, Chlorophyll Content and Mineral Elements of Wheat (Triticum aestivum L.) Varieties. Int. J. Agric. Crop. Sci. 2011, 4, 726–729. Available online: https://www.researchgate.net/publication/267425480_Evaluation_of_Drought_Stress_on_Relative_Water_Content_Chlorophyll_Content_and_Mineral_Elements_of_Wheat_Triticum_aestivum_L_Varieties (accessed on 12 July 2021).
  39. Jatoi, W.A.; Baloch, M.J.; Kumbhar, M.B.; Khan, N.U.; Kerio, M.I. Effect of water stress on physiological and yield parameters at anthesis stages in elite spring wheat cultivars. Sarhad J. Agric. 2011, 27, 59–65. [Google Scholar]
  40. Abdullah, F.; Hareri, F.; Naaesan, M.; Adel Amar, M.; Zuher Kanbar, O. Effect of Drought on Different Physiological Characters and Yield Component in Different Varieties of Syrian Durum Wheat. J. Agric. Sci. 2011, 3, 127–133. Available online: https://www.researchgate.net/publication/342131357_Physiological_Performance_Of_Different_Durum_Wheat_Varieties_Grown_Under_Rainfed_Condition (accessed on 3 August 2021).
  41. Farooq, M.; Wahid, A.; Kobayashi, N.; Fujita, D.; Basra, S. Plant drought stress: Effects, mechanisms and management. Agron. Sustain. Dev. 2008, 29, 185–212. [Google Scholar] [CrossRef] [Green Version]
  42. Amt für Statistik Berlin-Brandenburg. Ernteberichterstattung über Feldfrüchte und Grünland im Land Brandenburg 2015. Available online: https://www.statistik-berlin-brandenburg.de/publikationen/stat_berichte/2016/SB_C02-02-00_2015j01_BB.pdf (accessed on 1 November 2020).
  43. Amt für Statistik Berlin-Brandenburg. Ernteberichterstattung über Feldfrüchte und Grünland im Land Brandenburg 2017. Available online: https://www.statistik-berlin-brandenburg.de/publikationen/stat_berichte/2018/SB_C02-02-00_2017j01_BB.pdf (accessed on 1 November 2020).
  44. Bogale, A.; Tesfaye, K.; Geleto, T. Morphological and physiological attributes associated to drought tolerance of Ethiopian durum wheat genotypes under water deficit condition. J. Biodivers. Agric. Sci. 2011, 1, 22–36. Available online: https://www.researchgate.net/publication/280831210_Morphological_and_physiological_attributes_associated_to_drought_tolerance_of_Ethiopian_durum_wheat_genotypes_under_water_deficit (accessed on 17 July 2021).
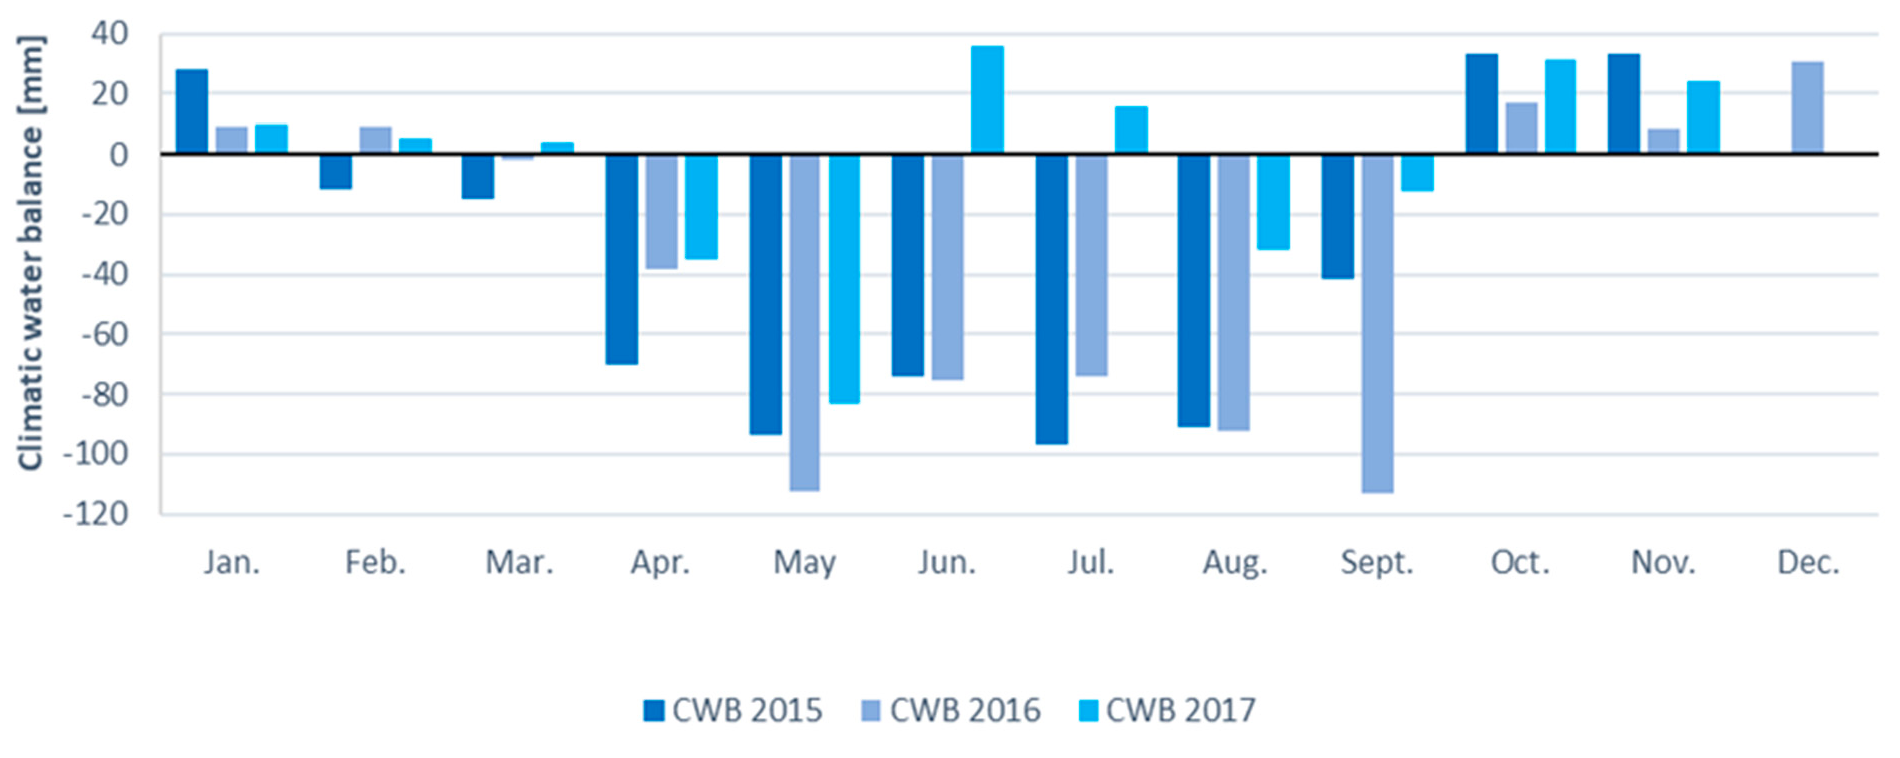
Figure 1. Climatic water balance for 2015, 2016 and 2017.
Agronomy 11 01854 g001
Figure 2. Course of soil moisture [% AWC] at 0–90 cm depth in the years 2015 to 2017.
Agronomy 11 01854 g002
Figure 3. Modeled and measured soil moisture [% AWC] of unirrigated winter wheat plots Opal and Kerubino and precipitation [mm] in the period March to July 2017.
Agronomy 11 01854 g003
Figure 4. Modeled and measured soil moisture [% AWC] of t irrigated winter wheat plots Opal and Kerubino and precipitation [mm] in the period March to July 2017.
Agronomy 11 01854 g004
Figure 5. Measurements of the biometric parameters of the winter wheat varieties Opal and Kerubino on irrigated and unirrigated plots from March to July 2017; (a) plant height; (b) degree of coverage; (c) leaf area index; (d) chlorophyll SPAD value.
Agronomy 11 01854 g005
Figure 6. Modeled and measured soil moisture [% AWC] of unirrigated winter wheat plots Opal and Kerubino and precipitation [mm] in the period March to July 2016.
Agronomy 11 01854 g006
Figure 7. Modeled and measured soil moisture [% AWC] of irrigated winter wheat plots Opal and Kerubino and precipitation [mm] in the period March to July 2016.
Agronomy 11 01854 g007
Figure 8. Measurements of the biometric parameters of the winter wheat varieties Opal and Kerubino on irrigated and unirrigated plots from March to July 2016; (a) plant height; (b) degree of coverage; (c) leaf area index; (d) chlorophyll SPAD value.
Agronomy 11 01854 g008
Figure 9. Modeled and measured soil moisture [% AWC] of unirrigated winter wheat plots Opal and Kerubino and precipitation [mm] in the period March to July 2015.
Agronomy 11 01854 g009
Figure 10. Measurements of the biometric parameters of the winter wheat varieties Opal and Kerubino on irrigated and unirrigated plots from March to July 2015; (a) plant height; (b) leaf area index; (c) degree of coverage.
Agronomy 11 01854 g010
Table 1. Detailed data on the field trial.
201520162017
average air temperature
(March-July)
13.6 °C14.3 °C14.0 °C
amount of precipitation
(March–July)
145 mm175 mm360 mm
winter wheat varietiesOpal & KerubinoOpal & KerubinoEdgar & Kerubino
plots2 unirrigated plots p. variety
2 irrigated plots p. variety
2 unirrigated plots p. variety
6 irrigated plots p. variety
3 unirrigated plots p. variety
3 irrigated plots p. variety
dates of irrigationnot available04.05., 10.05., 17.05., 23.05., 31.05., 8.06., 23.06., 30.06.26.04., 12.05., 18.05., 23.05., 29.05., 01.06., 20.06.
date of sowingnot available12.10.201523.09.2016
date of harvestnot available20.07.201631.07.2017
dates of measured soil moisture29.03., 30.04., 29.05.,
11.06., 17.07.
08.03., 15.04., 28.04., 10.05.,
24.05., 07.06., 21.06., 04.07.
28.03., 11.04., 03.05., 17.05.,
24.05., 31.05., 28.06., 12.07.
biometric parameters
(number of measurements for each plot)
plant height (6),
leaf area index (5),
degree of coverage (5),
Growth stages (4)
plant height (8),
leaf area index (8),
degree of coverage (8),
chlorophyll SPAD value (7),
Growth stages (7)
plant height (9),
leaf area index (5),
degree of coverage (9),
chlorophyll SPAD value (7),
Growth stages (7)
Table 2. Macro growth stages of winter wheat [19,20].
Macro Growth Stages of BBCH—ScaleDescription of Stage
0Germination
10Seeding growth
20Tillering
30Stem elongation
40Booting
50Ear emergence
60Flowering
70Milk developement
80Dough developement
90Ripening
Table 3. Climate data for the trial years and the reference period 1961 to 1990.
Jan.Feb.Mar.Apr.MayJun.Jul.Aug.Sep.Oct.Nov.Dec.Year
amount of precipiation
[mm]
1961–199044.037.738.244.156.369.552.460.345.535.547.355.0585.7
201536.94.317.014.414.343.455.563.424.357.749.814.8395.8
201617.124.022.327.323.556.646.227.910.532.918.335.8342.4
201714.620.236.918.033.0160.4112.250.538.772.847.221.7626.2
average air temperature
[°C]
1961–1990−0.80.23.68.113.216.617.917.513.89.44.20.78.7
20153.72.66.810.114.217.717.722.114.38.67.97.111.1
2016−0.13.94.99.216.320.420.819.118.89.03.93.010.8
2017−1.02.57.88.715.718.719.219.514.411.96.13.710.6
heat sum
[°C]
1961–19901938.8
20152228.4
20162370.1
20172250.0
Table 4. Dry periods during yield-relevant phenological growth stages (GS) of winter wheat in 2015 to 2017.
201520162017
PeriodLengthGSPeriodLengthGSPeriodLengthGS
05 March–20 March16 08 March–21 March14 30 March–11 April1730
12 April–25 April14 31 March–12 April13 24 April–03 May1433
13 May–27 May1530–3929 April–11 May1330–39
02 June–12 June1150–59/6013 May–22 May1030–39
24 July–09 August179218 June–03 July1650–59/60
15 July–26 July1287
Table 5. Growth stages (GS) of winter wheat varieties Opal, Edgar, and Kerubino on irrigated and unirrigated plots.
201520162017
Opal
Irrigated
OpalKerubino
Irrigated
Kerubino Opal
Irrigated
Opal Kerubino
Irrigated
Kerubino Edgar
Irrigated
EdgarKerubino
Irrigated
Kerubino
25.03. 20202020 28.03.25252525
15.04.3030303011.04.30303030
28.04.31313131
03.05.33333333
10.05.3333333317.05.33333333
24.05.5153565624.05.50515657
29.05.60506050 31.05.61616262
11.06.6060606007.06.6262626214.06.74747574
21.06.8080808028.06.84848484
04.07.8785878512.07.87908991
17.07.92929292
Table 6. Grain and straw yield of winter wheat varieties Opal, Edgar, and Kerubino on irrigated and unirrigated plots.
Grain Yield at 86% Dry Matter in t/haStraw Yield at 86% Dry Matter in t/ha
Opal/EdgarOpal/Edgar IrrigatedKerubinoKerubino IrrigatedOpal/EdgarOpal/Edgar IrrigatedKerubinoKerubino Irrigated
20155.15.65.36.73.43.53.3.9
increase in earnings (%) 9 25 6 25
20164.75.64.86.22.12.72.12.9
increase in earnings (%) 19 31 28 38
20176.17.16.47.23.95.03.95.5
increase in earnings (%) 17 14 29 40
Table 7. Cost-effectiveness of the irrigation of winter wheat varieties Opal/Edgar and Kerubino from 2015 to 2017 in Marquardt.
Yield (t/ha) of the Winter Wheat Varieties
(Average Grain Yield of the Trial Plots)
Opal/EdgarKerubino
201520162017201520162017
Yield without irrigation5.14.76.15.34.86.4
Yield with irrigation5.65.67.16.76.27.2
Difference0.50.91.01.41.40.8
Proceedsin(€/t) from the Winter Wheat Varieties
(https://markt.agrarheute.com/marktfruechte-1/weizen-6 abgerufen on 28 October 2020 at 7:00 p.m.)
Opal/EdgarKerubino
201520162017201520162017
Proceeds (unirrigated)93.986.3.0110.998.688.4118.0
Proceeds (irrigated)101.9102.8129.3123.8115.6134.4
Difference8.016.518.425.227.216.4
Amount (mm) and Costs of Irrigation (€)
Opal/EdgarKerubino
201520162017201520162017
Amount of irrigation (mm)-8070-8070
Costs of irrigation (×2.80) in (€)
[27] (p. 158)
-224196-224196
Annual process costs of the irrigation machine with nozzle trolley (pipe diameter 90 × 6.7 mm)
[27] (p. 157/158)
-242242-242242
Proceeds (€/t) from the Winter Wheat Varieties
Opal/EdgarKerubino
201520162017201520162017
Proceeds (unirrigated)93.986.3110.998.688.4118.0
Proceeds
(irrigated minus costs of irrigation)
-56.285.5-69.090.6
Difference-−30.1−25.4-−19.4−27.4
Table 8. p-values of multiple linear regression at the time of measurement between the biometric parameters and the grain yield of winter wheat varieties on irrigated plots 2016 (p < 0,05: significant, marked red).
Date, BBCH-Stade and
Winter Wheat
Variety
15.04.2016
BBCH 30
28.04.2016
BBCH 31
10.05.2016
BBCH 33
24.05.2016
BBCH 51–56
Biometric
Parameters
OpalKerubinoOpalKerubinoOpalKerubinoOpalKerubino
plant height0.8770.6600.2120.1440.1480.8600.3770.562
LAI0.5250.4730.1290.0570.4400.9790.0580.065
chlorophyll value0.2620.1420.0870.0070.7390.7560.8670.021
degree of coverage0.9510.1940.1730.2020.6500.1280.0450.119
Date, BBCH-Stade and
Winter Wheat
Variety
07.06.2016
BBCH 62
21.06.2016
BBCH 80
04.07.2016
BBCH 85–87
Biometric
Parameters
OpalKerubinoOpalKerubinoOpalKerubino
plant height0.0850.6730.0330.4800.0050.123
LAI0.4830.4790.7990.9540.2680.159
chlorophyll value0.0320.7900.6750.7480.3100.163
degree of coverage0.0490.5650.4070.5490.2190.175
Publisher’s Note: MDPI stays neutral with regard to jurisdictional claims in published maps and institutional affiliations.