Article

The Impact of Global Warming on the Winter Wheat Production of China

1
National Engineering and Technology Center for Information Agriculture, Nanjing Agricultural University, Nanjing 210095, China
2
Engineering Research Center of Smart Agriculture, Nanjing Agricultural University, Ministry of Education, Nanjing 210095, China
3
Key Laboratory for Crop System Analysis and Decision Making, Nanjing Agricultural University, Ministry of Agriculture and Rural Affairs, Nanjing 210095, China
4
Jiangsu Key Laboratory for Information Agriculture, Nanjing Agricultural University, Nanjing 210095, China
5
Jiangsu Collaborative Innovation Center for Modern Crop Production, Nanjing Agricultural University, Nanjing 210095, China
*
Author to whom correspondence should be addressed.
Agronomy 2021, 11(9), 1845; https://doi.org/10.3390/agronomy11091845
Submission received: 5 August 2021 / Revised: 10 September 2021 / Accepted: 10 September 2021 / Published: 14 September 2021

Abstract

:
The impact of global warming on crop growth periods and yields has been evaluated by using crop models, which need to provide various kinds of input datasets and estimate numerous parameters before simulation. Direct studies on the changes of climatic factors on the observed crop growth and yield could provide a more simple and intuitive way for assessing the impact of climate change on crop production. In this study, four cultivars which were planted over more than 15 years in eight test stations in the Northern Winter Wheat Region of China were selected to investigate the relationships between growth periods, grain yields, yield components and temperatures. It was found that average temperatures and heat degree-days (HDD) during the winter wheat growing seasons tended to increase over time series at most study sites. The length of growth period and growing degree days (GDD) were not fixed for a given cultivar among different years and locations, and the variation on the periods from sowing to jointing was relatively greater than in the other periods. The increasing temperature mainly shortened the periods from sowing to jointing and jointing to anthesis, which led to the decrease in entire growth periods. Positive relationships between spike number, grain number per spike, grain yields and average temperatures were identified in the Northern Winter Wheat Region of China. The grain yield in the study area increased by 406.3 kg ha−1 for each 1 °C increase in average temperature. Further, although the positive relationship between grain yield and HDD was found in our study, the heat stress did not lead to the wheat yield decline in the study region. Temperature is a major determinant of wheat growth and development, the average temperature and the frequency of heat stresses are projected to increase in the future, so understanding the effect of temperature on wheat production and adopting appropriate adaptation are required for the implementation of food security policies.

1. Introduction

The global population is expected to exceed 9 billion people by 2050 [1], which will require a 70–110% increase in food production to meet future demands [2,3]. Wheat is the third most produced crop in the world behind corn and rice, and an essential staple food for millions of people [4]. About 21% of the world’s food is derived from wheat, which is grown on 216 million hectares of farmland worldwide [5]. However, current evidence indicates that the trend of increasing wheat yields in many countries has slowed down in recent decades [6,7,8,9]. In order to meet worldwide food security, the yields of wheat are expected to rise by 60% (for the 9 billion population) by 2050 [10]. Most of this increase should come from greater yields on existing cropland to avoid environmental degradation, destruction of natural ecosystems and loss of biodiversity [11,12,13]. A better understanding of the factors responsible for wheat yield would help ensure that yields can continue to increase in the future. However, since many factors have been changing simultaneously, it is difficult to separate their effects. Previous research has documented two factors that may contribute to yield increase, adopting cultivars with a longer grain-filling period and shifting planting dates earlier [14]. A longer grain-filling period can increase the length of time devoted to yield accumulation. Earlier planting can increase yields by prolonging the length of vegetative period and possibly the grain-filling period. In addition, a longer vegetative period generally means a higher leaf area, and thus faster biomass fixation [15]. Future crop yields are expected to be influenced by complex interactions between the effects of increases in atmospheric concentrations of CO2 [16] and atmospheric pollution [17] as well as the effects of climate change [18].
Global average surface air temperature has risen by roughly 0.13 °C per decade since 1950 and is projected to increase 0.20 °C per decade over the next two to three decades [19]. Together with global warming, heat stress is becoming more common and affects crop yield and quality [20,21,22]. In China, the annual mean air temperature has increased by 1.20 °C since 1960, which was larger than the average global temperature rise [23]. The agricultural production system is very sensitive to the weather and thus directly affected by climate change [24]. In the past twenty years, the magnitude, rate and pattern of climate change impacts on crop productivity have been studied mainly by crop growth simulation models [25,26]. In general, these studies provide robust evidence that crop phenology shifts notably in response to ongoing climate change [27,28,29,30], and global warming is already slowing yield gains at a majority of crop growing locations, besides the complex effects of agronomic factors [31,32,33]. However, there is a lack of experimental observed data on the effects of climate change on crop growth and yield. Here, we analyzed the time-course changing trends in temperature across the Northern Winter Wheat Region of China, and then investigated the relationships between temperature and growth periods and grain yields by using long term observation data from meteorological stations and field experiments. The expected results may help to clarify whether there are significant time trends in the changes of temperatures during the different wheat growth periods and whether these changes have an impact on wheat growth periods and grain yields in the Northern Winter Wheat Region of China.

2. Materials and Methods

2.1. Collection of Crop and Weather Data

The winter wheat phenology (sowing, jointing, anthesis and maturity dates), yield, yield components (spike number, grain number per spike and 1000-grain weight) and climate data (daily minimum, maximum and average temperatures, rainfall and sunshine hours) come from Chinese agro-meteorological experiment stations, which are operated by Chinese Meteorological Administration. The observation data were collected by well-trained agricultural technicians following a standardized observation methodology. Each observation variable had a clear definition. For example, jointing date was recorded when the first node was approximately 2 cm above the soil surface; anthesis was defined as the date of 50% plants with florets opening at the middle-upper position of the spikes; maturity was specified as the date when grains reached maximum dry weight during development. Winter wheat at each station was managed according to local practices for control of weeds and disease. Fertilizers and irrigation were applied according to the relatively optimal practices for local high yield target. In the present study, only the dataset with the cultivars planted more than 15 years was used for analyzing the impacts of climate change on winter wheat growth periods and yields. Thus, four cultivars in eight stations across four provinces were selected. All the selected stations are located in the Northern Winter Wheat Region of China, which accounted for more than 60% of the total wheat cultivation area in China, and more than 70% of total wheat production in the country. Furthermore, the cultivars used in the experimentation at each station were all representative of the local production areas. The details of the dataset are listed in Table 1.

2.2. Calculation of GDD and HDD between Wheat Growth Stages

The accumulated growing degree days (GDD, °C d) between sowing and jointing (GDD1), jointing and anthesis (GDD2), anthesis and maturity (GDD3), and sowing and maturity (GDDT) was calculated by Equations (1)–(4). During a growth period, GDD is the sum of daily thermal time (DTT) of this period. Since the response of plant to daily mean temperatures is non-linear, the temperatures at different times during one day are more closely correlated to plant response than the daily mean temperature [34]. In this study, eight temperature factors (Tfac) are computed per day and used to generate eight 3-h temperature (T) values from daily minimum (Tmin) and maximum (Tmax) temperatures to describe the diurnal temperature pattern [35]. For each station and each year, GDD is calculated as follows:
GDD = SUM DTT
DTT = 1 / 8 × I = 1 8 T I T b
T I = Tmin + Tfac I × Tmax Tmin
Tfac I = 0.931 + 0.114 × I 0.0703 × I 2 + 0.0053 × I 3   I = 1 , 2 ,   ,   8
where Tb is the base temperature. In some studies, the same base temperature is applied for all phases of crop development. For example, Tb is fixed to be 0 °C in the whole growth period of wheat [36] and fixed to be 10 °C in the whole growth period of maize [37]. However, in practice, a higher base temperature is found for the grain filling phase than for the vegetative phase until anthesis [14,38]. Therefore, in this study, the base temperature of winter wheat is set to be 0 °C before double ridge stage, 3.30 °C from double ridge to heading, and 5.10 °C from heading to maturity, respectively [35].
To illustrate the impact of heat stress on wheat yield, the heat degree-days (HDD, °C d) was calculated in this paper. HDD was considered to include the heat duration and intensity, which could reflect the heat stress synthetically. Here, HDD is defined as the total heat degree-days when the daily maximum temperature is more than 30 °C from anthesis to maturity [21,39]. For each station and each year, HDD is calculated by Equations (5) and (6).
HD i = 0                         Tmax < 30   ° C Tmax 30   ° C     Tmax 30   ° C
HDD = da dm HD i
where Tmax is the daily maximum temperature, HDi is the heat degree days above the temperature threshold of 30 °C, da is the anthesis date and dm is the maturity date.

2.3. Data Analysis

The significance of time trends in the changes of average temperature, GDD, HDD and length of growth durations during different growth periods (sowing to jointing (GP1), jointing to anthesis (GP2), anthesis to maturity (GP3), and sowing to maturity (GPT)) of winter wheat were tested for slopes at the p < 0.05 probability level according to the Student’s t test. The relationship between growth durations and average temperatures was evaluated by using regression analyses. To assess the impact of average temperature and HDD on wheat grain yield and yield components, the first-difference method was used to remove the effects from technique improvements [40,41]. First difference time series was calculated for both the average temperature, HDD, grain yield and yield components by subtracting the prior year’s value from each year. Calculations were performed, and tables and figures were prepared using Statistical Product and Service Solutions (SPSS).

3. Results and Discussion

3.1. Trends of Temperature during Growth Periods

During the study period, the temporal patterns of average temperatures in the winter wheat growing seasons experienced the similar historical trends (Table 2). From sowing to jointing, there was a general increasing trend in average temperature, except for the decreasing trend at Huanghua, Hancheng and Laizhou, which was not significant. From jointing to anthesis, the time-series trends of average temperature were increasing in all stations, although the increase was significant only at four stations. From anthesis to maturity, no decreasing trend was found, while only three stations reached the significant level (p < 0.05). From sowing to maturity, the average temperatures at Pucheng, Wugong, Laiyang and Yantai increased significantly, with increases of 0.17, 0.14, 0.07 and 0.09 °C per year, respectively. In general, the temporal trends of average temperature during the winter wheat growing seasons tended to increase at most stations under study, which is more obvious during the later growth period. Furthermore, the heat degree-days (HDD) from anthesis to maturity tended to increase significantly (p < 0.01) in all the study stations, except for Pucheng in Shaanxi Province. In general, heat stress between anthesis and maturity becomes more serious during the study period in the Northern Winter Wheat Region of China, which is in agreement with previous studies [21].

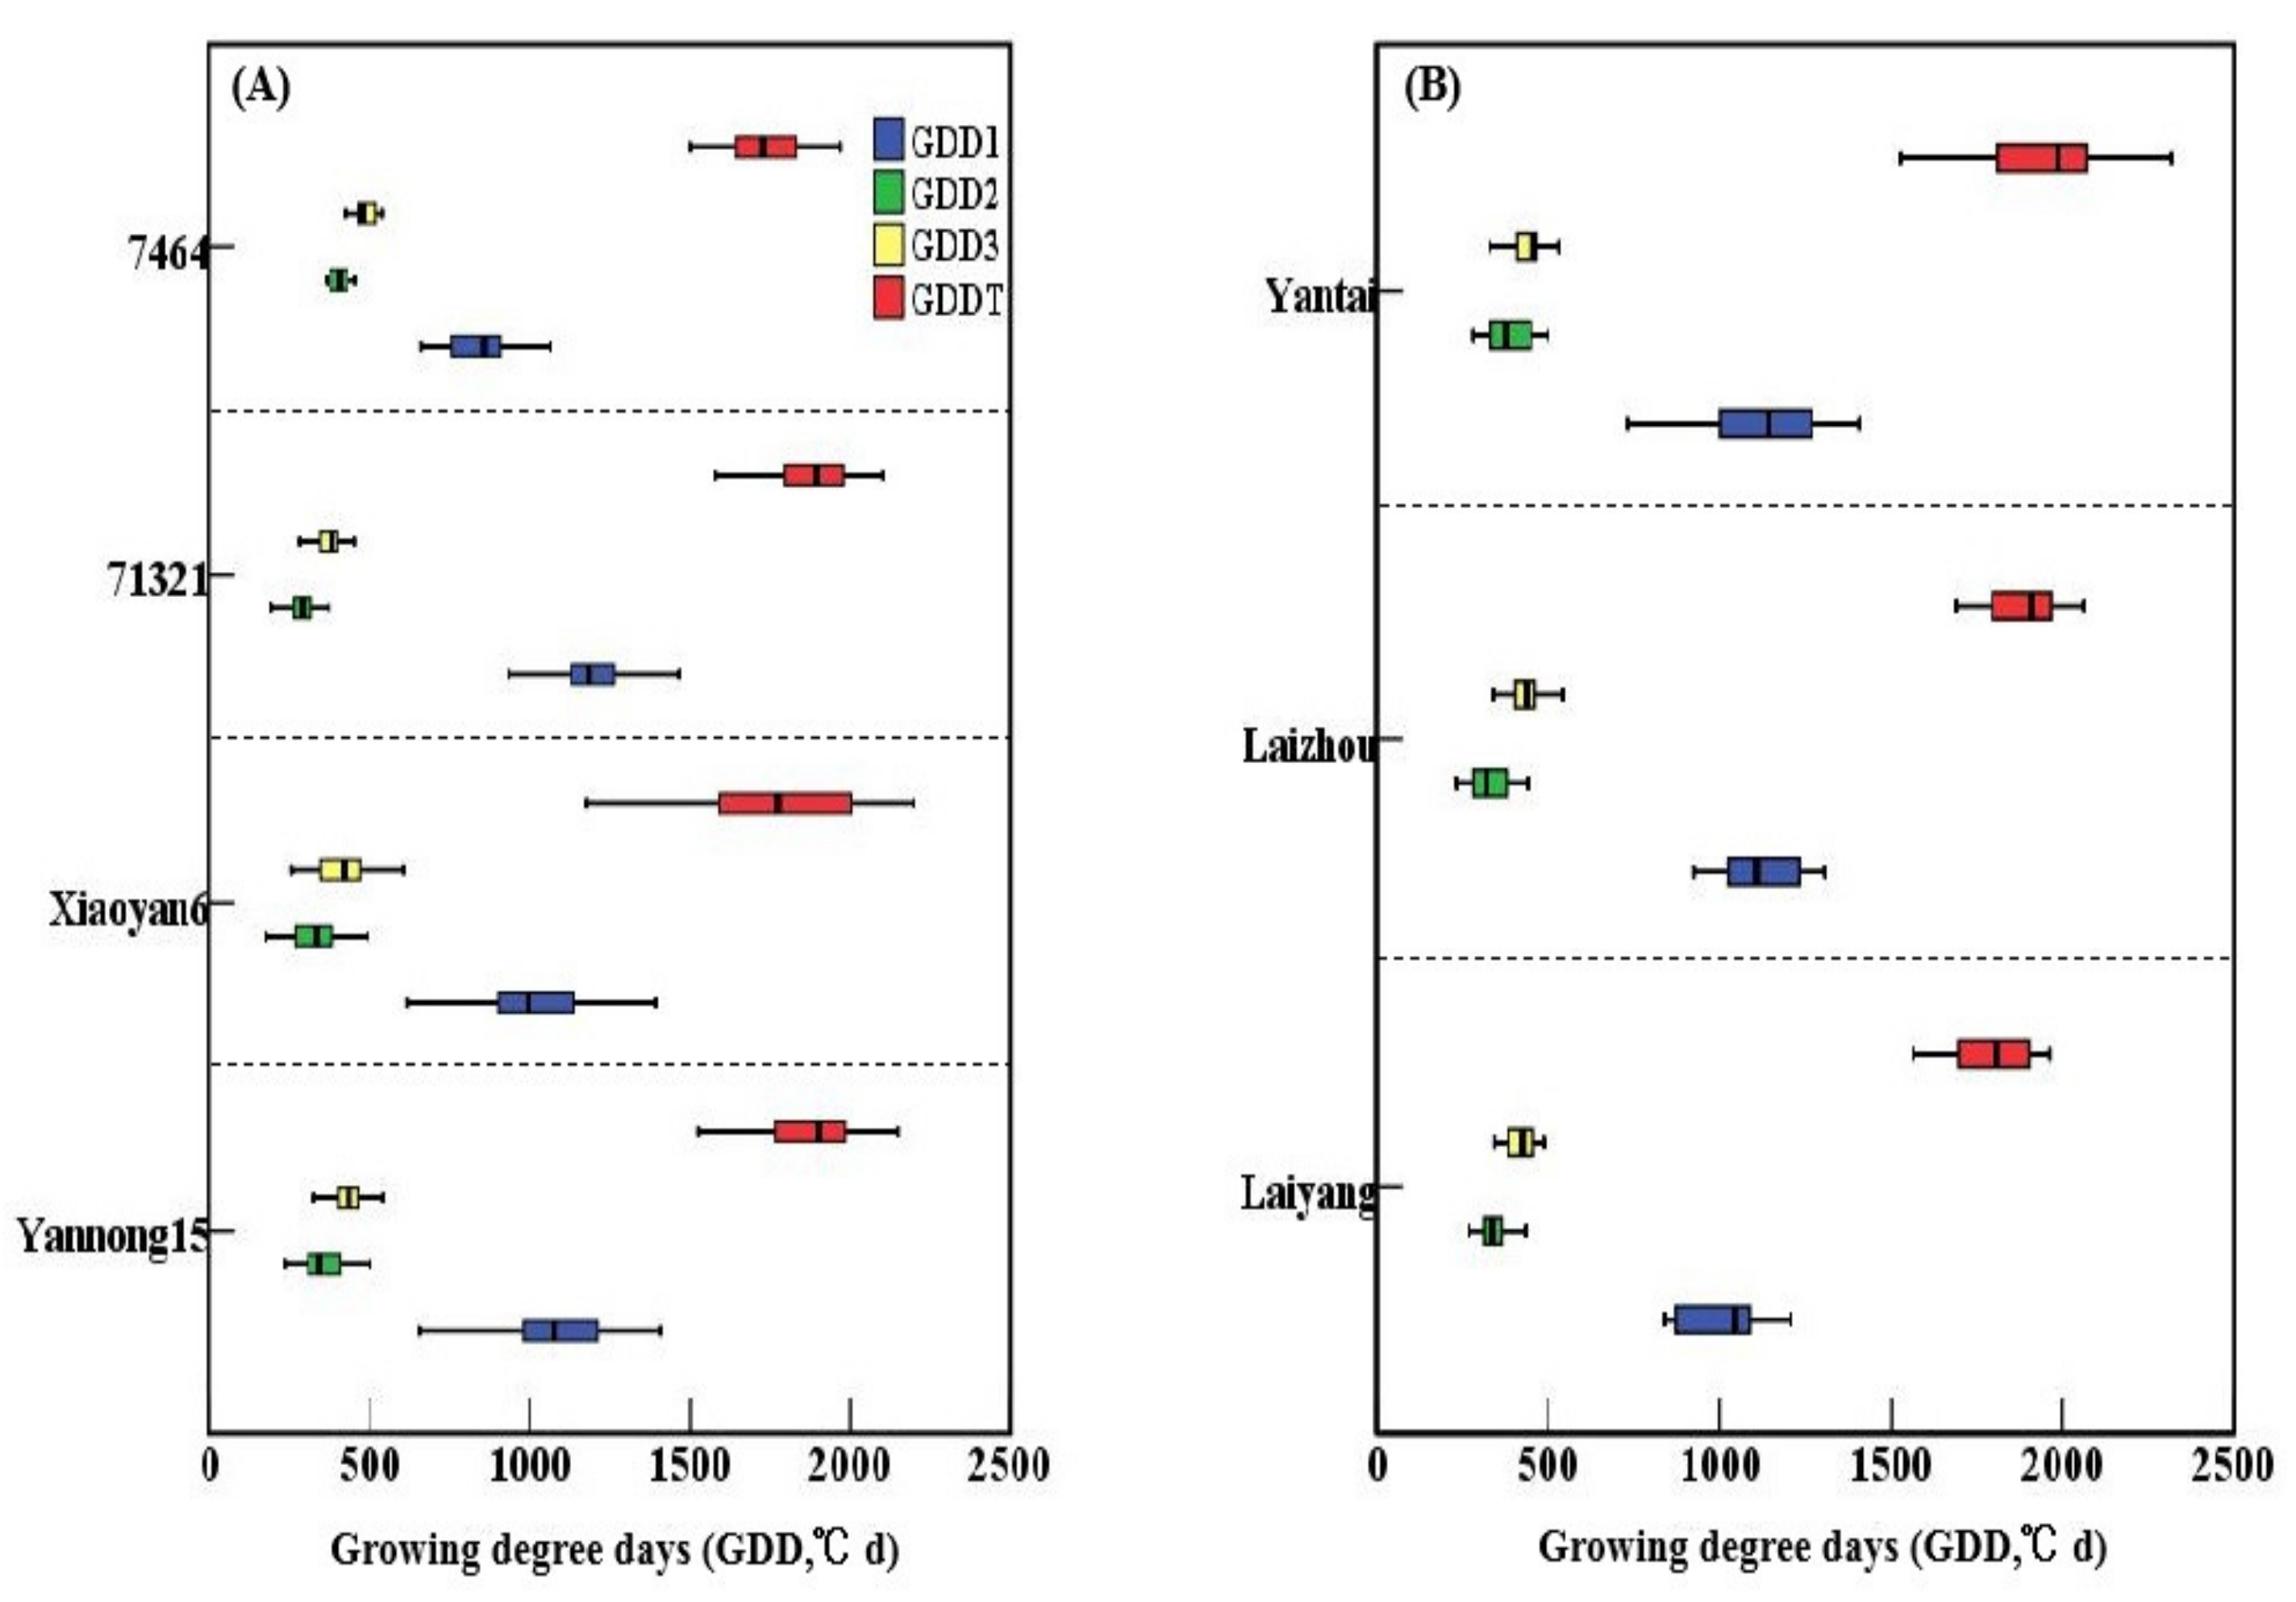
3.2. Variations of GDD during Growth Periods

As important factors relating to crop phenology, heat unit requirements, such as growing degree days (GDD), influence crop growth and development [42,43]. The GDD required to complete a given growth phase is usually thought to be constant and dependent only on the cultivars [33]. In our study, however, GDD was found to vary with climate change over time series, although the cultivar was fixed at each station or remained the same at different stations (Figure 1 and Table 3). In the past decades, the values of GDDT (GDD from sowing to maturity) for 7464, 71321, Xiaoyan6 and Yannong15 varied from 1499 to 1971, 1392 to 2105, 1177 to 2202 and 1443 to 2317 °C d, respectively. Moreover, the time-series trends of GDDT were increasing in three of four cultivars, although the increase was not significant (Table 3). During the study period, the values of GDD1 for 7464, 71321, Xiaoyan6 and Yannong15 changed by 2.47, −2.91, 3.65 and −1.77 °C d per year, respectively; the values of GDD2 changed by −5.04, 4.31, 0.23 and 4.10 °C d per year, respectively; and the values of GDD3 changed by −2.07, 3.99, 2.12 and 0.38 °C d per year, respectively.

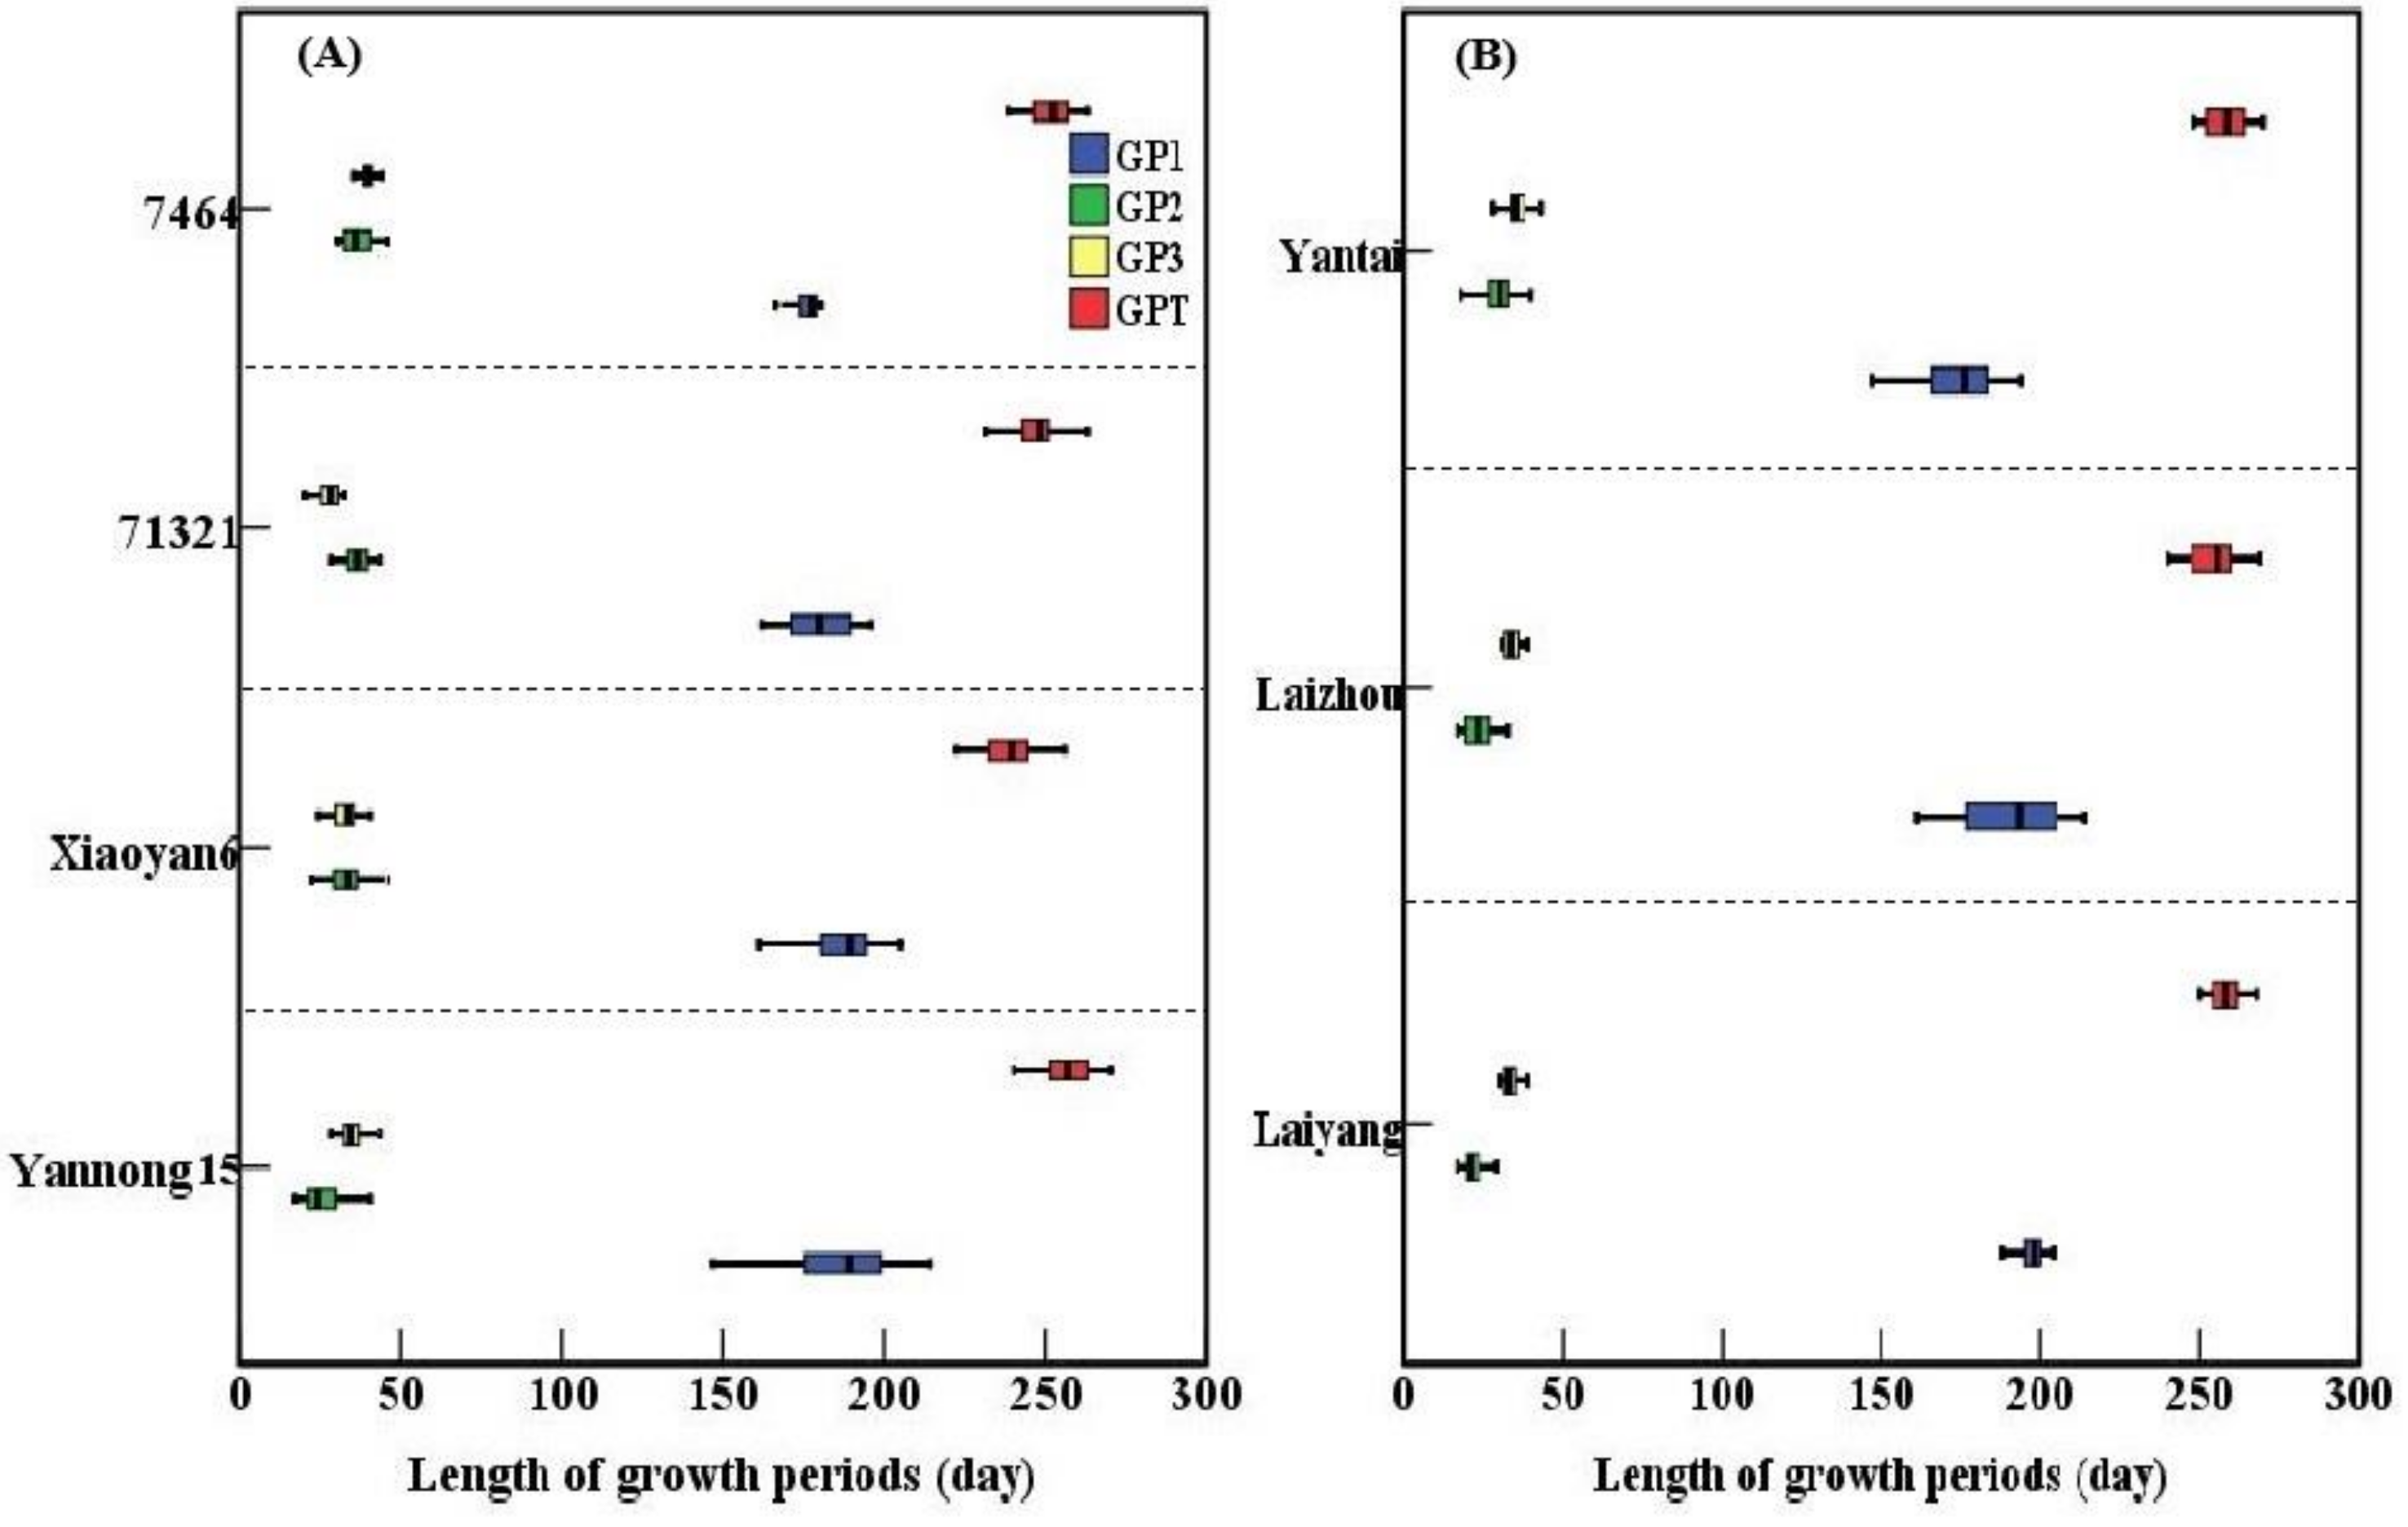
3.3. Variations of Growth Period

The observed length of winter wheat growth periods varied widely under climate change, although the cultivar was kept the same at each station or different stations (Figure 2). From sowing to maturity, the total length of growth period (GPT) for 7464, 71321, Xiaoyan6 and Yannong15 varied from 238 to 263 (9.5%), 224 to 263 (14.8%), 222 to 256 (13.3%), and 240 to 270 days (11.1%), respectively. In addition, the time-series trends of GPT decreased significantly (p < 0.01) for all cultivars, except for the cultivar 71321 (Table 4). In the past decades, the length of GPT for 7464, 71321, Xiaoyan6 and Yannong15 shortened by 1.17, 0.30, 0.63 and 0.49 days per year with climate change, respectively. For division into three growth phases, the length of growth period from sowing to jointing (GP1) decreased slightly for 71321 and Yannong15, yet the GP1 for 7464 and Xiaoyan6 decreased significantly (p < 0.01), with decreases of 0.51 and 0.73 days per year, respectively. The length of growth period from jointing to anthesis (GP2) also showed significant decreasing trend for 7464 and Xioayan6, with decreases of 0.58 and 0.31 days per year. Yet, the length of GP2 was prolonged by 0.13 days per year for Yannong15 with climate change over the time series. Moreover, the length of growth period from anthesis to maturity (GP3) changed slightly for all cultivars, with the decreases of 0.02 and 0.01 days per year for 7464 and Yanong15, and increases of 0.14 and 0.09 days per year for 71321 and Xiaoyan6. These results indicate that the length of growth periods for a certain cultivar in different climate conditions was not constant, and the variation in the length from sowing to jointing (GP1) was relatively greater than in the growth periods of jointing to anthesis (GP2) and anthesis to maturity (GP3), which was different to the reports on other cereal crops including rice [42,44].

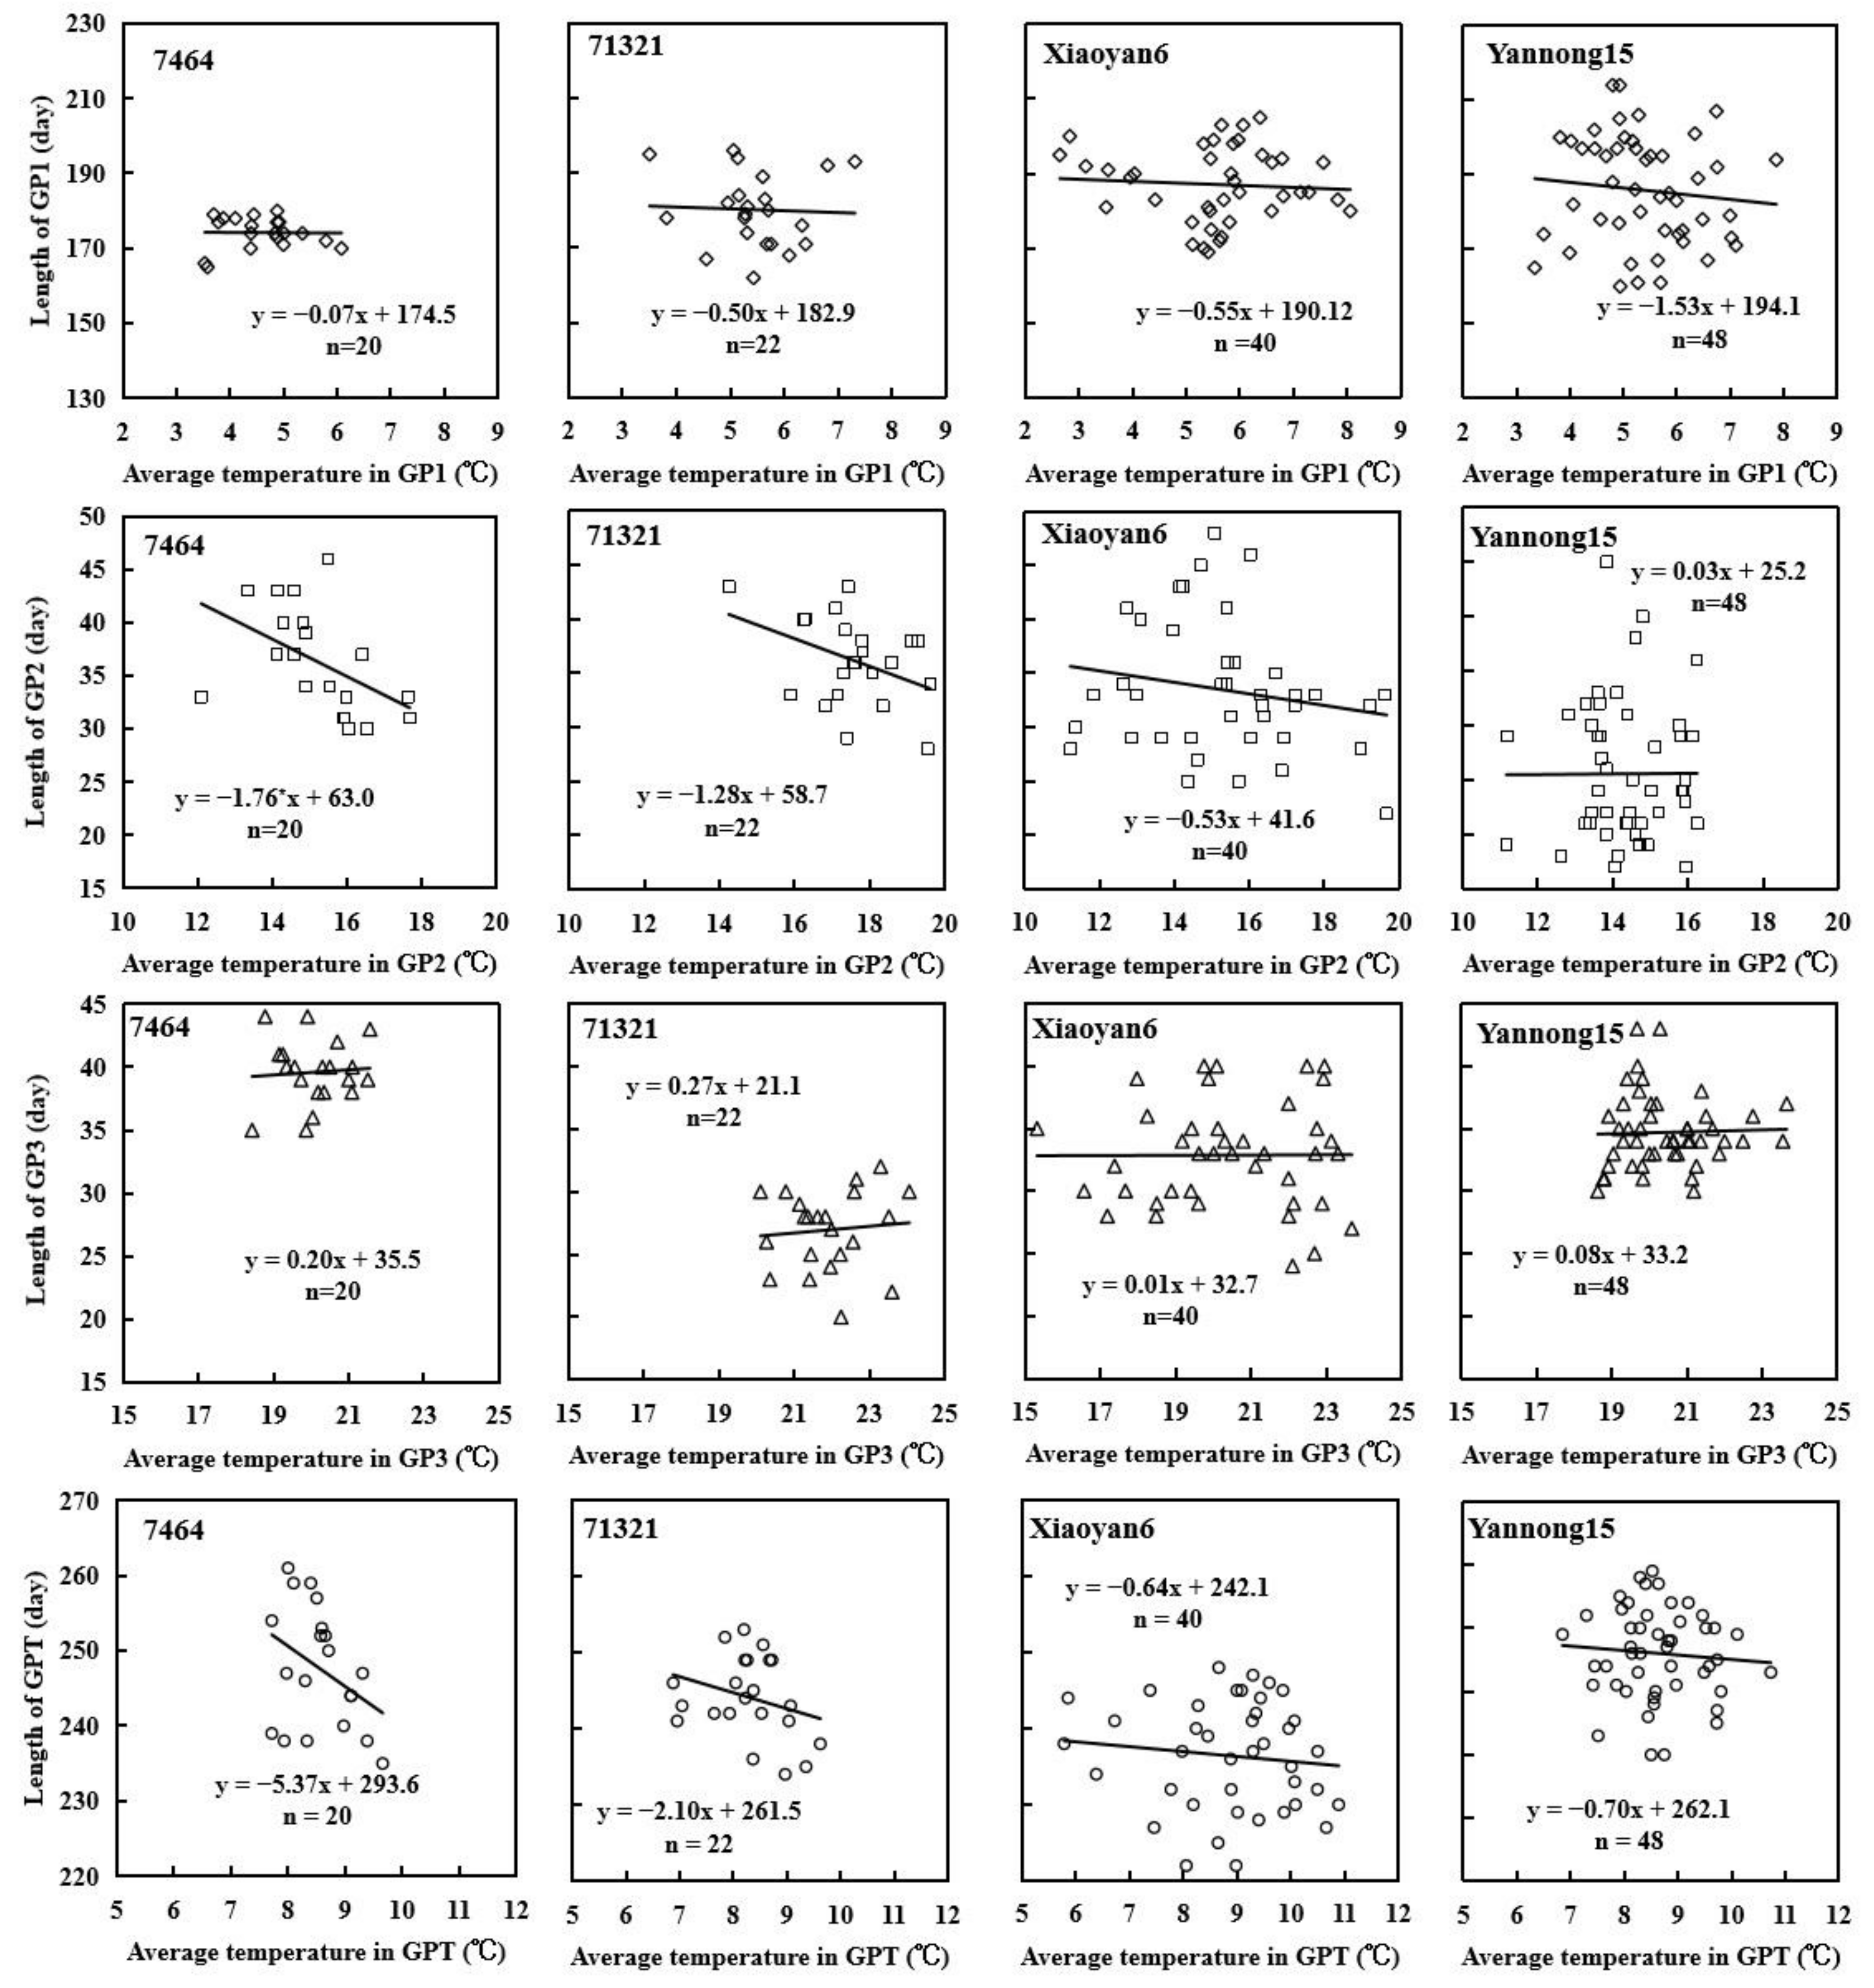
3.4. Relationships between Average Temperature and Growth Durations

The length of growth periods from sowing to jointing (GP1) tended to be shortened with the increased average temperatures (Figure 3), although the linear relationships between average temperature and GP1 were very weak in the past decades. The reason for the weaker response to temperature for this phase of winter wheat is most likely that there is also a photoperiodic response during this phase, which contributes to reducing the effects of temperature changes on GP1. The length of growth periods from jointing to anthesis (GP2) was also shortened by the increased average temperatures, except for GP2 of Yannong15. The potential numbers of spikes and florets were determined during this phase. Thus, the shortening of GP2 would induce the lower grain yield. The length of growth periods from anthesis to maturity (GP3) was prolonged slightly with the increased average temperatures. The increasing trends of GP3 over average temperature may be caused by the relatively shorter GP2, which led to the earlier grain filling initiation. For winter wheat, the earlier grain filling initiation will prolong the grain filling period, thus lengthening the time available for yield accumulation. Overall, the length of entire growth periods from sowing to maturity (GPT) of winter wheat at the study stations was shortened with the increased average temperature. The length of GPT for cultivar 7464, 71321, Xiaoyan6 and Yannong15 shortened by 5.37, 2.10, 0.64 and 0.70 days for each 1 °C increase in average temperature during the study periods, respectively.

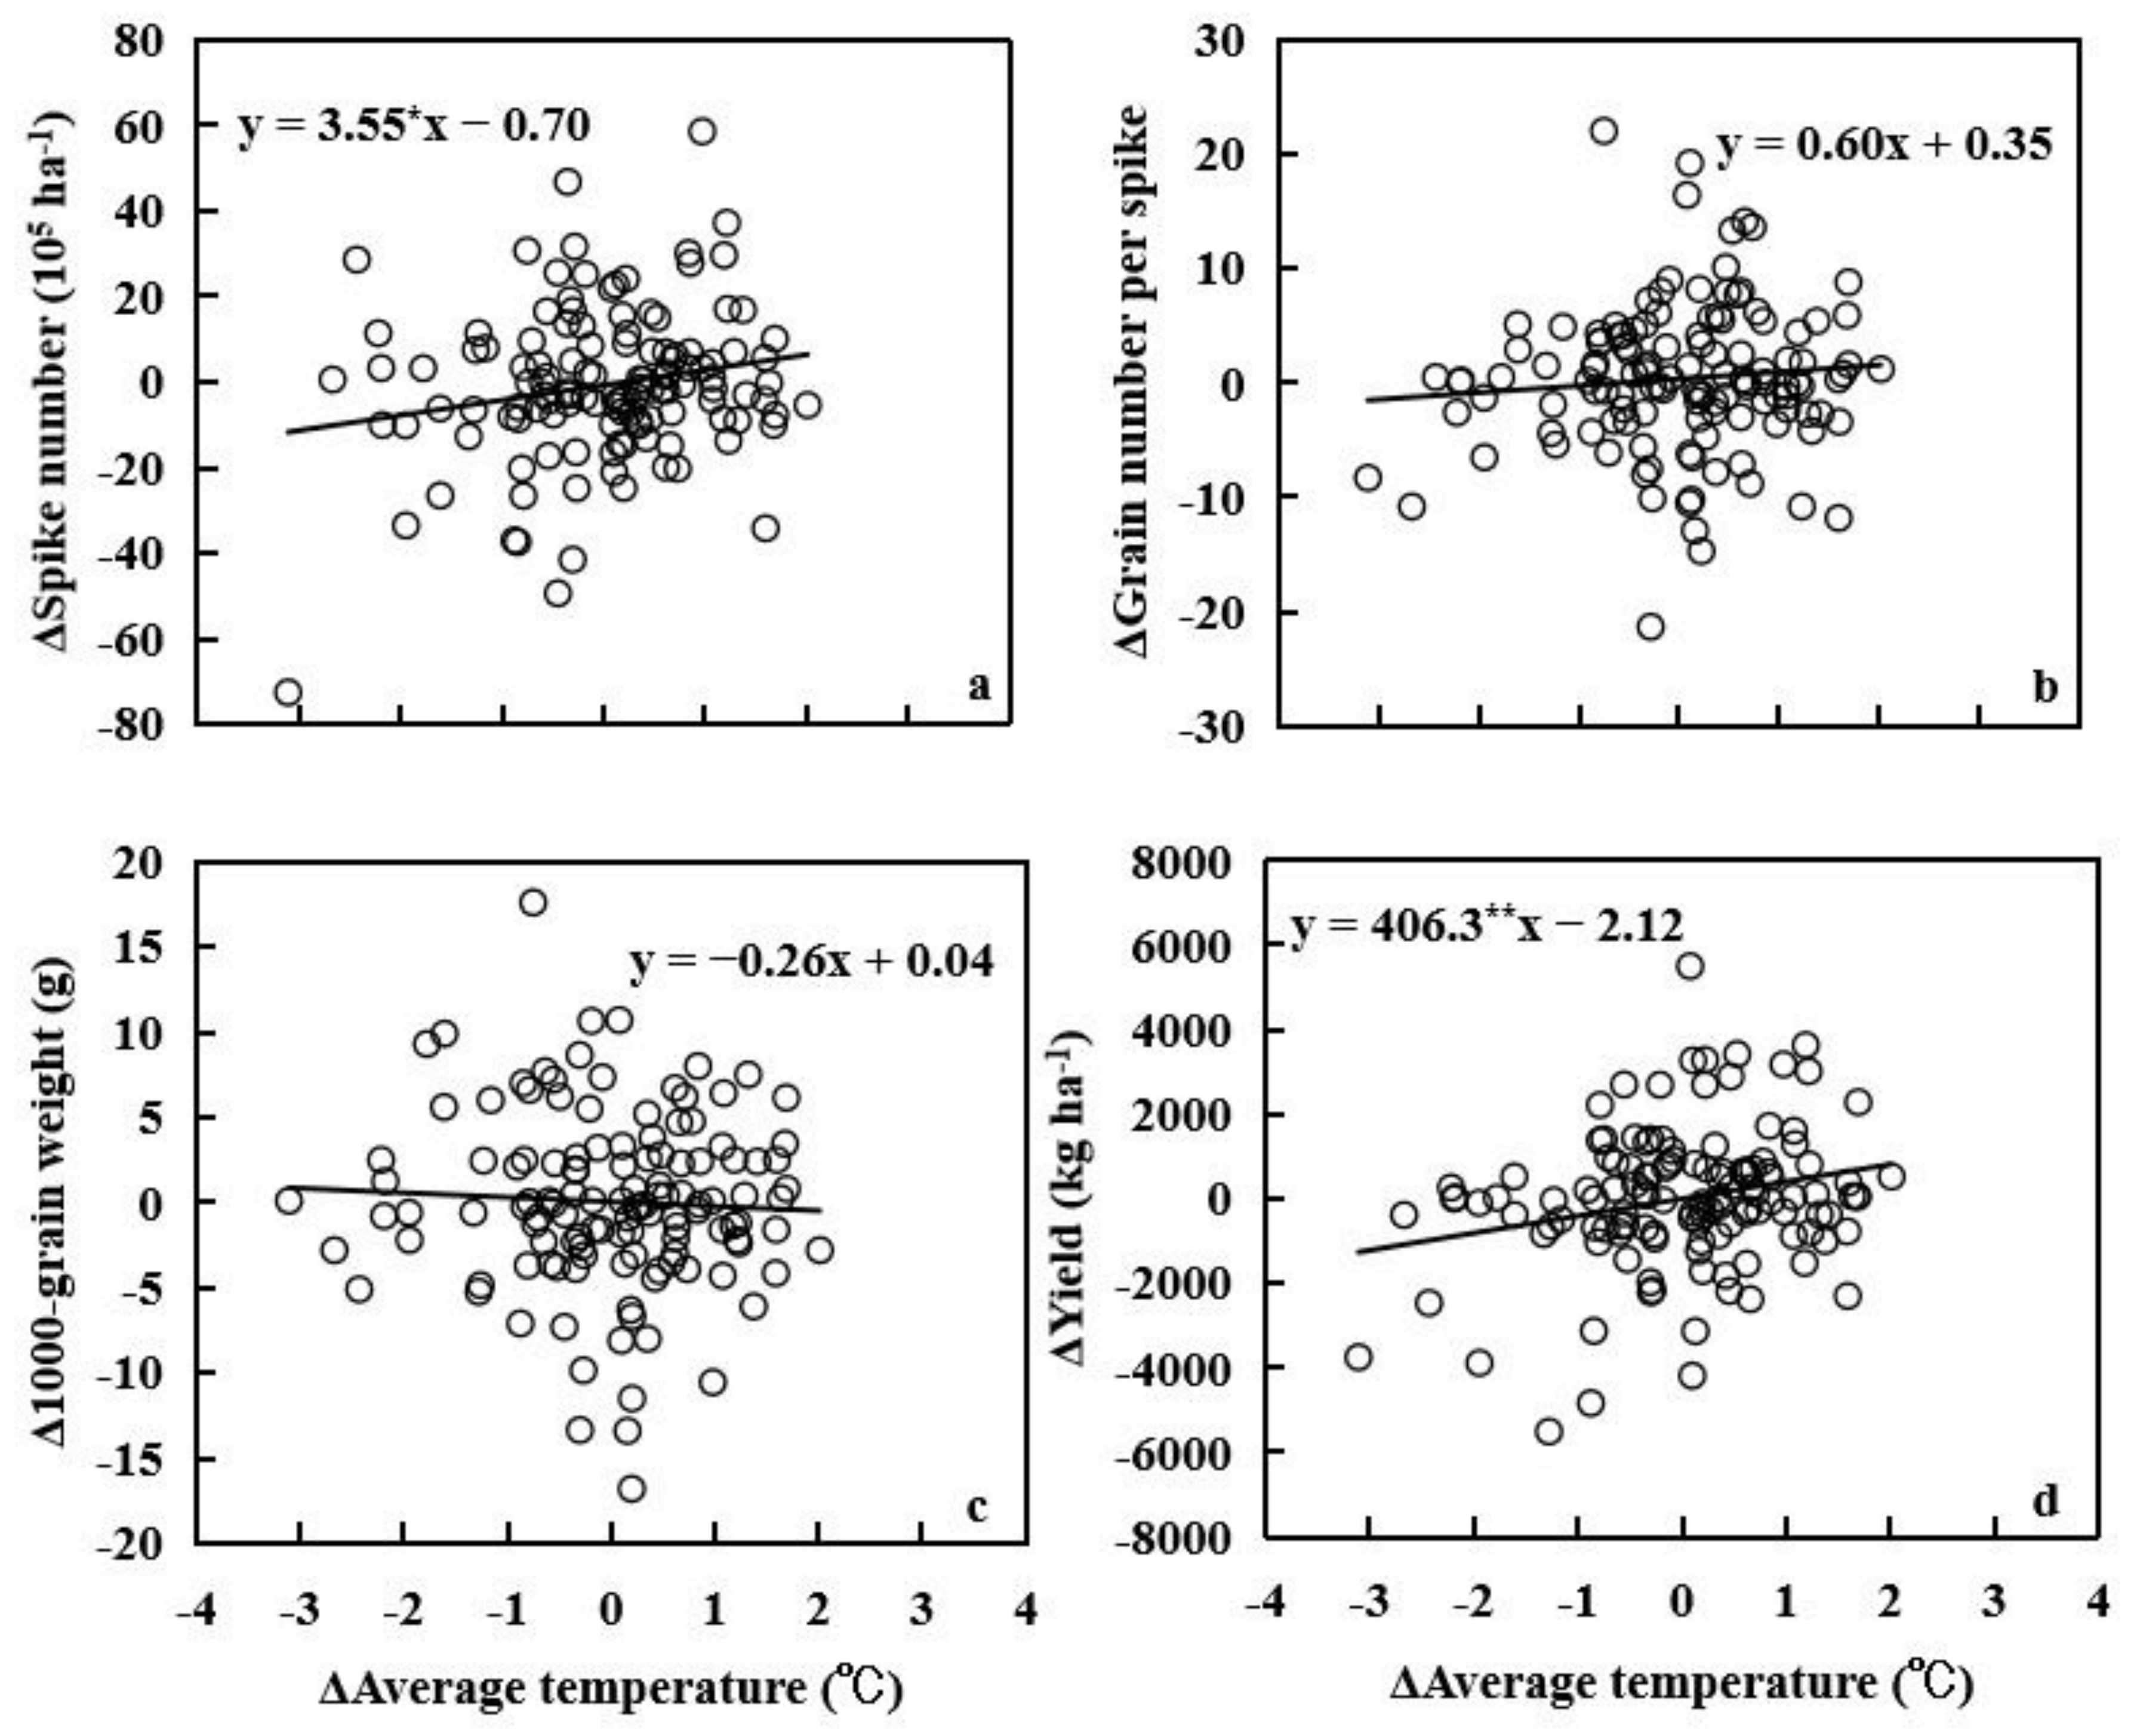
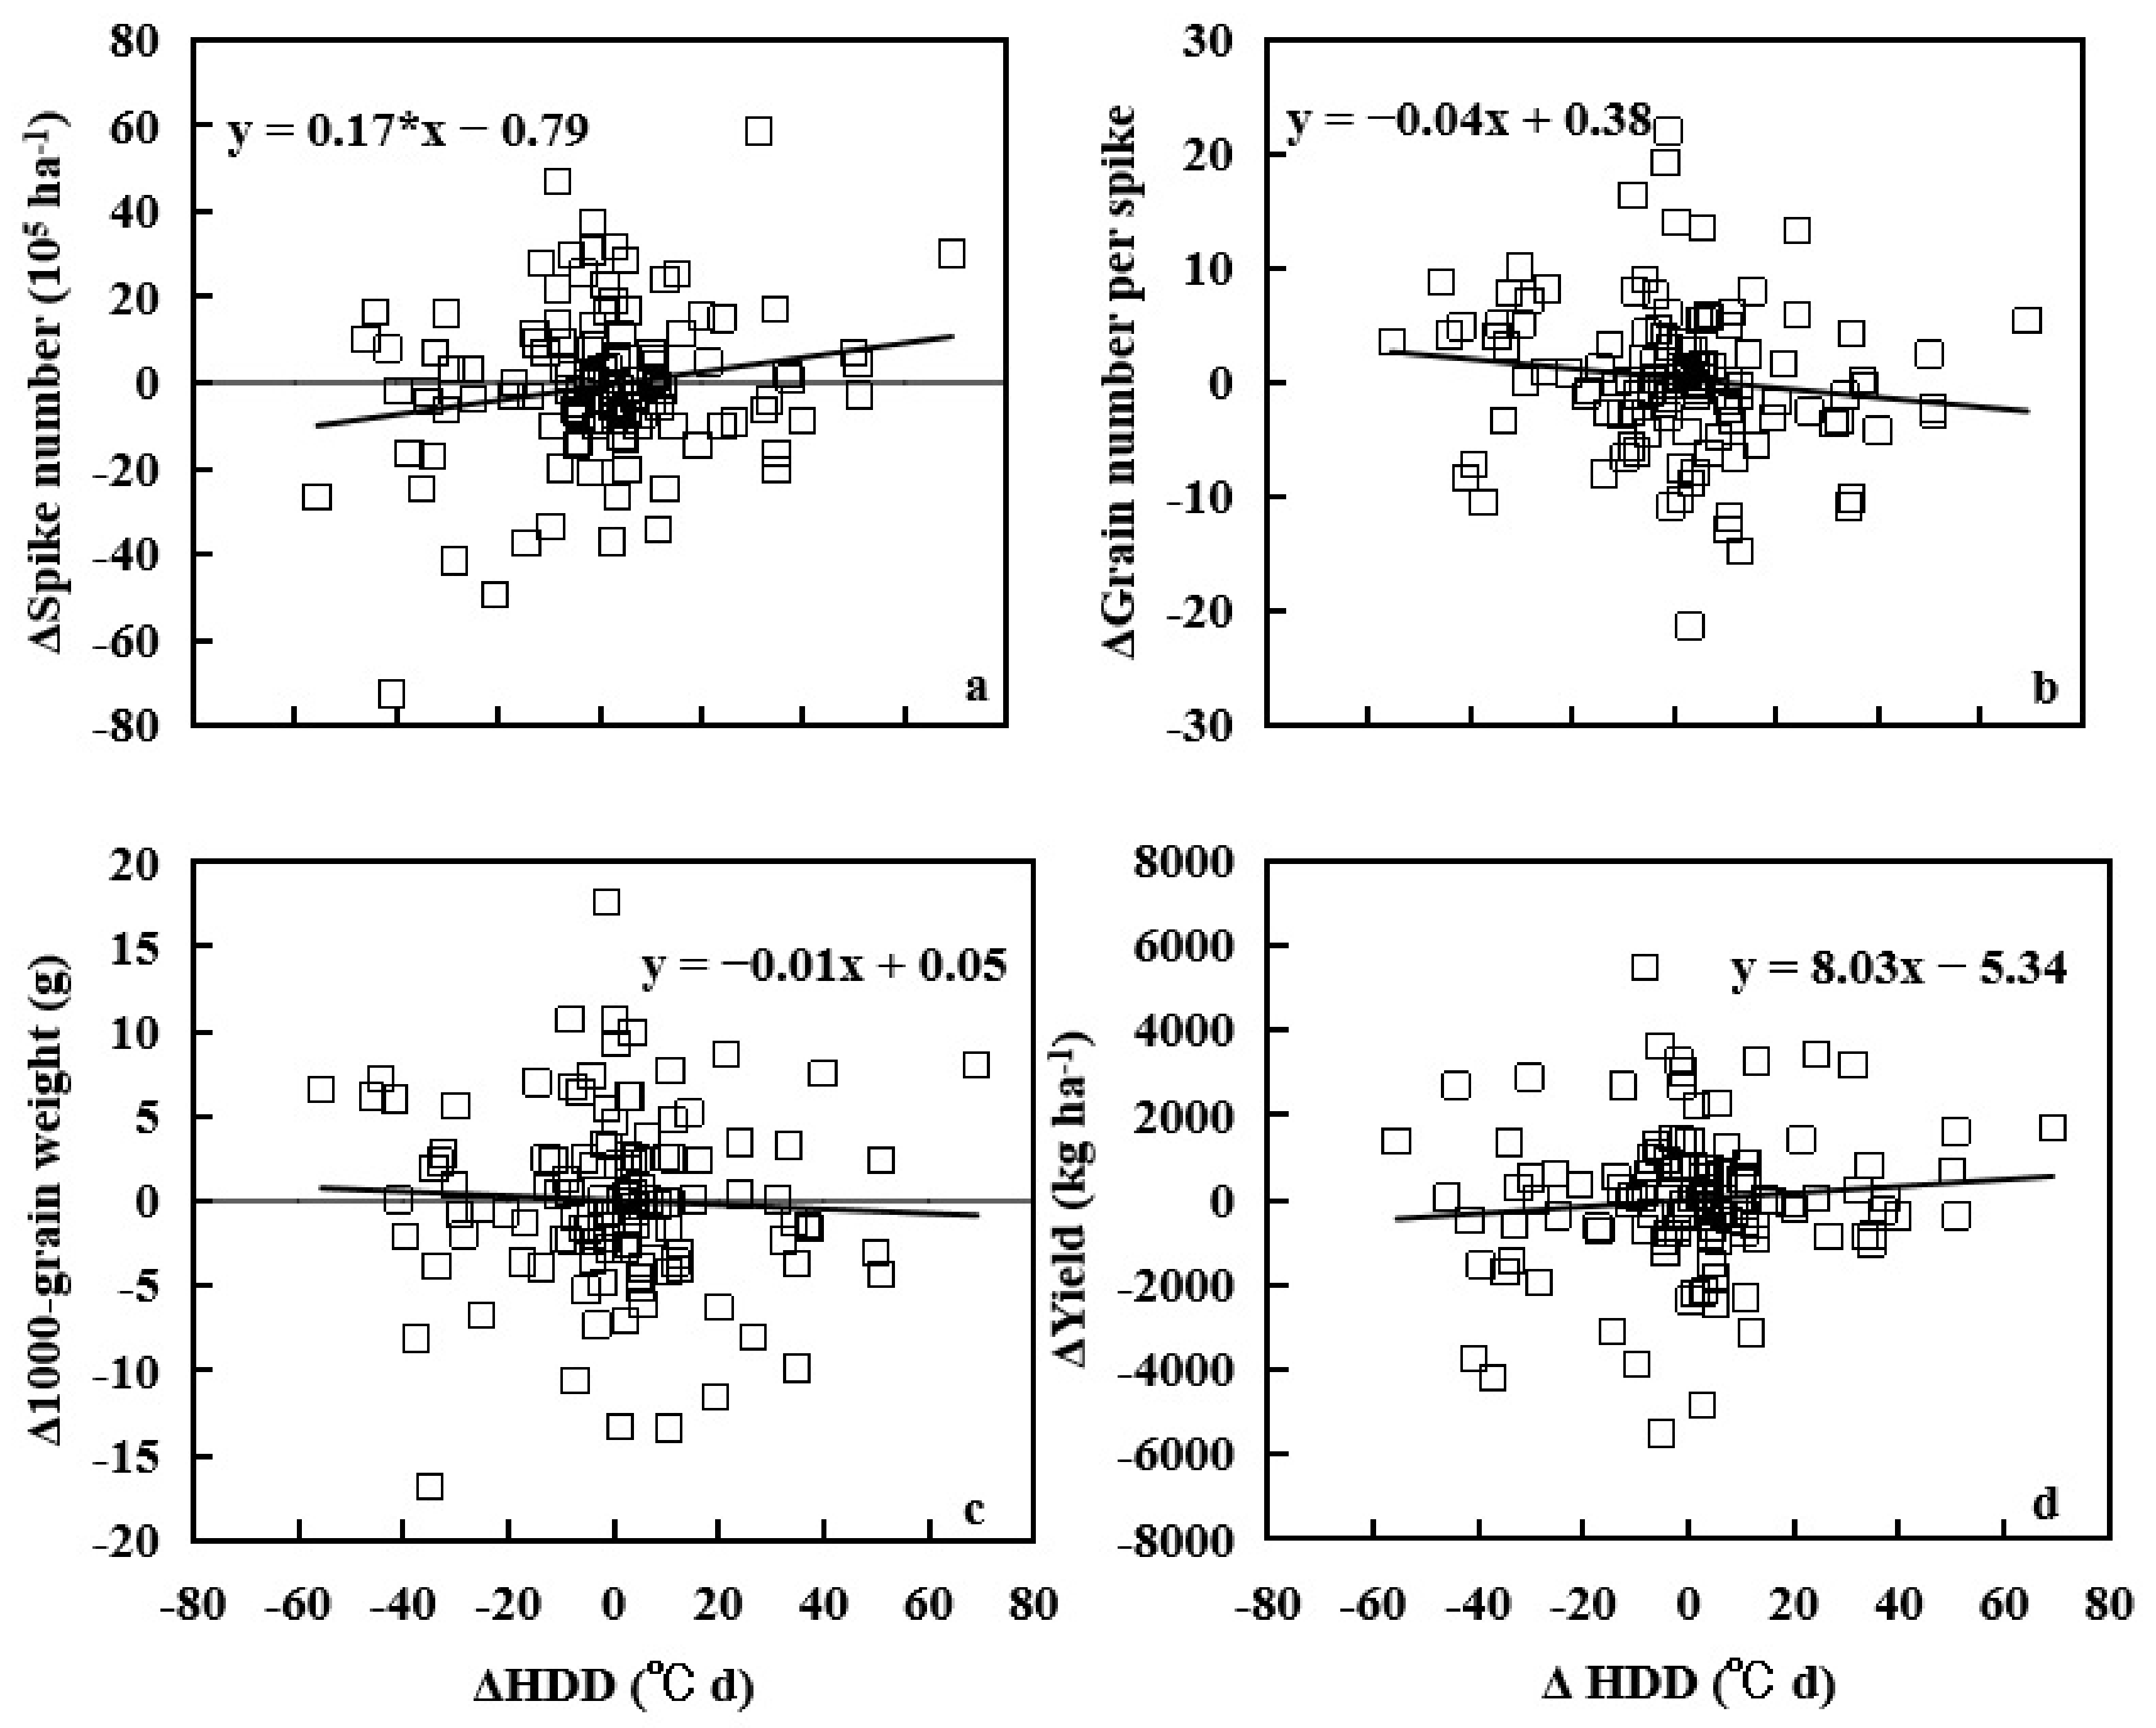
3.5. Relationships between Average Temperature and HDD and Yield Components and Grain Yield

In the Northern Winter Wheat Region of China, there was a positive relationship between the variation of wheat yield components and the average temperature, except for the 1000-grain weight (Figure 4a–c). The spikelet number increased significantly (p < 0.05) in the study area, with the increases of 3.55 × 10⁵ per ha for each 1 °C increase in average temperature. Moreover, a significant (p < 0.01) linear relationship between the variation of grain yield and average temperature was also found in the Northern Winter Wheat Region of China (Figure 4d), which indicated that the increase in average temperature exhibited positive effects on grain yield. The grain yield increased by 406.3 kg ha−1 (0.02%) for every 1 °C increase in average temperature. One of the reasons for yield increasing in the study area was found to be associated with the prolonged growth period from anthesis to maturity and the increased spike number and grain number per spike (Figure 3 and Figure 4).
Previous studies suggested that the optimal temperature for grain set and grain filling is between 19 and 22 °C in wheat [45]. Short episodes of temperatures more than 30 °C during flowering period can cause heat stress and lead to the seed setting decreasing, eventually resulting in a low grain number [46]. In the present study, the general decreasing of 1000-grain weight and grain number per spike with heat stress were observed in the Northern Winter Wheat Region of China (Figure 5b,c), which was in agreement with the previous reports [47,48]. However, the present results find that there was an increasing trend in grain yield with heat degree-days, although the increasing trend did not reach the significant level (Figure 5d). The reasons for yield increasing under heat stress condition in the study area is the fact that the heat stress between anthesis and maturity was not significant in the Northern Winter Wheat Region of China, which cannot reduce the final grain yield.

4. Conclusions

Crop growth simulation models are useful tools in the climate impact studies as they can deal with multiple climate factors and processes of crop growth and yield formation that are sensitive to climate change [49]. These models have been applied in many studies, including the assessment of temperature impacts on crop production [25,33,50,51]. However, using the crop growth models to estimate the effect of climate change on crop production is an indirect method and needs various kinds of input datasets. Moreover, numerous parameters that specify cultivar differences in the model are not directly related to measurable quantities. These parameters are obtained by calibration, i.e., by fitting the model to field data, which increases the uncertainty of model simulation results [52,53,54]. Long term field experiment data can provide more confirmative information and directly reflect the impact of climate change on crop growth and yield. Combining the changes of climate factors and the long term filed observed experimental data could analyze the impact of climate change on crop production more intuitively and directly. Therefore, the cultivars planted during more than 15 years in the field environments were selected in the present study to analyze the impact of climate change on winter wheat production. Here the results show that the rising temperature indeed shortened the growth duration but does not reduce the wheat grain yield under the current management technology level in the past decades, which can help to evaluate the importance of near-term climate change for the supply of key food commodities. However, the analysis in this study just focused on global temperature and ignored the effects of photoperiod, rainfall and cold stress event etc., which are also important for crop production. The global average temperature is predicted to rise faster (roughly 0.20 °C per decades) over the next two to three decade [19], with more extreme climate events, such as heat wave, frost damage, global dimming, drought and flood [20], which may produce negative effects on the winter wheat production in the future. Therefore, the combined effects of different extreme climate conditions on food production need to be further elucidated with cereal crops including wheat.

Author Contributions

All the authors contributed to the study conception and design. Material preparation, data collection and analysis were performed by Y.Z. and T.Y. The first draft of the manuscript was written by Y.Z., and all authors commented on previous versions of the manuscript. All the authors read and approved the final manuscript. Conceptualization, Y.Z. and L.L.; Methodology, Y.Z., X.Q., T.Y. and Z.L.; Formal analysis, Y.Z., X.Q. and T.Y.; Writing—original draft, Y.Z. and X.Q.; Writing—review & editing, L.L.; Revising, L.L., Y.Z. and B.L.; Supervision, L.L. All authors have read and agreed to the published version of the manuscript.

Funding

This study was supported by the National Key Research and Development Program of China (2019YFA0607404), and the National Natural Science Foundation of China (31872848).

Institutional Review Board Statement

Not applicable.

Informed Consent Statement

Not applicable.

Data Availability Statement

Not applicable.

Conflicts of Interest

We declare that we have no conflicts of interest.

References

  1. Godfray, H.C.; Beddington, J.R.; Crute, I.R.; Haddad, L.; Lawrence, D.; Muir, J.F.; Pretty, J.; Robinson, S.; Thomas, S.M.; Toulmin, C. Food security: The challenge of feeding 9 billion people. Science 2010, 327, 812–818. [Google Scholar] [CrossRef] [Green Version]
  2. Tilman, D.; Balzer, C.; Hill, J.; Befort, B.L. Global food demand and the sustainable intensification of agriculture. Proc. Natl. Acad. Sci. USA 2011, 108, 20260–20264. [Google Scholar] [CrossRef] [Green Version]
  3. Rosegrant, M.W.; Ringler, C.; Zhu, T.J. Water for agriculture: Maintaining food security under grow-ing scarcity. Ann. Rev. Environ. Resour. 2009, 34, 205–222. [Google Scholar] [CrossRef]
  4. Asseng, S.; Foster, I.A.N.; Turner, N.C. The impact of temperature variability on wheat yields. Glob. Chang. Biol. 2011, 17, 997–1012. [Google Scholar] [CrossRef]
  5. FAOSTAT. Food and agriculture organisation of the United Nations. In FAOSTAT Database; FAOSTAT: Rome, Italy, 2019; Available online: http://www.fao.org/faostat/en/#data/QC (accessed on 9 September 2021).
  6. Gouis, J.L.; Oury, F.X.; Charmet, G. How changes in climate and agricultural practices in-fluenced wheat production in Western Europe. J. Cereal Sci. 2020, 93, 102960. [Google Scholar] [CrossRef]
  7. Chen, Y.; Zhang, Z.; Tao, F.L.; Wang, P.; Wei, X. Spatio-temppral patterns of winter wheat yield potential and yield gap during the past three decades in North China. Field Crops Res. 2017, 206, 11–20. [Google Scholar] [CrossRef]
  8. Wiesmeier, M.; Hubner, R.; Kogel-Knabner, I. Stagnating crop yields: An overlooked risk for the carbon balance of agricultural soils? Sci. Total Environ. 2015, 536, 1045–1051. [Google Scholar] [CrossRef] [PubMed]
  9. Cassman, K.G.; Grassini, P. A global perspective on sustainable intensification research. Nat. Sustain. 2020, 3, 262–268. [Google Scholar] [CrossRef] [Green Version]
  10. Jaiswal, S.; Sheoran, S.; Arora, V.; Angadi, U.B.; Iquebal, M.A.; Raghav, N.; Aneja, B.; Kumar, D.; Singh, R.; Sharma, P.; et al. Putative microsatellite DNA marker-based wheat genomic resource for varietal improvement and management. Front. Plant Sci. 2017, 8, 2009. [Google Scholar] [CrossRef] [PubMed] [Green Version]
  11. Tilman, D.; Cassman, K.G.; Matson, P.A.; Naylor, R.; Polasky, S. Agricultural sustainability and intensive production practices. Nature 2002, 418, 671–677. [Google Scholar] [CrossRef]
  12. Peng, S.; Huang, J.; Sheehy, J.E.; Laza, R.C.; Visperas, R.M.; Zhong, X.; Centeno, G.S.; Khush, G.S.; Cassman, K.G. Rice yields decline with higher night temperature from global warming. Proc. Natl. Acad. Sci. USA 2004, 101, 9971–9975. [Google Scholar] [CrossRef] [Green Version]
  13. Grassini, P.; Cassman, K.G. High-yield maize with large net energy yield and small global warming intensity. Proc. Natl. Acad. Sci. USA 2012, 109, 1074–1079. [Google Scholar] [CrossRef] [PubMed] [Green Version]
  14. Sacks, W.J.; Kucharik, C.J. Crop management and phenology trends in the U.S. Corn Belt: Impacts on yields, evapotranspiration and energy balance. Agric. For. Meteorol. 2011, 151, 882–894. [Google Scholar] [CrossRef]
  15. Bastidas, A.M.; Setiyono, T.D.; Dobermann, A.; Cassman, K.G.; Elmore, R.W.; Graef, G.L.; Specht, J.E. Soybean sowing date: The vegetative, reproductive, and agronomic impacts all rights reserved. Crop Sci. 2008, 48, 727–740. [Google Scholar] [CrossRef] [Green Version]
  16. Long, S.P.; Ainsworth, E.A.; Leakey, A.D.B.; Nösberger, J.; Ort, D.R. Food for thought: Lower-than-expected crop yield stimulation with rising CO2 concentrations. Science 2006, 312, 1918–1921. [Google Scholar] [CrossRef] [PubMed]
  17. Feng, Z.; Kobayashi, K. Assessing the impacts of current and future concentrations of surface ozone on crop yield with meta-analysis. Atmos. Environ. 2009, 43, 1510–1519. [Google Scholar] [CrossRef]
  18. Battisti, D.S.; Naylor, R.L. Historical warnings of future food insecurity with unprecedented seasonal heat. Science 2009, 323, 240–244. [Google Scholar] [CrossRef] [Green Version]
  19. Lobell, D.B.; Schlenker, W.; Costa-Roberts, J. Climate trends and global crop production since 1980. Science 2011, 333, 616–620. [Google Scholar] [CrossRef] [Green Version]
  20. Planton, S.; Déqué, M.; Chauvin, F.; Terray, L. Expected impacts of climate change on extreme climate events. Comptes Rendus Geosci. 2008, 340, 564–574. [Google Scholar] [CrossRef]
  21. Liu, B.; Liu, L.; Tian, L.; Cao, W.; Zhu, Y.; Asseng, S. Post-heading heat stress and yield impact in winter wheat of China. Glob. Chang. Biol. 2014, 20, 372–381. [Google Scholar] [CrossRef]
  22. Liu, L.; Ma, J.; Tian, L.; Wang, S.; Tang, L.; Cao, W.; Zhu, Y. Effects of postanthesis high temperature on grain quality formation for wheat. Agron. J. 2017, 109, 1970–1980. [Google Scholar] [CrossRef]
  23. Piao, S.; Ciais, P.; Huang, Y.; Shen, Z.; Peng, S.; Li, J.; Zhou, L.; Liu, H.; Ma, Y.; Ding, Y.; et al. The impacts of climate change on water resources and agriculture in China. Nature 2010, 467, 43–51. [Google Scholar] [CrossRef]
  24. Nelson, G.C.; Valin, H.; Sands, R.D.; Havlík, P.; Ahammad, H.; Deryng, D.; Elliott, J.; Fujimori, S.; Hasegawa, T.; Heyhoe, E.; et al. Climate change effects on agriculture: Economic responses to biophysical shocks. Proc. Natl. Acad. Sci. USA 2014, 111, 3274–3279. [Google Scholar] [CrossRef] [PubMed] [Green Version]
  25. Rosenzweig, C.; Elliott, J.; Deryng, D.; Ruane, A.C.; Müller, C.; Arneth, A.; Boote, K.J.; Folberth, C.; Glotter, M.; Khabarov, N.; et al. Assessing agricultural risks of climate change in the 21st century in a global gridded crop model intercomparison. Proc. Natl. Acad. Sci. USA 2014, 111, 3268–3273. [Google Scholar] [CrossRef] [PubMed] [Green Version]
  26. Liu, B.; Liu, L.L.; Asseng, S.; Zhang, D.; Ma, W.; Tang, L.; Cao, W.; Zhu, Y. Modelling the effects of post-heading heat stress on biomass partitioning, and grain number and weight of wheat. J. Exp. Bot. 2020, 71, 6015–6031. [Google Scholar] [CrossRef] [PubMed]
  27. Menzel, A.; Sparks, T.H.; Estrella, N.; Koch, E.; Aasa, A.; Ahas, R.; Alm-Kübler, K.; Bissolli, P.; Braslavská, O.G.; Briede, A.; et al. European phenological response to climate change matches the warming pattern. Glob. Chang. Biol. 2006, 12, 1969–1976. [Google Scholar] [CrossRef]
  28. Liu, Y.; Wang, E.; Yang, X.; Wang, J. Contributions of climatic and crop varietal changes to crop production in the North China Plain, since 1980’s. Glob. Chang. Biol. 2010, 16, 2287–2299. [Google Scholar] [CrossRef]
  29. Liu, L.; Wang, E.; Zhu, Y.; Tang, L. Contrasting effects of warming and autonomous breeding on single-rice productivity in China. Agric. Ecosyst. Environ. 2012, 149, 20–29. [Google Scholar] [CrossRef]
  30. Ceglar, A.; Van der Wijngaart, R.; De Wit, A.; Lecerf, R.; Boogaard, H.; Seguini, L.; Van den Berg, M.; Toreti, A.; Zampieri, M.; Fumagalli, D. Improving WOFOST model to simulate winter wheat phenology in Europe: Evaluation and effects on yield. Agric. Syst. 2019, 168, 168–180. [Google Scholar] [CrossRef]
  31. Asseng, S.; Ewert, F.; Rosenzweig, C.; Jones, J.W.; Hatfield, J.L.; Ruane, A.C.; Boote, K.J.; Thorburn, P.J.; Rotter, R.P.; Cammarano, D.; et al. Uncertainty in simulating wheat yields under climate change. Nat. Clim. Chang. 2013, 3, 827–832. [Google Scholar] [CrossRef] [Green Version]
  32. Liu, Z.; Hubbard, K.G.; Lin, X.; Yang, X. Negative effects of climate warming on maize yield are reversed by the changing of sowing date and cultivar selection in Northeast China. Glob. Chang. Biol. 2013, 19, 3481–3492. [Google Scholar] [CrossRef] [PubMed]
  33. Asseng, S.; Ewert, F.; Martre, P.; Rotter, R.P.; Lobell, D.B.; Cammarano, D.; Kimball, B.A.; Ottman, M.J.; Wall, G.W.; White, J.W.; et al. Rising temperatures reduce global wheat production. Nat. Clim. Chang. 2015, 5, 143–147. [Google Scholar] [CrossRef]
  34. Shaykewich, C.F. An appraisal of cereal crop phenology modelling. Can. J. Plant Sci. 1995, 75, 329–341. [Google Scholar] [CrossRef] [Green Version]
  35. Cao, W.; Moss, D.N. Modelling phasic development in wheat: A conceptual integration of physiological components. J. Agric. Sci. 1997, 129, 163–172. [Google Scholar] [CrossRef]
  36. Tao, F.; Zhang, S.; Zhang, Z. Spatiotemporal changes of wheat phenology in China under the effects of temperature, day length and cultivar thermal characteristics. Eur. J. Agron. 2012, 43, 201–212. [Google Scholar] [CrossRef]
  37. Liu, Y.; Xie, R.; Hou, P.; Li, S.; Zhang, H.; Ming, B.; Long, H.; Liang, S. Phenological responses of maize to changes in environment when grown at different latitudes in China. Field Crops Res. 2013, 144, 192–199. [Google Scholar] [CrossRef]
  38. Olesen, J.E.; Børgesen, C.D.; Elsgaard, L.; Palosuo, T.; Rötter, R.P.; Skjelvåg, A.O.; Peltonen-Sainio, P.; Börjesson, T.; Trnka, M.; Ewert, F.; et al. Changes in time of sowing, flowering and maturity of cereals in Europe under climate change. Food Addit. Contam. A 2012, 29, 1527–1542. [Google Scholar] [CrossRef]
  39. Shimono, H. Earlier rice phenology as a result of climate change can increase the risk of cold damage during reproductive growth in northern Japan. Agric. Ecosyst. Environ. 2011, 144, 201–207. [Google Scholar] [CrossRef]
  40. Fang, X.; Wang, Y.; Xu, T.; Yun, Y. Contribution of climate warming to rice yield in Heilongjiang Province. Acta Geogr. Sinica. 2004, 59, 820–828, (In Chinese with Eglish abstract). [Google Scholar]
  41. Lobell, D.; Field, C. Global scale climate-crop yield relationships and the impacts of recent warming. Environ. Res. Lett. 2007, 2, 014002. [Google Scholar] [CrossRef]
  42. Tao, F.; Zhang, S.; Zhang, Z.; Rötter, R.P. Maize growing duration was prolonged across China in the past three decades under the combined effects of temperature, agronomic management, and cultivar shift. Glob. Chang. Biol. 2014, 20, 3686–3699. [Google Scholar] [CrossRef] [PubMed]
  43. Hawkins, E.; Fricker, T.E.; Challinor, A.J.; Ferro, C.A.T.; Ho, C.K.; Osborne, T.M. Increasing influence of heat stress on French maize yields from the 1960’s to the 2030’s. Glob. Chang. Biol. 2013, 19, 937–947. [Google Scholar] [CrossRef] [PubMed] [Green Version]
  44. Liu, L.; Wang, E.; Zhu, Y.; Tang, L.; Cao, W. Effects of warming and autonomous breeding on the phenological development and grain yield of double-rice systems in China. Agric. Ecosyst. Environ. 2013, 165, 28–38. [Google Scholar] [CrossRef]
  45. Porter, J.R.; Gawith, M. Temperatures and the growth and development of wheat: A review. Eur. J. Agron. 1999, 10, 23–36. [Google Scholar] [CrossRef]
  46. Ferris, R.; Ellis, R.H.; Wheeler, T.R.; Hadley, P. Effect of high temperature stress at anthesis on grain yield and biomass of field-grown crops of wheat. Ann. Bot. 1998, 82, 631–639. [Google Scholar] [CrossRef] [Green Version]
  47. Zhao, H.; Dai, T.; Jing, Q.; Jiang, D.; Cao, W. Leaf senescence and grain filling affected by post-anthesis high temperatures in two different wheat cultivars. Plant Growth Regul. 2007, 51, 149–158. [Google Scholar] [CrossRef]
  48. Dias, A.S.; Lidon, F.C. Evaluation of grain filling rate and duration in bread and durum wheat, under heat stress after anthesis. J. Agron. Crop Sci. 2009, 195, 137–147. [Google Scholar] [CrossRef]
  49. Zhang, M.; Gao, Y.M.; Zhang, Y.H.; Fischer, T.; Zhao, Z.G.; Zhou, X.N.; Wang, Z.M.; Wang, E.L. The contribution of spike photosynthesis to wheat yield needs to be considered in process-based crop models. Field Crops Res. 2020, 257, 107931. [Google Scholar] [CrossRef]
  50. Challinor, A.J.; Watson, J.; Lobell, D.B.; Howden, S.M.; Smith, D.R.; Chhetri, N. A meta-analysis of crop yield under climate change and adaptation. Nat. Clim. Chang. 2014, 4, 287–291. [Google Scholar] [CrossRef]
  51. Sun, T.; Hasegawa, T.; Liu, B.; Tang, L.; Liu, L.L.; Cao, W.X.; Zhu, Y. Current rice models underestimate yield losses form short-term heat stress. Glob. Chang. Biol. 2021, 27, 402–416. [Google Scholar] [CrossRef]
  52. Gao, Y.; Wallach, D.; Liu, B.; Dingkuhn, M.; Boote, K.J.; Singh, U.; Asseng, S.; Kahveci, T.; He, J.; Zhang, R.; et al. Comparison of three calibration methods for modeling rice phenology. Agric. For. Meteorol. 2020, 280, 107785. [Google Scholar] [CrossRef]
  53. Wallach, D.; Palosuo, T.; Thorburn, P.; Gourdain, E.; Asseng, S.; Basso, B.; Buis, S.; Crout, N.; Dibari, C.; Dumont, B.; et al. How well do crop modeling groups predict wheat phenology, given calibration data from the target population? Eur. J. Agron. 2021, 124, 126195. [Google Scholar] [CrossRef]
  54. Liu, L.; Wallach, D.; Li, J.; Liu, B.; Zhang, L.; Tang, L.; Zhang, Y.; Qiu, X.; Cao, W.; Zhu, Y. Uncertainty in wheat phenology simulation induced by cultivar parameterization under climate warming. Eur. J. Agron. 2018, 94, 46–53. [Google Scholar] [CrossRef]
Figure 1. Growing degree days (GDD) of winter wheat as impacted by climate change. (A) displays the variations in GDD with different cultivars, and (B) displays the variations in GDD at different stations of one cultivar (Yannong15). Blue, green, yellow and red indicate the GDD from sowing to jointing (GDD1), from jointing to anthesis (GDD2), from anthesis to maturity (GDD3), and from sowing to maturity (GDDT), respectively. Lines extend from 5th to 95th percentile of GDD, boxes extend from 25th and 75th percentile, and the middle vertical line within each box indicates the median GDD.
Agronomy 11 01845 g001
Figure 2. Length of winter wheat growth periods (GP) as impacted by climate change. (A) displays the variations in GP with different cultivars, and (B) displays the variations in GP at different stations of one cultivar (Yannong15). Blue, green, yellow and red indicate the GP from sowing to jointing (GP1), from jointing to anthesis (GP2), from anthesis to maturity (GP3), and from sowing to maturity (GPT), respectively. Lines extend from 5th to 95th percentile of length, boxes extend from 25th and 75th percentile, and the middle vertical line within each box indicates the median length.
Agronomy 11 01845 g002
Figure 3. Relationships between average temperatures and length of growth periods in four winter wheat cultivars, with best-fit linear regression line. Average temperatures were calculated from daily values during different growing durations. n represents number of samples. GP1, GP2, GP3 and GPT represent the length of growth periods from sowing to jointing, jointing to anthesis, anthesis to maturity and sowing to maturity, respectively.
Agronomy 11 01845 g003
Figure 4. Relationships between year-to-year changes for growing season average temperatures (ΔAverage temperature) and year-to-year changes for spike number (ΔSpike number, a), grain number per spike (ΔGrain number per spike, b), 1000-grain weight (Δ1000-grain weight, c) and wheat grain yields (ΔYield, d). Growing season average temperature was calculated from daily values for entire growing duration from sowing to maturity. Yield and yield components data were obtained from China agro-meteorological experiment stations in which fertilization and irrigation were optimized to achieve the local highest possible yields. ** Significant at p < 0.01; * Significant at p < 0.05.
Agronomy 11 01845 g004
Figure 5. Relationships between year-to-year changes for heat degree-days (ΔHDD) and year-to-year changes for spike number (ΔSpike number, a), grain number per spike (ΔGrain number per spike, b), 1000-grain weight (Δ1000-grain weight, c) and wheat grain yields (ΔYield, d). Heat degree-days was calculated from daily values from anthesis to maturity. Yield and yield components data were obtained from China agro-meteorological experiment stations in which fertilization and irrigation were optimized to achieve the local highest possible yields. * Significant at p < 0.05.
Agronomy 11 01845 g005
Table 1. Source of the dataset used in the present study.
ProvinceStationLatitude and LongitudeTemperature 1 (°C)Rainfall 2 (mm)Sunshine Hours 3 (h)Irrigation 4 (m3 ha−1)CultivarYearsNumber of Seasons
GansuTianshui34°35′, 105°45′7.8180.11300.81070.874641990–201019
HebeiHuanghua38°22′, 117°21′7.8141.41622.3713211989–201121
ShaanxiHancheng35°28′, 110°27′4.6183.21712.11019.4Xiaoyan61991–201119
Pucheng35°05′, 109°04′5.1169.11678.8Xiaoyan61992–200917
Wugong34°15′, 108°13′8.6223.11077.81456.8Xiaoyan61983–200016
ShandongLaiyang36°58′, 120°44′7.3214.51815.11126.2Yannong151984–200015
Laizhou37°37′, 120°19′8.7201.81866.41769.1Yannong151991–200715
Yantai37°32′, 121°24′8.9211.91698.1971.5Yannong151994–201116
1 Temperature: average temperature during wheat growing season in the study period; 2 Rainfall: averaged accmulative rainfall during wheat growing season in the study period; 3 Sunshine hours: averaged accmulative sunshine hours during wheat growing season in the study period; 4 Irrigation: averaged accmulative irrigation volume during wheat growing season in the study period.
Table 2. Temporal trends of average temperature during the different growth periods of winter wheat and total heat degree-days from anthesis to maturity at the study stations.
StationCultivarn 1T_GP1
(°C/Year)
T_GP2
(°C/Year)
T_GP3
(°C/Year)
T_GPT
(°C/Year)
HDD
(°C d/Year)
Tianshui7464190.010.010.050.020.34 **
Huanghua7132121−0.010.09 *0.07 *0.030.27 **
HanchengXiaoyan619−0.010.09 *0.050.030.27 **
PuchengXiaoyan6170.20 **0.09 *0.11 *0.17 **0.05
WugongXiaoyan6160.11 *0.19 **0.070.14 **0.28 **
LaiyangYannong15150.07 *0.020.030.07 *0.81 **
LaizhouYannong1515−0.030.030.11 *0.030.45 **
YantaiYannong15160.07 *0.020.020.09 *0.33 **
1 n: number of wheat growing seasons; T_GP1, T_GP2, T_GP3 and T_GPT: the average temperature from sowing to jointing, jointing to anthesis, anthesis to maturity, and sowing to maturity; HDD, heat degree-days. ** Significant at p < 0.01; * Significant at p < 0.05.
Table 3. Temporal trends of growth degree days during the different growth periods of winter wheat for four different cultivars.
Cultivarn 1GDD1
(°C d/Year)
GDD2
(°C d/Year)
GDD3
(°C d/Year)
GDDT
(°C d/Year)
7464192.47−5.04 **−2.07−4.64
7132121−2.914.31 *3.99 *5.39
Xiaoyan6523.650.232.126.00
Yannong1546−1.774.10 **0.382.71
1 n: number of wheat growing seasons; GDD1, GDD2, GDD3 and GDDT: the growth degree days from sowing to jointing, jointing to anthesis, anthesis to maturity and sowing to maturity. ** Significant at p < 0.01; * Significant at p < 0.05.
Table 4. Temporal trends of length of growth periods during the different growth periods of winter wheat for four different cultivars.
Cultivarn 1GP1
(Day/Year)
GP2
(Day/Year)
GP3
(Day/Year)
GPT
(Day/Year)
746420−0.51 **−0.58 **−0.02−1.17 **
7132122−0.37−0.010.14−0.30
Xiaoyan640−0.73 **−0.31 *0.09−0.63 **
Yannong1548−0.250.13−0.01−0.49 **
1 n: number of years; GP1, GP2, GP3 and GPT: the length of growth periods from sowing to jointing, jointing to anthesis, anthesis to maturity and sowing to maturity. ** Significant at p < 0.01; * Significant at p < 0.05.
Publisher’s Note: MDPI stays neutral with regard to jurisdictional claims in published maps and institutional affiliations.

