Abstract
Temperate soils are threatened by degradation and soil organic matter (SOM) loss due to a combination of geomorphology, soil types, and anthropic pressure. In 54 sites in Northern Italy, characterized by different land uses, climates, geological substrates, and soils, we assessed (i) the soil quality, (ii) the SOM accumulation/degradation patterns, and (iii) whether land use and related soil management practices are sustainable based on changes in soil quality. Soil samples from the 0–15 and 15–30 cm deep layers were collected and analyzed for the soil parameters recommended by the FAO (bulk density, pH, organic and microbial C, total N, and soil respiration rate) and for the chemical SOM pools. Parameters related to the efficient use of soil microbial C were also calculated. The findings showed that agricultural lands where organic material was added had good soil quality and used microbial C efficiently. Reclaimed peaty soils degraded because the conditions were too stressful for the soil microbial biomass as supported by high metabolic quotient and the low values of mineralization quotient, microbial quotient, and soil biofertility index. Conservative management practices carried out in chestnuts were found to have a decreased soil degradation risk. An investigation of the soil parameters recommended by the FAO can be used to evaluate sustainable practices and soil quality on microbial activity and SOM dynamics.
1. Introduction
Healthy and productive soils are important for the long-term sustainability of ecosystems [1] and provide key ecosystem services that support the goals of ecological, economic, and social management [2,3,4]. Maintaining and restoring soil quality is essential for land-based management frameworks and policies, such as the European Green Deal [5], which addresses how to achieve land degradation neutrality by 2030. Soil quality is the capacity of a specific kind of soil to function within natural or managed ecosystem boundaries, to sustain plant and animal productivity, to maintain or enhance water and air quality, and to support human health and habitation [6]. Soil quality can be assessed using pedological surveys; through soil chemical, physical, and biological characterization; and by understanding their interactions [3]. By monitoring changes in soil quality, a land manager can determine if a set of practices is sustainable [7].
Among soil properties, soil organic matter (SOM) is recognized as one of the most relevant and universal indicators of soil quality [8] and land degradation [7,9]. SOM affects the most fundamental soil properties and functions, such as soil structure, aeration, nutrient storage, water-holding capacity, plant health and productivity, microbial biomass and activity, and carbon sequestration [3,10]. Soil organic C (SOC), its fractions, and its dynamics have been widely used as adequate indicators in evaluating the influence of land management and in selecting the most appropriate management practices to maintain and/or restore soil functionality [7,11]. SOC loss is a key environmental issue of this century, which, together with climate change, poses serious risks for ecosystem sustainability and food security for many regions around the world [12].
In a temperate climate, temperature and precipitation should not be relevant limiting factors of SOC production and turnover at the regional scale. This climate has moderate SOC storage with respect to the accumulation of SOC in colder, moister areas and lower SOC storage than in drier, hotter regions [13]. However, within the European context, temperate soils are threatened by high soil erosion rates, a high risk of land degradation, and high to very high sensitivity to organic C loss due to a combination of geomorphological features, soil type, and land cover/management [14,15]. The effects of climate may be modified by land use/management, particularly in cropland soils, where intensive management practices (e.g., fertilization, irrigation, etc.) can counterbalance these climate effects [16,17,18]. Moreover, climate variability at the local scale is frequently small. Therefore, climate affects the SOC dynamics and soil quality less in contrast with other factors, such as vegetation, soil type, soil erosion, and other soil processes.
This study reports the results obtained from some projects of the Italian Rural Development Program (RDP)—Focus Area 5E projects—funded by the Emilia-Romagna region, aimed at addressing and supporting actions fostering carbon conservation and sequestration in agriculture and forestry. This work aimed to assess the soil quality in farms located both on plain and hilly/mountainous agricultural land (orchards and other horticultural vegetation) and in semi-natural areas (chestnut) in a temperate climate using SOC and other related soil parameters as quality indicators [19,20,21,22]. Recently, the FAO and ITPS [7] have recommended a set of indicators directly related to the chemical, physical, and biological properties of soil (i.e., SOC, bulk density, and soil respiration rate) for the assessment of sustainable soil management. In this study, the recommended set of indicators and additional parameters (e.g., organic C pools, ecophysiological parameters, and the index of biological fertility) were investigated in the top- and subsoils (0–15 and 15-30 cm soil depths, respectively) of farms involved in the RPD projects, with specific objectives: (i) to quantify the current soil quality status; (ii) to assess the accumulation/degradation patterns of soil organic matter at the sites analyzed using the variations in organic C pools, ecophysiological parameters, and the index of biological fertility; and (iii) to determine if land use and related soil management practices are sustainable based on changes in soil quality. The investigation of soil quality under different land uses, under different land managements, and in different locations but within the same climatic zone could be considered a novel approach to obtaining a wider and clearer picture of the influence of such factors on soil properties. This study could also be considered novel for its method of evaluating soil quality that merges the soil indicators suggested by the FAO and ITPS with SOC pools, which are able to record long-term processes. This new methodology allows us to assess both the past and current effects of land use on soil quality.
2. Materials and Methods
2.1. Study Area and Soil Sampling
The soil quality of 54 sites (Table A1 in Appendix A) studied in the following RPD projects was investigated: SaveSOC2, Fruttifi-CO, Biodiversamente Castagno, and Castani-CO. The study sites were located both in the Padania plain and in the Apennine zone of the Emilia-Romagna region (Northern Italy; Figure 1). The lowest area was MAC (–6 m a.s.l.) in the Po Plain, while the highest was HEL (890 m a.s.l.) in the Apennine zone.
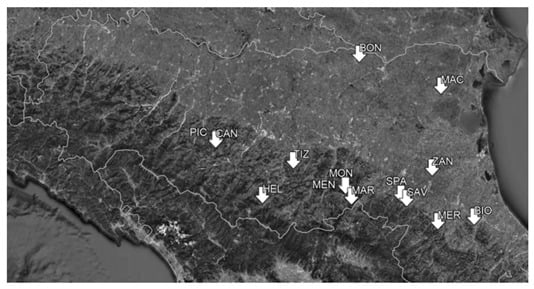
Figure 1.
Geographical locations of the study sites.
According to Koppen’s climate classification, the areas investigated have temperate climates with hot or warm summers [23]. The sites were characterized by very different geological substrates and soils (Table A1). The latter included mainly Cambisols and Regosols. In the lowest area, reclaimed peaty soils were present. The sites included farmlands with different land uses that were grouped into three main typologies: chestnuts; grassed orchards; and lands without tree cultivation, such as grasslands and those with the cultivation of vegetables and raspberries (Table A1 and Figure 2).
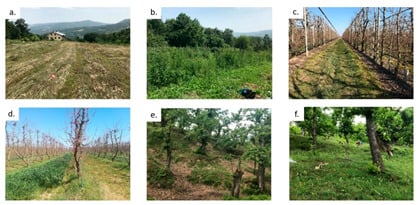
Figure 2.
Representative images of the main land covers/uses typologies: (a) uncultivated grassland (HEL1), (b) raspberries (HEL3), (c) grassed orchards (pear, 18 yrs; ZAN1), (d) green manure (on the left) and grassed (on the right) orchards (peach, 10 yrs; BIO2 and BIO1, respectively), (e) chestnuts (MAR2), and (f) chestnuts (PIC4). The site codes are reported within the brackets (see Table A1).
Soil sampling was carried out in 2017–2018. At each site, a pit was dug down to a soil depth of 30 cm and soil material from the 0–15 and 15–30 cm deep layers was collected, called surface and subsurface soil, respectively. In order to obtain representative results, the soil pits were dug while taking the diverse soil morphological features and soil uses at each site into consideration. Additionally, from each pit, undisturbed soil samples were collected using a stainless-steel corer (5 cm in diameter and 5 cm in height) at 0–5, 5–10, 10–15, and 15–30 cm soil depths to determine the bulk density.
2.2. Soil Quality Indicators
SOC, total nitrogen (TN), microbial biomass (MBC), soil respiration rate (SR), bulk density (BD), and pH were selected as indicators of soil quality due to their relevance in soil ecosystem services [3]. Such parameters are also recommended by the Voluntary Guidelines for Sustainable Soil Management [1] and by the Protocol for the Assessment of the Sustainable Soil Management [7].
The δ13C signature of SOC was also assessed because of its relationship with the degree of transformation of organic matter. Isotopic carbon fractionation occurs during organic decomposition, leading to an enrichment in 13C due to the oxidation of 12C by microorganisms [24]. Consequently, lower values of δ13C (more negative) correspond to less oxidized organic matter [25]. Additionally, C in particulate organic matter (POM), C in fulvic- and humic-like substances (FS and HS, respectively), and non-extractable organic matter (NEOM) were analyzed as they are considered more sensitive indicators of soil quality changes compared with variations in bulk soil C [21,22]. Soil C fractions have been used together with MBC to assess land degradation [26] and to better detect the effect of land covers and uses on temperate soils [27].
The metabolic quotient (qCO2) and the mineralization quotient (qMIN), related to the microbial degrative process of organic matter, were calculated as indicators of the efficiency of the microbiome in metabolizing SOC [28]. Specifically, qCO2 was expressed as the hourly CO2 evolved per unit of MBC, while qMIN was expressed as the ratio between cumulative soil basal respiration and SOC. The microbial quotient (qMIC), namely the ratio between MBC and SOC, indicates the incorporation of organic C into the microbial biomass, and thus, the transfer of C to the microbial pool [29] was also determined. Additionally, both Dilly’s index [30] (qCO2/SOC) and a simplified biological fertility index (SFI), which is a comprehensive indicator that functions by composing four biological variables, such as SOC, MBC, qCO2, and qMIN, were used. In fact, it has already been proven that Dilly’s index and SFI are satisfactory in evaluating soil quality in relation to microbial communities and their activity [19,20,31,32].
2.3. Soil Analyses
The surface and subsurface soil samples were air-dried and passed through a 2 mm sieve, and then, an aliquot was finely ground to determine the SOC and TN concentrations. The undisturbed soil samples were oven-dried at 105 °C and then weighed. For BD calculation, both volume and dried weight were adjusted for the volume and mass of the skeleton.
The soil pH was determined potentiometrically in a 1:2.5 solution ratio in deionized water. The SOC and TN contents were determined by a CHN elemental analyzer (CHNS-O Elemental Analyser 1110, Thermo Scientific GmbH, Dreieich, DE) after the addition of hydrochloric acid to remove carbonates. The relative abundance of C stable isotopes was determined by continuous flow–isotope ratio mass spectrometry (CF–IRMS) using an isotopic mass spectrometer Delta V advantage (Thermo-Finnigam, DE). The values were then expressed as δ13C, as the deviation in parts per thousand compared with the universal standard as a reference.
POM, FS, HS, and NEOM were sequentially separated according to Agnelli et al. [33] with some modifications. In brief, 100 mL of distilled water was added to 10 g of soil, shaken on a horizontal shaker for 16 h at 25 °C, and centrifuged, and the supernatant was separated from the precipitate. The supernatant was passed through a 53 μm sieve and particles >53 μm represented the particulate organic matter. The precipitate remaining into the centrifugation tubes was re-suspended in 100 mL of a 0.1 M NaOH solution and the samples were shaken for 24 h at 25 °C and then centrifuged again. The NaOH extract was passed through a 0.45 μm polycarbonate filter, while the remaining precipitate containing the non-extractable organic matter was washed using deionized water to remove excess Na until the pH of the rinsed solution was ≤7. The 0.45 μm filtered NaOH extract was acidified to about pH 1.5 using 6 M HCl, was allowed to settle overnight to separate FS and HS and was centrifuged. To remove the excess Na from the fractions obtained, the supernatant (FS) was dialyzed through 1000 Da cutoff membranes (Spectra/Por® Dialysis membrane) against distilled water, while the residual (HS) was washed with 0.002 M HCl. Both purified fractions were freeze-dried. The POM and NEOM fractions were dried at 40 °C. The organic C and total N of each fraction were determined by a CHN elemental analyzer (EA 1110 Thermo Fisher, Waltham, MA, USA).
Soil microbial respiration was determined according to Falsone et al. [34]. In brief, the soil samples were adjusted to 60% of their water holding capacity (WHC) and incubated for 28 days at 25 °C. The CO2 emitted from incubated soils was measured through the alkali (0.5 M NaOH solution) absorption of the evolved CO2 from each sample. Then, the rest of NaOH solution was titrated using 0.05 M HCl in the presence of 0.75 M BaCl2. The soil respiration rate (SR) of each soil sample was computed as the hourly flux of CO2 per gram of soil, while the cumulative soil basal respiration (RCUM) was expressed as the total amount of CO2 evolved during the 28 days of incubation.
The MBC was measured on the soil samples at 60% of their WHC using the chloroform fumigation extraction method with a 0.5 M K2SO4 solution [33]. Both the fumigated and non-fumigated extracts were analyzed using a TOC-V CPN total organic carbon analyzer (Shimadzu, Japan). The MBC was calculated as ECx2.64, where EC was the difference between the organic C extracted from fumigated soils and the organic C extracted from non-fumigated soils [35].
2.4. Statistical Analyses
To define the soil quality and its relationship with the soil organic matter dynamics, a k-means clustering was performed based on (i) the set of indicators recommended by the FAO and ITPS [7] for the assessment of sustainable soil management (SOC, BD, SR, MBC, TN, and pH, called the minimum set of indicators (MSI)) on both the topsoil and subsoil, and (ii) the C and N concentrations and the C/N ratio determined in the different fractions extracted and separated by the soil organic matter (i.e., POM, FS, HS, and NEOM) only in the topsoil. To perform the clustering, the data were scaled and the appropriate number of clusters, selected according to the “elbow” and “silhouette” methods, was found to be four for the topsoils, both based on (i) and (ii), and two for the subsoils. Principal component analysis (PCA) provides a quick way to obtain a realistic visual of the multivariate phenomenon studied and offers specific information contained within the dataset, while cluster analysis (CA) looks for groups of individuals with similar characteristics. In this study, the output of the CA method was used in the PCA plot. Therefore, the results of clustering were visually reported on a PCA plot. To assess the differences in the soil properties among the clusters, a one-way ANOVA on ranks (Kruskal–Wallis test) with alpha = 0.05 and Fisher’s least significant difference post hoc test were performed. All statistical analyses were performed using the software RStudio 1.2.5001. The whole datasets are reported in Tables S1 and S2 of the Supplementary Materials.
3. Results
3.1. Indicators of Soil Quality: Clustering
The output of CA performed on the minimum set of indicators (i.e., SOC, BD, SR, MBC, TN, and pH) recommended by the FAO and ITPS [7] grouped the topsoils and subsoils into four and two clusters, respectively.
Figure 3a,b shows the clusters obtained in the PCA plots, where 69.2% and 73.8% of the variance was explained for topsoil and subsoil, respectively.
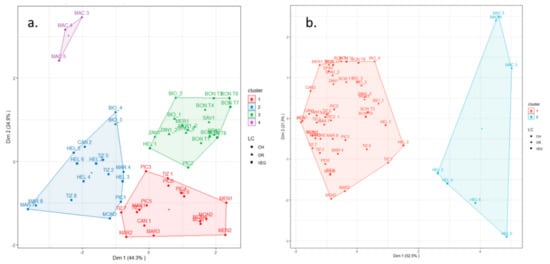
Figure 3.
K-means clustering on the topsoil (a) and subsoil (b) layers based on the variables organic carbon, bulk density, soil respiration rate, microbial biomass, total nitrogen, and pH, depicted here on a PCA plot. CH, OR, and VEG refer to the main type of land use (CH—chestnut; OR—orchards; and VEG—other uses, such as grassland and the cultivation of vegetables and raspberries, as detailed in Table A1).
For topsoil, all MAC sites, which were pear tree nurseries on reclaimed peaty soils, were gathered into cluster 4 (C4). Chestnut soils were grouped both into cluster 1 (C1) and cluster 2 (C2). In C2, all of the sites were located in mountainous areas, except uncultivated grassland HEL1, and the sites of the orchard with 5 years of grassing (BIO) were also included. Both the grassed orchards and the farms where vegetables are grown were grouped into cluster 3 (C3).
The four groups identified differed in all of the parameters of the minimum set of indicators (Table 1).

Table 1.
Means ± standard errors of the minimum set of indicators of each cluster at 0–15 and 15–30 cm depths, with the Kruskal–Wallis significance presented as letters and symbols. BD—bulk density; TN—total nitrogen content; SOC—soil organic carbon content; SR—soil respiration rate; MBC—microbial biomass C content. Different letters for each soil layer and within each column indicate significant differences. * p-value < 0.05; ** p-value < 0.01; *** p-value < 0.001; ns—not significant.
In more detail, C1 chestnut topsoils were porous and strongly acidic (BD = 1.20 g cm−3 and pH = 5.0), with intermediate or low contents of total N, SOC, and MBC (TN = 1.48 g kg−1, SOC = 19.8 g kg−1, and MBC = 200 mg kg−1) and low soil respiration rate (SR = 0.60 mg C-CO2 kg−1 h−1). Compared with C1, C2 had lower acidity (pH = 6.4) and higher TN, SOC, and SR values (TN = 3.28 g kg−1, SOC = 35.2 g kg−1, and SR = 1.25 mg C-CO2 kg−1 h−1). Additionally, C2 topsoils had the highest content of MBC (550 mg kg−1). C3 and C4 had the most relatively compact (BD = 1.43–1.46 g cm−3) and slightly alkaline (pH = 7.8–7.7) topsoils. In both C3 and C4, the topsoils had low MBC. However, in C3, the topsoils with the poorest SOC were gathered (14.0 g kg−1), while, as expected, the ones richest in SOC and TN were part of C4 (75.8 and 6.41 g kg−1, respectively).
For subsoils, C1 contained all sites except for reclaimed peaty soils (MAC farm) and the coolest and moistest ones (HEL farm), which were grouped into C2. As expected, the C2 subsoils had the highest SOC, TN, and MBC contents; the highest CO2 emissions; and the lowest BD values (Table 1). The soil pH did not differ between the two clusters.
3.2. Linking the Minimum Set of Indicators in a Cluster Analysis and the Other Indicators
The indicators of soil quality related to the degree of transformation of organic matter, such as the δ13C signature of SOC, and to the ecophysiological soil status and efficiency of microbial community activity, such as qCO2, qMIN, qMIC, Dilly’s index, and SFI, in the topsoil and subsoil clusters differed (Table 2).
Table 2.
Means ± standard errors of several indicators of each cluster at 0–15 and 15–30 cm depth, with the Kruskal–Wallis significance presented as letters and symbols. C/N—OC and TN ratio; δ13C—carbon isotopic ratio; qCO2—metabolic quotient; qMIN—mineralization quotient; qMIC—microbial quotient; Dilly—Dilly’s index; SFI—soil biofertility index. Different letters for each soil layer and within each column indicate significant differences. * p-value < 0.05; ** p-value < 0.01; *** p-value < 0.001; ns—not significant.
Topsoils from reclaimed peaty soils of the MAC farm (C4) were characterized by the lowest values of qMIN, qMIC, and SFI (0.75, 1.4, and 8.3, respectively). C2 had the highest efficiency regarding microbial communities, as indicated by the low Dilly’s index and the high SFI (74 and 14, respectively). C1 and C3 showed intermediate values of SFI, Dilly’s index, and qMIC (10.8 and 11.8, 370 and 328, and 9.2 and 10.2, respectively). The δ13C values in C3 and C4 were lower (–23.3 and –25.2‰) than those in C1 and C2 (−27.1 and −26.6‰). In the subsoils, C2 showed the highest efficiency in C use (Dilly’s index = 123) despite the high values of qCO2 (1.88) and the lowest qMIN (1.63).
3.3. Soil Organic Matter Fractionation in Topsoils: Clustering
The cluster analysis performed on the SOM fractions allowed us to group the sites investigated into four groups. Plotting them according to PCA, 51.5% of the variance (Figure 4) was explained.
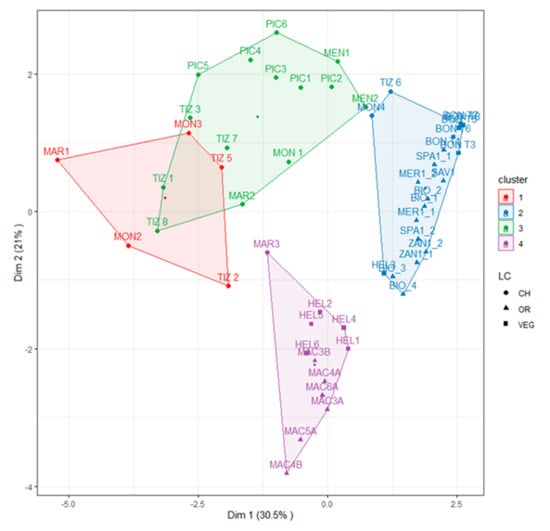
Figure 4.
K-means clustering on the topsoils based on the concentrations of C and N and on the C:N ratio in organic matter fractions, depicted here on a PCA plot. CH, OR, and VEG refer to the main type of land use (CH—chestnut, OR—orchards, and VEG—other uses, such as grassland and the cultivation of vegetables and raspberries, as detailed in Table A1).
C1 and C3 included chestnut sites, C4 included reclaimed peaty soils (MAC sites) and the coolest and moistest sites (HEL sites), while C3 included orchard sites and all other land uses, with two additional chestnut sites (TIZ6 and MON4) and HEL3. C4 was characterized by the highest C content in NEOM (36.7 g kg−1), C1 was characterized by the highest C-POM content (4.9 g kg−1), and C2 was characterized by the lowest C-HS content (0.5 g kg−1) and the highest C-FS content (10.9 g kg−1) (Table 3). In particular, the POM pool of topsoils from chestnut in C1 and C3 were characterized by higher organic C, higher N content, and lower values of δ13C than those in C2 and C4 (Table 3). Additionally, for the HS pool, C1, C3, and C4 had the highest C and N contents, but no differences were found for the δ13C values. For the FS fraction, C1, C3, and C4 had the highest organic C and N contents, while for the NEOM fraction, C1 and C4 had the most N and the richest organic C content. Thus, C2 included the topsoils with the poorest N and organic C contents but had the highest δ13C values.
Table 3.
Means ± standard errors of the carbon and nitrogen concentrations, and δ13C of the soil organic matter fractions extracted from 0–15 cm deep topsoils of each cluster, with the Kruskal–Wallis significance presented as letters and symbols. Within each column, means with different letters indicate significant differences. * p-value < 0.05; *** p-value < 0.001; ns—not significant. Nd—not determined. POM—particulate organic matter; NEOM—non-extractable organic matter; FS and HS—fulvic-like and humic-like substances, respectively.
3.4. Linking Soil Organic Matter Fractionation and the Other Indicators
The cluster analysis by SOM fractionation gave four clusters characterized by different ecophysiological statuses and the efficiency of microbial community activity (Table 4). C1 and C3, which includes chestnuts, clearly showed lower δ13C values (−27.4 and −27.2‰, respectively) than C2 and C4 (−25.3 and −25.6‰) and higher qMIN (2.06, 2.47, and 1.07 mg C-CO2 g OC−1 for C1, C3, and C4, respectively). Between the chestnut clusters, C3 had a higher Dilly’s index value, testifying to the less efficient microbial use of C than in C1 (372 compared with 153). Additionally, C2 had a high Dilly’s index value, while C4 had a qCO2 quotient close to 1, the lowest qMIN and Dilly’s index values.
Table 4.
Means ± standard errors of several indicators of each cluster at a depth of 0–15 cm (based on organic matter fractionation), with the Kruskal–Wallis significance presented as letters and symbols. C/N—carbon to nitrogen ratio; δ13C—carbon isotopic ratio; qCO2—metabolic quotient; qMIN—mineralization quotient; qMIC—microbial quotient; Dilly—Dilly’s index; SFI—soil biofertility index. Within each column, means with different letters indicate significant differences. * p-value < 0.05; ** p-value < 0.01; *** p-value < 0.001; ns—not significant.
4. Discussion
4.1. Soil Quality Status According to the Minimum Set of Indicators
With the exclusion of the nursery of pear seedlings in C4 grown on reclaimed peaty soils, characterized by average SOC contents higher than 70 g kg−1 in the topsoil, the soils sampled at the other 51 sites had medium (35.2 g kg−1 in C2) to low (14.0 and 19.8 g kg−1 in C3 and C1) concentrations of SOC (Table 1). The SOC concentrations in C4 were comparable with the data reported by Vittori Antisari et al. [20] for reclaimed Histosols (0–20 cm−1), 99.9 ± 16 g C kg−1. Chestnuts showed high variability among the different sites, being gathered in both C1 and C2. This variability most probably reflects the differences between management practices, such as the removal of organic residues from the soil surface that reduce the thickness of the surface mineral horizons richer in C, increasing the risk of soil degradation [36]. Specifically, chestnut groves grouped into C1 showed soils with more stressful conditions than those in C2, likely due to soil management practices that lowered the MBC content and increased the soil compaction and erosion.
Raspberry fields at high altitudes and at the moistest conditions were grouped into C2 and were characterized by a high C content, probably due to the cold climate and minimum soil disturbance, as well as the added manure of nearby stables, which promote soil C accumulation [37]. Similarly, both of the BIO3 and BIO4 sites had been fertilized with a spent mushroom substrate and a green manure practice was performed. Conversely, organic C declined in the grassed orchard farms and the other farms located in the plain, characterized by the warmer climate (Table A1), where no addition of organic fertilizers was carried out, and which underwent high physical disturbance.
C2 had the highest qMIN, qMIC, and SFI values but the lowest Dilly’s index and δ13C values. Clearly, C2 soils were characterized by a high incorporation of SOC into the microbial biomass, as highlighted by the higher values of qMIC. Furthermore, C2 soils had values of Dilly’s index of less than 100, which testifies to an efficient ecophysiological energy state of the system [28]. The good quality of C2 soils was further confirmed by the SFI value (Table 2), which allowed us to ascribe C2 soils to the “good” class of biological fertility. The highest SOC content and the most negative δ13C value in C2 soils suggest that SOC accumulates. In C2, the organic substance introduced into soil was preserved due to the biochemical and biological conditions of the microbial communities that limited the organic matter depletion via efficient use of C and, therefore, no isotopic C fractionation occurred [38]. In C4, the reclaimed peaty soils used for the nursery of pear seedlings (MAC) had the lowest soil quality conditions, confirmed by the highest δ13C values. In particular, the stressful conditions for microbial growth and activity in the MAC sites (highest value of qCO2 and lowest values of qMIN, Dilly’s index, and SFI) led to C oxidation of 12C by microbial respiration and to an enrichment in 13C [24].
In C3, SR and MBC were the worst, demonstrating high C losses and an inefficient organic carbon incorporation as MBC [28]. In C3, all parameters of MSI had the worst values, suggesting that agricultural practices that do not use contributions of organic material to the soil penalize the growth of microbial communities (low MBC value) by increasing stress and energy dissipation (high Dilly’s index) and by decreasing the activity of the ecological functions of the soil (high qMIN and low SFI).
The clustering analysis based on MSI allowed us to rank the soil quality of the investigated sites in the following order: C2 > C4 > C1 > C3, highlighting some trajectories that link the good quality of the soil to the contributions of organic substance. These trajectories were clearly related to both land use and other factors driving SOM dynamics, such as climate, relief, organic inputs, and soil type [39,40,41,42]. The reclaimed peaty soils of cultivated areas of the Po valley still had high contents of SOC, but low efficiency values of microbial community activity, highlighting the degradation of the organic substance accumulated in peaty soils [20].
In the subsoils, reclaimed peaty soils and raspberry sites at high altitude were grouped into the best soil quality cluster, with the highest SOC, TN, MBC, and SR. Their better soil quality was confirmed by the low Dilly’s index and qMIN. However, fewer differences among soils were detected in subsoils than in topsoils, suggesting a lower sensitivity of subsurface soils to different factors driving SOM dynamics.
4.2. Soil Organic Matter Pools
Clustering based on SOM fractionation of topsoils allowed us to clearly distinguish chestnut land use from other uses (Figure 4). The highest C-POM at chestnut sites may be due to the SOM cycling in semi-natural land, favoring mineralization and humification processes of organic residues (leaves, twigs, and thorny domes of chestnuts) that reach the soil [36]. The POM is important in the formation of the organic and organo-mineral horizons that characterize the soils under chestnuts, protecting them from erosion and degradation. The chestnut soils were enriched by C-FS and C-HS fractions, highlighting a low polymerization of humic substances. Additionally, high C-FS content and C-FS-to-C-HS ratio were found in C3. This imbalance between FS and HS was probably due to the more acidic condition of chestnut soils with respect to the other ones. The C-FS-to-C-HS ratio indicated a marked prevalence of fulvic-like substances over humic-like ones, as observed often in strongly acid soils, such as Podzols [43]. Such an acidic condition appeared to affect the SOM dynamics, predominating the most acidic and oxidized aromatic FS over HS compounds [44]. As these systems appeared quite stressful for microbial biomass, with high qMIN and high Dilly’s index, in-depth analyses will be required to evaluate whether these fractions are also derived from the depolymerization of organic substances. However, the δ13C values of the total SOM and pools (Table 3 and Table 4) remained low, probably because they were at least partially recovered by the high input of fresh organic residues [45]. Chestnut soils can indeed be considered quite semi-natural forest soils, which are generally characterized by a large fresh litter input, which causes SOM rejuvenation and lower δ13C values [45].
In C4, similarly to what occurred for subsoils clustered by MSI, orchards on reclaimed peaty soils and raspberry sites at high altitudes and at the moistest conditions were grouped together. In C4, C-HS clearly prevailed over C-FS, and the non-extractable fraction (C-NEOM) was the highest. The δ13C values of SOC were the highest, suggesting a high SOM transformation by microbial activity and a consequent enrichment in 13C [24]. However, the process led to quite slow mineralization and a good use of C by microorganisms, as confirmed by the low values of qMIN and Dilly’s index. This was further confirmed by the large amount of C in the non-extractable fraction, which represented the most stabilized SOM [46]. For the pear tree nursery on reclaimed peaty soils (MAC), the data obtained from sites clustered by MSI and SOM fractionation were partially in disagreement, highlighting how the dynamics of organic matter in soil must be related to the ecological functionality of the soil. This is likely due to the ability of SOM fractionation to record past processes, with humified organic compounds being considered stabilized C pools that contain organic matter with radiocarbon ages ranging from 1000 to more than 10,000 years [47,48]. For orchards on reclaimed peaty soils, SOM fractionation can probably detect previous accumulations of OC in peatlands preserved due to anoxic conditions. The fractionation of the organic substance highlights how soils that do not receive organic fertilizers (grassed orchards and land for the production of vegetables) and those that have poor soil quality (high qMIN and Dilly’s index) prevail with bigger polymerized fractions (C-HS and NEOM) and low levels of POM.
4.3. Sustainability of Current Land Use and Related Soil Management Practices
Cluster analysis based on both MSI and SOM fractionation did not always allow us to clearly distinguish between sites for their current land use and related soil management practices, even if both clustering methods produced clusters defined by different soil quality and biochemical and biological properties.
Clustering by MSI coupled with biochemical and biological properties allowed us to negatively judge land use in orchards on reclaimed peaty soils despite the high SOC content. The recommendations made by the FAO and ITPS [7] to include a complementary analysis of soil biological activity for a better interpretation of the results obtained from MSI are confirmed here. In fact, from clustering by MSI, C4 was determined to have an intermediate soil quality, but the biochemical and biological data clearly highlighted stressful conditions for microbial biomass. Thus, soil quality detected by MSI had a high performance, probably due previous accumulations of organic C in peatlands, as revealed by SOM fractionation.
Drivers other than land use and related soil management affected the SOM cycling, and these processes are shaped by pH, climate, soil type, and other environmental conditions [48]. Clustering by SOM fractionation seemed to mainly record the effect of these other factors, preserving data related to long-stabilized C pools. Environmental conditions, rather than land use and related soil management, are in fact inoperable factors (or at least inoperable without a high use of economic and energy resources, which is probably not sustainable). Our findings thus suggest that, in the sustainability assessment of management practices, environmental conditions should also be considered because of their effect on soil quality. Therefore, the evaluation of farm activities must be included in an in-depth pedoclimatic survey, which can also define the land use capability and suitability, highlighting the limitations of use and sustainable management.
Importantly, we highlight that, although land use, soil management practices, soil properties, and climatic conditions are drivers of SOM dynamics, the amount and quality of organic matter in the soil cannot be neglected. For example, even when MAC soils were enriched with organic matter, they degraded because fresh organic material was missing. In contrast, in chestnut stands, which are characterized by sandy soils that do not promote SOM accumulation, where the litter layer is preserved, the soil quality improved.
5. Conclusions
Our assessment of soil quality for temperate soils characterized by different land uses has shown that different soil rankings can be obtained using MSI and SOM fractionation.
The findings obtained using the MSI suggested by the FAO and ITPS found the best soil quality in C2, which was mainly related to the SOM accumulation promoted by climatic conditions (i.e., lower mean air temperatures and higher precipitations) and the addition of organic matter. Such conditions, in turn, promoted microbial biomass growth. The better soil quality at C2 sites was confirmed by the transformation degree of SOM (δ13C), the ecophysiological soil status, and the efficiency of the microbial community. Conversely, because no organic matter was added, the C3 sites showed the worst soil quality, with the soil being more compacted, having poor contents of N, and having a stressed microbial community.
The clustering by SOM pools highlighted the differentiation of chestnut stands (C1 and C3), which are characterized by a high content of labile and not degraded SOM. In soils with a high SOM content, both for the past reclamation (of peaty soils) and for the addition of manure (C4), the more polymerized fractions prevailed. The better ecophysiological soil status and the efficiency of the microbial community in C4 further confirmed the role of SOM preservation and accumulation in soil quality.
Supplementary Materials
The following are available online at https://www.mdpi.com/article/10.3390/agronomy11091815/s1. Table S1: Soil chemical and biochemical properties and soil quality indicators of the study sites. Table S2: Organic carbon and total nitrogen contents and δ13C in soil organic matter fractions of soil samples collected from the study sites.
Author Contributions
Conceptualization, L.V.A. and G.F.; methodology, L.V.A., G.F. and G.B.; validation, L.V.A., M.D.F., G.B. and G.F.; formal analysis, L.V.A. and W.T.; investigation, L.V.A., M.D.F., G.B. and G.F.; resources, L.V.A. and G.B.; data curation, L.V.A. and G.B.; writing—original draft preparation, L.V.A., M.D.F. and G.F.; writing—review and editing, L.V.A., M.D.F., G.B. and G.F.; visualization, L.V.A., W.T., M.D.F. and G.F.; supervision, L.V.A., G.B. and G.F.; project administration, L.V.A. and G.B.; funding acquisition, L.V.A. and G.B.. All authors have read and agreed to the published version of the manuscript.
Funding
This research has been co-funded by the Rural Development Program (RDP; Programma di Sviluppo Rurale-PSR) 2014–2020 of the Emilia-Romagna region, grant numbers: 5015638 (SaveSOC2 project), 5015501 (Fruttifi-CO project), 5015570 (Biodiversamente Castagno), and 5015571 (Castani-CO).
Institutional Review Board Statement
Not applicable.
Informed Consent Statement
Not applicable.
Data Availability Statement
Data is contained within the article and Supplementary Material.
Acknowledgments
We thank Carla Scotti for the coordination of the operational innovation groups, Andrea Simoni for the technical consultancy, and Gilmo Vianello for the support during the scientific discussion of the data.
Conflicts of Interest
The authors declare no conflict of interest.
Appendix A
Table A1.
Location and main features of the 54 investigated sites. Temperature (MAT, mean annual temperature) and precipitation (MAP, mean annual precipitation) are mean average for the period 1991–2019.
Table A1.
Location and main features of the 54 investigated sites. Temperature (MAT, mean annual temperature) and precipitation (MAP, mean annual precipitation) are mean average for the period 1991–2019.
| Municipality Geological Substrate MAT (°C)–MAP (mm) Soil Type | Elevation (m) | Slope (%) | Land Use | Coordinates | Site Code |
|---|---|---|---|---|---|
| Bondeno Meandering river deposits 13.7 °C–650 mm Fluvic Cambisols | 10 | Flat | Grassed orchard since 1992 | 32T 692,070 mE 4,973,342 mN | BON T1 |
| 10 | Flat | Vegetable garden since 1992 | 32T 691,948 mE 4,973,352 mN | BON T3 | |
| 8 | Flat | Orchard since 2007 | 32T 692,183 mE 4,973,497 mN | BON T4 | |
| 11 | Flat | Vegetable garden since 2007 | 32T 691,980 mE 4,973,306 mN | BON T5 | |
| 9 | Flat | Vegetable garden since 1996 | 32T 692,140 mE 4,973,580 mN | BON T6 | |
| 9 | Flat | Potatoes | 32T 692,153 mE 4,973,557 mN | BON T7 | |
| 9 | Flat | Strawberries since 1996 | 32T 692,173 mE 4,973,529 mN | BON T8 | |
| Ostellato Peaty silty clay deltaic deposits 14.3 °C–673 mm Calcaric Thaptohistic Fluvisols | –6 | Flat | Pear nursery 1–2 years | 32T 735,876 mE 4,957,753 mN | MAC3 |
| –5 | Flat | Pear nursery 2–3 years | 32T 735,455 mE 4,957,786 mN | MAC4 | |
| −5 | Flat | Pear nursery ≥ 3 years | 32T 735,496 mE 4,957,801 mN | MAC5 | |
| 694 | 14 | Grassed uncultivated | 32T 643,297 mE 4,898,148 mN | HEL1, HEL2 | |
| Fanano Landslide deposits 10.7 °C–1300 mm Calcaric Regosols | 698 | 16 | Raspberries | 32T 643,257 mE 4,898,122 mN | HEL3, HEL4 |
| 713 | 12 | Raspberries | 32T 643,166 mE 4,898,137 mN | HEL5, HEL6 | |
| 73 | 4 | Grassed orchard (peach, 10 years) | 33T 274,776 mE 4,888,720 mN | BIO_1 | |
| Cesena Sandstones intercalated with claystones (BIO1, BIO2) Marly arenaceous formation (BIO3, BIO4) 14.6 °C–741 mm Vertic Cambisols/Haplic Luvisols (BIO1, BIO2) Fluvic Cambisols (BIO3, BIO4) | 73 | 4 | Green manure orchard (peach, 10 years) | 33T 274,790 mE 4,888,718 mN | BIO_2 |
| 57 | 2 | Grassed orchard (peach, 5 years) | 33T 275,382 mE 4,889,160 mN | BIO_3 | |
| 57 | 2 | Green manure orchard (peach, 5 years) | 33T 275,386 mE 4,889,157 mN | BIO_4 | |
| 127 | 2 | Grassed orchard (kiwi, 29 years) | 32T 719,035 mE 4,898,500 mN | SAV1 | |
| Brisighella Marly arenaceous formation 13.2 °C–828 mm Hypocalcic Cambisols | 191 | 13 | Grassed orchard (kiwi, 1 year) | 32T 716,028 mE 4,900,689 mN | SPA1_1 |
| Faenza Landslide deposits (SPA1) Marly arenaceous formation (SPA2) 13.2 °C–895 mm Haplic Cambisols | 149 | 5 | Grassed orchard (kiwi, 30 years) | 32T 715,976 mE 4,900,869 mN | SPA1_2 |
| 361 | 24 | Grassed orchard (apricot, 10 years) | 32T 735,832 mE 4,886,917 mN | MER1_1 | |
| Predappio Marly arenaceous formation 13.2 °C–895 mm Haplic Cambisols | 347 | 24 | Grassed orchard (peach, 10 years) | 32T 735,848 mE 4,886,840 mN | MER1_2 |
| 17 | Flat | Grassed orchard (pear, 18 years) | 32T 731,949 mE 4,914,911 mN | ZAN1_1 | |
| Granarolo Faentino Silty clay alluvial deposits 14.9 °C–774 mm Fluvic Cambisols | 17 | Flat | Grassed orchard (peach, 15 years) | 32T 732,200 mE 4,915,040 mN | ZAN1_2 |
| 725 | 34 | Fruit chestnut | 32T 690,027 mE 4,898,707 mN | MAR1 | |
| Monghidoro Landslide deposits (MAR1, MAR2, MAR3) Shales (MAR4, MAR5, MAR6, MAR7, MAR8) 12.1 °C–1249 mm Calcaric Regosols | 721 | 34 | Fruit chestnut | 32T 690,016 mE 4,898,702 mN | MAR2 |
| 719 | 34 | Fruit chestnut | 32T 690,015 mE 4,898,699 mN | MAR3 | |
| 700 | 21 | Fruit chestnut | 32T 689,880 mE 4,898,803 mN | MAR4 | |
| 689 | 21 | Fruit chestnut | 32T 689,873 mE 4,898,842 mN | MAR5 | |
| 684 | 7 | Fruit chestnut | 32T 689,848 mE 4,898,855 mN | MAR6 | |
| 691 | 15 | Fruit chestnut | 32T 689,775 mE 4,898,809 mN | MAR7 | |
| 688 | 7 | Fruit chestnut | 32T 689,778 mE 4,898,812 mN | MAR8 | |
| 647 | 7 | Fruit chestnut | 32T 659,049 mE 4,916,723 mN | TIZ1 | |
| Zocca Stratified stone rocks (TIZ1, TIZ2, TIZ3) Marls (TIZ4, TIZ5, TIZ6, TIZ7) 11.8 °C–884 mm Calcic Regosols | 639 | 14 | Fruit chestnut | 32T 659,072 mE 4,916,758 mN | TIZ2 |
| 636 | 10 | Fruit chestnut | 32T 659,089 mE 4,916,773 mN | TIZ3 | |
| 614 | 25 | Fruit chestnut | 32T 658,831 mE 4,916,463 mN | TIZ5 | |
| 610 | 25 | Fruit chestnut | 32T 658,828 mE 4,916,468 mN | TIZ6 | |
| 632 | 23 | Fruit chestnut | 32T 658,899 mE 4,916,518 mN | TIZ7 | |
| 620 | 23 | Fruit chestnut | 32T 658,884 mE 4,916,516 mN | TIZ8 | |
| 737 | 26 | Fruit chestnut | 32T 618,243 mE 4,926,952 mN | PIC1 | |
| Carpineti Sandstones 11.9 °C–780 mm Haplic Cambisols | 729 | 26 | Fruit chestnut | 32T 618,265 mE 4,926,959 mN | PIC2 |
| 708 | 12 | Fruit chestnut | 32T 618,330 mE 4,926,980 mN | PIC3 | |
| 694 | 15 | Fruit chestnut | 32T 618,338 mE 4,927,058 mN | PIC4 | |
| 693 | 15 | Fruit chestnut | 32T 618,335 mE 4,927,073 mN | PIC5 | |
| 734 | 35 | Fruit chestnut | 32T 618,160 mE 4,927,154 mN | PIC6 | |
| 744 | 20 | Fruit chestnut | 32T 617,920 mE 4,926,380 mN | CAN1 | |
| 734 | 20 | Fruit chestnut | 32T 617,884 mE 4,926,380 mN | CAN2 | |
| 635 | 12 | Fruit chestnut | 32T 686,233 mE 4,904,761 mN | MEN1 | |
| Loiano Sands and sandstones (MEN1, MEN2) Landslide deposits (MON1, MON2, MON3, MON4) 12.1 °C–879 mm Haplic Cambisols | 630 | 18 | Fruit chestnut | 32T 686,249 mE 4,904,766 mN | MEN2 |
| 604 | 15 | Fruit chestnut | 32T 686,780 mE 4,904,186 mN | MON1 | |
| 601 | 17 | Fruit chestnut | 32T 686,770 mE 4,904,202 mN | MON2 | |
| 594 | 12 | Fruit chestnut | 32T 686,771 mE 4,904,251 mN | MON3 | |
| 608 | 28 | Fruit chestnut | 32T 686,736 mE 4,904,188 mN | MON4 |
References
- FAO. Voluntary Guidelines for Sustainable Soil Management; Food and Agriculture Organization of the United Nations: Rome, Italy, 2017; p. 16. [Google Scholar]
- Blum, W.H. Functions of soil for society and the environment. Rev. Environ. Sci. Biotechnol. 2005, 4, 75–79. [Google Scholar] [CrossRef]
- Adhikari, K.; Hartemink, A.E. Linking soils to ecosystem services—A global review. Geoderma 2016, 262, 101–111. [Google Scholar] [CrossRef]
- Baer, S.G.; Birgé, H.E. Soil ecosystem services: An overview. In Managing Soil Health for Sustainable Agriculture Volume 1; Reicosky, D., Ed.; Fundamentals, Burleigh Dodds Science Publishing: Cambridge, UK, 2018; pp. 17–38. [Google Scholar]
- Montanarella, L.; Panagos, P. The relevance of sustainable soil management within the European Green Deal. Land Use Policy 2021, 100, 104950. [Google Scholar] [CrossRef]
- Lorenz, K.; Lal, R. Environmental impact of organic agriculture. Adv. Agron. 2016, 139, 99–152. [Google Scholar]
- FAO-ITPS. Protocol for the Assessment of Sustainable Soil Management; Food and Agriculture Organization of the United Nations: Rome, Italy, 2020. [Google Scholar]
- Bünemann, E.K.; Bongiorno, G.; Bai, Z.; Creamer, R.E.; De Deyn, G.; de Goede, R.; Fleskens, L.; Geissen, V.; Kuyper, T.W.; Mäder, P.; et al. Soil quality—A critical review. Soil Biol. Biochem. 2018, 120, 105–125. [Google Scholar] [CrossRef]
- Lorenz, K.; Lal, R.; Ehlers, K. Soil organic carbon stock as an indicator for monitoring land and soil degradation in relation to United Nations’ Sustainable Development Goals. Land Degrad. Dev. 2019, 30, 824–838. [Google Scholar] [CrossRef]
- Murphy, B.W. Impact of soil organic matter on soil properties—A review with emphasis on Australian soils. Soil Res. 2015, 53, 605–635. [Google Scholar] [CrossRef]
- Duval, M.E.; Galantini, J.A.; Iglesias, J.O.; Canelo, S.; Martinez, J.M.; Wall, L. Analysis of organic fractions as indicators of soil quality under natural and cultivated systems. Soil Tillage Res. 2013, 131, 11–19. [Google Scholar] [CrossRef]
- Gomiero, T. Soil degradation, land scarcity and food security: Reviewing a complex challenge. Sustainability 2016, 8, 281. [Google Scholar] [CrossRef] [Green Version]
- Wiesmeier, M.; Urbanski, L.; Hobley, E.; Lang, B.; von Lützow, M.; Marin-Spiotta, E.; van Wesemael, B.; Rabot, E.; Ließ, M.; Garcia-Franco, N.; et al. Soil organic carbon storage as a key function of soils—A review of drivers and indicators at various scales. Geoderma 2019, 333, 149–162. [Google Scholar] [CrossRef]
- Virto, I.; Imaz, M.J.; Fernández-Ugalde, O.; Gartzia-Bengoetxea, N.; Enrique, A.; Bescansa, P. Soil degradation and soil quality in Western Europe: Current situation and future perspectives. Sustainability 2015, 7, 313–365. [Google Scholar] [CrossRef] [Green Version]
- European Environment Agency. Down to Earth: Soil Degradation and Sustainable Development in Europe; United Nation Convention to Combat Desertification: Bonn, Germany, 2000. [Google Scholar]
- Tan, Z.X.; Lal, R.; Smeck, N.E.; Calhoun, F.G. Relationships between surface soil organic carbon pool and site variables. Geoderma 2004, 121, 187–195. [Google Scholar] [CrossRef]
- Goidts, E.; Van Wesemael, B.; Van Oost, K. Driving forces of soil organic carbon evolution at the landscape and regional scale using data from a stratified soil monitoring. Glob. Chang. Biol. 2009, 15, 2981–3000. [Google Scholar] [CrossRef]
- Wiesmeier, M.; Hübner, R.; Barthold, F.; Spörlein, P.; Geuß, U.; Hangen, E.; Reischl, A.; Schilling, B.; von Lützow, M.; Kögel-Knabner, I. Amount, distribution and driving factors of soil organic carbon and nitrogen in cropland and grassland soils of southeast Germany (Bavaria). Agric. Ecosyst. Environ. 2013, 176, 39–52. [Google Scholar] [CrossRef]
- Benedetti, A.; Mocali, S. Analisi a livello di suolo. In Indicatori di biodiversità per la Sostenibilità in Agricoltura. In Linee Guida, Strumenti e Metodi per la Valutazione della Qualità degli Agroecosistemi; Caporali, F., Vazzana, C., Benedetti, A., Calabrese, J., Mancinelli, R., Lazzerini, G., Mocali, S., Campiglia, E., Di Felice, V., Eds.; ISPRA: Rome, Italy, 2008; pp. 159–208. [Google Scholar]
- Vittori Antisari, L.; Ferronato, C.; De Feudis, M.; Natali, C.; Bianchini, G.; Falsone, G. Soil biochemical indicators and biological fertility in agricultural soils: A case study from northern Italy. Minerals 2021, 11, 219. [Google Scholar] [CrossRef]
- Cotrufo, M.F.; Soong, J.L.; Horton, A.J.; Campbell, E.E.; Haddix, M.L.; Wall, D.H.; Parton, W.J. Formation of soil organic matter via biochemical and physical pathways of litter mass loss. Nat. Geosci. 2015, 8, 776–779. [Google Scholar] [CrossRef]
- Lavallee, J.M.; Soong, J.L.; Cotrufo, M.F. Conceptualizing soil organic matter into particulate and mineral-associated forms to address global change in the 21st century. Glob. Chang. Biol. 2020, 26, 261–273. [Google Scholar] [CrossRef] [Green Version]
- Rubel, F.; Brugger, K.; Haslinger, K.; Auer, I. The climate of the European Alps: Shift of very high resolution Köppen-Geiger climate zones 1800–2100. Meteorol. Z. 2007, 26, 115–125. [Google Scholar] [CrossRef]
- Feng, X. A theoretical analysis of carbon isotope evolution of decomposing plant litters and soil organic matter. Glob. Biogeochem. Cycles 2002, 16, 1119. [Google Scholar] [CrossRef]
- Balesdent, J.; Mariotti, A. Measurement of soil organic matter turnover using 13C natural abundance. In Mass Spectrometry of Soils; Boutton, T.W., Yamasaki, S., Eds.; Marcel Dekker: New York, NY, USA, 1996; pp. 83–111. [Google Scholar]
- Ovsepyan, L.; Kurganova, I.; de Gerenyu, V.L.; Kuzyakov, Y. Recovery of organic matter and microbial biomass after abandonment of degraded agricultural soils: The influence of climate. Land Degrad. Dev. 2019, 30, 1861–1874. [Google Scholar] [CrossRef]
- Ferreira, A.C.C.; Leite, L.F.C.; de Araújo, A.S.F.; Eisenhauer, N. Land-use type effects on soil organic carbon and microbial properties in a semi-arid region of Northeast Brazil. Land Degrad. Dev. 2016, 27, 171–178. [Google Scholar] [CrossRef] [Green Version]
- Mocali, S.; Paffetti, D.; Emiliani, G.; Benedetti, A.; Fani, R. Diversity of heterotrophic aerobic cultivable microbial communities of soils treated with fumigants and dynamics of metabolic, microbial, and mineralization quotients. Biol. Fertil. Soils 2008, 44, 557–569. [Google Scholar] [CrossRef]
- Anderson, T.-H.; Domsch, K.H. Ratios of microbial biomass carbon to total organic carbon in arable soils. Soil Biol. Biochem. 1989, 21, 471–479. [Google Scholar] [CrossRef]
- Dilly, O. Microbial Energetics in Soils. In Microorganisms in Soils: Roles in Genesis and Functions; Buscot, F., Varma, A., Eds.; Springer: Berlin/Heidelberg, Germany, 2005; pp. 123–138. [Google Scholar]
- Renzi, G.; Canfora, L.; Salvati, L.; Benedetti, A. Validation of the soil Biological Fertility Index (BFI) using a multidimensional statistical approach: A country-scale exercise. Catena 2017, 149, 294–299. [Google Scholar] [CrossRef]
- Pompili, L.; Mellina, A.S.; Benedetti, A.; Bloem, J. Microbial indicators in three agricultural soils with different management. Fresenius Environ. Bull. 2008, 17, 1128–1136. [Google Scholar]
- Agnelli, A.; Bol, R.; Trumbore, S.E.; Dixon, L.; Cocco, S.; Corti, G. Carbon and nitrogen in soil and vine roots in harrowed and grass-covered vineyards. Agric. Ecosyst. Environ. 2014, 193, 70–82. [Google Scholar] [CrossRef] [Green Version]
- Falsone, G.; Marinari, S.; Vittori Antisari, L.; Vianello, G. Soil processes related to organic matter modifications following Douglas-fir mature reforestation. Biol. Fertil. Soils 2015, 51, 277–287. [Google Scholar] [CrossRef]
- Vance, E.D.; Brookes, P.C.; Jenkinson, D.S. An extraction method for measuring soil microbial biomass C. Soil Biol. Biochem. 1987, 19, 703–707. [Google Scholar] [CrossRef]
- De Feudis, M.; Falsone, G.; Vittori Antisari, L. Mid-term (30 years) changes of soil properties under chestnut stands due to organic residues management: An integrated study. Catena 2021, 198, 105021. [Google Scholar] [CrossRef]
- Brombin, V.; Mistri, E.; De Feudis, M.; Forti, C.; Salani, G.M.; Natali, C.; Falsone, G.; Vittori Antisari, L.; Bianchini, G. Soil carbon investigation in three pedoclimatic and agronomic settings of northern Italy. Sustainability 2020, 12, 10539. [Google Scholar] [CrossRef]
- Krüger, J.P.; Leifeld, J.; Alewell, C. Degradation changes stable carbon isotope depth profiles in palsa peatlands. Biogeosciences 2014, 11, 3369–3380. [Google Scholar] [CrossRef] [Green Version]
- Cagnarini, C.; Blyth, E.; Emmett, B.A.; Evans, C.D.; Griffiths, R.I.; Keith, A.; Jones, L.; Lebron, I.; McNamara, N.P.; Puissant, J.; et al. Zones of influence for soil organic matter dynamics: A conceptual framework for data and models. Glob. Chang. Biol. 2019, 25, 3996–4007. [Google Scholar] [CrossRef] [PubMed]
- Rolinski, S.; Prishchepov, A.V.; Guggenberger, G.; Bischoff, N.; Kurganova, I.; Schierhorn, F.; Müller, D.; Müller, C. Dynamics of soil organic carbon in the steppes of Russia and Kazakhstan under past and future climate and land use. Reg. Environ. Chang. 2021, 21, 73. [Google Scholar] [CrossRef]
- Dick, D.P.; Nunes Gonçalves, C.; Dalmolin, R.S.D.; Knicker, H.; Klamt, E.; Kögel-Knabner, I.; Simões, M.L.; Martin-Neto, L. Characteristics of soil organic matter of different Brazilian Ferralsols under native vegetation as a function of soil depth. Geoderma 2005, 124, 319–333. [Google Scholar] [CrossRef]
- Berhe, A.A.; Harden, J.W.; Torn, M.S.; Harte, J. Linking soil organic matter dynamics and erosion-induced terrestrial carbon sequestration at different landform positions. J. Geophys. Res. Biogeosci. 2008, 113, G04039. [Google Scholar] [CrossRef]
- Falsone, G.; Celi, L.; Caimi, A.; Simonov, G.; Bonifacio, E. The effect of clear cutting on podzolisation and soil carbon dynamics in boreal forests (Middle Taiga zone, Russia). Geoderma 2012, 177–178, 27–38. [Google Scholar] [CrossRef]
- Lundström, U.S.; Van Breemen, N.; Bain, D. The podzolization process. A review. Geoderma 2000, 94, 91–107. [Google Scholar] [CrossRef]
- Novara, A.; Gristina, L.; Kuzyakov, Y.; Schillaci, C.; Laudicina, V.A.; La Mantia, T. Turnover and availability of soil organic carbon under different Mediterranean land-uses as estimated by 13C natural abundance. Eur. J. Soil Sci. 2013, 64, 466–475. [Google Scholar] [CrossRef] [Green Version]
- Guimarães, D.V.; Gonzaga, M.I.S.; da Silva, T.O.; da Silva, T.L.; da Silva Dias, N.; Matias, M.I.S. Soil organic matter pools and carbon fractions in soil under different land uses. Soil Tillage Res. 2013, 126, 177–182. [Google Scholar] [CrossRef] [Green Version]
- Lützow, M.V.; Kögel-Knabner, I.; Ekschmitt, K.; Matzner, E.; Guggenberger, G.; Marschner, B.; Flessa, H. Stabilization of organic matter in temperate soils: Mechanisms and their relevance under different soil conditions—A review. Eur. J. Soil Sci. 2006, 57, 426–445. [Google Scholar] [CrossRef]
- Schmidt, M.W.I.; Torn, M.S.; Abiven, S.; Dittmar, T.; Guggenberger, G.; Janssens, I.A.; Kleber, M.; Kögel-Knabner, I.; Lehmann, J.; Manning, D.A.C.; et al. Persistence of soil organic matter as an ecosystem property. Nature 2011, 478, 49–56. [Google Scholar] [CrossRef] [PubMed] [Green Version]
Publisher’s Note: MDPI stays neutral with regard to jurisdictional claims in published maps and institutional affiliations. |
© 2021 by the authors. Licensee MDPI, Basel, Switzerland. This article is an open access article distributed under the terms and conditions of the Creative Commons Attribution (CC BY) license (https://creativecommons.org/licenses/by/4.0/).