Article

Genetic Diversity and Structure of Local Pear Cultivars from Mountainous Areas from Aragon (Northeastern Spain)

by
Francisco Javier Bielsa
1,†,
Patricia Irisarri
1,2,†,
Pilar Errea
1,2 and
Ana Pina
1,2,*
1
Unidad de Hortofruticultura, Centro de Investigación y Tecnología Agroalimentaria de Aragón (CITA), Avda. Montañana 930, 50059 Zaragoza, Spain
2
Instituto Agroalimentario de Aragón–IA2, CITA-Universidad de Zaragoza, 50013 Zaragoza, Spain
*
Author to whom correspondence should be addressed.
These authors contributed equally to this work.
Agronomy 2021, 11(9), 1778; https://doi.org/10.3390/agronomy11091778
Submission received: 31 July 2021 / Revised: 27 August 2021 / Accepted: 2 September 2021 / Published: 4 September 2021
(This article belongs to the Collection Genetic Diversity Evaluation of the Fruit Trees)

Abstract

:
The genetic diversity of pear local varieties prospected in mountainous areas from Northeastern Spain (Pyrenees and Iberian Cordillera) is not well known so far. In this study, an overall set of 252 accessions (178 prospected in mountainous areas from Aragon and a diverse set of 74 reference cultivars) was analyzed using 14 SSRs in order to estimate its genetic diversity and to identify the genetic structure and relationships among the pear germplasm studied. A total of 251 distinct alleles were successfully amplified with an average of 17.9 alleles per locus and with a wide genetic diversity (mean expected heterozygosity of 0.82). In total, 228 unique genotypes were identified and 210 genotypes were represented by a single accession indicating a situation of extreme vulnerability of these pear genetic resources held in the CITA collection. An amount of 32.9% of accessions were considered triploids displaying three alleles at least into two loci. Genetic analyses performed by a model-based Bayesian procedure, principal coordinate analysis and analysis of molecular variance supported the presence of a genetic stratification with the existence of four sub-groups among the accessions, with a highly significant differentiation (FST = 0.132; p < 0.001). These results shed light on the characterization and genetic relatedness between these local accessions and currently cultivated pear cultivars and highlight the importance to safeguarding this diversity that might be essential for new breeding programs.

1. Introduction

Pears (Pyrus spp.) are one of the oldest and most widespread fruit crops in the world in temperate regions. Pear (Pyrus spp.) belongs to the genus Pyrus, subfamily Spiraeoideae, tribe Pyreae within of the Rosaceae plant family (a modified classification of Potter et al. [1]). The majority of pear cultivars are diploid (2n = 2x = 34) and the Pyrus genus could be the result of a hybridization between two primitive forms of Rosaceae: Prunoideae (x = 8) and Spiraeodeae (x = 9) [2,3,4]. The genus Pyrus has principally been divided into European and Asian pears [3,5]. Four important Pyrus species are commercially grown for edible fruit: Japanese pear (P. pyrifolia Nakai), European pear (P. communis L.) and Chinese pears (P. bretschneideri Rehd. and P. ussuriensis Maxim.) [5]. European pears comprise more than 20 species and are mainly cultivated by P. communis L., all indigenous to Europe, North and South American and Africa [3,4,5]. It is believed that cultivated European pears derived from the hybridization between Pyrus pyraster and Pyrus caucasica (which are interfertile with domesticated forms) during the tertiary period in the western mountains of China [6]. Despite the great genetic variability existing in pear (more than ‘3000’ cultivars documented), only five cultivars are the base of the currently Spanish production: ‘Conferencia’, ‘Blanquilla’, ‘Decana’, ‘Dr Jules Guyot’ and ‘Williams’ [7]. Therefore, although the selection activity in the last several centuries has produced several hundred cultivars, only a few pear cultivars are currently grown, and some of these cultivars date back more than 150–200 years. In Europe, just eight cultivars (‘Conference’, ‘Williams’, ‘Abbe Fetel’, ‘Blanquilla, ‘Doyenne du Comice’, ‘Mantecosa Bosc’, ‘Dr Jules Guyot’ and ‘Coscia’) represent 80% of the production [8]. The massive use of few and related commercial cultivars have caused a progressive replacement of traditional cultivars for others which are more productive, achieve better economic results and preferred consumer varieties. In addition, deep changes in the means of production and the abandonment of rural life [9,10] have produced a sudden reduction in pear genetic diversity.
This loss of genetic diversity is especially true for mountainous areas of Northeastern Spain, which underwent a severe process of population decline from the second half of the last century, implying that most traditional farming areas were abandoned [10,11,12]. In order to preserve genetic diversity, different initiatives were performed to recover these genetic resources, which constitute an important source of plant genetic diversity of endangered pear trees [13,14,15]. This local germplasm was cultivated mainly in marginal areas, is well adapted to the local environment and might be resistant to biotic and abiotic stress. They were grown in traditional agriculture seeking their adaptation to edaphoclimatic conditions and local pathogens, and looking for specific uses and qualities that diversified the food base of rural society [16,17].
The need to avoid the loss of autochthonous genotypes capable of being used in the genetic improvement of fruit trees or in varietal selection processes, stimulated different research groups to undertake prospecting programs and their conservation in germplasm banks, coordinated by the INIA (National Institute of Agricultural and Food Research and Technology). As a result of these surveys, the National Pear Germplasm Collection located at CITA of Aragon was created, based on the original surveys by Herrero [17]. Currently, this pear collection comprises a total of 331 accessions of Pyrus communis L., of which 243 are Spanish landraces and local cultivars [18]. Additionally, works to recover pear local accessions from abandoned orchards in mountainous areas from Aragon began in 2001, and enriched these collections with 178 new accessions. The wealth of local pear varieties in Spanish orchards and the most detailed historical description of its traditional use was documented by Herrero [19,20], providing information on putative synonymies and a geographical distribution of the main cultivars at the regional level and describing the most widespread local varieties at that time.
Genetic resources held at germplasm collections over the world have been traditionally characterized with phenotypic traits. However, DNA markers play a crucial role during the formation of these banks and have gained more and more importance since the late 1980s [21], as they provide key information for elucidating genetic relationships between accessions of these germplasm banks. In recent years, pear genetic resources have been studied using several DNA markers such as RFLPs [22] or RAPD [23]. Single Sequence Repeats Markers have also been used for this matter [24,25] and have been proven to be a smart choice option because of their transferability, synteny and great conservation [26], as well as their codominance, high polymorphism and ease of application [27], which facilitates result interpretation and ensure reproducibility. In pear, several works have been carried out in different countries to study genetic variability in pear, including modern cultivars and germplasm accessions using SSR markers, such as in Spain [13,14,15,28], Italy [29], Hungary [30], Sweden [31], Bosnia and Herzegovina [32] and Portugal [33,34]. However, there are few studies regarding the genetic diversity in fruit trees located in mountain areas [35,36,37]. In this sense, the conservation of traditional varieties in collections should be considered as a set of genetic diversity not sufficiently explored for the moment, but which can be very useful for breeding programs in future years.
In this study, the main goal is to evaluate the genetic diversity and relationships of local pear accessions obtained from different mountainous regions of Aragon (Northeastern Spain) by 14 SSRs markers in order to: (1) determine the genetic identity of the pear accessions, (2) compare between local genotypes and a diverse set of reference cultivars conserved at the CITA germplasm collection, and (3) assess the genetic structure of the overall set of pear accession studied. This work provides further insights into the diversity and genetic structure of pear local accessions that contribute for a better management and conservation of this local germplasm.

2. Materials and Methods

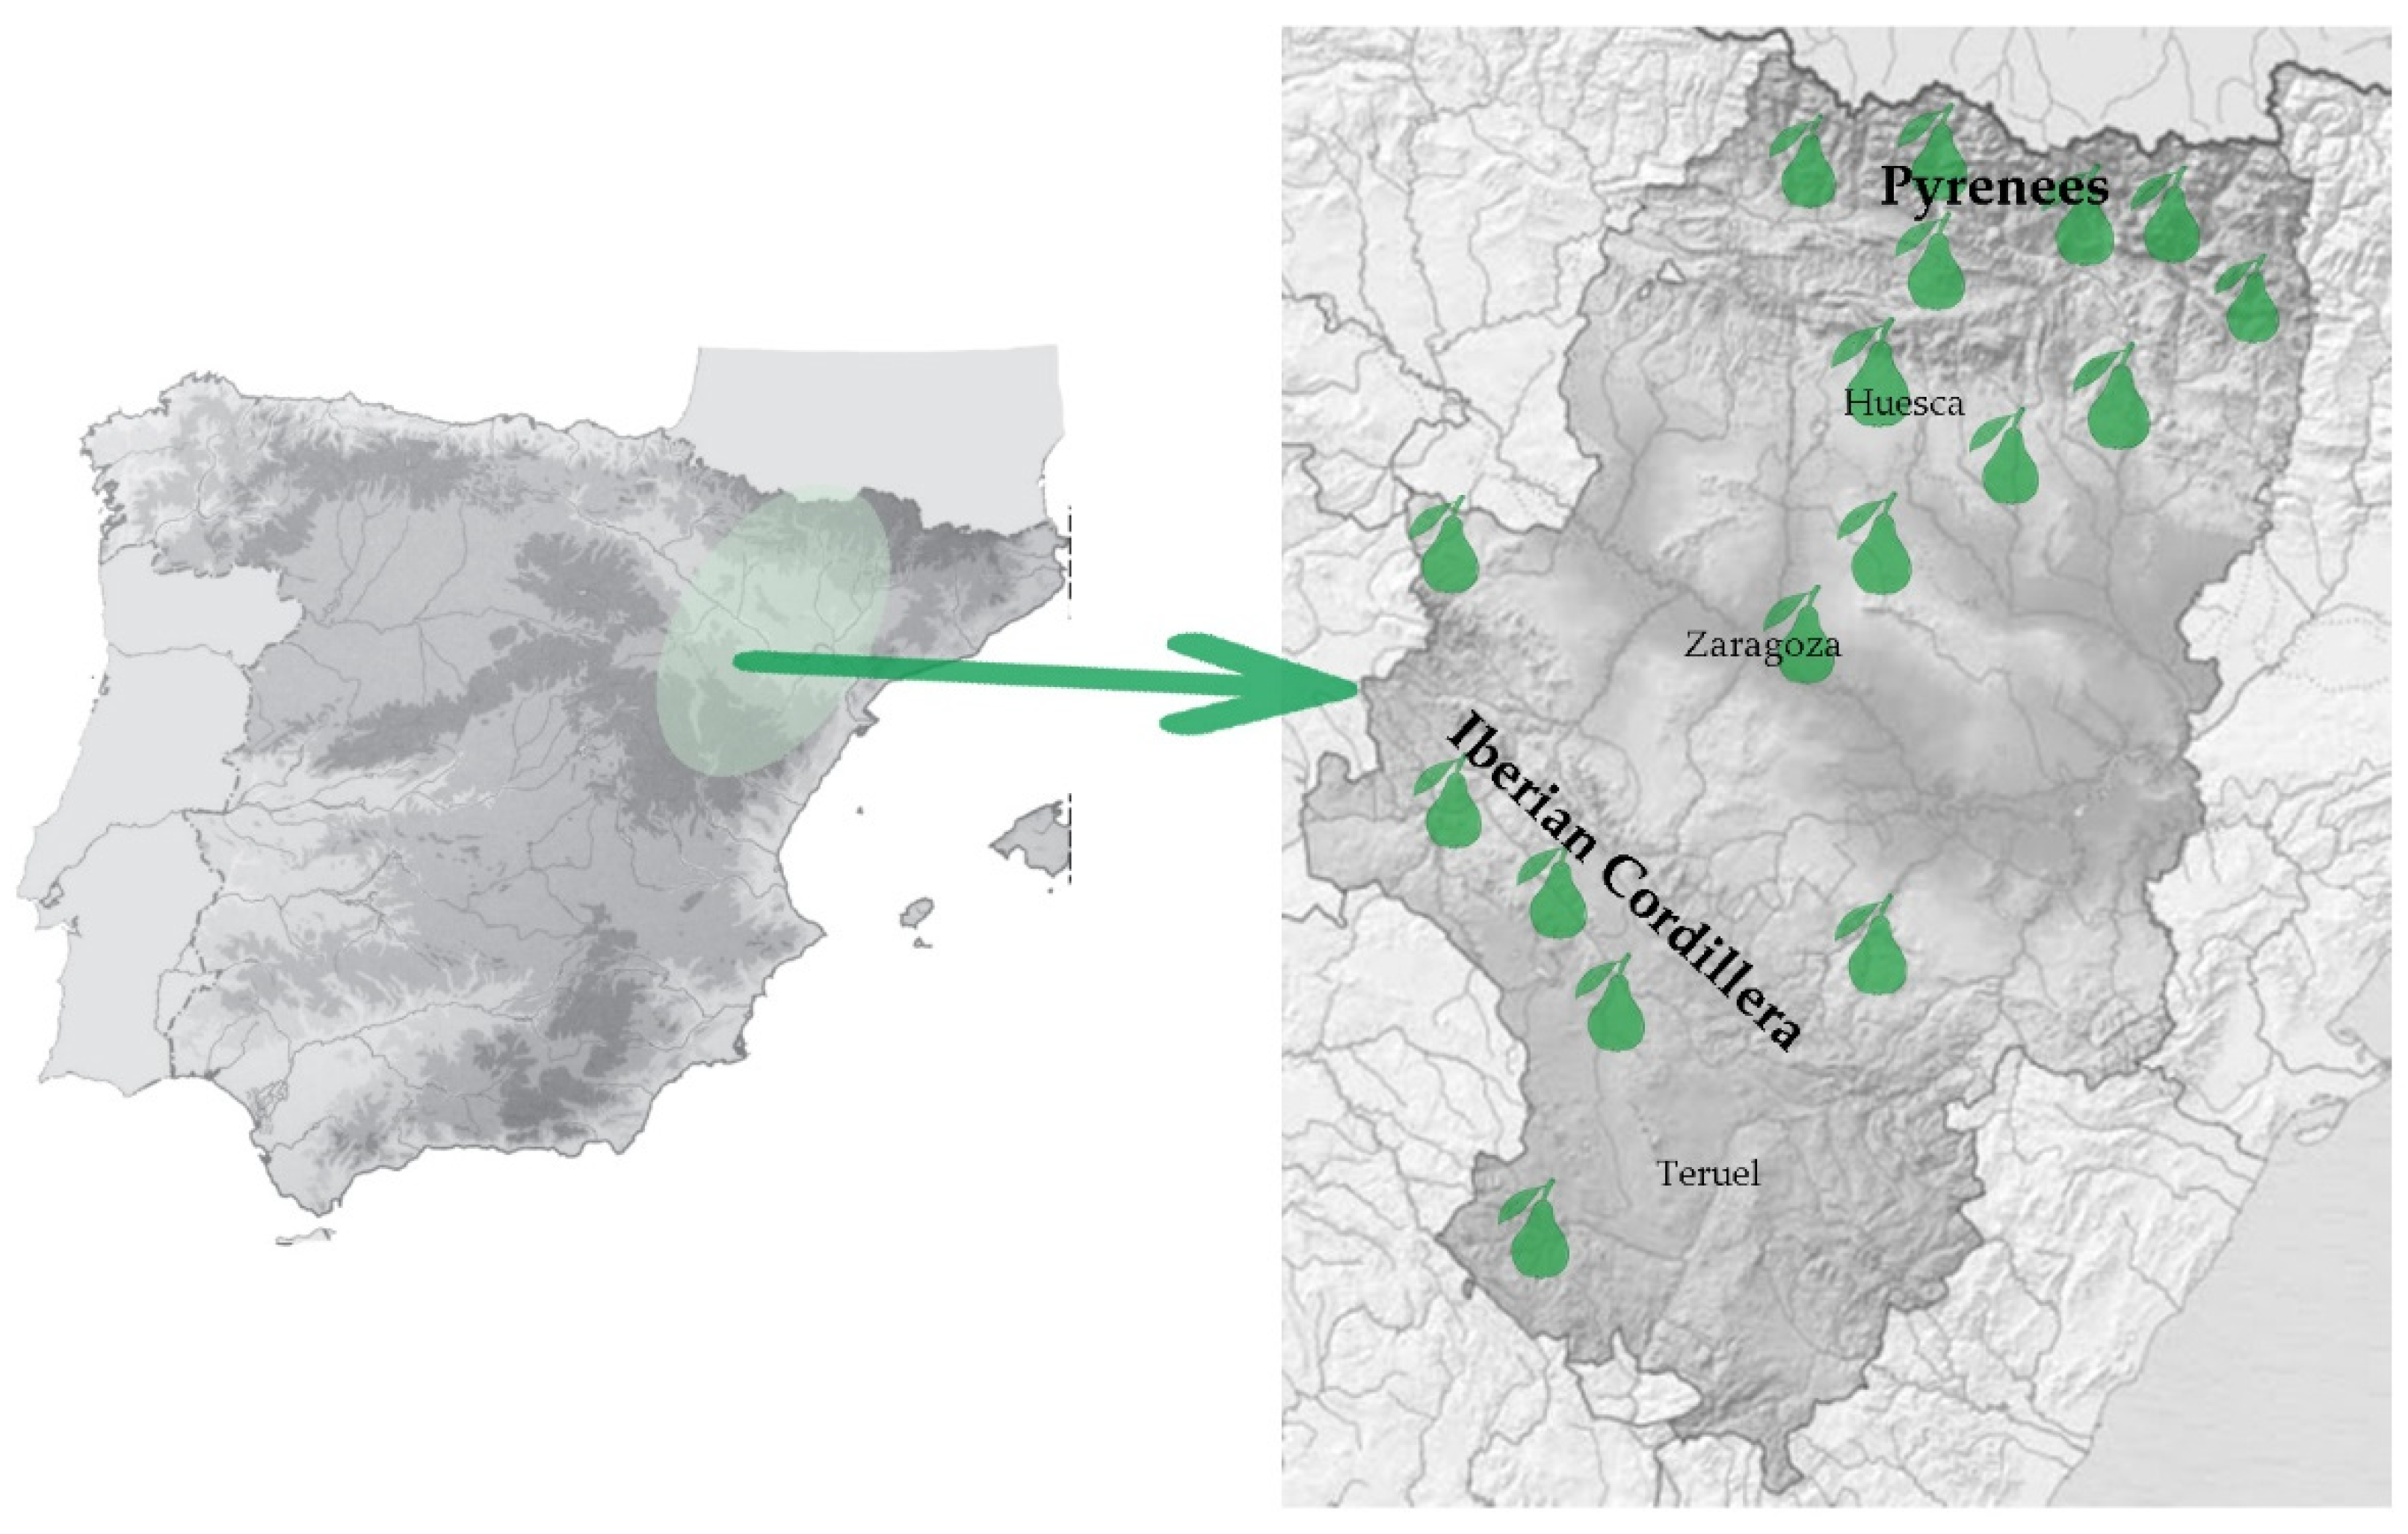
2.1. Plant Material and DNA Extraction

Pear cultivars analyzed in this study consisted on a set of 178 pear accessions collected from mountainous areas of Aragon (Pyrenees and Iberian Cordillera from Northeastern Spain since 2001) and 74 reference cultivars. Reference set includes traditionally cultivated varieties in Spain, cultivars bred in the 18th and 19th centuries (mainly European) and international cultivars recently introduced into the Spanish market [20] and belong to the National Pear Collection maintained in the orchards of CITA of Aragon, Zaragoza, Spain. All prospected accessions were obtained from abandoned old trees or small farms and were collected from 65 different localities from the three provinces of Aragon (Huesca, Zaragoza and Teruel) (Figure 1). When the local denomination could not be known, the accessions were named after the village where they had been collected from (Table S1). These trees were propagated vegetatively and were established in collections located in Bescos de la Garcipollera (Huesca, Aragon) at an altitude of 900 m and in the orchards from CITA of Aragon.
Newly expanded leaves of each accession were collected in spring (March to April), immediately frozen in liquid nitrogen and stored at −80 °C until use. Genomic DNA was collected from young fresh leaves or vegetative buds following the procedure used by Hormaza [38]. Quantification of each DNA sample was performed using a Nanodrop 1000 (Thermo Fisher Scientific, Wilmington, DE, USA) and all samples were diluted to a final concentration of 10 ng· µ L 1 .

2.2. PCR Reactions and SSR Analysis

Genomic DNA was analyzed using a set of 14 SSRs, including 13 SSRs recommended by the European Cooperative Program for Plant Genetic Resources (ECPGR) [27,28,39] and the remaining one (CH02c11) successfully used in other pear or apple diversity studies [13,28,40] (Table 1). The genome coverage and high polymorphism had proven their adequation for this type of studies. Three multiplex PCRs were conducted, named MMA, MMB and MMC, in which forward primers were labelled with 6-FAM, VIC, NED or PET fluorescent at 5′ end. All PCR reactions were carried out on an iCycler Thermal Cycler (Bio-Rad Laboratories, Hercules, CA, USA) with a final volume of 10 µL, using 10 ng of DNA template, 0.2, 0.4, or 0.6 µM of each primer (Table 1) and 1X QIAGEN Multiplex PCR Master Mix (Qiagen, Holden, Germany). The temperature profile for all three PCR reactions encompassed an initial 15 min denaturation step at 95 °C, followed by 10 touchdown cycles at 95 °C for 30 s, 65–1 °C/cycle for 1 min and 72 °C for 1 min, followed by 30 cycles at 95 °C for 30 s, 55 °C for 1 min, 72 °C for 1 min and a final step of 30 min at 72 °C as described by Pina [36]. DNA amplification products were checked using agarose gel electrophoresis. Fluorescently labelled DNA fragments were separated on an ABI Prism 3730 (Applied Biosystems, Carlsbad, CA, USA) by capillary electrophoresis and analyzed and sized with Peak Scanner Software 2.0 (Applied Biosystems, Foster City, CA, USA). Reference cultivars were introduced in all PCR reactions to ensure internal control and run-to-run variation and fingerprinting analysis were performed by duplicate.

2.3. Genetic Diversity Evaluation

Genetic diversity between prospected accessions and reference cultivars was evaluated with SPAGeDI software [45] analyzing the number of polymorphic markers, total number of alleles, average number of alleles per marker, the observed heterozygosity (Ho), the expected heterozygosity (He), Wright’s F statistics, allelic frequencies and unique alleles. The effective number of alleles ( A e = ( p i 2 ) 1 ) [46] was quantified per locus, where p i represents the frequency of the ith allele. SSR markers were also evaluated using discrimination power ( P D = 1 p i 2 ) [47], where p i represents the frequency of the ith genotype, for each of them. In order to determine genetic relationships between the accessions studied, an UPGMA cluster analysis of the similarity matrix was performed using R software [48].

2.4. Analysis of the Genetic Structure, AMOVA and Principal Coordinates (PCoA)

Genetic Structure of the population was assessed using a model-based clustering method implemented in STRUCTURE software v.2.3.4 [49]. Bayesian analysis of unique genotypes was performed for a genetic group range between 1 and 10 (K). The analysis was run under admixture model with correlated allele frequencies. As the dataset included diploid and triploid genotypes, the software was run using the recessive alleles approach, encoding the genotypes as detailed by Urrestarazu et al. [50]. Simulations were performed with 10 runs per each proposed K value and each of them was implemented with ‘200,000’ burn-in interactions followed by another ‘500,000’ iterations. When the results suggested that the K groups could be further structured in sub-groups, a second-level (nested) structure analysis was performed individually for each K group [51,52]. The obtained results were analyzed with Structure Harvester [53] in order to determine the most probable group number (K) using the statistic method described by Evanno et al. [54]. Genotypes were sorted out into the group whose membership probability was higher (qI ≥ 0.8) [14,36,50,55]. The analysis of molecular variance (AMOVA) that estimates the fraction of the genetic variation among and within population was calculated using the software GenoDive version 3.05 [56], since this software supports analyses of datasets containing individuals with different ploidy levels. Principal coordinate analysis (PCoA) was performed based on SSRs data using DARwin software v 6.0.21 [57]. Finally, in order to contribute to the automation of analysis, SSR polymorphism, genetic diversity and clonality level were also evaluated using a home-made Python script that also allowed to prepare input files for the rest of the software used in this study (SPAGeDI, STRUCTURE, DARwin and GenoDive). The developed code can be found in https://github.com/FJBiocode/ShortSequenceRastreator (accessed on 31 July 2021).

3. Results

3.1. SSR Polymorphism and Genetic Diversity

In this study, 252 pear accessions held at the CITA of Aragon germplasm collection were analyzed using 14 SSR markers. The total of accessions comprised a set of 178 local accessions and 74 reference cultivars. All SSR markers were polymorphic. The primer pair CH02c11 amplified two loci but the secondary locus was monomorphic as reported by other authors [28,58], and only the amplification of the main locus was considered. The analysis of synonymy revealed 24 duplicated genotypes and reduced the dataset to 228 unique genotypes (156 local accessions and 72 reference cultivars) (Table S1). The range of amplified alleles among the 228 unique genotypes identified varied from 11 (CH04e03) to 25 (CH01d09 and CH03g07) and 251 total amplified alleles were identified (Table 2). The local accessions set and reference material set showed slight differences in the number of alleles amplified, 182 in the reference set and 239 in the local material set. Among the 251 total amplified alleles, 163 rare alleles (frequency lower than 0.05) were found. The local material set contained 151 of these alleles, whereas the reference material set revealed only 105. Moreover, 41 unique alleles were found among the studied population revealing an average of 2.92 unique alleles per locus and CH03g07 exhibited the majority of them. Allele richness showed an average value of 6.83 for the overall set which contrasts with the difference between the reference set (5.54) and local material set (6.98). SSR observed heterozygosity (Ho) in the overall set of cultivars ranged from 0.44 (CH04e03) to 0.91 (CH01d09) with an average value of 0.82, whereas expected heterozygosity (He) ranged from 0.45 (Ch04e03) to 0.92 (CH01d09) with an average value of 0.82. The power of discrimination (PD) varied from 0.65 (Ch04e03) to 0.98 (CH01d09), with a mean of 0.93. The observed Ho showed the same pattern as He. These results along with the high polymorphism and allele variety found by all markers, pointed out the adequacy of selected markers and ensured analysis accuracy. The Wright’s fixation index (Fis) was also determined for the set of local accessions and for the reference material one. The inbreeding coefficient ranged from 0.017 (CH01f07) to −0.082 (EMPc11) in the overall set of cultivars, with an average value of −0.022 for all loci, and from 0.147 (CH05c06) to −0.097 (CH04e03) with a mean value of −0.008 for the reference material (Table 2). As expected, the overall Fis value in the overall set was slightly negative (outbreeding), consistent for the majority of the loci (14), except for CH01f07 (0.017, p < 0.05), for CH02b10 (0.007, p < 0.001), and Ch04e03 (0.001, p < 0.001), homozygous compared with the expected values. An SSR analysis identified 75 of the 228 unique genotypes with three distinguishable alleles at several loci (at least in two or more loci), suggesting triploid individuals. The percentage of triploids varied from 32.9% to 23.2% if we consider triploid-only accessions that displayed three alleles at two, three or more loci, respectively. The highest number of genotypes with three alleles was found at loci EMPc11 and CH-Vf1, with 49 and 41 individuals, respectively. The lower level of triploids was detected with CH04e03 with five accessions.

3.2. Elucidation of Genetic Relationships between Local and Reference Material

Genotypes were considered duplicates when all alleles matched across the 14 SSRs. In total, 228 unique genotypes were found among the 252 total accessions, and the synonymous accessions were as many as 42 organized into 18 identity groups (average of 9.5% clonality in the overall dataset, 12.3% in the local set) (Table 3). ‘Roma’ was the most represented genotype in these 18 groups of synonyms with four more varieties within the group. However, 210 unique genotypes were represented by a single accession among the 228 unique genotypes, which constitutes a high level of vulnerability of these conserved genotypes. Most groups of duplicates comprised accessions from different geographic origin (localities) and it was not possible to distinguish the varieties ‘Tendral de Valencia’ and ‘Tendral de Aragon’, and ‘Malacara’ and ‘Magallon’ with the 14 SSRs. However, different SSR profiles were obtained between the reference cultivar ‘Williams’ and ‘Max Red Barlett’ for three loci CH02b10, EMPc117 and GD147, despite the last one being a bud mutation derived from ‘Williams’.
The genetic relationship between the studied genotypes is represented by UPGMA clustering. The neighbor-joining (NJ) tree was constructed, including both diploid and triploid unique genotypes, and the cluster analysis revealed four main different groups (Figure 2). Group A comprised 69 accessions: nine local Spanish reference varieties ‘Tendral de Aragon’, ‘Verde de Verano’, ‘Bergamotta de Estivo’, ‘Magallon’, ‘Agua temprana’, ‘Castell’, ‘Santiaguera dura’, ‘Abugo’ and ‘Ceremeño’, along with 60 local prospected accessions from the three provinces of Aragon. Group B contained local varieties that had a certain locally historical importance during the 19th century such as ‘Muslo de Dama I and II’, ‘Blanquilla’, ‘Flor de Invierno’, ‘Azucar Verde’ or ‘Limon de Verano’ [17] and 70 local prospected accessions. In group B, some ancient European varieties as ‘Roma’, ‘Cure’ or ‘Ercolini’ can also be found, adding up to a total of 85 accessions. In addition, group C included a more heterogeneous group, most of the recently introduced and selected varieties during the 17th–19th centuries such as British ‘Williams’ and ‘Conference’; French ‘Abbe Fetel’, ‘Doyenne du Comice’, ‘Delbard Premiere’ and ‘Passe Crasanne’; Australian ‘Packham’s Triumph’ and American ‘Red Crimson’ ‘Starkrimson’ and ‘Max Red Bartlett’ [59]. Most of the rest of the varieties found in this group are derived from crosses involving those genotypes. Some examples are ‘Barlett’ as the progenitor of ‘Harrow sweet’ (a cross between ‘Bartlett’ × (‘Old Home’ × ‘Early Sweet’)); ‘California’ (‘Max Red Barlett’ × ‘Comice’); ‘Highland’ (‘Barlett’ × ‘Comice’) and ‘Santa Maria Morettini’ (‘Bartlett × Coscia’); ‘Dr Jules Guyot’ as the progenitor of ‘Fiorenza’ and ‘Delbard Premiere’ (Akca × Dr. Jules Guyot); Onward (‘Laxton’s Superb × Doyenne du Comice’); ‘Magness’ (Seckel seedling × ‘Comice’); ‘Passe Crasanne’ of ‘Delbuena’ and ‘Conference’ of ‘Condo’. Likewise, group C included a total of 46 reference varieties but only encompasses 12 local accessions. Finally, an old Spanish traditional variety, ‘Donguindo’ could be found in group D along with 13 prospected accessions and ‘Bella Early’. In summary, over 66.7% of local material was found in different subgroups than foreign cultivars, which could reflect a remarkable singularity and potential interest of an important part of the prospected material from mountainous areas of Aragon. Furthermore, local accessions grouped with foreign cultivars were collected across different mountainous valleys of Aragon, highlighting traditional exchanges and the transference of plant material through grafting.

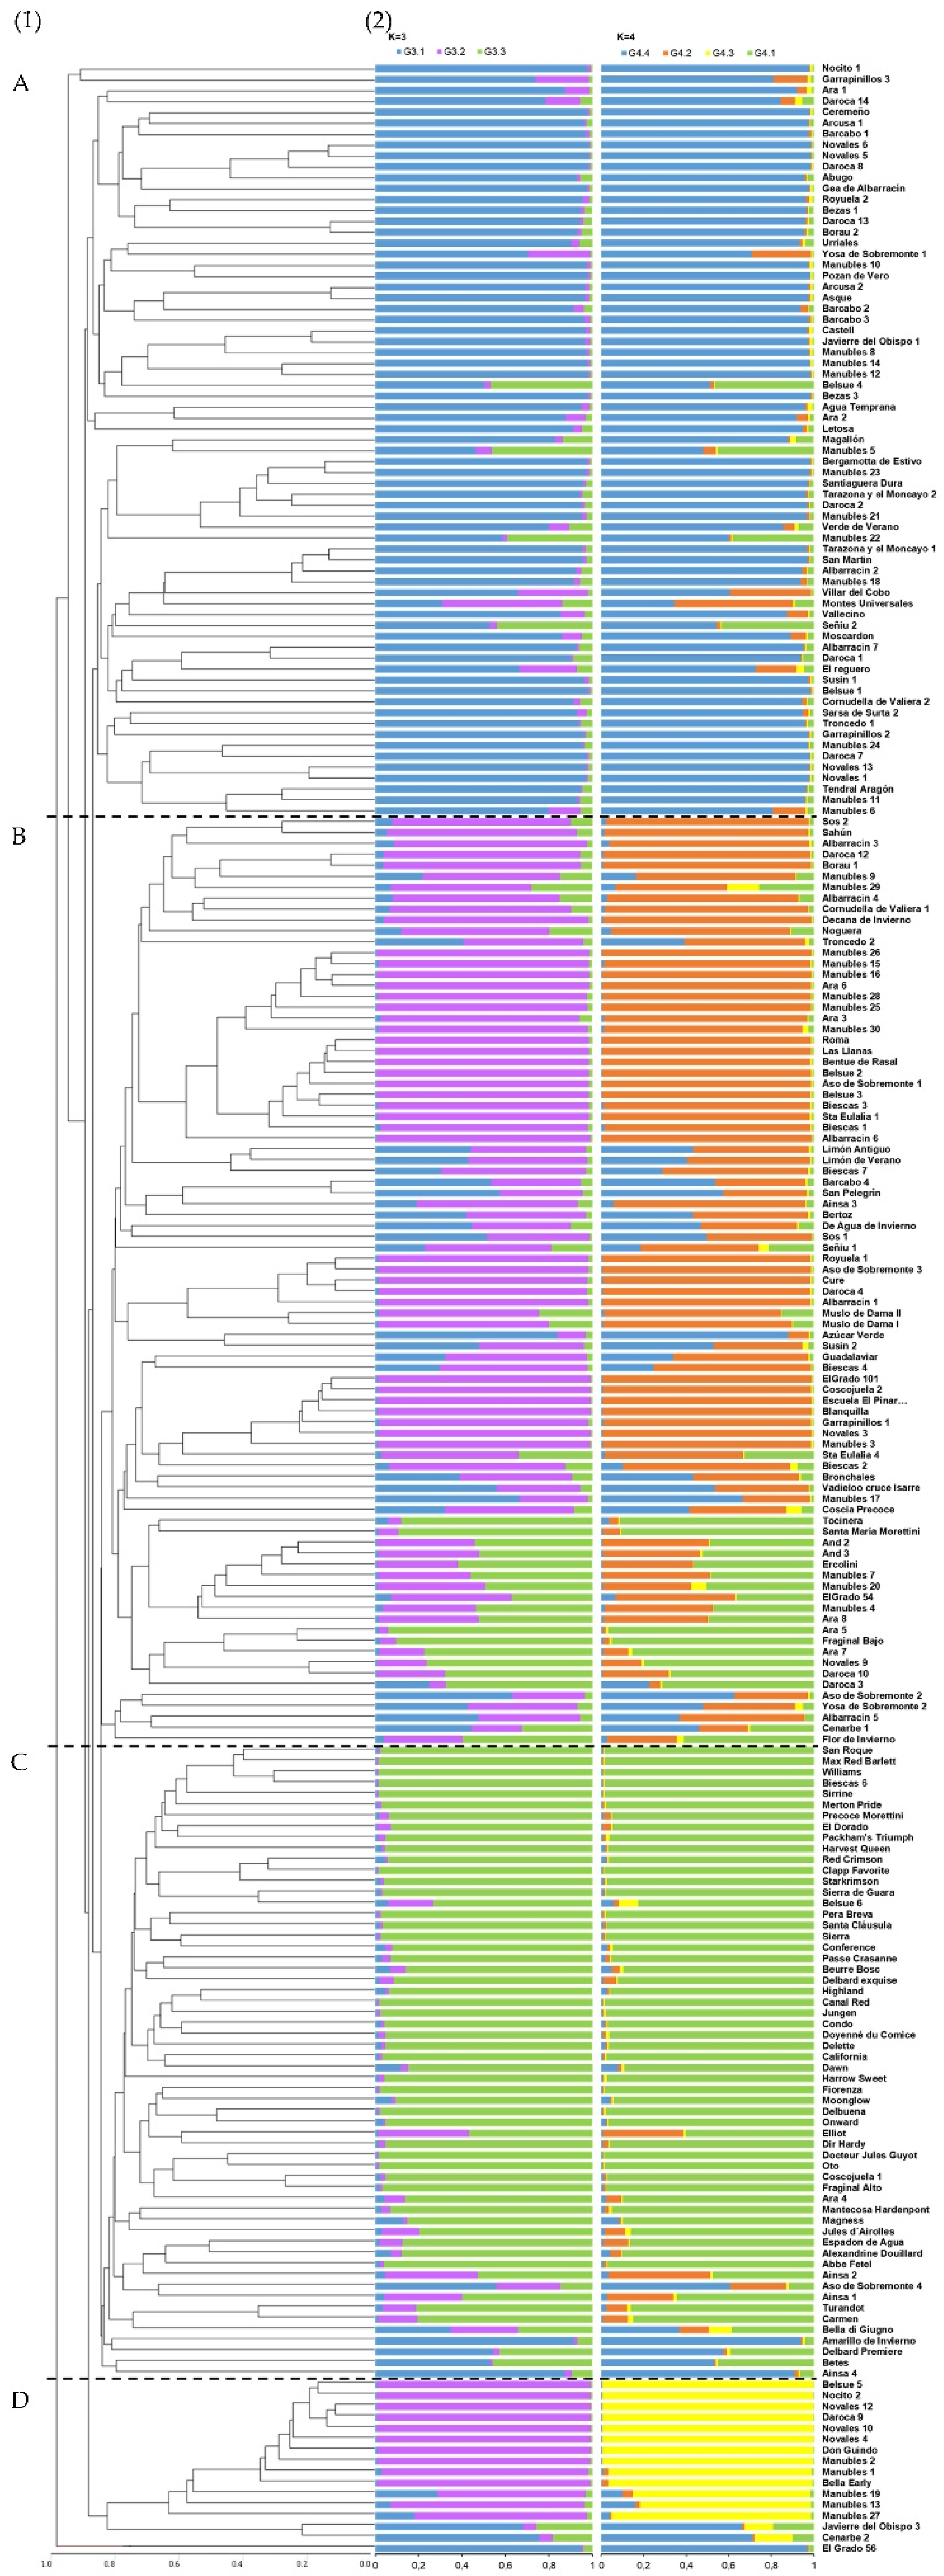
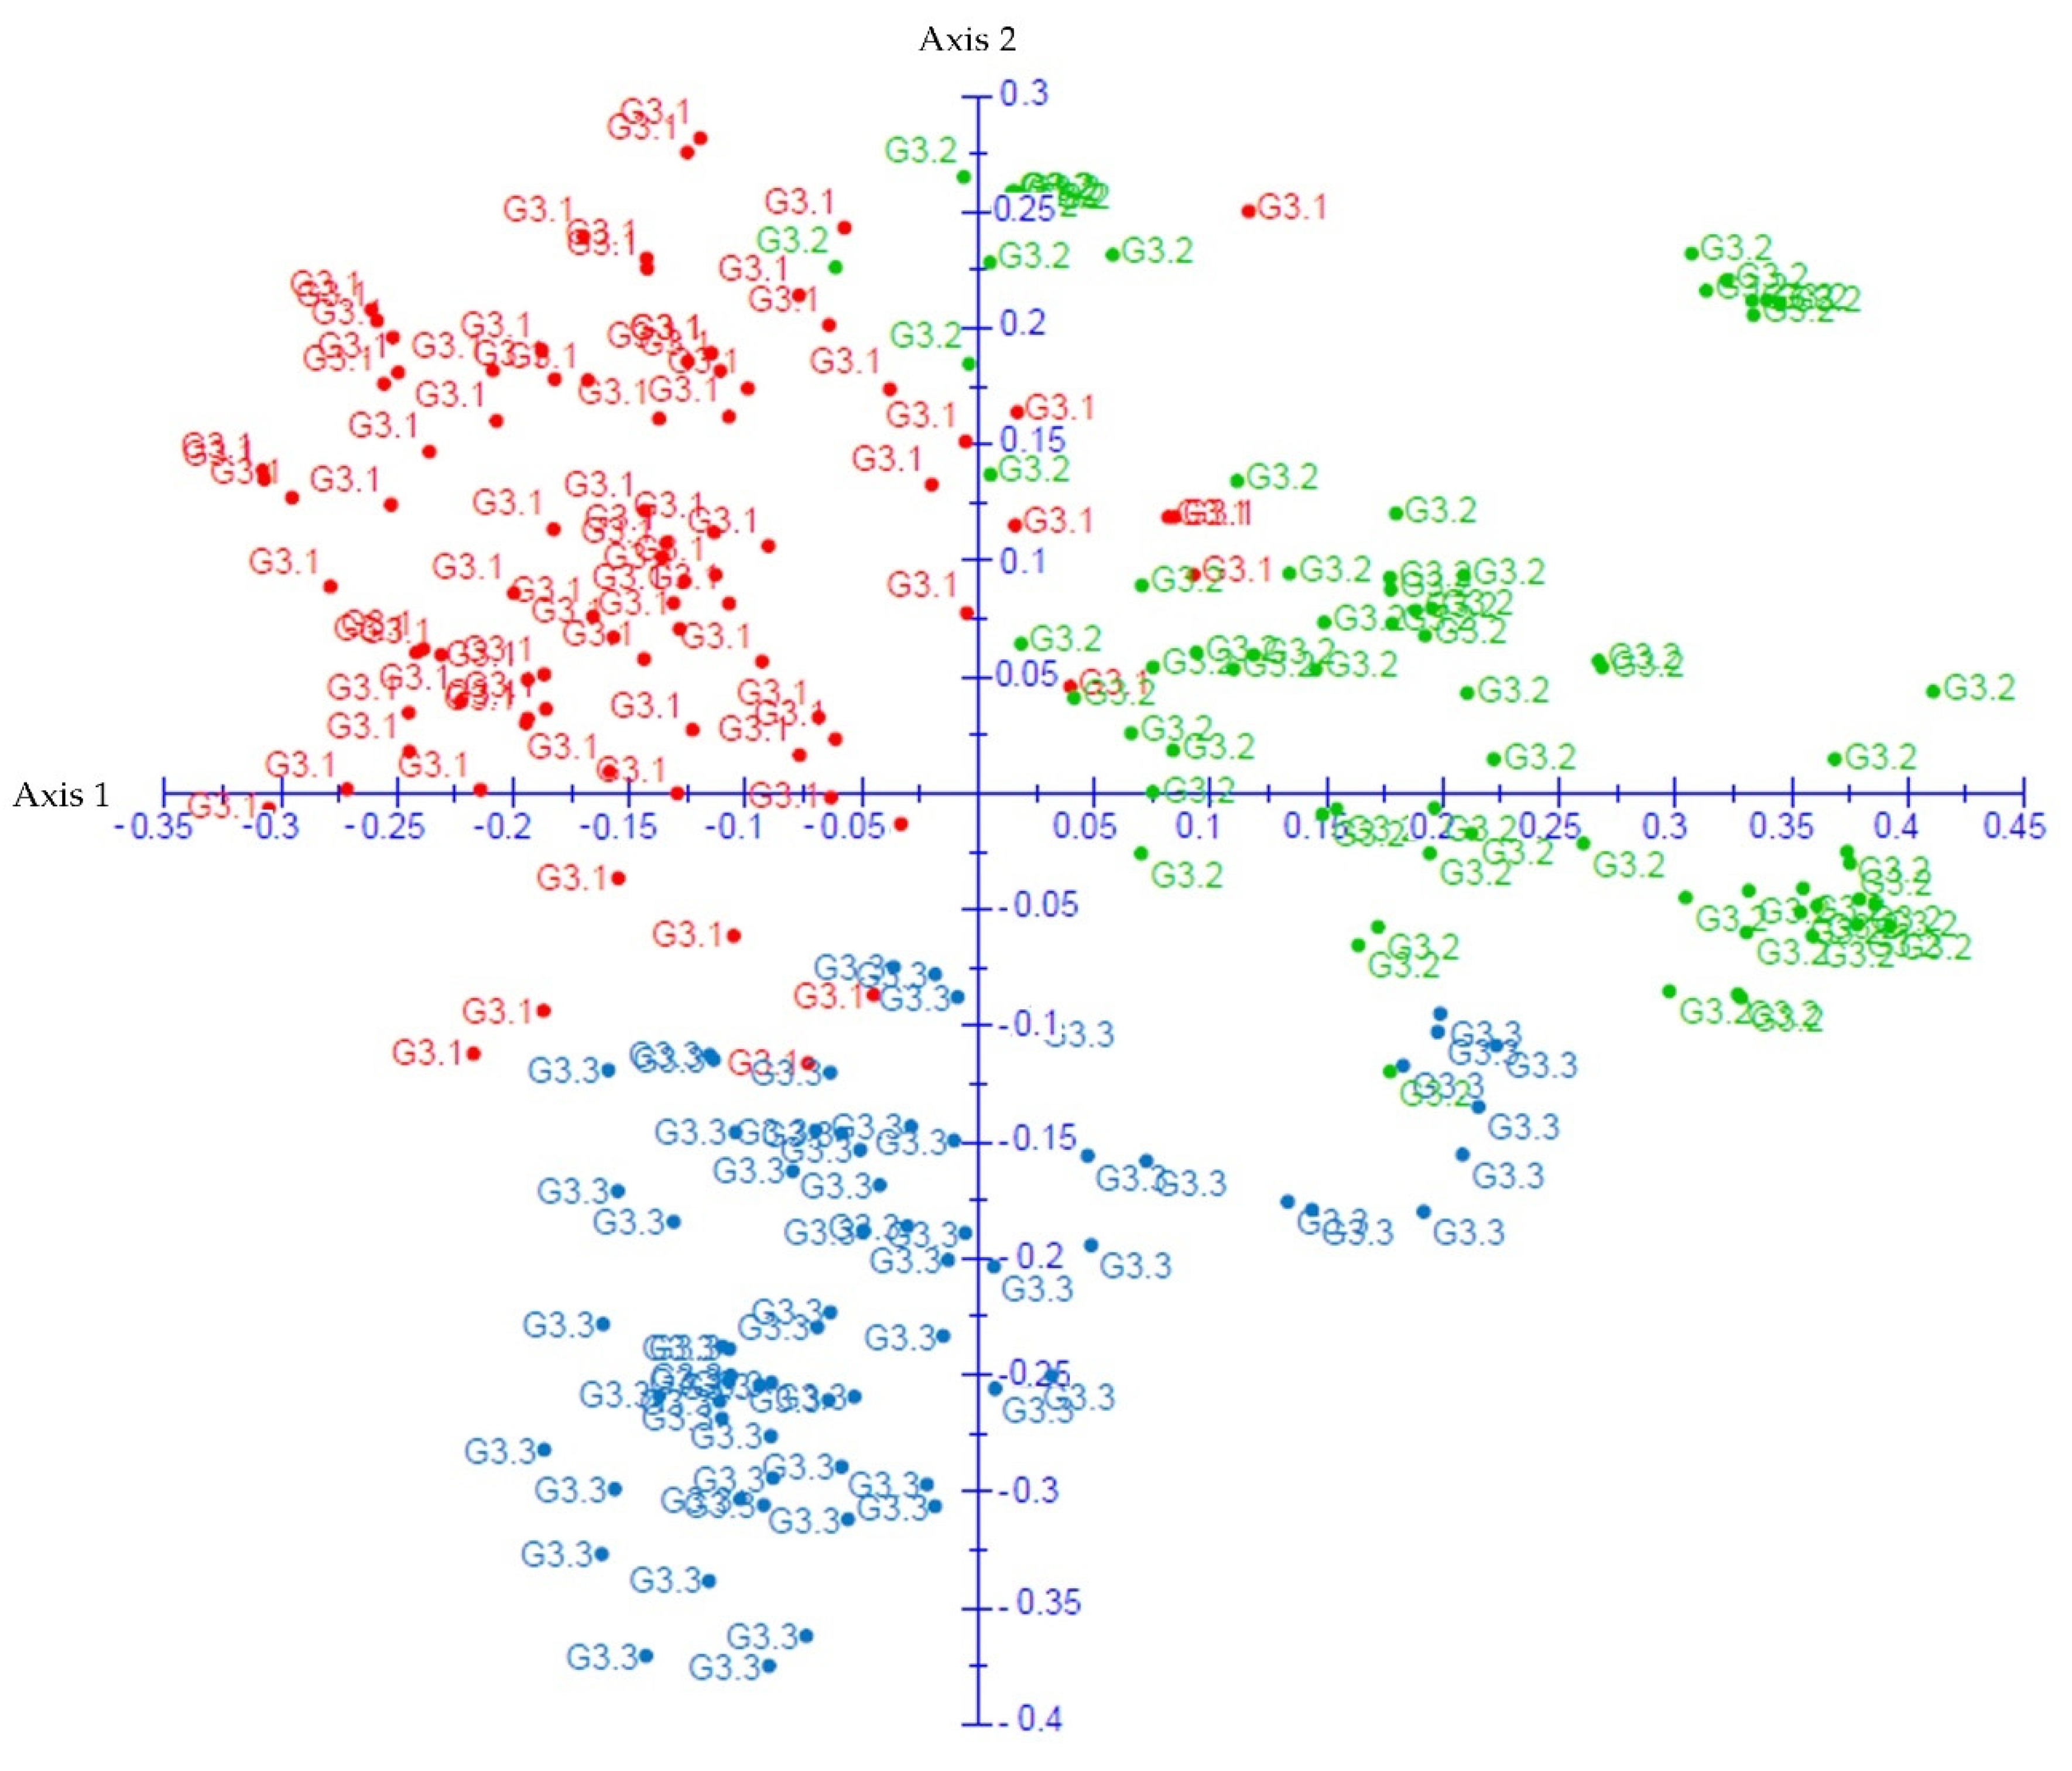
3.3. Population Genetic Structure Analysis

A Bayesian analysis of the 228 unique genotypes was carried out with STRUCTURE 2.3.4 using K values ranging from 1 to 10. The results of the analysis were processed with Structure Harvester and showed a most probable hierarchy division into three groups (K = 3, ΔK = 20) (Figure S1). However, differentiation in four subgroups could be possible too, as K = 4 also had a high ΔK value (ΔK ≈ 7). Groups found with K = 3 showed a remarkable heterogeneity. Groups one and two encompassed 87% of local genotypes, whereas group three included 65% of reference varieties and only 13% of local accessions. Group one (G3.1) contained 73 local accessions and 13 reference cultivars with the majority belonging to cluster A in the UPGMA dendrogram. Reference cultivars in this group are mostly old local Spanish cultivars such as ‘Ceremeño’, ‘Castell’, ‘Bergamotta de Estivo’, ‘Santiaguera Dura’, ‘Agua temprana’, ‘Tendral de Aragon’, ‘Abugo’, ‘Amarillo de Invierno’, ‘Azucar Verde’, ‘Magallon’, ‘Verde de Verano’. ‘Bella di Giugno’ and ‘Delbard Premiere’ were in admixed in this group. Group two (G3.2) was composed by 63 local accessions and 12 reference cultivars, including Spanish cultivars ‘Donguindo’, ‘Blanquilla’ and cultivars selected in the 18th and 19th centuries originating from Southern Europe such as ‘Cure’, ‘Roma’ and ‘Decana de Invierno’. Mostly these accessions grouped in cluster B in the UPGMA dendrogram. Group three (G3.3) contained only 20 local accessions and 47 reference cultivars, in which is currently based the world pear production such as ‘Williams’, ‘Doyenne du Comice’, ‘Abbe Fetel’, ’Conference’ ‘Passe Crassanne’ and more recently released and widely cultivated varieties such as ‘Max Red Barlett’ and ‘Packham’s Triumph’, with the majority belonging to cluster C in the UPGMA analysis. All three groups were analyzed a second time with structure to determine which one of them would unfold into two, given K = 4. G3.2 showed the highest ΔK value (K = 2, ΔK ≈ 10). This nested structure analysis allowed for a better characterization of each sub-population. All 75 accessions had a qI ≥ 0.8 and divided into a first group (G4.2) containing 52 local cultivars and 12 reference varieties and a second group (G4.3) encompassing 11 local cultivars and 2 reference varieties. The G4.3 group contained ‘Bella early’, ‘Donguindo’ and a local cultivar that matched with those found in Group D in the UPGMA clustering, whereas the G4.2 group was composed by reference varieties such as ‘Blanquilla’, ‘Limon de verano’ or ‘De agua de invierno’ resembling group C of the UPGMA clustering. For K = 3, 166 genotypes were characterized by qI values higher than 0.8 for the three groups (qI > 0.8) and the remaining 62 genotypes were considered ‘admixed’. The classification of accessions with qI > 0.80 was 72% for G3.1, 71% for G3.2 and 76% for G3.3 (Table 4). For K = 4, the classification of accessions with qI > 0.80 was 83% for sub-group G4.1, 65% for G4.2, 100% for G4.3 and 75% for G4.4 (Table 4). Most of the accessions in groups G4.1 and G4.4 for K = 4 correspond to accessions in group G3.3 and G3.1 for K = 3, respectively. All runs at K = 3 and 4 produced identical clustering solutions with very similar values of assignation probability for all the individuals between runs. Overall, the accession assignation to each group was robust and 73% of accessions had a qI ≥ 0.8 for K = 3 and 81% for K = 4 (Table 4). The remaining 27% and 19%, which had an admixture level lower than 0.8, could suggest the presence of genetic relationships between the accessions studied and pear cultivars not included in the analysis.
Finally, based on an AMOVA analysis, significant variance differences were observed between the three and four groups identified by the model-based clustering method. The distinction between the three and four populations was further confirmed by the analysis of the fixation index (Fst), a summary statistic quantifying the variation in allelic frequencies between groups. The overall Fst value of 0.062 and 0.101 suggested a moderate but highly significant (p < 0.001) differentiation between groups for K = 3 and K = 4, respectively. Excluding the admixed individuals for each group, the differentiation between groups was higher 0.106 for K = 3 and 0.132 for K = 4. Genetic diversity indexes were calculated by group (Table 4). Nei’s gene diversity varied from 0.74 (G3.3) to 0.81 (G3.1) for K = 3 and from 0.62 (G4.3) to 0.81 (G4.4), revealing a high proportion of heterozygous individuals in the three and four populations for K = 3 and K = 4. Interestingly, groups one and two showed a slightly higher genetic diversity than group three for K = 3, which assures a prospection missions’ role as a genetic diversity source. Furthermore, a multivariate principal coordinate analysis (PCoA) performed in DARwin [57] confirmed genetic discrimination between the three and four groups. The three groups revealed by Structure were clearly distinguished with the PCoA plot of the two first components drawn in DARwin software, where the two-principal axis (one and two) explained 8.55% and 7.30% of the variation (Figure 3). Group G3.1 (old and local Spanish cultivars) and G3.2 (mostly Southern European cultivars) were displayed in the positive and negative part of the first axis, respectively. G3.3 (Williams’ group) was found in the negative part of axis two.

4. Discussion

4.1. Genetic Diversity of Pear Accessions Prospected from Mountain Areas of Aragon

The benefit and need of the genetic identification of pear germplasm banks, improving the management of collections by enabling the identification of duplicates, synonyms, and homonyms, as well as to understand the origins of local varieties, and to ascertain the importance of introgression, polyploidy, and hybridization in their evolution have been widely reported [15,28,30,31,33]. In the last decades, several regional germplasm collections have been promoted in order to face the erosion caused by the introduction of improved varieties in specialized orchards, maintain and preserve the autochthonous diversity. In this study, a total of 252 pear accessions (178 local accessions prospected in mountainous areas from Northeastern Spain and 74 reference cultivars) held at the CITA of Aragon germplasm collection were genotyped with 14 SSR markers (13 suggested by ECPGR). High levels of heterozygosity and a high effective number of alleles per locus were found in the present study, suggesting a singularity and potential interest of this local pear accessions prospected from mountainous areas of Aragon. CITA pear germplasm collection showed a slightly higher average number of alleles per locus (17.93) than similar studies for Spanish cultivars (16.06, Ferreira dos Santos et al. [13]; 12.13, Miranda et al. [14]; 16.00, Urrestarazu et al. [28]). Although genetic variability parameters are difficult to compare between studies because of differences in the number of accessions, loci analyzed and the detection method used, we can conclude that our expected and observed heterozygosity values are similar to those shown in other Spanish germplasm collections. CITA pear collection showed an expected heterozygosity (He) of 0.82, similar to other studies such as in local pear cultivars from Northwestern (0.80, Ferreira dos Santos et al. [13]) and Northern Spain (0.83, Miranda et al. [14]); from Italy (0.82, Baccichet et al. [60]) and other Pyrus species (0.79, Bassil et al. [25]). Expected heterozygosity was slightly higher in the set of local material (0.82) than in the reference material (0.79), with a significant difference in their allele count (total and rare alleles) which supported the previously mentioned singularity of local material. Although the local material set had a bigger sample size, it also displayed more unique alleles (those only present in one accession) than the reference set, 37 vs. 25, respectively, as the allele richness difference between them. In addition, the overall mean value of PD (discrimination power) of 0.93 (ranging from 0.97 to 0.65) indicated that the loci are polymorphic enough in discriminating individuals. Negative Fis values (outbreeding) were found to the set of local material (−0.027) and reference (−0.008) which confirmed a heterozygotes excess, consisting of a large number of loci. The majority of cultivated pears are diploid (2n = 2X = 34) but a few cultivars of P. communis L. are polyploids and it was also found in the CITA collection. An amount of 32.9% of accessions were triploids in the overall set of pear accession, considering triploids only accessions that displayed three alleles at least in two loci. This high value could indicate the selection by farmers because of the interest in extra-large fruit and leaves, although, generally, they are not useful for breeding because of meiotic disturbance and little good pollen [7]. The accessions’ origin and ploidy identification methods make the ploidy level vary greatly among collections [13,31,60,61]. Using flow cytometry, Puskas et al. [61] identified 24.2% triploids among 124 German and Romanian accessions, 7.0% triploids were reported in a Swedish collection [30] and 27.1% in a collection of 118 unique pear accessions from Italy [60], whereas 36% were identified in a pear collection from Northwestern Spain with three alleles for at least one locus [13].

4.2. Singularities of Genetic Relations among Local and Reference Material at CITA Germplasm Bank

Forty-two accessions were duplicated since the SSR profiles were identical throughout the 14 loci. Between the synonyms identified in the reference set, the pear cultivars ‘Tendral de Valencia’ and ‘Tendral de Aragon’, and ‘Malacara’ and ‘Magallon’ shared the same SSR profiles, although these cultivars expressed some slightly different phenotypic traits (data not published). Therefore, although the identification of synonymous accessions is important in order to avoid redundancy in the collections, reducing their management costs and being able to distribute true-to-type cultivars to the nurseries, it must be taken into account the morphological characterization of these accessions. In fact, the occurrence of punctual mutations produced through grafting in fruit trees, genomic structural variations or even epigenetic modifications can generate phenotypic differences not distinguishable through SSR markers [35,62,63]. Finally, slight differences (just one allele at the CH02b10, EMPc117 and GD147 loci) were found between ‘Williams’ and ‘Max Red Barlett’, which is expected since ‘Max Red Barlett’ is a chimeric bud mutation of green ‘Williams’ [8].
Based on the UPGMA analysis, four clusters were observed, but no correspondence between the geographical origin of the accessions and their cluster replacement was found, which agrees with the traditional exchanges of plant material through grafting between the three provinces (Huesca, Zaragoza and Teruel) and the Pyrenees region with France [35]. Mostly, the different clusters could be interpreted by the economic importance of the accessions studied. Cluster A and B contained old cultivars that remain important in Spain at a regional level such as ‘Castell’, ‘Magallon’, ’Flor de Invierno’ and ‘Roma’ with mostly local accessions (79%). Cluster C contained cultivars that account for >80% of pear production in Spain such as ‘Abbe Fetel’, ‘Conference’, ‘Williams’, ‘Doyenne du Comice’ and most of the currently cultivated varieties derived from them in recent breeding programs [14,15]. Local cultivars located in cluster C might indicate introgressants of foreign cultivars in this area. Cluster D contains also local cultivars related to the local cultivar ‘Donguindo’, which was described as a widely spread cultivar in Spain by Herrero and Iturrioz [20] and ‘Bella Early’.

4.3. Genetic Structure and Differentiation

Bayesian inference has become a powerful tool to assess the genetic structure in tree species such as pear [13,28,29] and apple [35,50,63]. In this study, the use of SSRs in a structure analysis allowed the definition of three-populations (K = 3), defining most ancient local cultivars on one side with all the reference cultivars cultivated in Spain (G3.1), mostly Southern pear cultivars in G3.2 and a third group of currently cultivated pears in the world and derived from them in the recent pear breeding programs (G3.3). Three groups were also identified in a collection of 141 ancient local Spanish pear cultivars [14]. A second level of partitioning was suggested for K = 4. A similar genetic structure was found in a collection of local and cultivated pears from Italy [28] and local pear cultivars from Northwestern Spain, including Asian cultivars [26] and local varieties and wild related species collected from Mount Etna [36]. Fst values indicated a high differentiation among subpopulations (0.106 for K = 3 and 0.132 for K = 4), higher than those reported in the literature [14,28,29,32], indicating that the material from mountain regions from Aragon is a genetic pool worthy of safeguarding and conservation. Our values were more similar to those found between two subpopulations (0.096) by Bennici et al. [37].
Another significant result of our study was the development of different Phyton codes that can save several hours of work and contribute to the automation of an analysis workflow during this type of studies. The automation of science is the increasingly demanding creation of software that connects all steps of an investigation and reduces both workload and spent time. Moreover, open-source code and platforms such as GitHub promote international and interdisciplinary collaboration between groups that can contribute to software development in a public science-friendly space. In addition, the use of a harmonized set of microsatellite DNA markers will allow future comparisons with other germplasm collections at a national and international level, promoting coordinated actions for the efficient conservation of pear genetic resources.
All novel pear cultivars must respond to the demands of growers and consumers. In general, the main objectives of pear breeding programs are to improve cultivar traits (fruit quality, etc.) and to drive sustainable eco-production systems reducing the need for chemical treatments [8]. These factors have stimulated the exploration of the old germplasm of pear collected throughout the world which could contribute to the development of disease and pest-resistant pear cultivars [29,32,37,61,64]. In this sense, more effort should be invested by researchers to find resistance genes to the main biotic adversities of pear: the fire blight bacterium (Erwinia amylovora), the European pear psylla (Cacopsylla pyri), which is the vector of the phytoplasma causing pear decline, the scab-causing fungi Venturia pyrina and the black spot fungus Stemphylium vesicarium.

5. Conclusions

The local pear germplasm of mountainous areas (Pyrenees and Iberian Cordillera) is valued since it is adapted to diverse ecosystems, and could represent a wide genetic diversity that can help mitigate the current genetic erosion within agricultural diversity. Likewise, these germplasms might provide resistance and a low sensitivity to the main pests and a good organoleptic quality. Genotypes analyzed in this study showed high levels of genetic diversity, a significant number of rare alleles and a low clonality rate which can be considered as evidence of a singularity and richness existing in local material which can still be found in abandoned plots. Moreover, 66.7% of local material was grouped in specific subgroups containing nearly no foreign cultivars, suggesting a singularity and potential interest of this type of material prospected in mountain areas from Aragon. The high levels of genetic diversity found in this research could constitute a good opportunity to select those cultivars with interesting agronomic traits in order to study them in depth and assess their potential to include them in pear breeding programs.

Supplementary Materials

The following are available online at https://www.mdpi.com/article/10.3390/agronomy11091778/s1, Table S1: information of the pear accessions used in this study: accession name, origin, location, region, genotype (unique or duplicated), coordinate location (latitude (Lat.), longitude (Long.) and altitude (Alt.)); group placement by structure analysis (when K = 3 and K = 4 were considered). Accessions with qI > 0.8 are indicated in bold letters for K = 3 and K = 4, Figure S1: exploration of K value for structure analysis of the 228 unique pear genotypes. Estimates of the rate of change of the slope of the log likelihood curve (ΔK) calculated according to Evanno et al. [54] plotted against K, displaying a robust ΔK maximum at K = 3 and a less pronounced peak found at K = 4.

Author Contributions

Conceptualization, P.E. and A.P.; methodology, F.J.B. and P.I.; formal analysis, F.J.B. and P.I.; investigation, P.E. and A.P.; data curation, F.J.B., P.I. and A.P.; writing—original draft preparation, F.J.B. and P.I.; writing—review and editing, F.J.B., P.I., P.E. and A.P.; supervision, P.I. and A.P.; project administration, resources, and funding acquisition, P.E. and A.P. All authors have read and agreed to the published version of the manuscript.

Funding

This research was funded by Instituto Nacional de Investigación y Tecnología Agraria y Alimentaria (INIA), grant numbers RTA2015-00052-C02-02 and RFP2015-00015-00-00, and the Gobierno de Aragon-European Social Fund, European Union (Grupo Consolidado A12), and The APC funded by Gobierno de Aragón-European Social Fund, European Union (Grupo Consolidado A12).

Institutional Review Board Statement

Not applicable.

Informed Consent Statement

Not applicable.

Data Availability Statement

The scripts have been deposited at https://github.com/FJBiocode/ShortSequenceRastreator (accessed on 31 July 2021).

Acknowledgments

The authors would like to thank all farmers and local institutions that kindly provided the pear accessions.

Conflicts of Interest

The authors declare no conflict of interest. The funders had no role in the design of the study; in the collection, analyses, or interpretation of data; in the writing of the manuscript, or in the decision to publish the results.

References

  1. Potter, D.; Eriksson, T.; Evans, R.; Oh, S.; Smedmark, J.E.E.; Morgan, D.R.; Kerr, M.; Roberston, K.R.; Arsenault, M.; Dickinson, T.A.; et al. Phylogeny and classification of Rosaceae. Plant Syst. Evol. 2007, 266, 5–43. [Google Scholar] [CrossRef]
  2. Hummer, K.E.; Janick, J. Rosaceae: Taxonomy, Economic Importance, Genomics. In Genetics and Genomics of Rosaceae, Plant Genetics and Genomics: Crops and Models; Gardiner, S.E., Folta, K.M., Eds.; Springer: New York, NY, USA, 2009; pp. 1–17. [Google Scholar]
  3. Silva, G.J.; Souza, T.M.; Barbieri, R.L.; Costa de Oliveira, A. Origin, Domestication, and Dispersing of Pear (Pyrus spp.). Adv. Agric. 2014, 1–8. [Google Scholar]
  4. Yamamoto, T.; Terakami, S. Genomics of pear and other Rosaceae fruit trees. Breed. Sci. 2016, 66, 148–159. [Google Scholar] [CrossRef] [PubMed] [Green Version]
  5. Bell, R.; Quamme, H.; Layne, R.; Skirvin, R. Pear. In Fruit Breeding (Volume I): Tree and Tropical Fruits; Janick, J., Moore, J.N., Eds.; John Wiley and Sons: New York, NY, USA, 1996; Volume I, pp. 441–514. [Google Scholar]
  6. Zohary, D.; Hopf, M.; Weiss, E. Domestication of Plants in the Old World:The Origin and Spread of Domesticated Plants in Southwest Asia, Europe, and the Mediterranean Basin, 4th ed.; Oxford University Press: Oxford, UK, 2012; ISBN 9780199549061. [Google Scholar]
  7. MAPA. Available online: https://www.mapa.gob.es/es/estadistica/temas/estadisticas-agrarias/agricultura/encuestas-plantaciones-arboles-frutales/ (accessed on 10 May 2021).
  8. Dondini, L.; Sansavini, S. European pear. In Fruit Breeding; Badenes, L., Byrne, D.H., Eds.; Springer: Berlin/Heidelberg, Germany, 2012; pp. 369–413. [Google Scholar]
  9. Iglesias, I.; Alegre, S. Peral. In La Fruticultura del Siglo XXI en España; Caja Mar Rural: Almería, Spain, 2014; pp. 57–86. [Google Scholar]
  10. Lasanta-Martínez, T.; Vicente-Serrano, S.M.; Cuadrat-Prats, J.M. Mountain Mediterranean landscape evolution caused by the abandonment of traditional primary activities: A study of the Spanish Central Pyrenees. Appl. Geogr. 2005, 25, 47–56. [Google Scholar] [CrossRef]
  11. Garcia-Ruiz, J. La evolución de la agricultura de montaña y sus efectos sobre la dinámica del paisaje. Rev. Estud. Agrosoc. 1988, 146, 7–37. [Google Scholar]
  12. Arnaez, J.; Lasanta, T.; Errea, M.P.; Ortigosa, L. Land abandonment, landscape evolution, and soil erosion in a spanish mediterranean mountain region: The case of Camero viejo. Land Degrad. Develop. 2001, 22, 537–550. [Google Scholar] [CrossRef]
  13. Ferreira dos Santos, A.R.; Ramos-Cabrer, A.M.; Díaz-Hernández, M.B.; Pereira-Lorenzo, S. Genetic variability and diversification process in local pear cultivars from northwestern Spain using microsatellites. Tree Genet. Genomes 2011, 7, 1041–1056. [Google Scholar] [CrossRef]
  14. Miranda, C.; Urrestarazu, J.; Santesteban, L.G.; Royo, J.B.; Urbina, V. Genetic Diversity and Structure in a Collection of Ancient Spanish Pear Cultivars Assessed by Microsatellite Markers. J. Am. Soc. Hortic. Sci. 2010, 135, 428–437. [Google Scholar] [CrossRef] [Green Version]
  15. Wünsch, A.; Hormaza, J.I. Characterization of variability and genetic similarity of European pear using microsatellite loci developed in apple. Sci. Hortic. 2007, 113, 37–43. [Google Scholar] [CrossRef]
  16. Harlan, J.R. Our vanishing genetic resources. Science 1975, 188, 618–621. [Google Scholar] [CrossRef]
  17. Zeven, A.C. Landraces: A review of definitions and classifications. Euphytica 1998, 104, 127–139. [Google Scholar] [CrossRef]
  18. Alonso Segura, J.M.; Espiau Ramírez, M.T.; Pina Sobrino, A.; Rubio-Cabetas, M.J.; Fernández i Martí, Á. Genetic diversity of the Spanish Pear Germplasm Collection assessed by SSRs. Acta Hortic. 2021, 1303, 37–44. [Google Scholar] [CrossRef]
  19. Herrero, J. Cartografía de Frutales de Hueso y Pepita. Pomona Hispánica. An. Estac. Exp. Aula Dei 1964. [Google Scholar]
  20. Herrero, J.; Iturrioz, M. Variedades de Peral en España. An. Estac. Exp. Aula Dei 1971, 11, 200–266. [Google Scholar]
  21. Schlötterer, C. The evolution of molecular markers-just a matter of fashion? Nat. Rev. Genet. 2004, 5, 63–69. [Google Scholar] [CrossRef]
  22. Katayama, H.; Uematsu, C. Comparative analysis of chloroplast DNA in Pyrus species: Physical map and gene localization. Theor. Appl. Genet. 2003, 106, 303–310. [Google Scholar] [CrossRef]
  23. Teng, Y. Genetic relationships of Pyrus species and cultivars native to East Asia revealed by Randomly Amplified Polymorphic DNA markers. J. Amer. Soc. Hort. Sci. 2002, 127, 262–270. [Google Scholar] [CrossRef] [Green Version]
  24. Bao, L.; Chen, K.; Zhang, D.; Cao, Y.; Yamamoto, T.; Teng, Y. Genetic diversity and similarity of pear (Pyrus L.) cultivars native to East Asia revealed by SSR (simple sequence repeat) markers. Genet. Resour. Crop Evol. 2007, 54, 959. [Google Scholar] [CrossRef]
  25. Bassil, N.; Postman, J.D. Identification of European and Asian pears using EST-SSRs from Pyrus. Genet. Resour. Crop Evol. 2010, 57, 357–370. [Google Scholar] [CrossRef]
  26. Wu, J.; Li, L.-T.; Li, M.; Khan, M.A.; Li, X.-G.; Chen, H.; Yin, H.; Zhang, S.-L. High-density genetic linkage map construction and identification of fruit-related QTLs in pear using SNP and SSR markers. J. Exp. Bot. 2014, 65, 5771–5781. [Google Scholar] [CrossRef]
  27. Evans, K.; Fernández-Fernández, F.; Govan, K. Harmonising fingerprinting protocols to allow camparisons between germplasm collections—Pyrus. Acta Hortic 2009, 814, 103–106. [Google Scholar] [CrossRef]
  28. Urrestarazu, J.; Royo, J.B.; Santesteban, L.G.; Miranda, C. Evaluating the Influence of the Microsatellite Marker Set on the Genetic Structure Inferred in Pyrus communis L. PLoS ONE 2015, 10, e0138417. [Google Scholar] [CrossRef] [Green Version]
  29. Ferradini, N.; Lancioni, H.; Torricelli, R.; Russi, L.; Dalla Ragione, I.; Cardinali, I.; Marconi, G.; Gramaccia, M.; Concezzi, L.; Achilli, A.; et al. Characterization and Phylogenetic Analysis of Ancient Italian Landraces of Pear. Front. Plant Sci. 2017, 8, 751. [Google Scholar] [CrossRef] [Green Version]
  30. Kocsisné, G.M.; Bolla, D.; Anhalt-Brüderl, U.C.M.; Forneck, A.; Taller, J.; Kocsis, L. Genetic diversity and similarity of pear (Pyrus communis L.) cultivars in Central Europe revealed by SSR markers. Genet. Resour. Crop Evol. 2020, 67, 1755–1763. [Google Scholar] [CrossRef]
  31. Sehic, J.; Garkava-Gustavsson, L.; Fernández-Fernández, F.; Nybom, H. Genetic diversity in a collection of European pear (Pyrus communis) cultivars determined with SSR markers chosen by ECPGR. Sci. Hortic. 2012, 145, 39–45. [Google Scholar] [CrossRef]
  32. Gasi, F.; Kurtovic, M.; Kalamujic, B.; Pojskic, N.; Grahic, J.; Kaiser, C.; Meland, M. Assessment of European pear (Pyrus communis L.) genetic resources in Bosnia and Herzegovina using microsatellite markers. Sci. Hortic. 2013, 157, 74–83. [Google Scholar] [CrossRef]
  33. Queiroz, Á.; Bagoin Guimarães, J.; Sánchez, C.; Simões, F.; Maia de Sousa, R.; Viegas, W.; Veloso, M.M. Genetic Diversity and Structure of the Portuguese Pear (Pyrus communis L.) Germplasm. Sustaninability 2019, 11, 5340. [Google Scholar] [CrossRef] [Green Version]
  34. Queiroz, A.; Assunção, A.; Ramadas, I.; Viegas, W.; Veloso, M.M. Molecular characterization of Portuguese pear landraces (Pyrus communis L.) using SSR markers. Sci. Hortic. 2015, 183, 72–76. [Google Scholar] [CrossRef]
  35. Pina, A.; Urrestarazu, J.; Errea, P. Analysis of the genetic diversity of local apple cultivars from mountainous areas from Aragon (Northeastern Spain). Sci. Hortic. 2014, 174, 1–9. [Google Scholar] [CrossRef]
  36. Urrestarazu, J.; Errea, P.; Miranda, C.; Santesteban, L.G.; Pina, A. Genetic diversity of Spanish Prunus domestica L. germplasm reveals a complex genetic structure underlying. PLoS ONE 2018, 13, 1–20. [Google Scholar] [CrossRef] [PubMed] [Green Version]
  37. Bennici, S.; Las Casas, G.; Distefano, G.; Di Guardo, M.; Continella, A.; Ferlito, F.; Gentile, A.; Malfa, S. La Elucidating the contribution of wild related species on autochthonous pear germplasm: A case study from Mount Etna. PLoS ONE 2018, 13, e0198512. [Google Scholar] [CrossRef] [PubMed] [Green Version]
  38. Hormaza, J.I. Molecular characterization and similarity relationships among apricot (Prunus armeniaca L.) genotypes using simple sequence repeats. Theor. Appl. Genet. 2002, 104, 321–328. [Google Scholar] [CrossRef] [PubMed]
  39. Fernández-Fernández, F.; Harvey, N.G.; James, C.M. Isolation and characterization of polymorphic microsatellite markers from European pear (Pyrus communis L.). Mol. Ecol. Notes 2006, 6, 1039–1041. [Google Scholar] [CrossRef]
  40. Garkava-Gustavsson, L.; Kolodinska Brantestam, A.; Sehic, J.; Nybom, H. Molecular characterisation of indigenous Swedish apple cultivars based on SSR and S-allele analysis. Hereditas 2008, 145, 99–112. [Google Scholar] [CrossRef] [PubMed]
  41. Liebhard, R.; Gianfranceschi, L.; Koller, B.; Ryder, C.D.; Tarchini, R.; Van De Weg, E.; Gessler, C. Development and characterisation of 140 new microsatellites in apple (Malus x domestica Borkh.). Mol. Breed. 2002, 10, 217–241. [Google Scholar] [CrossRef]
  42. Hokanson, S.C.; Szewc-McFadden, A.K.; Lamboy, W.F.; McFerson, J.R. Microsatellite (SSR) markers reveal genetic identities, genetic diversity and relationships in a Malus×domestica borkh. core subset collection. Theor. Appl. Genet. 1998, 97, 671–683. [Google Scholar] [CrossRef]
  43. Gianfranceschi, L.; Seglias, N.; Tarchini, R.; Komjanc, M.; Gessler, C. Simple sequence repeats for the genetic analysis of apple. Theor. Appl. Genet. 1998, 96, 1069–1076. [Google Scholar] [CrossRef]
  44. Vinatzer, B.A.; Patocchi, A.; Tartarini, S.; Gianfranceschi, L.; Sansavini, S.; Gessler, C. Isolation of two microsatellite markers from BAC clones of the Vf scab resistance region and molecular characterization of scab-resistant accessions in Malus germplasm*. Plant Breed. 2004, 123, 321–326. [Google Scholar] [CrossRef]
  45. Hardy, O.J.; Vekemans, X. spagedi: A versatile computer program to analyse spatial genetic structure at the individual or population levels. Mol. Ecol. Notes 2002, 2, 618–620. [Google Scholar] [CrossRef] [Green Version]
  46. Morgante, M.; Vogel, J. Compound microsatellite primers for the detection of genetic polymorphisms. U.S. Patent Application 08/326456, 1994. [Google Scholar]
  47. Tessier, C.; David, J.; This, P.; Boursiquot, J.M.; Charrier, A. Optimization of the choice of molecular markers for varietal identification in Vitis vinifera L. Theor. Appl. Genet. 1999, 98, 171–177. [Google Scholar] [CrossRef]
  48. R Core Team. R: A Language and Enviroment for Statistical Computing; R Foundation for Statistical Computing: Vienna, Austria; Available online: https://www.R-project.org (accessed on 10 May 2021).
  49. Pritchard, J.K.; Stephens, M.; Donnelly, P. Inference of population structure using multilocus genotype data. Genetics 2000, 155, 945–959. [Google Scholar] [CrossRef] [PubMed]
  50. Urrestarazu, J.; Miranda, C.; Santesteban, L.G.; Royo, J.B. Genetic diversity and structure of local apple cultivars from Northeastern Spain assessed by microsatellite markers. Tree Genet. Genomes 2012, 8, 1163–1180. [Google Scholar] [CrossRef]
  51. Jacobs, M.M.; Smulders, M.J.; van den Berg, R.G.; Vosman, B. What’s in a name; Genetic structure in Solanum section Petota studied using population-genetic tools. BMC Evol. Biol. 2011, 11, 42. [Google Scholar] [CrossRef] [PubMed] [Green Version]
  52. Jing, R.; Vershinin, A.; Grzebyta, J.; Shaw, P.; Smýkal, P.; Marshall, D.; Ambrose, M.J.; Ellis, T.N.; Flavell, A.J. The genetic diversity and evolution of field pea (Pisum) studied by high throughput retrotransposon based insertion polymorphism (RBIP) marker analysis. BMC Evol. Biol. 2010, 10, 44. [Google Scholar] [CrossRef] [Green Version]
  53. Earl, D.A.; von Holdt, B.M. Structure Harvester: A website and program for visualizing STRUCTURE output and implementing the Evanno method. Conserv. Genet. Resour. 2012, 4, 359–361. [Google Scholar] [CrossRef]
  54. Evanno, G.; Regnaut, S.; Goudet, J. Detecting the number of clusters of individuals using the software structure: A simulation study. Mol. Ecol. 2005, 14, 2611–2620. [Google Scholar] [CrossRef] [Green Version]
  55. Breton, C.; Pinatel, C.; Médail, F.; Bonhomme, F.; Bervillé, A. Comparison between classical and Bayesian methods to investigate the history of olive cultivars using SSR-polymorphisms. Plant Sci. 2008, 175, 524–532. [Google Scholar] [CrossRef]
  56. Meirmans, P.G.; Van Tienderen, P.H. genotype and genodive: Two programs for the analysis of genetic diversity of asexual organisms. Mol. Ecol. Notes 2004, 4, 792–794. [Google Scholar] [CrossRef]
  57. Perrier, X.; Jacquemoud-Collet, J.P. DARwin Software. 2006. Available online: http://darwin.cirad.fr/ (accessed on 10 May 2021).
  58. Pierantoni, L.; Cho, K.-H.; Shin, I.-S.; Chiodini, R.; Tartarini, S.; Dondini, L.; Kang, S.-J.; Sansavini, S. Characterisation and transferability of apple SSRs to two European pear F1 populations. Theor. Appl. Genet. 2004, 109, 1519–1524. [Google Scholar] [CrossRef]
  59. Brooks, R.; Olmo, H. The Brooks and Olmo Register of Fruit & Nut Varieties, 3rd ed.; American Society for Horticultural Science: Alexandria, VA, USA, 1997. [Google Scholar]
  60. Baccichet, I.; Foria, S.; Messina, R.; Peccol, E.; Losa, A.; Fabro, M.; Gori, G.; Zandigiacomo, P.; Cipriani, G.; Testolin, R. Genetic and ploidy diversity of pear (Pyrus spp.) germplasm of Friuli Venezia Giulia, Italy. Genet. Resour. Crop Evol. 2020, 67, 83–96. [Google Scholar] [CrossRef]
  61. Puskás, M.; Höfer, M.; Sestraş, R.E.; Peil, A.; Sestraş, A.F.; Hanke, M.V.; Flachowsky, H. Molecular and flow cytometric evaluation of pear (Pyrus L.) genetic resources of the German and Romanian national fruit collections. Genet. Resour. Crop Evol. 2016, 63, 1023–1033. [Google Scholar] [CrossRef]
  62. Venturi, S.; Dondini, L.; Donini, P.; Sansavini, S. Retrotransposon characterisation and fingerprinting of apple clones by S-SAP markers. Theor. Appl. Genet. 2006, 112, 440–444. [Google Scholar] [CrossRef]
  63. Pereira-Lorenzo, S.; Urrestarazu, J.; Ramos-Cabrer, A.M.; Miranda, C.; Pina, A.; Dapena, E.; Moreno, M.A.; Errea, P.; Llamero, N.; Díaz-Hernández, M.B.; et al. Analysis of the genetic diversity and structure of the Spanish apple genetic resources suggests the existence of an Iberian genepool. Ann. Appl. Biol. 2017, 171, 424–440. [Google Scholar] [CrossRef]
  64. Tatari, M.; Ghasemi, A.; Mousavi, A. Diversity of Local and Wild Pear Germplasm in Central Regions of Iran. Int. J. Fruit Sci. 2020, 20, 432–447. [Google Scholar] [CrossRef]
Figure 1. Geographic location of the pear local accessions. Localities prospected are indicated with a green pear fruit.
Agronomy 11 01778 g001
Figure 2. (1) UPGMA dendrogram representing genetic relationships among the 228 unique pear genotypes of the CITA collection. The groups are represented by letters (AD). (2) Group probabilities obtained for K = 3 and K = 4 by Bayesian clustering and its sub-groups. Each bar represents the genetic background of an individual according to the proportion derived from each of the 3 or 4 different sub-groups. Color codes for each genetic sub-groups are at K = 3: G3.1 = blue, G3.2 = purple, G3.3 = green; K = 4: G4.1 = green, G4.2 = orange, G4.3 = yellow, G4.4 = blue.
Agronomy 11 01778 g002
Figure 3. Principal coordinate analysis (PCoA) based on 14 SSR loci from 228 unique genotypes (156 local accessions and 72 reference cultivars) using DARwin software. Color codes for each genetic sub-group are: G3.1, red; G3.2, green; G3.3, blue. Axes 1 and 2 represent 8.55% and 7.30% of the variation, respectively.
Agronomy 11 01778 g003
Table 1. SSRs used for pear accessions characterization. Master mix reaction (MM), locus, fluorochrome, linkage group, amplified fragment size range, concentration, primer sequence (F: Forward/R: reverse) and references.
MMLocusDyeLGAllelic RangeμM Primer Sequence (5′-3′)Reference
ACH01d08PET15242–3050.2FCTC CGC CGC TAT AAC ACT TC[41]
RTAC TCT GGA GGG TAT GTC AAA G
ACH01d09PET12120–1760.2FGCC ATC TGA ACA GAA TGT GC[41]
RCCC TTC ATT CAC ATT TCC AG
ACH03g07VIC3204–2880.4FAAT AAG CAT TCA AAG CAA TCC G[41]
RTTT TTC CAA ATC GAG TTT CGT T
ACH05c06FAM1682–1180.2FATT GGA ACT CTC CGT ATT GTG C[41]
RATC AAC AGT AGT GGT AGC CGG T
AGD142FAM9126–1840.2FGGCACCCAAGCCCCTAA[42]
RGGAACCTACGACAGCAAAGTTACA
BCH02b10PET2120–1620.6FCAA GGA AAT CAT CAA AGA TTC AAG[43]
RCAA GTG GCT TCG GAT AGT TG
BCH02c11PET10203–2490.2FTGA AGG CAA TCA CTC TGT GC[41]
RTTC CGA GAA TCC TCT TCG AC
BCH03d12NED691–1580.2FGCC CAG AAG CAA TAA GTA AAC C[41]
RATT GCT CCA TGC ATA AAG GG
BCH-Vf1VIC1129–1720.2FATCACCACCAGCAGCAAAG[44]
RCATACAAATCAAAGCACAACCC
CGD147PET13121–1670.2FTCCCGCCATTTCTCTGC[42]
RAAACCGCTGCTGCTGAAC
CCH01f07NED10175–2110.2FCCC TAC ACA GTT TCT CAA CCC[41]
RCGT TTT TGG AGC GTA GGA AC
CEMPc11VIC11135–1570.2FGCGAT TA A AGATCA ATA A ACCCATA[39]
RAAGCAGCTGGT TGGTGA A AT
CEMPc117FAM788–1400.2FGT TCTATCTACCAAGCCACGCT[39]
RCGT T TGTGTGTTTTACGTGT TG
CCH04e03FAM5175–2070.2FTTG AAG ATG TTT GGC TGT GC[41]
RTGC ATG TCT GTC TCC TCC AT
Table 2. Measures of genetic diversity at three different levels: overall set, set of reference material and set of local material. (NA) Number of alleles, (Ae) number of effective alleles, rare alleles, (He) expected and (Ho) observed heterozygosity, (PD) discriminant power and values of Wright’s fixation index (Fis).
Overall Set (Ind = 228)Set of Local Material (Ind = 156)Set of Reference Material (Ind = 72)
LOCUSNAAeRare AllelesHeHoPDFisNAAeRare AllelesHeHoPDFisNAAeRare AllelesHeHoPDFis
CH03d12156.1490.840.830.95−0.026146.4380.840.840.95−0.022104.650.780.810.89−0.035
CH-Vf1157.2180.860.870.96−0.048157.2370.860.890.96−0.05595.8430.830.830.94−0.029
Ch01d08177.02100.860.880.96−0.045166.4280.840.870.95−0.043127.3760.860.90.94−0.050
GD142237.99170.870.90.97−0.045237.85170.870.930.96−0.072187.18120.860.850.960.015
CH03g07256.99190.860.830.96−0.010228.01160.880.870.97−0.011154.4490.770.760.92−0.005
CH01f07189.7690.90.860.970.0171810.6390.910.860.970.032157.1880.860.870.94−0.019
CH05c06165.35100.810.810.93−0.016155.53100.820.880.92−0.079114.6860.790.670.910.147
CH02b10177.72100.870.850.970.007177.690.870.830.960.031136.4770.850.880.94−0.045
CH04e03111.8390.450.440.650.001101.6770.40.370.590.06382.1650.540.580.72−0.097
EMPc117226.04160.830.790.95−0.002227.44160.870.880.96−0.041153.66120.730.610.890.133
CH01d092512.38160.920.910.98−0.0082310.81150.910.90.970.0031910.33120.90.930.97−0.033
GD147163.99120.750.740.91−0.014164.43120.770.760.920.000133.0690.670.690.87−0.048
CH02c11197.42120.870.880.96−0.030177.2110.860.890.94−0.041136.9460.860.850.95−0.007
EMPc11125.7460.830.860.95−0.082116.4360.840.910.95−0.092113.6950.730.740.88−0.052
Mean17.936.8311.640.820.820.93−0.02217.076.9810.790.820.830.93−0.027135.547.50.790.780.91−0.008
Table 3. Identification of synonyms in the CITA pear collection using 14 SSR markers. REF: reference cultivars.
GroupVarieties
1Aso de Sobremonte 4–Novales 11
2Albarracin 9–San Martin–Daroca 6
3Susin 2–Biescas 5
4Andorra 2–Andorra 4
5Cornudella de Valiera 1–Cornudella de Valiera 3
6Tarazona y el Moncayo 2–Tarazona y el Moncayo 3
7Troncedo 1–Troncedo 3
8Daroca 3–Daroca 5
9Nocito 2–Albarracin 8
10Caldearenas–Santa Eulalia 2–Novales 12
11Novales 1–Novales 2
12Tendral Aragon (REF)–Tendral Valencia (REF)
13Ainsa 3–Sarsa de Surta 1
14Roma (REF)–Santa Eulalia 3–Isarre–Novales 7–Novales 8
15Bezas 1–Bezas 2
16El Grado 101–El Grado 04–Andorra 5
17Tarazona y el Moncayo 4–Coscojuela 2
18Malacara (REF)–Magallon (REF)
Table 4. Genetic diversity measures for each of the genetic groups defined with STRUCTURE at K = 3 and K = 4. Number of genotypes (n), number of reference cultivars (nR), accessions percentage with a robust assignation to the group, number of alleles (NA), number alleles per locus (NA/locus). He: expected heterozygosity; Ho: observed heterozygosity.
Genetic Groupn (qI > 0.80 a)nR (qI > 0.80 a)% qI > 0.8NANA/LocusHeHo
K = 3
G3.186 (62)13 (10)72.09%1369.710.810.77
G3.275 (53)12 (6)70.67%1269.000.780.90
G3.367 (51)47 (43)76.11%1238.790.740.78
K = 4
G4.165 (54)48 (44)83.07%14610.420.740.78
G4.264 (42)9 (6)65.62%1389.850.750.89
G4.313 (13)2 (2)100%564.000.620.95
G4.486 (65)13 (11)75.58%22616.140.810.77
a Number of genotypes strongly assigned to the group (qI > 0.80).
Publisher’s Note: MDPI stays neutral with regard to jurisdictional claims in published maps and institutional affiliations.

