
Hybrid Bermudagrass and Tall Fescue Turfgrass Irrigation in Central California: II. Assessment of NDVI, CWSI, and Canopy Temperature Dynamics


Abstract
:1. Introduction
2. Materials and Methods
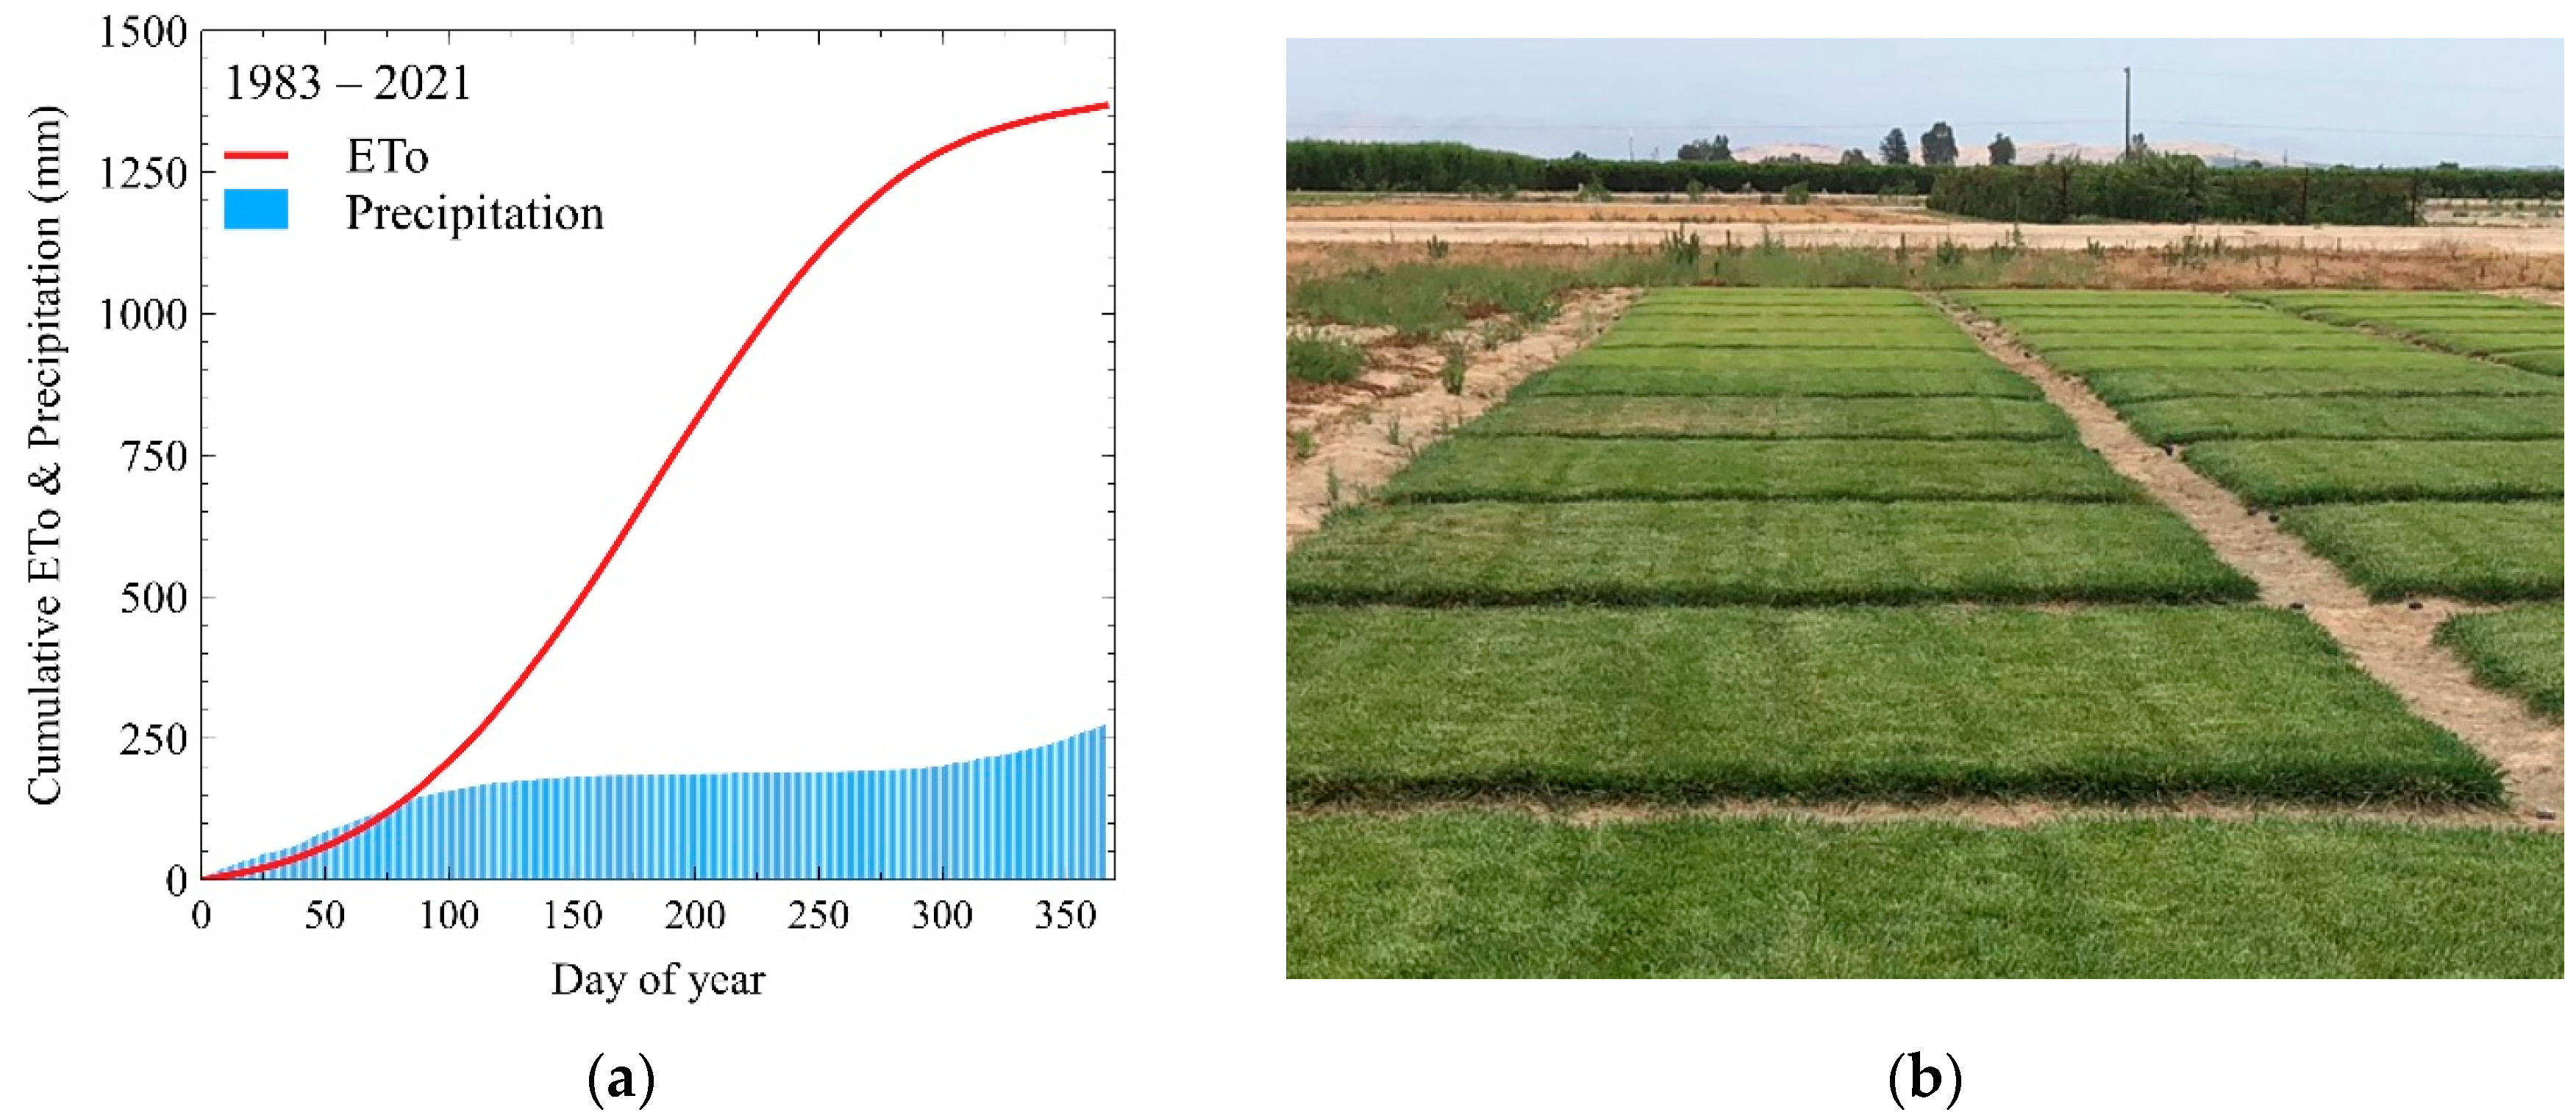
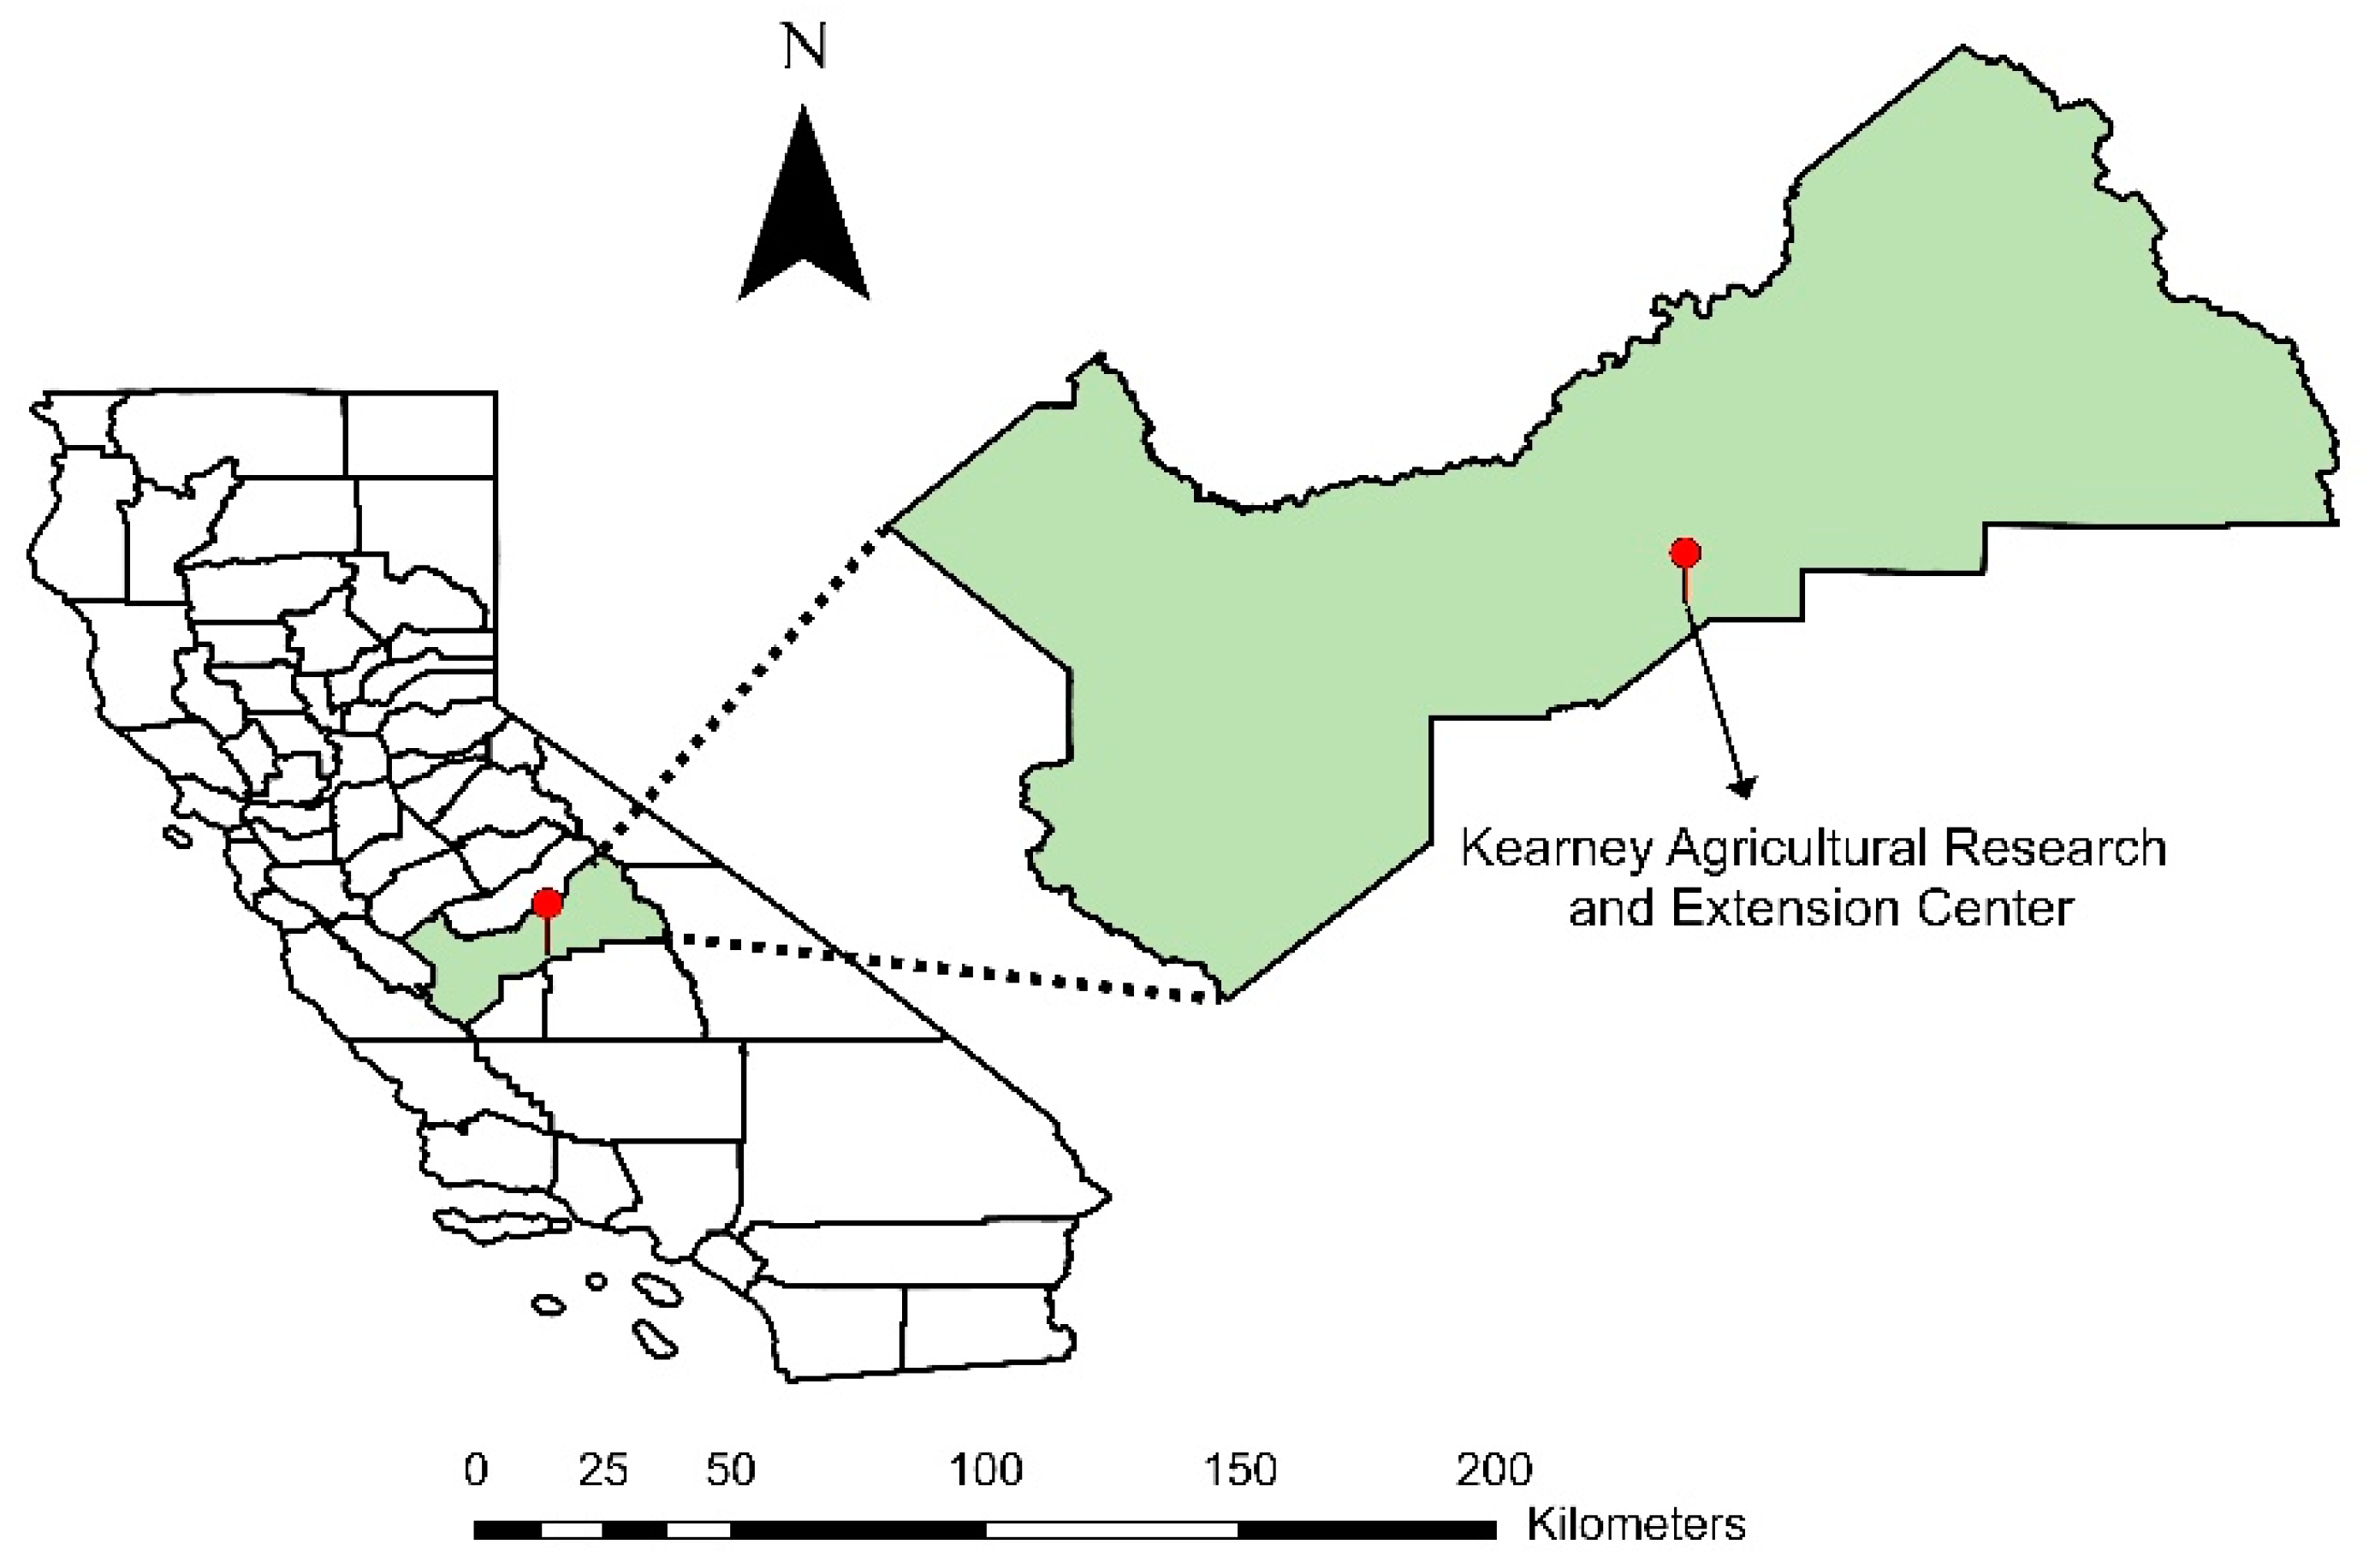
2.1. Experimental Site
2.2. Irrigation Trials
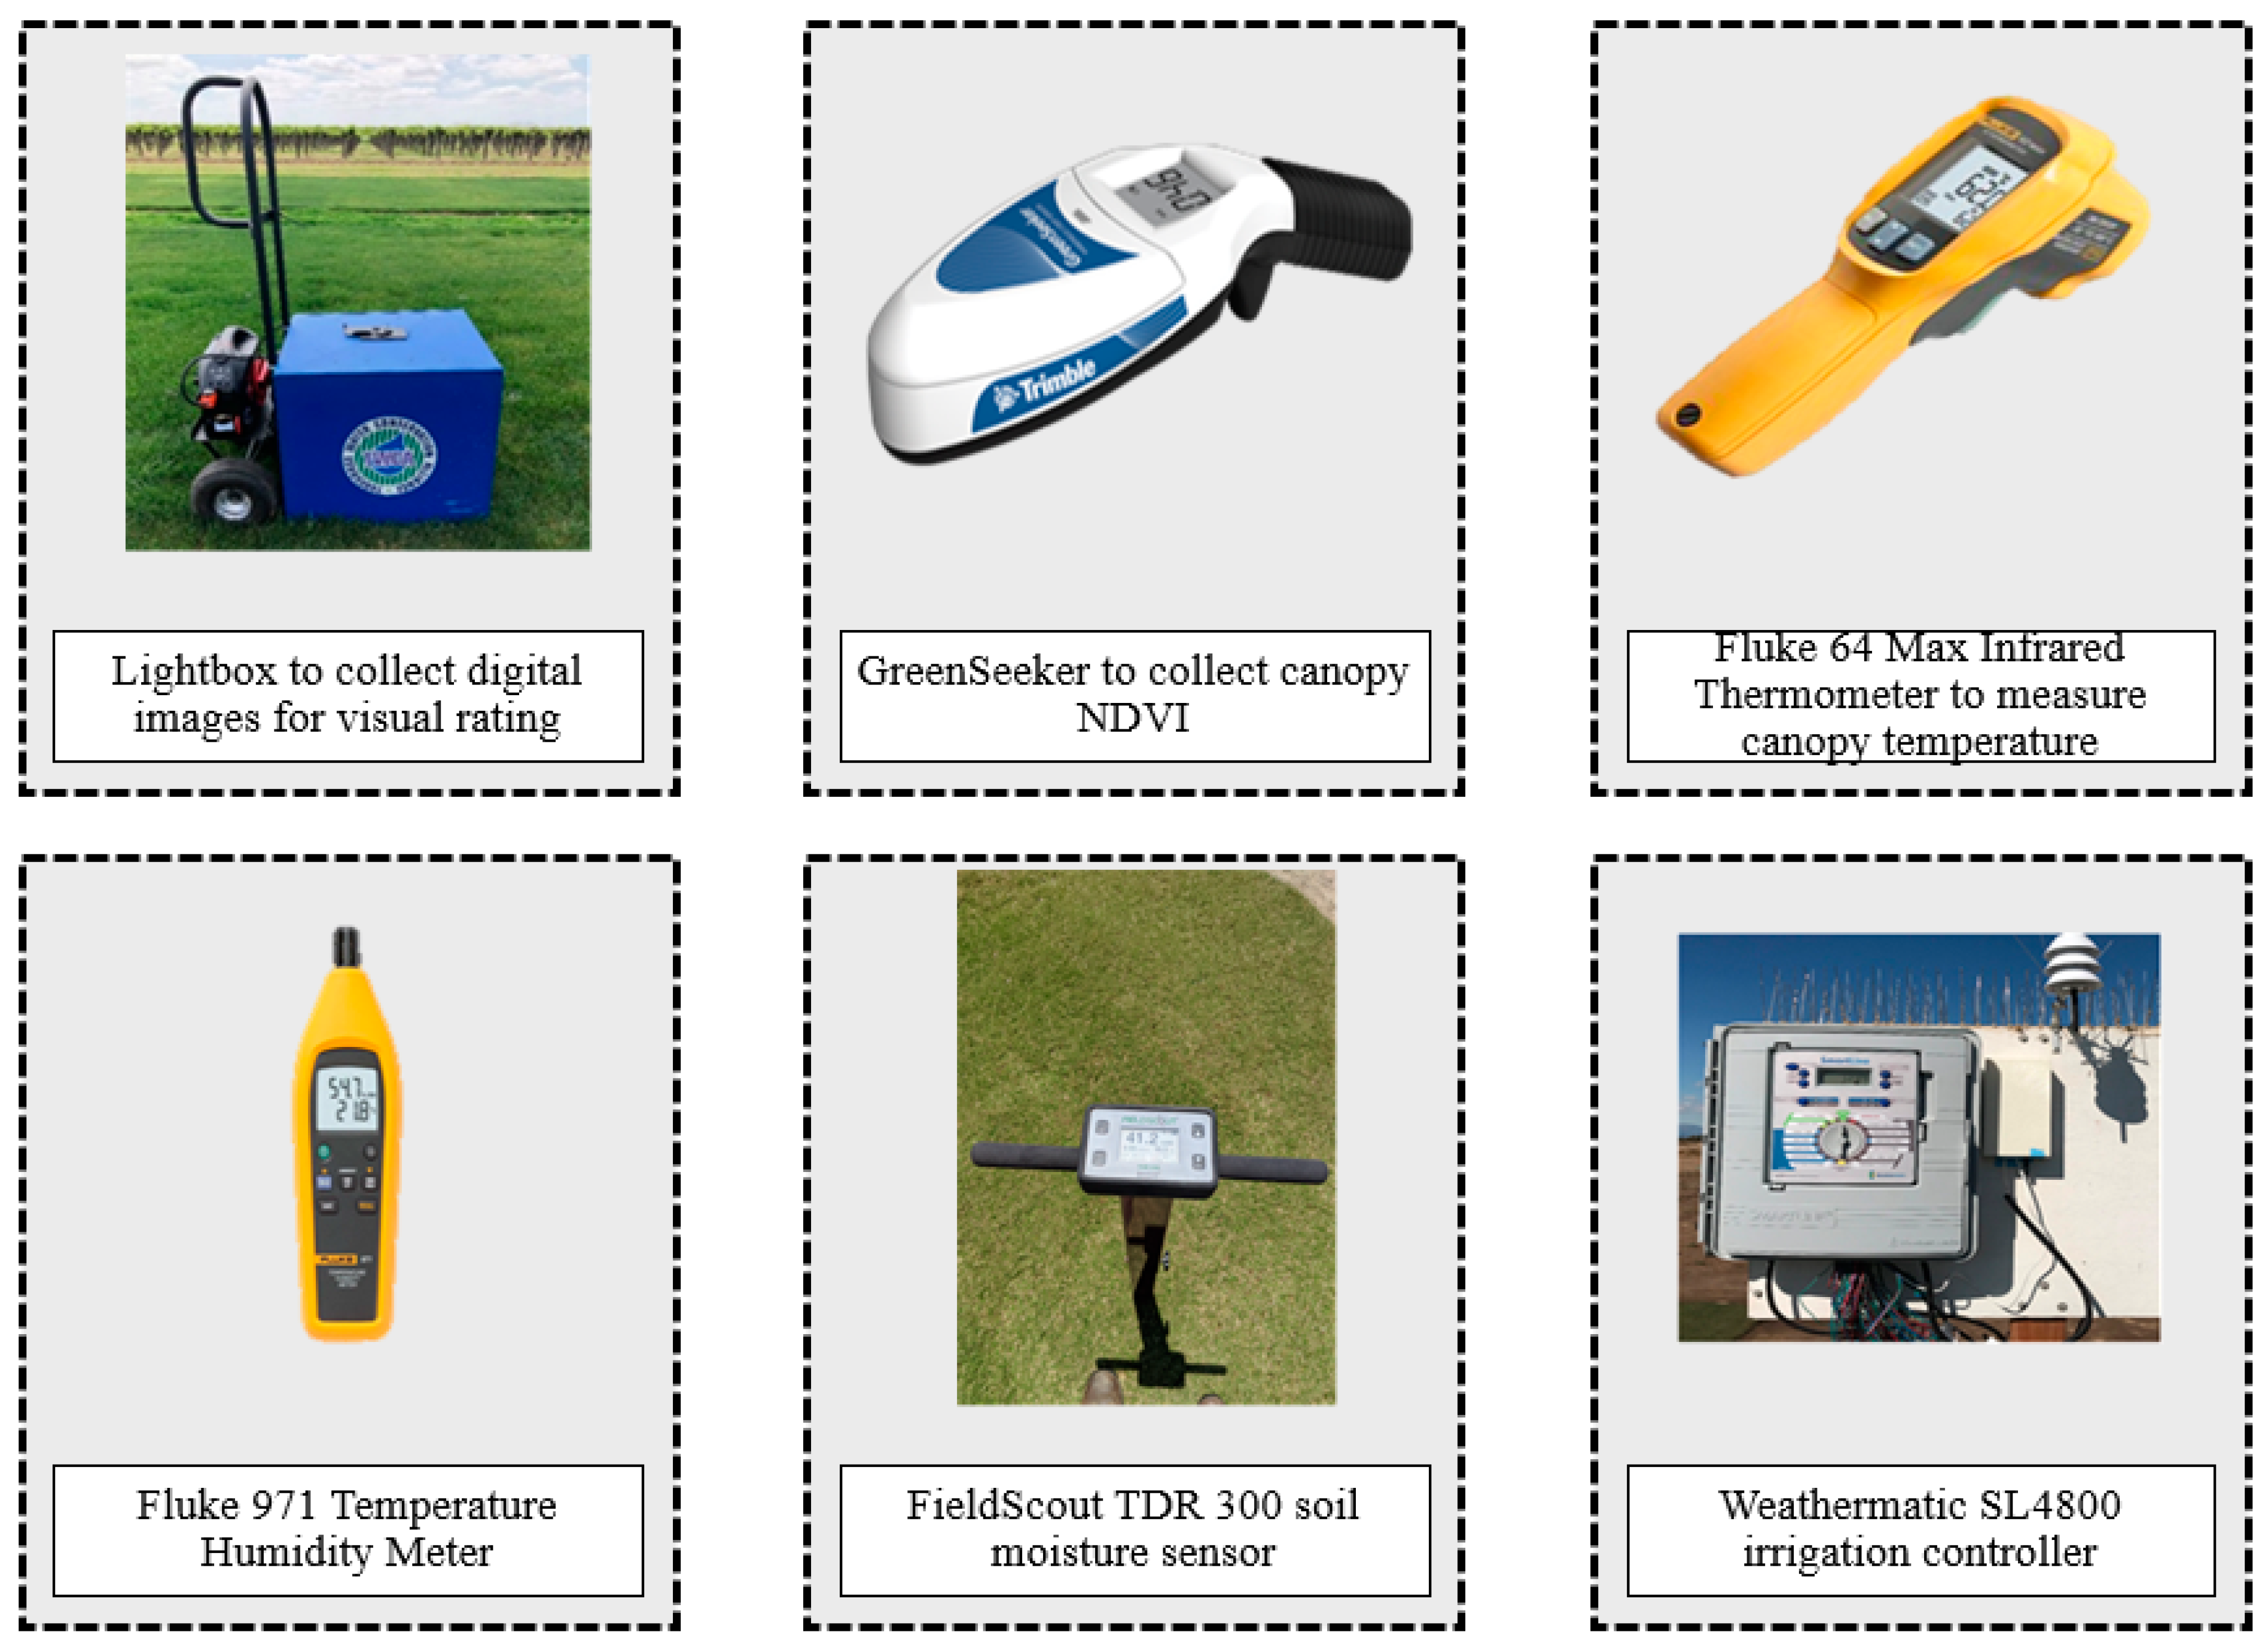
2.3. Data Collection and Statistical Analysis
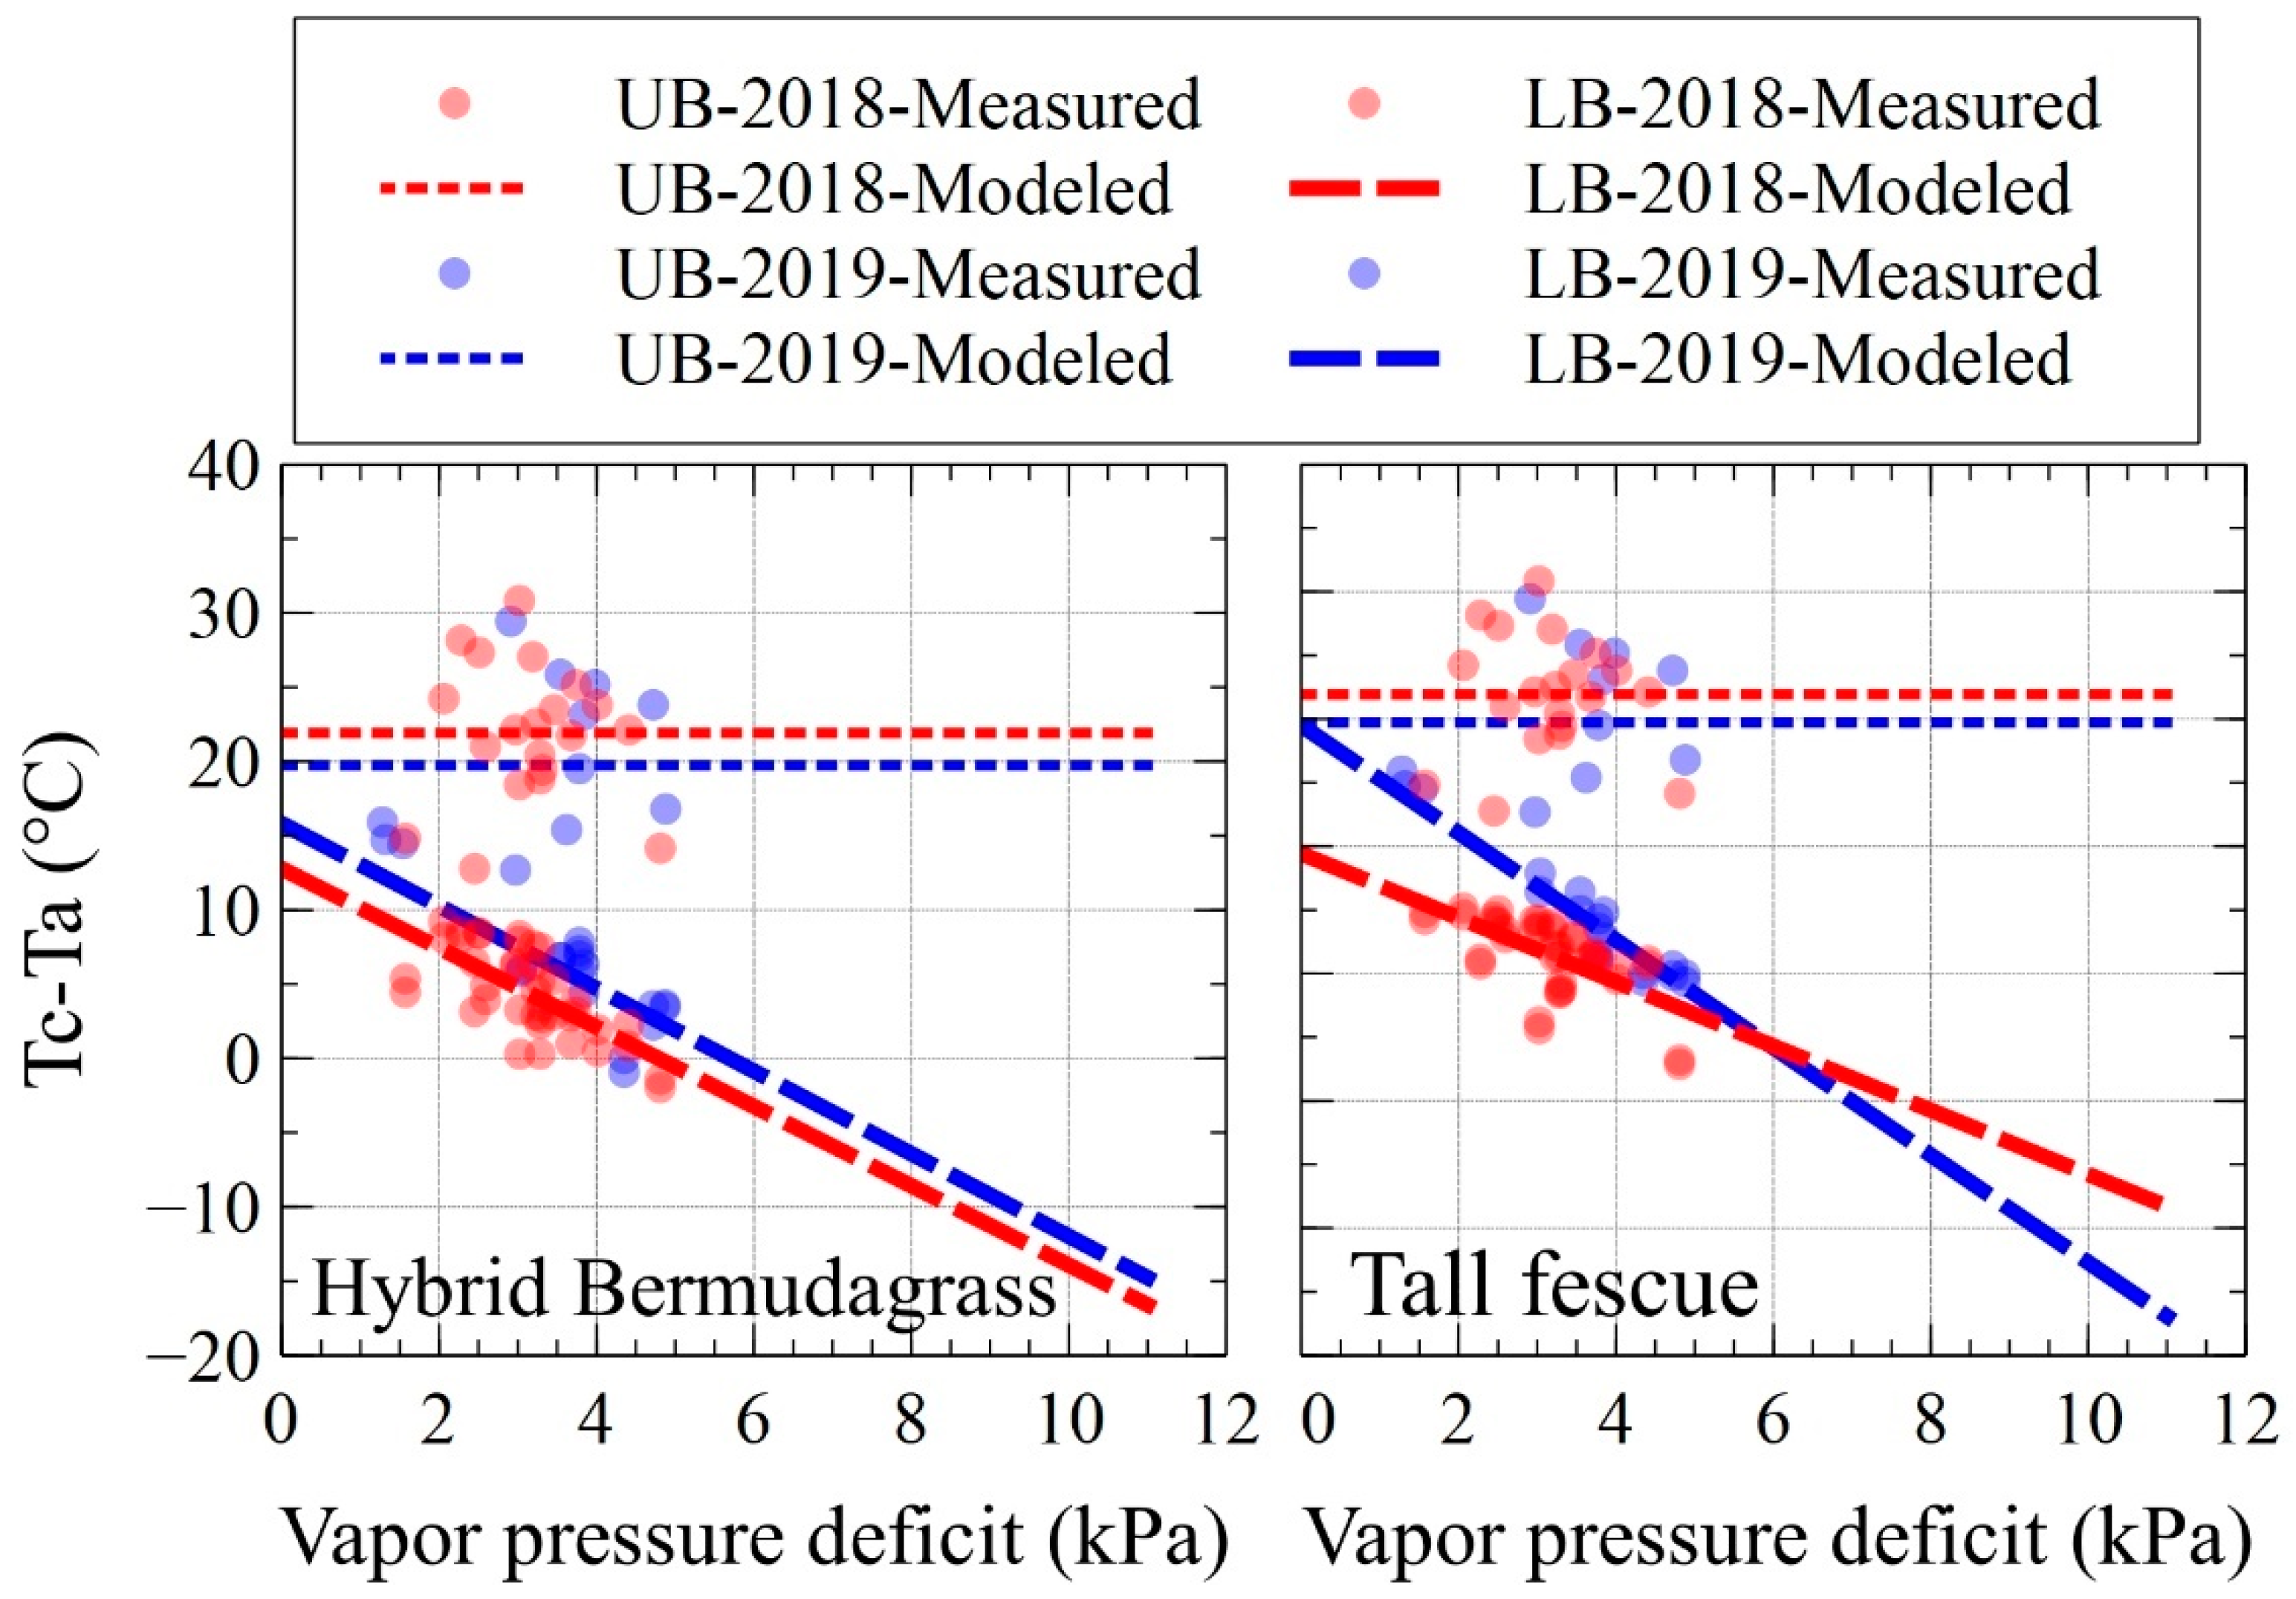
2.4. Crop Water Stress Index (CWSI)
3. Results
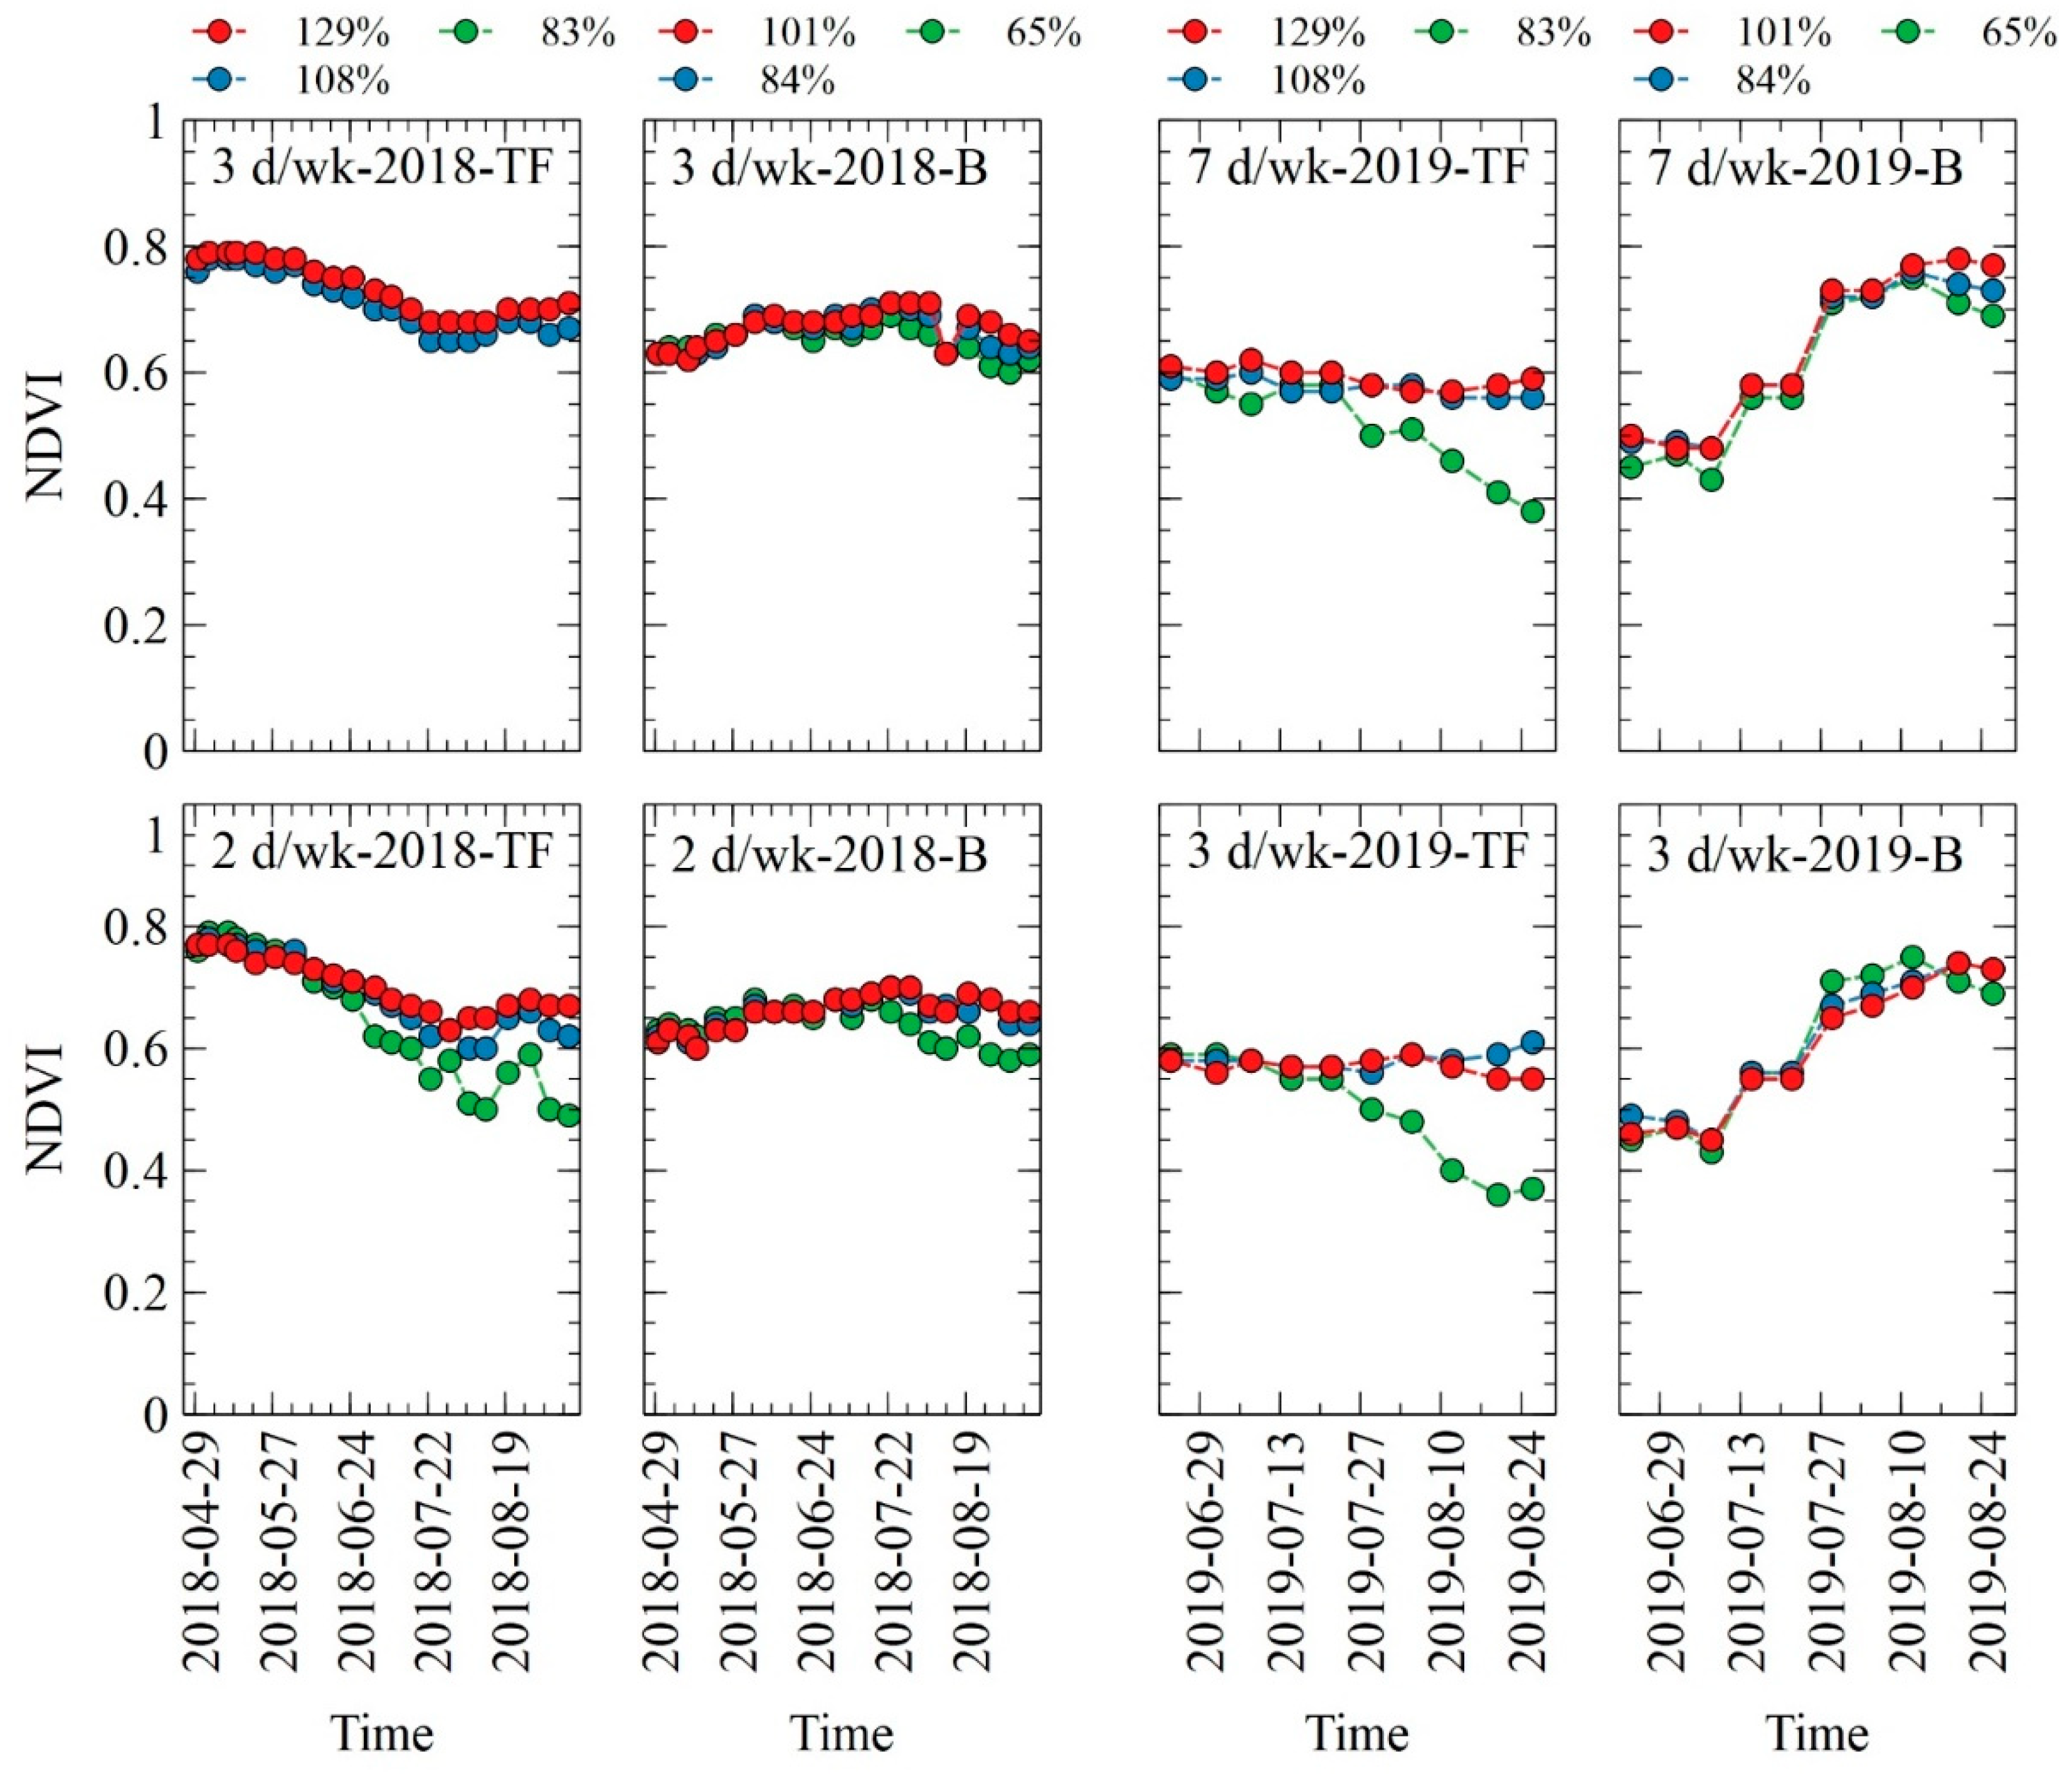
3.1. NDVI
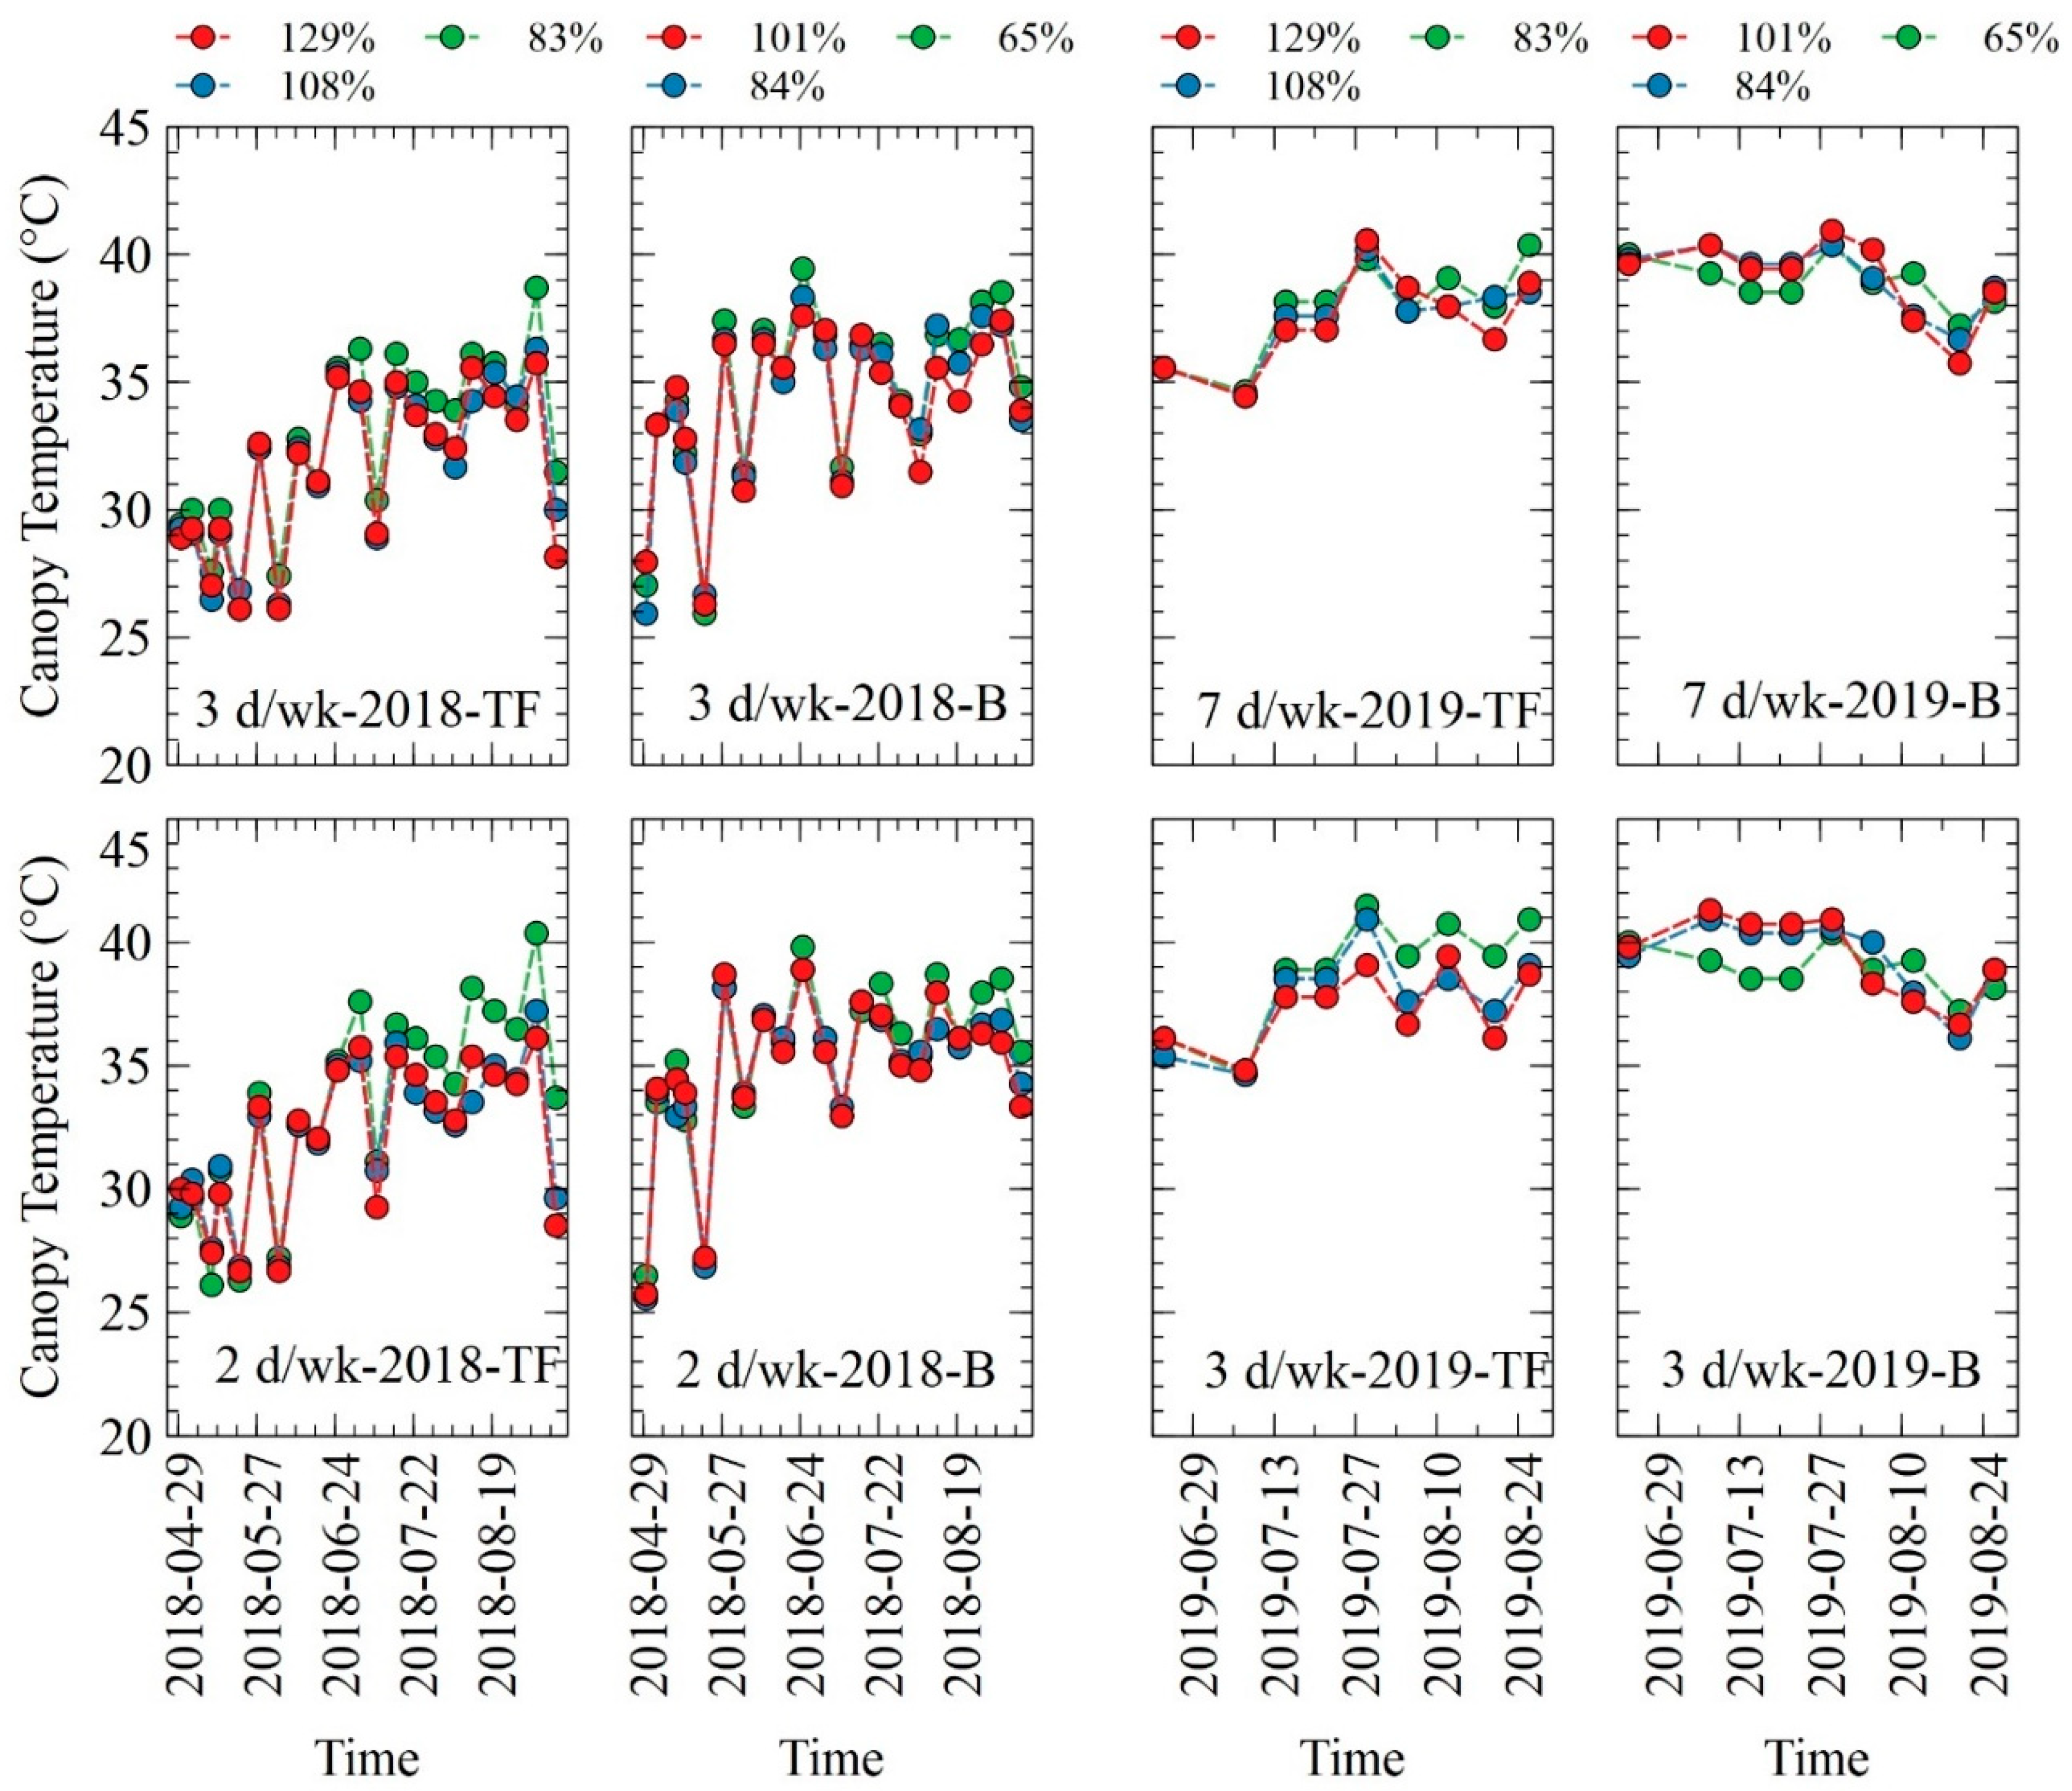
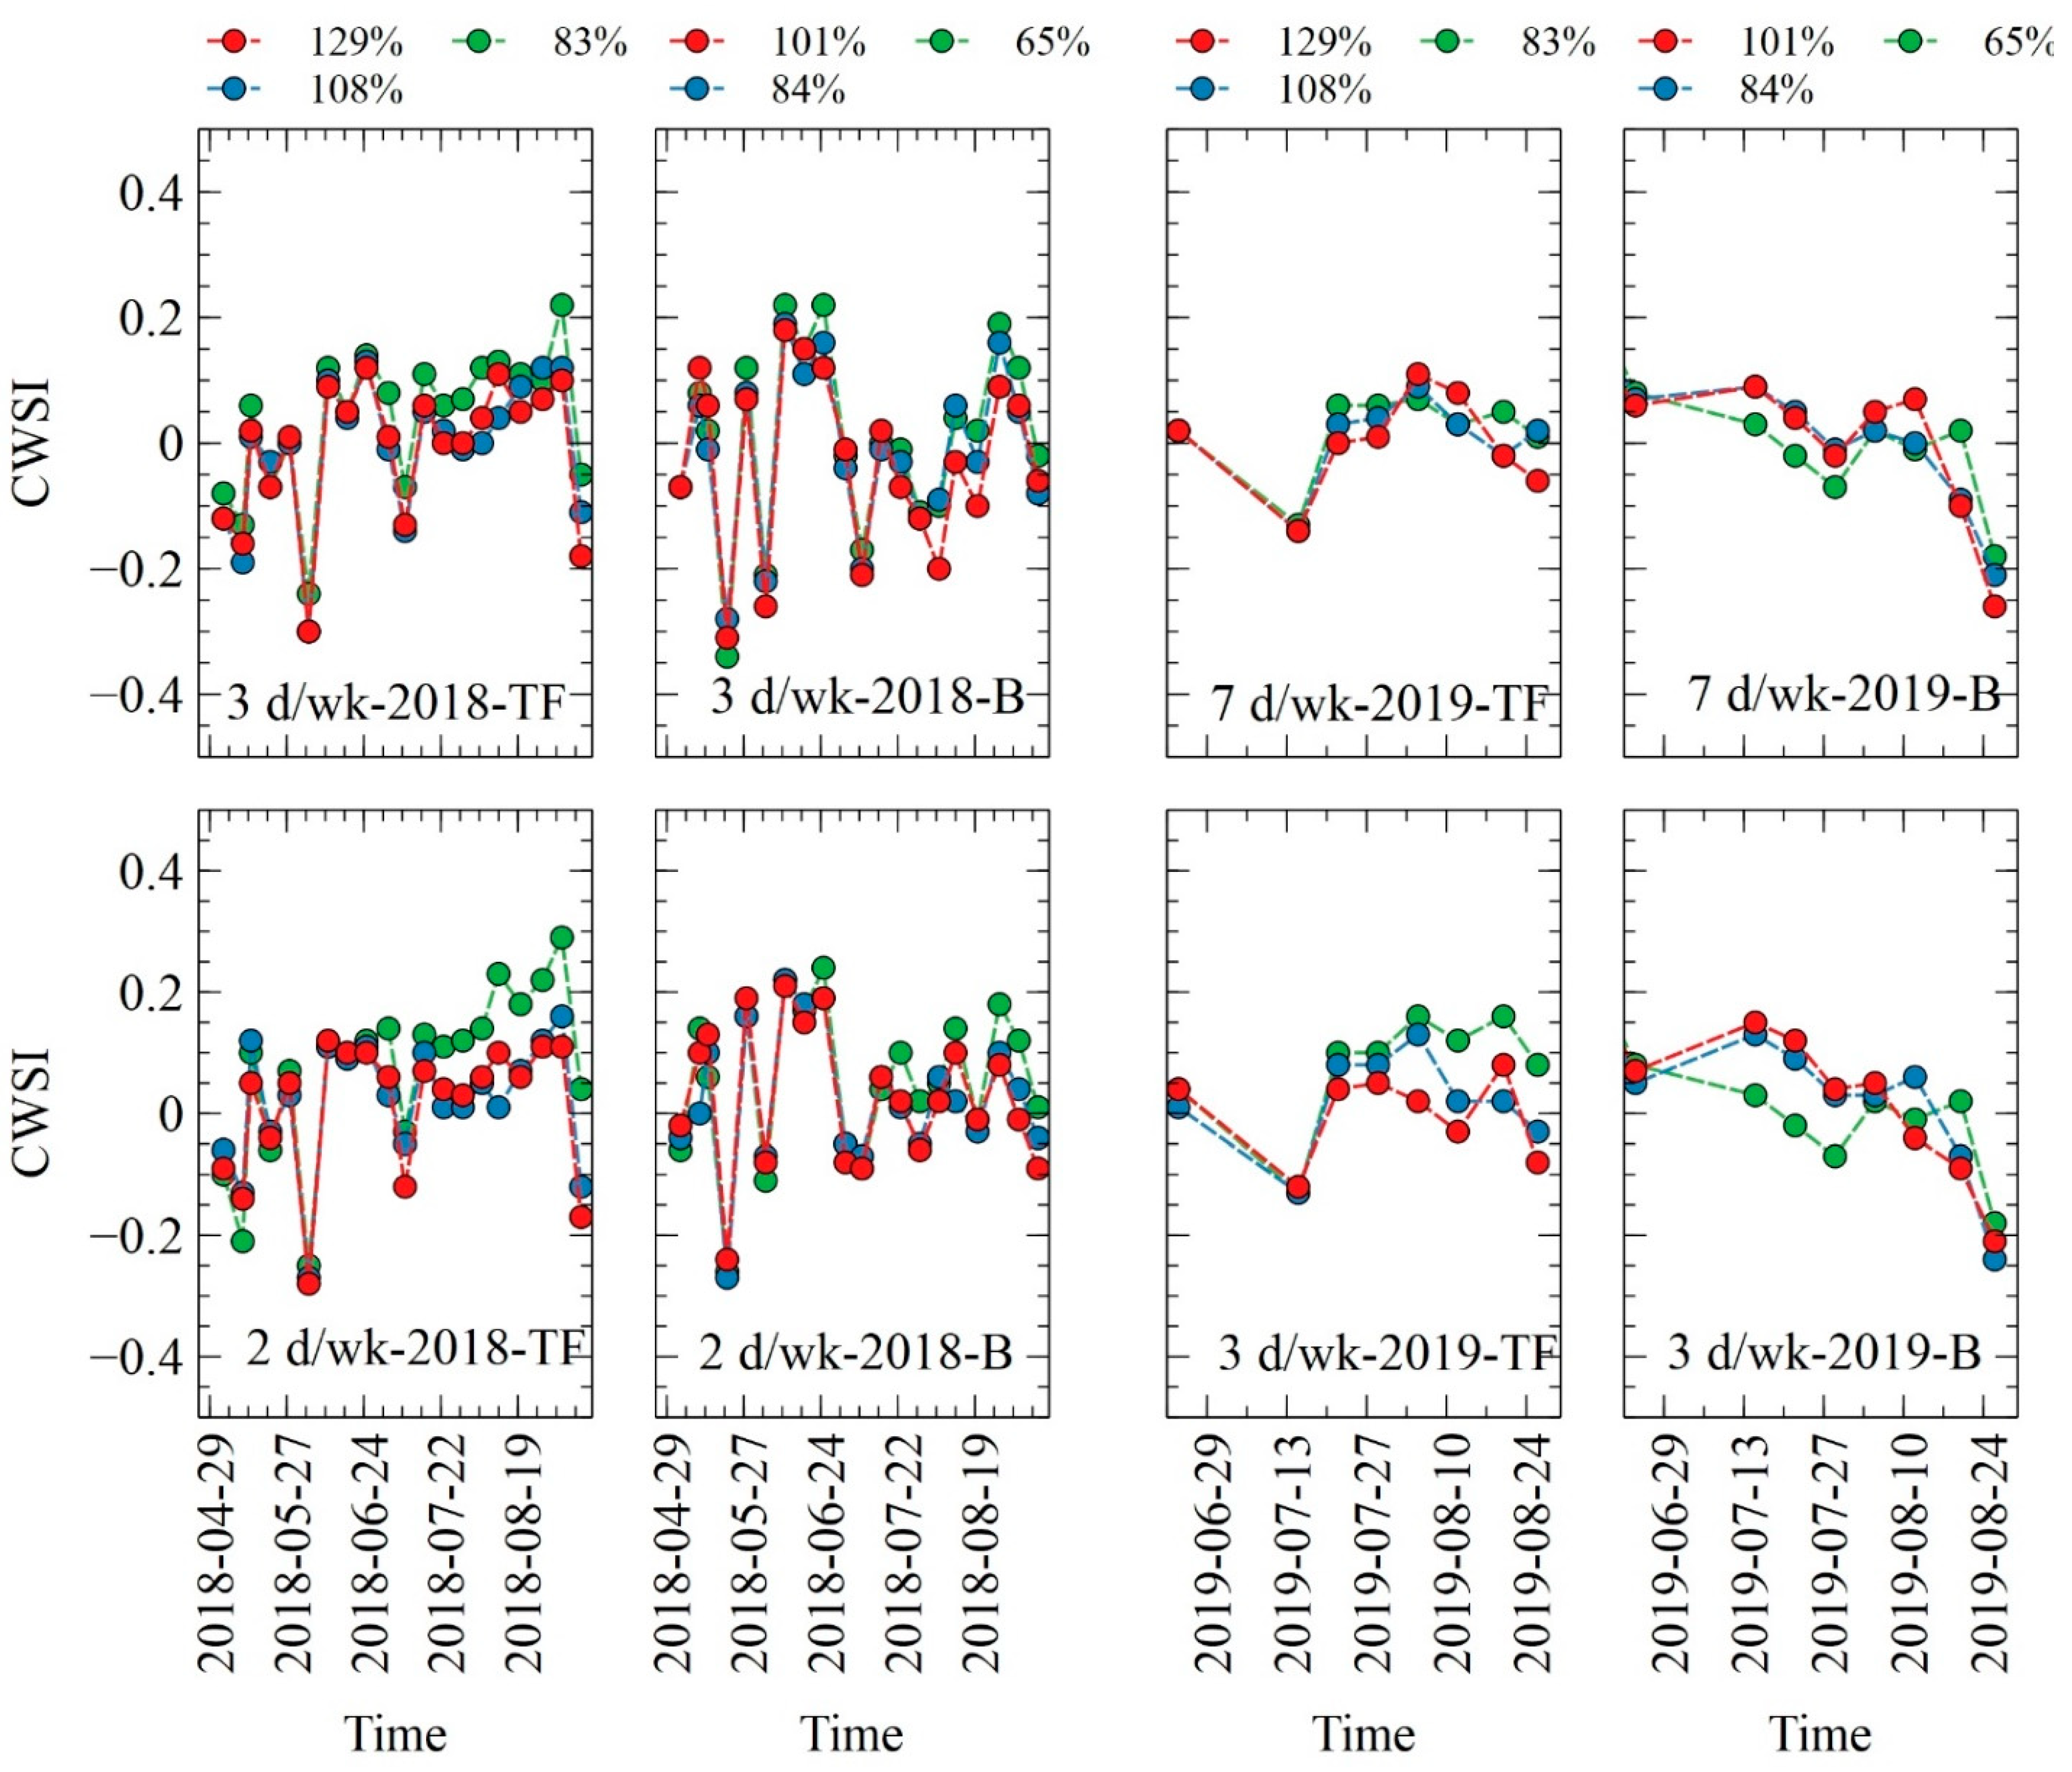
3.2. Canopy Temperature and CWSI
4. Discussion
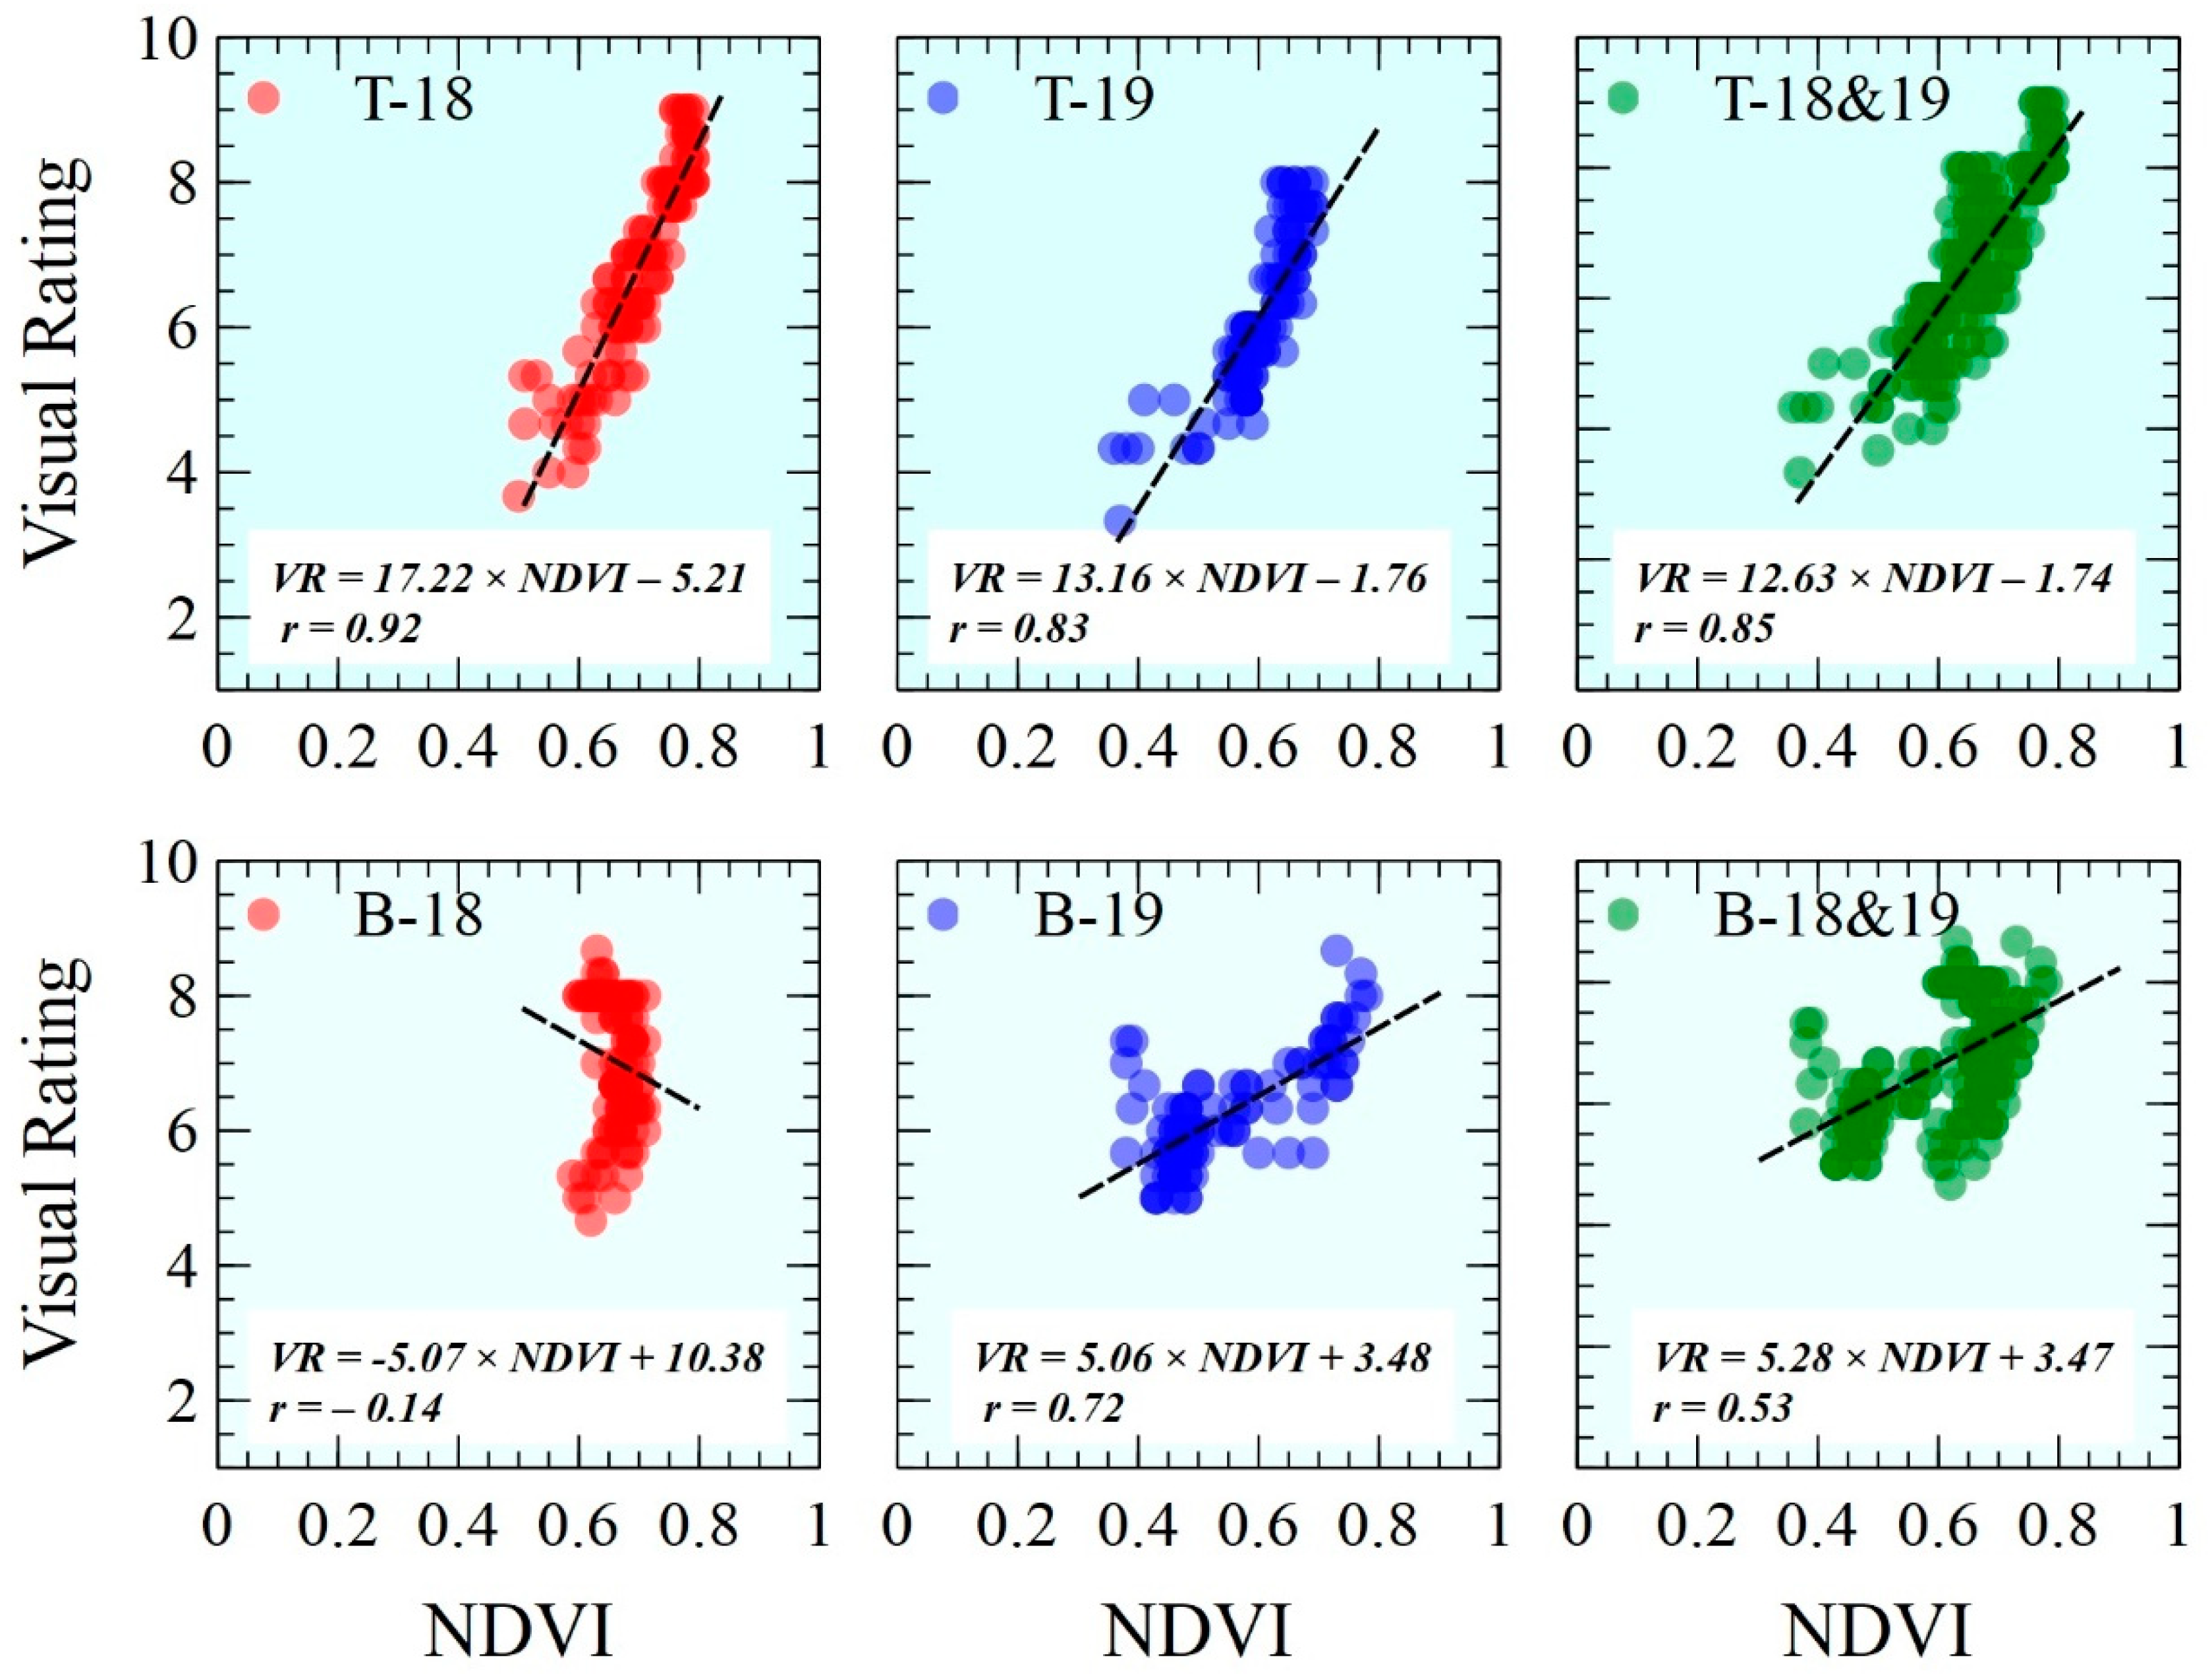
4.1. NDVI and Visual Rating
4.2. Canopy Temperature and CWSI
5. Conclusions
Author Contributions
Funding
Data Availability Statement
Conflicts of Interest
References
- Cooley, H.; Gleick, P.H. Urban Water-Use Efficiencies: Lessons from United States Cities; Island Press: Washington, DC, USA, 2009. [Google Scholar]
- Monteiro, J.A. Ecosystem services from turfgrass landscapes. Urban For. Urban Green. 2017, 26, 151–157. [Google Scholar] [CrossRef]
- Blonquist, J., Jr.; Jones, S.B.; Robinson, D. Precise irrigation scheduling for turfgrass using a subsurface electromagnetic soil moisture sensor. Agric. Water Manag. 2006, 84, 153–165. [Google Scholar] [CrossRef]
- Cardenas-Lailhacar, B.; Dukes, M.D.; Miller, G.L. Sensor-based automation of irrigation on bermudagrass, during wet weather conditions. J. Irrig. Drain. Eng. 2008, 134, 120–128. [Google Scholar] [CrossRef]
- Davis, S.L.; Dukes, M.D. Importance of ET controller program settings on water conservation potential. Appl. Eng. Agric. 2016, 32, 251–262. [Google Scholar]
- Grabow, G.L.; Ghali, I.E.; Huffman, R.L.; Miller, G.L.; Bowman, D.; Vasanth, A. Water application efficiency and adequacy of ET-based and soil moisture–based irrigation controllers for turfgrass irrigation. J. Irrig. Drain. Eng. 2013, 139, 113–123. [Google Scholar] [CrossRef]
- Qualls, R.J.; Scott, J.M.; DeOreo, W.B. Soil moisture sensors for urban landscape irrigation: Effectiveness and reliability. JAWRA J. Am. Water Resour. Assoc. 2001, 37, 547–559. [Google Scholar] [CrossRef]
- Haghverdi, A.; Singh, A.; Sapkota, A.; Reiter, M.; Ghodsi, S. Developing irrigation water conservation strategies for hybrid bermudagrass using an evapotranspiration-based smart irrigation controller in inland southern California. Agric. Water Manag. 2021, 245, 106586. [Google Scholar] [CrossRef]
- Cardenas, B.; Dukes, M.D. Soil moisture sensor irrigation controllers and reclaimed water; Part. I: Field-plot study. Appl. Eng. Agric. 2016, 32, 217–224. [Google Scholar]
- Cardenas, B.; Dukes, M.D. Soil moisture sensor irrigation controllers and reclaimed water; Part. II: Residential evaluation. Appl. Eng. Agric. 2016, 32, 225–234. [Google Scholar]
- Chen, W.; Lu, S.; Pan, N.; Wang, Y.; Wu, L. Impact of reclaimed water irrigation on soil health in urban green areas. Chemosphere 2015, 119, 654–661. [Google Scholar] [CrossRef] [PubMed]
- An, N.; Goldsby, A.L.; Price, K.P.; Bremer, D.J. Using hyperspectral radiometry to predict the green leaf area index of turfgrass. Int. J. Remote Sens. 2015, 36, 1470–1483. [Google Scholar] [CrossRef]
- Johnson, T.D.; Belitz, K. A remote sensing approach for estimating the location and rate of urban irrigation in semi-arid climates. J. Hydrol. 2012, 414, 86–98. [Google Scholar] [CrossRef]
- Taghvaeian, S.; Chávez, J.L.; Hattendorf, M.J.; Crookston, M.A. Optical and thermal remote sensing of turfgrass quality, water stress, and water use under different soil and irrigation treatments. Remote Sens. 2013, 5, 2327–2347. [Google Scholar] [CrossRef] [Green Version]
- Emekli, Y.; Bastug, R.; Buyuktas, D.; Emekli, N.Y. Evaluation of a crop water stress index for irrigation scheduling of bermudagrass. Agric. Water Manag. 2007, 90, 205–212. [Google Scholar] [CrossRef]
- Chen, Y.-J.; McFadden, J.P.; Clarke, K.C.; Roberts, D.A. Measuring spatio-temporal trends in residential landscape irrigation extent and rate in Los Angeles, California Using SPOT-5 satellite imagery. Water Resour. Manag. 2015, 29, 5749–5763. [Google Scholar] [CrossRef] [Green Version]
- Irmak, S.; Haman, D.Z.; Bastug, R. Determination of crop water stress index for irrigation timing and yield estimation of corn. Agron. J. 2000, 92, 1221–1227. [Google Scholar] [CrossRef]
- Shashua-Bar, L.; Pearlmutter, D.; Erell, E. The cooling efficiency of urban landscape strategies in a hot dry climate. Landsc. Urban Plan. 2009, 92, 179–186. [Google Scholar] [CrossRef]
- Bonfils, C.; Lobell, D. Empirical evidence for a recent slowdown in irrigation-induced cooling. Proc. Natl. Acad. Sci. USA 2007, 104, 13582–13587. [Google Scholar] [CrossRef] [PubMed] [Green Version]
- Broadbent, A.M.; Coutts, A.M.; Tapper, N.J.; Demuzere, M. The cooling effect of irrigation on urban microclimate during heatwave conditions. Urban Clim. 2017, 23, 309–329. [Google Scholar] [CrossRef]
- Wang, C.; Wang, Z.-H.; Yang, J. Urban water capacity: Irrigation for heat mitigation. Comput. Environ. Urban Syst. 2019, 78, 101397. [Google Scholar] [CrossRef]
- Idso, S.B.; Jackson, R.D.; Pinter, P.J., Jr.; Reginato, R.J.; Hatfield, J.L. Normalizing the stress-degree-day parameter for environmental variability. Agric. Meteorol. 1981, 24, 45–55. [Google Scholar] [CrossRef]
- Haghverdi, A.; Reiter, M.; Sapkota, A.; Singh, A. Hybrid. Bermudagrass and Tall fescue Turfgrass Irrigation in Central California: I. Assessment of Visual Quality, Soil Moisture and Performance of an ET-based Smart Controller. Agronomy 2021, 11, 1666. [Google Scholar] [CrossRef]
- Leinauer, B.; VanLeeuwen, D.M.; Serena, M.; Schiavon, M.; Sevostianova, E. Digital image analysis and spectral reflectance to determine turfgrass quality. Agron. J. 2014, 106, 1787–1794. [Google Scholar] [CrossRef] [Green Version]
- Bell, G.E.; Martin, D.L.; Wiese, S.G.; Dobson, D.D.; Smith, M.W.; Stone, M.L.; Solie, J.B. Vehicle-mounted optical sensing: An. objective means for evaluating turf quality. Crop Sci. 2002, 42, 197–201. [Google Scholar] [CrossRef]
- Horst, G.; Engelke, M.; Meyers, W. Assessment of visual evaluation techniques 1. Agron. J. 1984, 76, 619–622. [Google Scholar] [CrossRef]
- Bremer, D.J.; Lee, H.; Su, K.; Keeley, S.J. Relationships between normalized difference vegetation index and visual quality in cool-season turfgrass: I. Variation among species and cultivars. Crop Sci. 2011, 51, 2212–2218. [Google Scholar] [CrossRef]
- Bremer, D.J.; Lee, H.; Su, K.; Keeley, S.J. Relationships between normalized difference vegetation index and visual quality in cool-season turfgrass: II. Factors affecting NDVI and its component reflectances. Crop Sci. 2011, 51, 2219–2227. [Google Scholar] [CrossRef]
- Haghverdi, A.; Najarchi, M.; Öztürk, H.S.; Durner, W. Studying Unimodal, Bimodal, PDI and Bimodal-PDI Variants of Multiple Soil Water Retention Models: I. Direct Model. Fit. Using the Extended Evaporation and Dewpoint Methods. Water 2020, 12, 900. [Google Scholar] [CrossRef] [Green Version]
- Hargreaves, G.H.; Samani, Z.A. Reference crop evapotranspiration from temperature. Appl. Eng. Agric. 1985, 1, 96–99. [Google Scholar] [CrossRef]
- Sanders, J. Veusz-a Scientific Plotting Package; 2008; Available online: https://veusz.github.io/ (accessed on 28 August 2021).
- Morris, K.N.; Shearman, R.C. NTEP turfgrass evaluation guidelines. In Proceedings of the NTEP Turfgrass Evaluation Workshop, Beltsville, MD, USA, 17 October 1998; pp. 1–5. [Google Scholar]
- Jackson, R.D.; Idso, S.B.; Reginato, R.J.; Pinter, P.J., Jr. Canopy temperature as a crop water stress indicator. Water Resour. Res. 1981, 17, 1133–1138. [Google Scholar] [CrossRef]
- Bell, G.E.; Martin, D.L.; Koh, K.; Han, H.R. Comparison of turfgrass visual quality ratings with ratings determined using a handheld optical sensor. HortTechnology 2009, 19, 309–316. [Google Scholar] [CrossRef] [Green Version]
- Trenholm, L.; Carrow, R.; Duncan, R. Relationship of multispectral radiometry data to qualitative data in turfgrass research. Crop Sci. 1999, 39, 763–769. [Google Scholar] [CrossRef]
- Culpepper, T.; Young, J.; Montague, D.T.; Sullivan, D.; Wherley, B. Physiological responses in C3 and C4 turfgrasses under soil water deficit. HortScience 2019, 54, 2249–2256. [Google Scholar] [CrossRef] [Green Version]
- Jalali-Farahani, H.; Slack, D.C.; Kopec, D.M.; Matthias, A.D. Crop water stress index models for Bermudagrass turf: A comparison. Agron. J. 1993, 85, 1210–1217. [Google Scholar] [CrossRef]
- Payero, J.; Neale, C.; Wright, J. Non-water-stressed baselines for calculating crop water stress index (CWSI) for alfalfa and tall fescue grass. Trans. ASAE 2005, 48, 653–661. [Google Scholar] [CrossRef] [Green Version]
- Al-Faraj, A.; Meyer, G.E.; Horst, G.L. A crop water stress index for tall fescue (Festuca arundinacea Schreb.) irrigation decision-making—A traditional method. Comput. Electron. Agric. 2001, 31, 107–124. [Google Scholar] [CrossRef]


| 2018 Trial, Start: 4 May 2018 | End: 11 September 2018 |
| Target Irrigation Levels (% ETo): Tall Fescue: 50%, 65%, 80% | Hybrid Bermudagrass: 40%, 50%, 60% Irrigation Efficiency: 78% |
| Watering Days: 2 days per week, 3 days per week |
| 2019 Trial, Start: 22 June 2019 | End: 26 August 2019 |
| Target Irrigation Levels (% ETo): Tall Fescue: 50%, 65%, 80% | Hybrid Bermudagrass: 40%, 50%, 60% Irrigation Efficiency: 78% |
| Watering Days: 3 days per week, 7 days per week (no restriction) |
| Tall Fescue | Hybrid Bermudagrass | |||||
|---|---|---|---|---|---|---|
| Irrigation | T1 | T2 | T3 | T1 | T2 | T3 |
| Treatment | 50% | 65% | 80% | 40% | 50% | 60% |
| Programmed | 64% | 83% | 100% | 51% | 64% | 77% |
| Applied | 83% | 108% | 129% | 65% | 84% | 101% |
| Tall Fescue | Hybrid Bermudagrass | ||||||||
|---|---|---|---|---|---|---|---|---|---|
| NDVI | Canopy Temp. | NDVI | Canopy Temp. | ||||||
| Treatment | 2018 | 2019 | 2018 | 2019 | Treatment | 2018 | 2019 | 2018 | 2019 |
| 129% ETo | 0.72a | 0.59a | 31.8b | 37.2b | 101% ETo | 0.66a | 0.62a | 34.5a | 39.4a |
| 108% ETo | 0.70a | 0.58a | 31.9b | 37.4b | 84% ETo | 0.66a | 0.62a | 34.5a | 39.4a |
| 83% ETo | 0.65b | 0.51b | 33.0a | 38.1a | 65% ETo | 0.64a | 0.59a | 35.0a | 39.5a |
| Frequency | Frequency | ||||||||
| 2 d w−1 | 0.68b | 32.5a | 2 d w−1 | 0.65a | 35.0a | ||||
| 3 d w−1 | 0.70a | 0.55a | 31.9b | 37.8a | 3 d w−1 | 0.66a | 0.59b | 34.3b | 39.7a |
| 7 d w−1 | 0.56a | 37.4a | 7 d w−1 | 0.63a | 39.2b | ||||
| Model effect | 2018 | 2019 | 2018 | 2019 | Model effect | 2018 | 2019 | 2018 | 2019 |
| I | *** | ** | ** | * | I | NS | NS | NS | NS |
| F | * | NS | * | NS | F | NS | ** | * | * |
| I × F | NS | NS | NS | NS | I × F | NS | NS | NS | NS |
| T | *** | *** | *** | *** | T | *** | *** | *** | *** |
| I × T | *** | *** | NS | NS | I × T | *** | NS | NS | NS |
| F × T | NS | NS | NS | NS | F × T | NS | NS | *** | NS |
| I × F × T | NS | NS | NS | NS | I × F × T | NS | NS | NS | NS |
| Tall Fescue | Hybrid Bermudagrass | |||||
|---|---|---|---|---|---|---|
| a | b | r | a | b | r | |
| 2018 | −2.52 | 9.42 | 0.64 | −2.67 | 12.78 | 0.69 |
| 2019 | −4.22 | 19.5 | 0.88 | −2.78 | 15.82 | 0.64 |
Publisher’s Note: MDPI stays neutral with regard to jurisdictional claims in published maps and institutional affiliations. |
© 2021 by the authors. Licensee MDPI, Basel, Switzerland. This article is an open access article distributed under the terms and conditions of the Creative Commons Attribution (CC BY) license (https://creativecommons.org/licenses/by/4.0/).
Share and Cite
Haghverdi, A.; Reiter, M.; Singh, A.; Sapkota, A. Hybrid Bermudagrass and Tall Fescue Turfgrass Irrigation in Central California: II. Assessment of NDVI, CWSI, and Canopy Temperature Dynamics. Agronomy 2021, 11, 1733. https://doi.org/10.3390/agronomy11091733
Haghverdi A, Reiter M, Singh A, Sapkota A. Hybrid Bermudagrass and Tall Fescue Turfgrass Irrigation in Central California: II. Assessment of NDVI, CWSI, and Canopy Temperature Dynamics. Agronomy. 2021; 11(9):1733. https://doi.org/10.3390/agronomy11091733
Chicago/Turabian StyleHaghverdi, Amir, Maggie Reiter, Amninder Singh, and Anish Sapkota. 2021. "Hybrid Bermudagrass and Tall Fescue Turfgrass Irrigation in Central California: II. Assessment of NDVI, CWSI, and Canopy Temperature Dynamics" Agronomy 11, no. 9: 1733. https://doi.org/10.3390/agronomy11091733
APA StyleHaghverdi, A., Reiter, M., Singh, A., & Sapkota, A. (2021). Hybrid Bermudagrass and Tall Fescue Turfgrass Irrigation in Central California: II. Assessment of NDVI, CWSI, and Canopy Temperature Dynamics. Agronomy, 11(9), 1733. https://doi.org/10.3390/agronomy11091733