Article

Genetic Diversity in Local and Exotic Avena sativa L. (Oat) Germplasm Using Multivariate Analysis

1
Department of Botany, University of Malakand, Dir Lower 18800, Pakistan
2
Department of Biochemistry, University of Malakand, Dir Lower 18800, Pakistan
3
Pakistan Agriculture Research Council, Islamabad 44000, Pakistan
4
Department of Biological Sciences, National University of Medical Sciences, Rawalpindi 46000, Pakistan
5
Department of Pharmaceutics and Industrial Pharmacy, College of Pharmacy, Taif University, P.O. Box 11099, Taif 21944, Saudi Arabia
6
Department of Pharmacognosy, College of Pharmacy, King Saud University, Riyadh 11451, Saudi Arabia; [email protected]
7
Division of Applied Life Science (BK21 Plus), IALS, Gyeongsang National University, Jinju 52828, Korea
*
Authors to whom correspondence should be addressed.
Agronomy 2021, 11(9), 1713; https://doi.org/10.3390/agronomy11091713
Submission received: 2 June 2021 / Revised: 22 August 2021 / Accepted: 23 August 2021 / Published: 27 August 2021

Abstract

:
Avena sativa L., also known as Oat belongs to the Poaceae family, is one of the most significant crops that is grown for its seeds, fodder as well as for human consumption as oatmeal. In the current study, 236 genotypes of A. sativa were analysed for genetic diversity through agro-morphological and SDS-PAGE analysis. Cluster analysis based on agro-morphological characteristics grouped all the genotypes into nine clusters, whereas genotype numbers 537 and 728 were highly different from others. The seed yield production of cluster 9 genotypes was the highest per plant (38.2 ± 0.20 g), while cluster 2 genotypes produced maximum biomass per plant (122.5 ± 9.55 g) as compared to other clusters. In a principal component analysis where four variables were studied, and the observed total variations were 57.60%. Among the genotypes, a maximum grain yield of 38.2 g (each) was recorded for genotypes 22,350 and 728, followed by genotypes 737 and 22,390 (with 36.4 g and 35.6 g of seed productions, respectively). The SDS-PAGE analysis resulted in 13 bands and all the genotypes were grouped into seventeen clusters. At the extreme periphery of the dendrogram, genotype 537 and 22,332 were considered to be the most diverse genotypes. Our findings have implications for both understanding the diversity and relationships among these diverse genotypes of A. sativa and will provide a basis for obtaining the elite germplasm optimally adapted to local conditions. The selected genotypes based on agronomic performance may be potential breeding material to raise successful future cultivars.

1. Introduction

Avena sativa L. (oat) belongs to the family Poaceae is a highly nutritive plant cultivated globally [1]. Oat is ranked sixth in the world after wheat, rice, maize, barley and sorghum as a cereal producing plant [2]. Oat is a major component of infant foods due to its high nutritional profile, lack of allergenicity, palatable flavour, good shelf-life, stability and low cost. Oat based food includes oat bran, oatmeal, oat flour and oat flakes which are mainly used as breakfast cereals. Porridge, hot cereals, bread, biscuits, infant food, muesli and granola bars are a few examples of food products produced from oats [3]. Oat is also a decent source of lipids and unsaturated fatty acids. The high lipid content in the seed makes it a potential oilseed crop [4]. It is a major winter forage crop and is cultivated as a multi-purpose crop for silage and chaff for feed, pasture and forage straw. It is a fast-growing plant and as food, it is palatable, succulent and nutritious [5]. It is used as a medicinal plant as well and has exhibited anti-cancer activities. It has also shown therapeutic effects in heart diseases. It can enhance body immunity and stabilises blood glucose levels in case of diabetes [6].
Unlike other cereal grains, such as wheat and barley, it contains appreciable quantities of various bioactive phytochemicals like alpha-tocotrienol, alpha-tocopherol, saponins and avenanthramide most of which are antioxidants. The high antioxidant content and dietary fibre (β-glucan soluble fibres) make this plant a valuable candidate to be used as food [7,8]. Beta-glucan lowers serum cholesterol levels and stimulates the human immune system, a fact that has also been approved by the European Food Safety Authority recently [9]. Oatmeal has also been found to help moderate hypertension, decrease serum low-density lipoproteins (LDL) and total cholesterol levels, regulating blood glucose and insulin levels, controlling weight and promoting gastrointestinal activities. Its consumption reduces the risk of coronary heart diseases by its healthy effects on lipid profile. Its phytoconstituents can quench the reactive oxygen species produced inside human bodies, therefore, its consumption reduces the intensity of oxidative stress and diabetes [10].
Historically, yield, grain size and grain quality parameters including oil, β glucan and protein have been common objectives for cereal breeders. Among the mentioned parameters protein is a direct product of gene translation and is, therefore, investigated while determining genetic variations among the cultivars of the same plant species [11]. Many cultivars of oat have high food value if cut at the flowering stage, or soon after, it that can meet the demand of the rapidly growing livestock industry of Pakistan [12]. The ideal variety is always one that possesses general adaptation with higher yield potentials [13]. Forage oats are grown during winter under a wide range of soil and climatic conditions in Pakistan as here the farmers encounter acute shortages of green fodder from mid-November to mid-January. The farmers in Khyber Pakhtunkhwa recognise oat as an essential winter crop to fulfil their fodder needs. It is mostly fed to animals when green, however, its surplus is converted into silage or hay to be used during fodder deficit periods mentioned above. Green fodder contains, 10 to 13% protein while 30 to 35% dry matter. Despite being a high fed fodder crop, it is now gaining importance as human food due to its beneficial health effects associated with its phytoconstituents [14]. In Pakistan, oat utilization is limited to the animal as feed because of its softness compared to other fodder plants and is very rich in Total Digestible Nutrients, digestible raw proteins, fats, vitamins and minerals such as phosphorus and iron [3]. As mentioned above its consumption as human feed is limited in this country therefore, it is grown in limited quantities. Even limited attempts have been made by researchers to identify its high yielding varieties and there is an urgent need to increase feedlots and to identify improved oat varieties with high food values which will increase the demand of the plant further.
Morphological evaluation is useful to describe genetic diversities among plant species. Such types of evaluations are easily made as the trait studied can be monitored visually and do not need any sophisticated instrument [15]. The key agronomic traits monitored includes seed quality and defensive traits, flowering, maturity, plant height, protein content, oil content, primary branches, number of capsules, resistances to pests and diseases, drought and cold tolerances, etc. [16]. Usually, changes in morphological traits are associated with a relatively small number of loci; thus, the potential differences could be lost in the analysis of large amounts of molecular data [17].
Knowledge of diversity patterns allows breeders to understand the evolutionary relationships in a better way among genotypes and suitable varieties are then cultivated to get the maximum yield [18]. To assess genetic variation in crops, morphological traits, total seed protein and molecular markers are usually monitored [19]. Owing to the importance of genetic diversity among the germplasms, the current study aims to (i) characterise the local and exotic oat genotypes, (ii) to evaluate genetic diversity in oat germplasm through total seed storage proteins using SDS-PAGE and (iii) to find out promising genotypes that can fulfil fodder demands of farmers in terms of yield-related traits.

2. Material and Methods

2.1. Experimentation

The present research work was conducted in the Botanical Garden and Herbarium, (34°40″318′ N and 72°03″753′ E with 726 m altitude using Altimeter eTrex® 30x (Garmin, Schaffhausen, New Taipei City, 221, Taiwan) in the University of Malakand, Pakistan (with an average of annual temperature of 28 °C and annul precipitation of 80 mm). The data was recorded for two consecutive years (November 2018 to May 2020). The seeds of 236 genotypes were acquired from the Gene-bank of Plant Genetic Resources Institute, Islamabad, Pakistan. Out of which, 143 genotypes were indigenous (Pakistani origin) and 92 were exotic (USA origin) (Table S1). The most prominent variety locally grown (Dir Lower, Khyber Pakhtunkhwa) was used as a control variety.

2.2. Germination of Plant Material

The experiments were performed in triplicate applying randomised complete block design. About 6 g of dried seeds were sown in a given row. The dimensions of plots where the seeds were grown have 10 m2 area with 2.5 m length and row to row distance of 0.3 m. The experiment was performed in a loamy soil: 3.60% clay, 54% silt, sand 44.40%, nitrogen 0.04%, phosphorus 39.5 mg/kg, potassium 128 mg/kg and pH 8. The recommended practices were applied for soil preparation, ploughing, levelling, irrigation (after 2 days of sowing) and weeding. The herbicides (Dual-gold 960 EC, Syngenta, Basel, Switzerland) was applied before sowing to avoid unwanted plants growth.

2.3. Morphological Evaluation

A total of 21 morphological traits (7 qualitative and 14 quantitative) were monitored following guidelines of IPBGR-1985 devised for Oat (Avena sativa L.). Out of these the seven qualitative traits were observable-stem thickness, plant vigour, plant lodging, leaf rigidity, rigidity of flag leaf, erectness of spikelet and glume colour of spikelet which were recorded in percentages while the quantitative traits were days to flowering, days to maturity, number of tiller per plant, number of leaves per plant, plant height, number of spikelet, peduncle length, spike length, leaf length, leaf width, biomass, yield per plant, harvest index and 1000 seeds weight which were recorded for two consecutive years specified above. Days to flowering were measured from the sowing date till the first flower initiate. Days to maturity were noted when the colour of the plant became yellow. The total number of tillers per plant and leaves were counted for 5 plants. The plant height was the length recorded from base to top of the plant with meter rod after maturation. The spikelet was enumerated for five plants in each cultivar, whereas spike length, peduncle length, leaf length and leaf width were measured with a metre rod. The weight of resultant biomass was recorded where the whole plant was cutting into pieces and digital balance was used to record its mass. Seed yield per plant was determined after harvesting and threshing of all the spikelet. The average seed weight was calculated by taking 1000 seeds of each genotype and weighing it’s through digital balance. Harvest index was calculated as the ratio between the grain yield and biological yield.

2.4. Total Seed Protein Analysis

The seeds proteins of all 236 genotypes were extracted and subjected to SDS-PAGE analysis to determine genetic variation among these germplasms. Using mortar and pestle, a total of 10 healthy and mature seeds were ground into fine powder. About 0.02 g of the seeds powder were transferred to 1.5 mL centrifuge tubes already containing 400 μL protein extraction buffer (Distilled water 70 mL, Tris 0.60 g, SDS 0.2 g, Urea 30.3 g, 2-Mercaptoethanol 1 mL and pH 8). The powder was homogenised at room temperature for 1 min before centrifugation at 12,000 rpm for 10 min. About 14% polyacrylamide gel was used to make SDS-PAGE slabs, consisting of two phase’s separation gel and stacking gel. The composition of separation gel was 20% acrylamide with 0.135 percent N.N-methylene-acrylamide in 0.15 M Tris-HCl buffer with a pH of 8.8 and SDS 0.27%. For polymerization of the gel, 10% APS (Ammonium per sulphate) and fifteen microliters Tetramethylethylene-diamine (TEMED) was added to the solution. For making of stacking gel 0.8% N.N-methylene-bis-acrylamide, 30% acrylamide 0.25 Tris (pH of 6.8), 0.2% SDS, 70 µL APS and 17 µL TEMED were mixed together. About 10 µL of the sample solution was loaded into the well of the stacking gel through a micropipette. The gel plates were mounted on gel assembly and a 100 voltage current was applied to get the electrophoretogram. When the blue line of bromophenol blue reached the bottom of the gel the electric current supply was disconnected. The gel plates were taken out from the assembly and transfer to a plate filled with staining solution and gently rotated on a shaker for 2 h. After that for de-staining, gels were kept in the destining buffer for several hours to overnight till the disappearance of the blue colour for the gel and protein subunits were clearly observed [20].

2.5. Data Analysis

For the estimation of multivariate diversity and selection of candidate lines for high yield and fodder quality, 5 plants were randomly selected from each line (genotype) and statistically analysed. The distribution of qualitative traits among the germplasms, data frequency in percent was calculated using Microsoft Excel (Redmond, WA, USA). The quantitative data obtained for cluster analysis, principal component analysis and Pearson correlation analysis were computed using Statistica version 7 (Palo Alto, CA, USA), PC ORD version 5 (Wagga Wagga, Australia) and NTSys PC version 2.1 (Bangalore, India). Similarly, the binary data matrices of seed storage protein profile were analysed via Unweighted Pair Group Arithmetic Average (UPGMA), genetic similarity analysis and genetic linkage analysis, where 0 has been used for the absence of a given band while 1 for the presence of a band. A two-way cluster dendrogram has been constructed using PC-ORD software version 5 (Wagga Wagga, Australia).

3. Results

3.1. Morphological Characterization

3.1.1. Diversity in Qualitative Traits

Significant variations were observed for stem thickness: thin (10.25%), intermediate (40.25%) and thick (49.15%). Three types of plant growth vigour: good (58.90%), medium (29.66%) and poor (11.44%) were recorded as well. Lodging is one of the most important traits: 4.24% of genotypes had lodging while 95.76% of genotypes had no lodging. Three types of rigidity of flag leaf were noted: bent 35.59%, slightly bent 34.74% and stiff 29.66%. Three types of rigidity among leaves of the germplasms were noted: in 9.32% leaves were bent, in 48.31% slightly bent while in 46.61% germplasm they were stiff. Three types of glume colour were observed: green 85.32%, silver 13.98% and light green 1.69%. Erectness of spikelet observed were 3 types: droop 16.10%, semi-erect 35.59% and erect 48.31%.

3.1.2. Diversity in Quantitative Traits

The descriptive statistics (range, mean standard deviation and CV %) of different traits recorded in the current study are presented in Table 1. Overall, significant variations were observed in all the studied traits and the coefficient of variation (CV) are ranged from 2.56 to 30.73% with the highest CV recorded for harvest index with an increasing trend from 1st to 2nd year (CV = 29.50 and 30.73% correspondingly). An increase in CV% for 1st to 2nd year in the number of leaves plant−1 from 19.95 to 25.29% and plant height (17.25 to 18.26%) were observed. A similar trend in leaf length and leaf width from 1st to 2nd year was reordered (leaf length means correspondingly for 1st and 2nd year = 33.102 ± 6.10 and 33.63 ± 7.18 while for leaf width these are 1.72 ± 0.27 and 1.74 ± 0.31). A decreasing trend in CVs for the number of tiller/plant (24.13% and 20.18%) and plant biomass (23.43 and 20.17%) were observed correspondingly from the 1st to 2nd year. The CVs were recorded for days to maturity (2.76 and 2.56%), days to flowering (3.06% and 3.02%) with decreasing trends from 1st to 2nd year.
The early maturity of 172 days was observed for indigenous accessions; 537 and 538 while for exotic varieties it was observed for 727, 753 and 758 accessions. For first-year plants, all remaining accessions matured till 196 days whereas in the 2nd year the maturity period was from 174 to 190 days. A significant variation in yield per plant−1 were observed, ranged from 8.80 to 38.20 g with maximum yield pant−1 38.20 g recorded for the genotypes 22,350 (Pakistani origin) and 728 (USA origin) whereas minimum yield recorded was 8.80 g for the genotype 545 (Pakistani origin).

3.2. Correlation Analysis

The correlation analysis were performed considering the 14 quantitative traits that were monitored for 2 consecutive years (Table 2). DM was found to strongly correlate with DF, in particular in 2020 (r = 0.86 **). In 2019, NT/P showed a negative correlation with DF and DM with the value r = 0.23 * for each, while no significant differences in the correlations were registered for the year 2020. There is a significant correlation between PH and NT/P in 2019 (r = 0.50 **), which is reduced (r = 0.25 *) in the 2nd year (2020). LW and Y/P have a low correlation coefficient to NT/P for 2019 (r = 0.16 * and r = 0.21 **) and 2020 (r = 0.29 * and r = 0.20 *), respectively. Plant biomass and LL also showed the lowest correlation coefficient (r = 0.11 * and r = 0.39 **) with LL.
Similarly, for the harvest index, the data were strongly significant with Y/P (0.57 **), while there was a negative correlation with BM (0.58 **), which for the 2nd, it was strongly positively correlated with Y/P (0.62 **), and a negative correlation with PH (−0.40 **) and BM (−0.64 **). The parameter 1000 seed weight was found to be strongly significant with Y/P (0.53 **) and HI (0.28 **), while there was a negative correlation with LW (−0.23 **), which for the 2nd year was found to be significant with HI (0.16 *) and negative with NSPK (−0.20 *), respectively.

3.3. Principal Component Analysis (PCA)

The principal component analysis (PCA) helps select the best cultivars among a given population. Table 3 shows the PCA of the 14 studied quantitative traits. Altogether, PC1, PC2, PC3 and PC4 explained 57.6% (2019) and 56.4 % (2020) of the total variation in the data set.
In the 1st PC component, the total variations were 20.66% and they were associated positively with DF and DM, negatively with NT/P, PH, NSPKL and Y/P; whereas for the 2nd year the total variation was 19.83%, with a positive value of NT/P, PH, LW and BM while negative in HI, NSPKL, SPKL, LL, Y/P and HI. The 2nd principal component accounted for 33.79% of the total variation and was positively related to DF, DM, NSPKL, SPKL, LL, LW and BM, whereas, in the 2nd year, the total variation was 35.225% with a positive association with DF, DM and NSPKL, and negatively with LW, Y/P, HI and 1000 seed weight. Furthermore, DM, Y/P, HI and 1000 seed weight contributed positively to PC3, which accounted for 46.35% of the overall variations, whereas PH and LL were found negative. While for the 2nd year plants the total variation was 47.77%. In addition, the overall variation in PC4 was 57.59% for the 1st year and 56.43% for 2nd year the association of SPK L, LW and HI were positive while 1000 seed weight was negative, whereas LL, BM and 1000 seed weight were associated positive while NT/P, SPK L, LW, NSPKL and HI were recorded negative. Among the PCS (PC1, PC2, PC3 and PC4) DM was ranked high followed by Y/P, HI and LW. Biplot analysis was used to determine the associations between the traits.
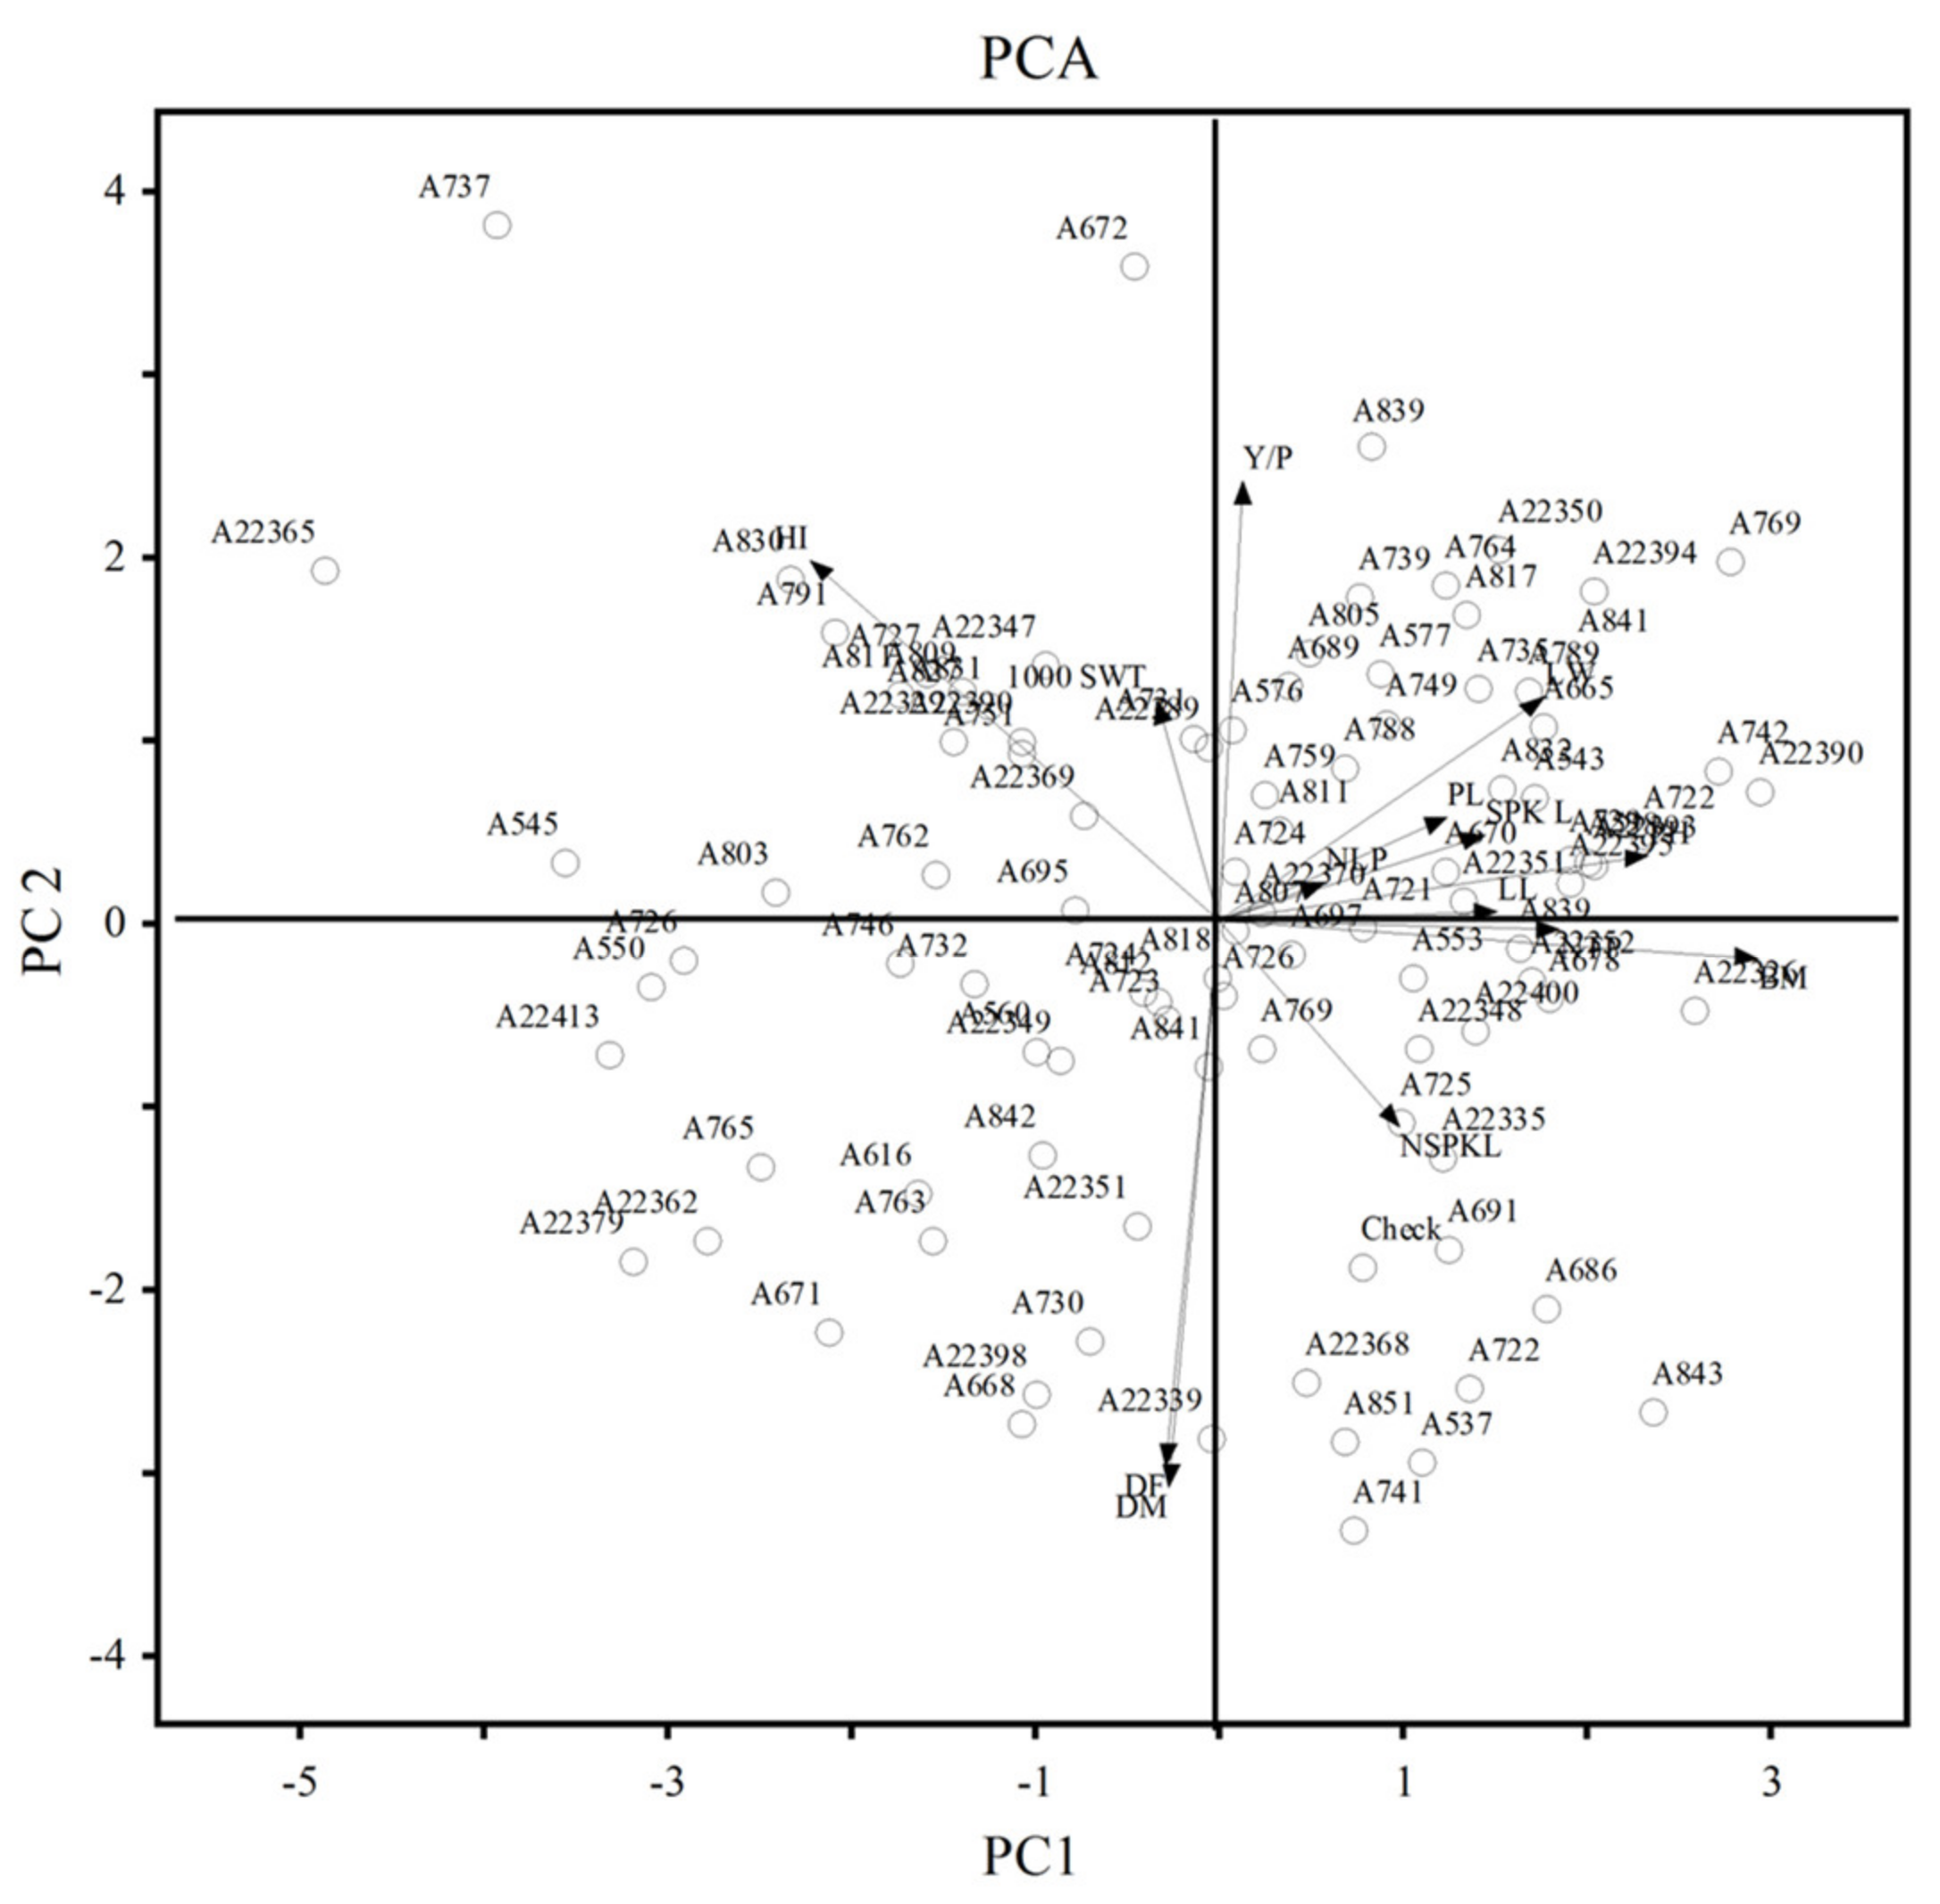
As a result, the plot defined by the two PCS, PC2 and PC3 showed a total variation of 80.15% for 2019 and were placed against each other to find the level of genetic diversity and geographical association among the genotypes. The separation based on PC2 and PC3 revealed that the genotypes were scattered in all the quarters, which showed the high level of genetic diversity in the studied genotypes. Among the studied genotypes of both local (Pakistan) and exotic (USA) was found diversely scattered and most of the genotypes was found condensed toward the centre of the plot. According to the biplot, the genotype-728, 22,350, 553, 739, 22,724 and 723 were indicating strong Y/P and HI whereas the genotypes 22,413, 560, 22,365, 22,406, 22,338, 22,405 were associated with DF and DM. 22,394, 22,397, 22,359, 22,323, 22,322, 22,385, 22,363, 22,352 and 22,358 were associated with LW. On the other hand, 22,368, 22,386, 735, 851, 22,364, 22,355, 918, 22,402, 22,325, 804, 22,354, 755 and 846 were some of the genotypes in the right quadrate associated with NSPKL, LL, SPKL and PL (Figure 1). For the 2nd year genotypes, the total variation of PC1 and 2 was 55.05% and were plotted against each other to get the scatter diagram. Genetic diversity based on origin-wise shows that the genotypes of Pakistan and the USA were found scattered. The genotypes of 830, 791, 727, 811, 22,347, 721, 22,389, 22,392 and 751 were strongly associated with HI and 1000 SWT. The genotypes 672, 839, 805, 689 and 576 were the high yielding genotypes and were found in positive PC2 at the upper quarter of the biplot. Oat genotypes with high LW, SPKL, BM, NTP, LL and NLP were located throughout the right side of the PC1 quarter (Figure 2).

3.4. Cluster Analysis

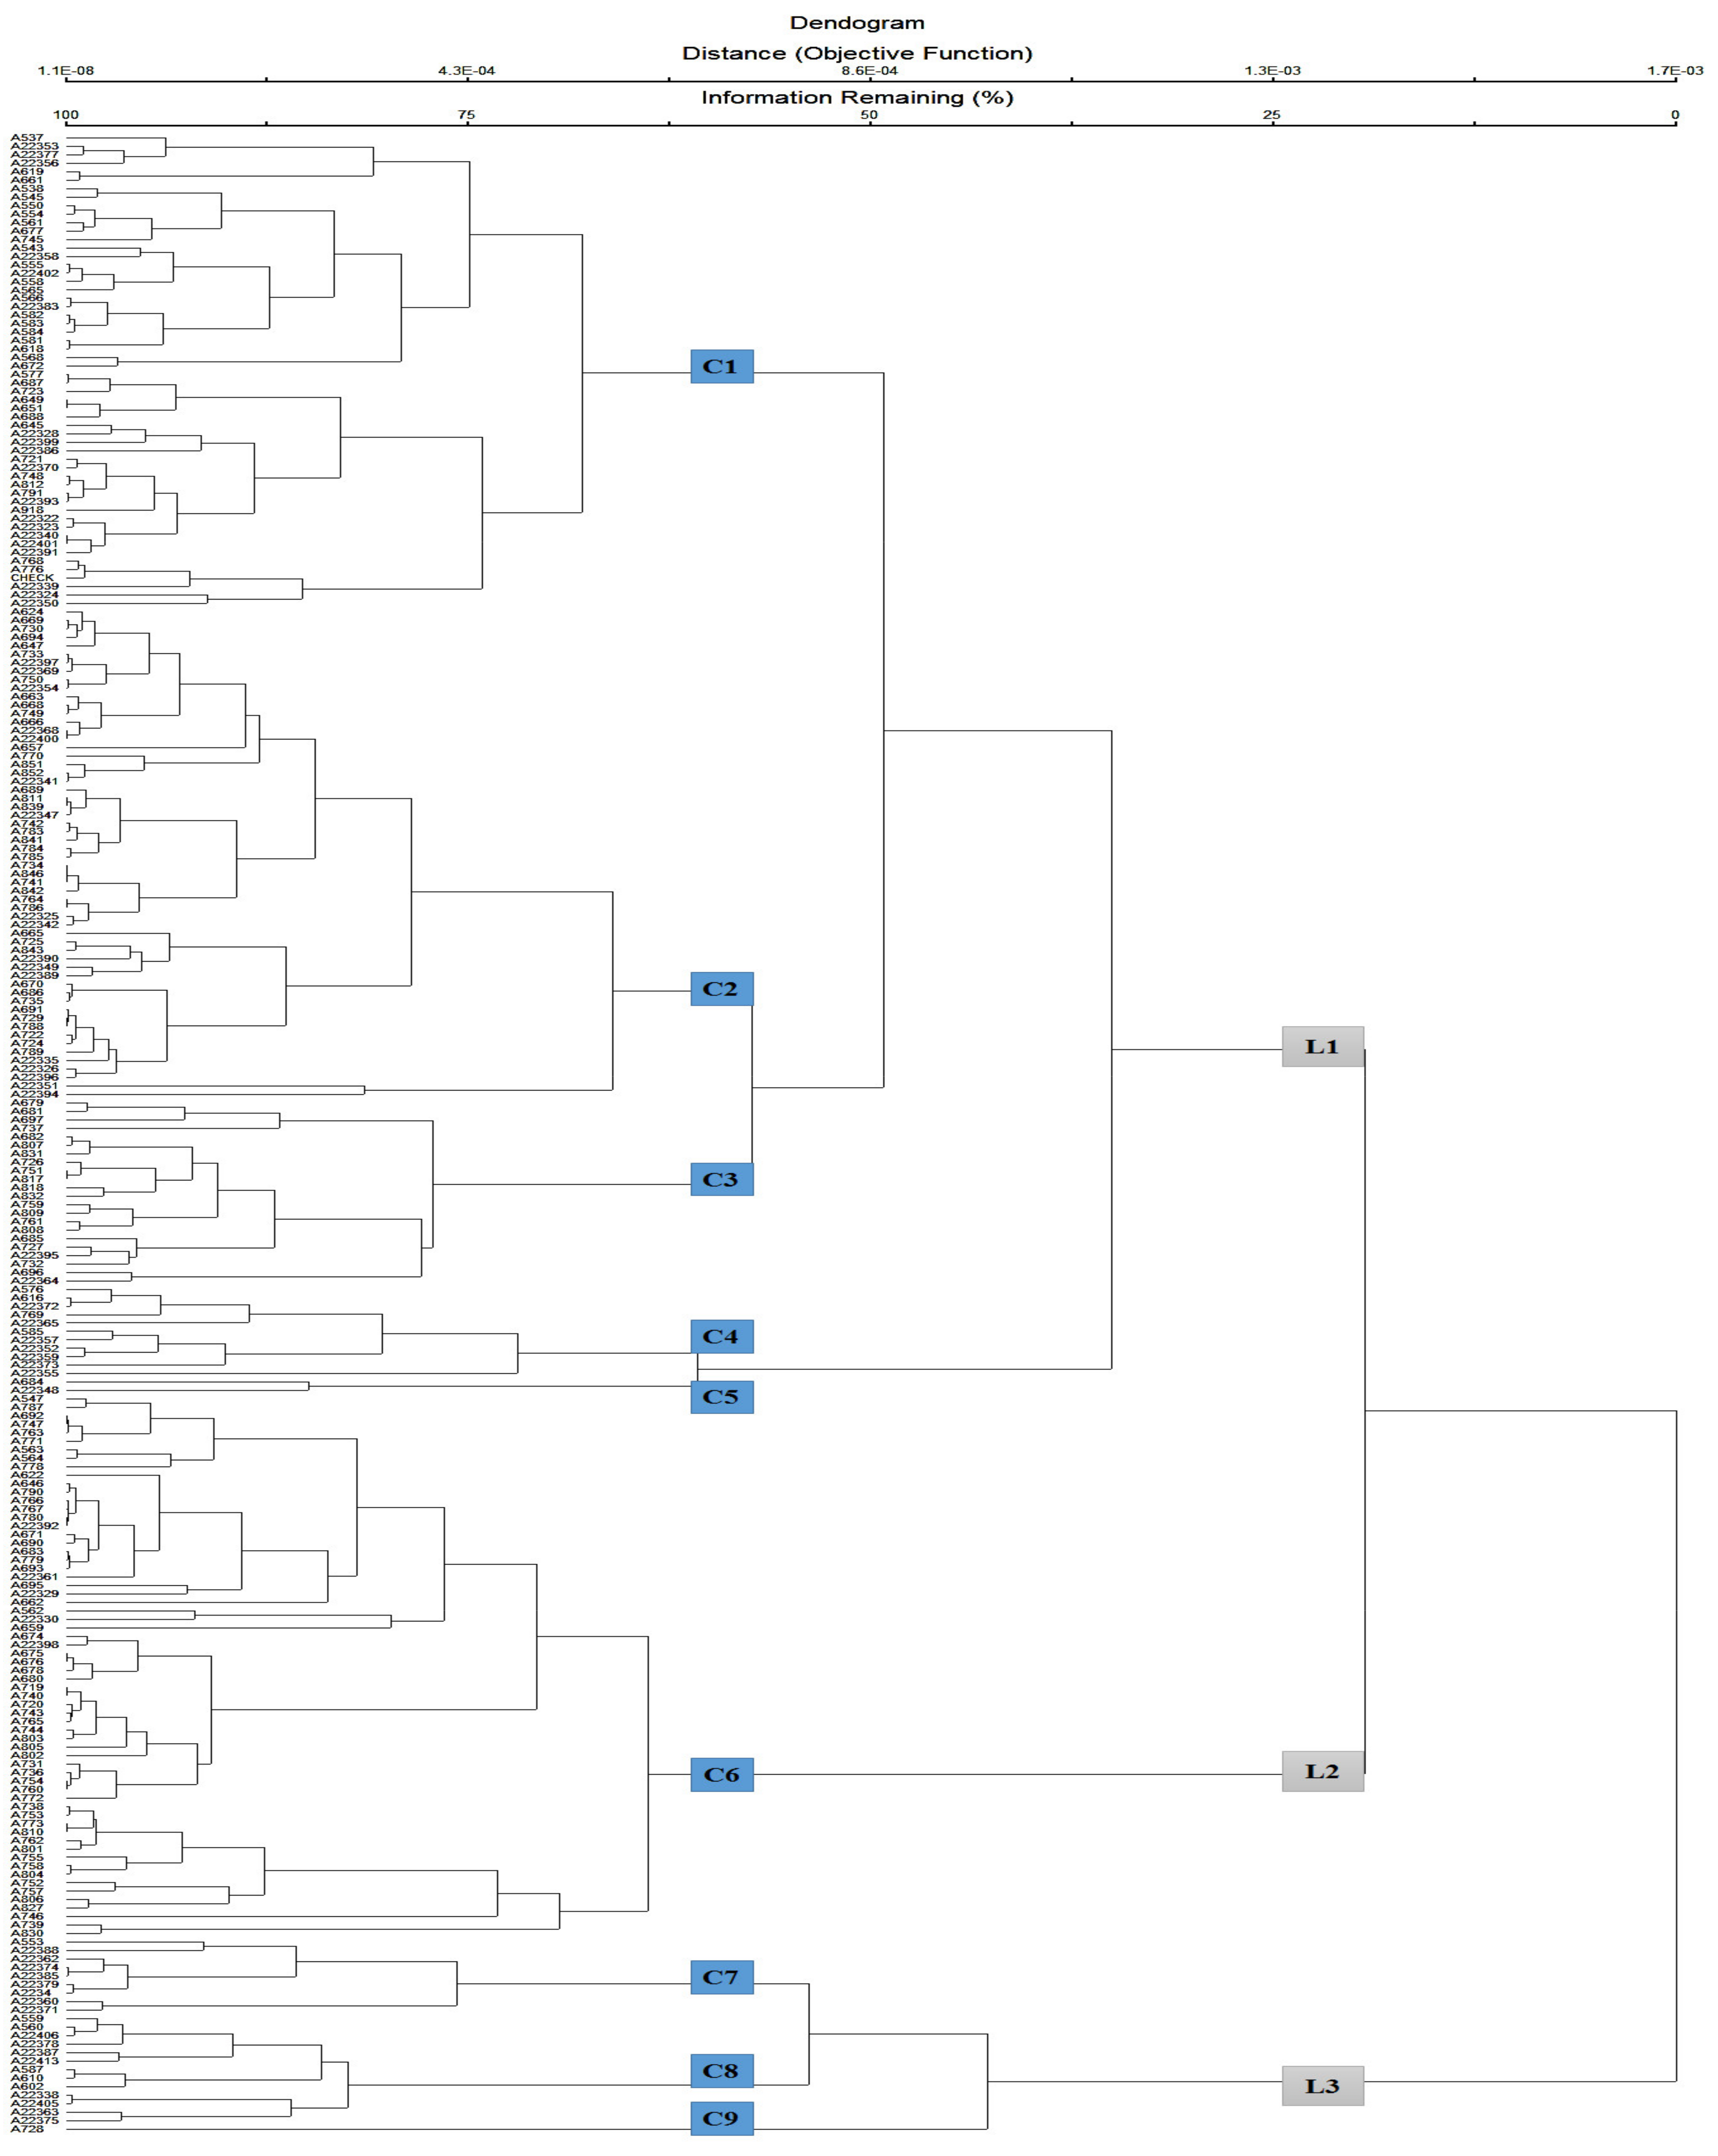
Wards method was followed while performing the cluster analysis. All the genotypes were divided into three main lineages (lineage 1, lineage 2 and lineage 3) at a distance of 25%, which were further subdivided into 9 sub-clusters at a distance of 62.5% for the year 2019. Lineage 1 was further divided into 5 sub-clusters whereas lineage 2 was divided into 1 cluster Lineage 3 into 3 sub-clusters, with genotypes 537 and 728 as the most diverse among the studied genotypes. In a given group there was less variation among the genotypes, but they were considerably different from members of the other groups (Figure 3).
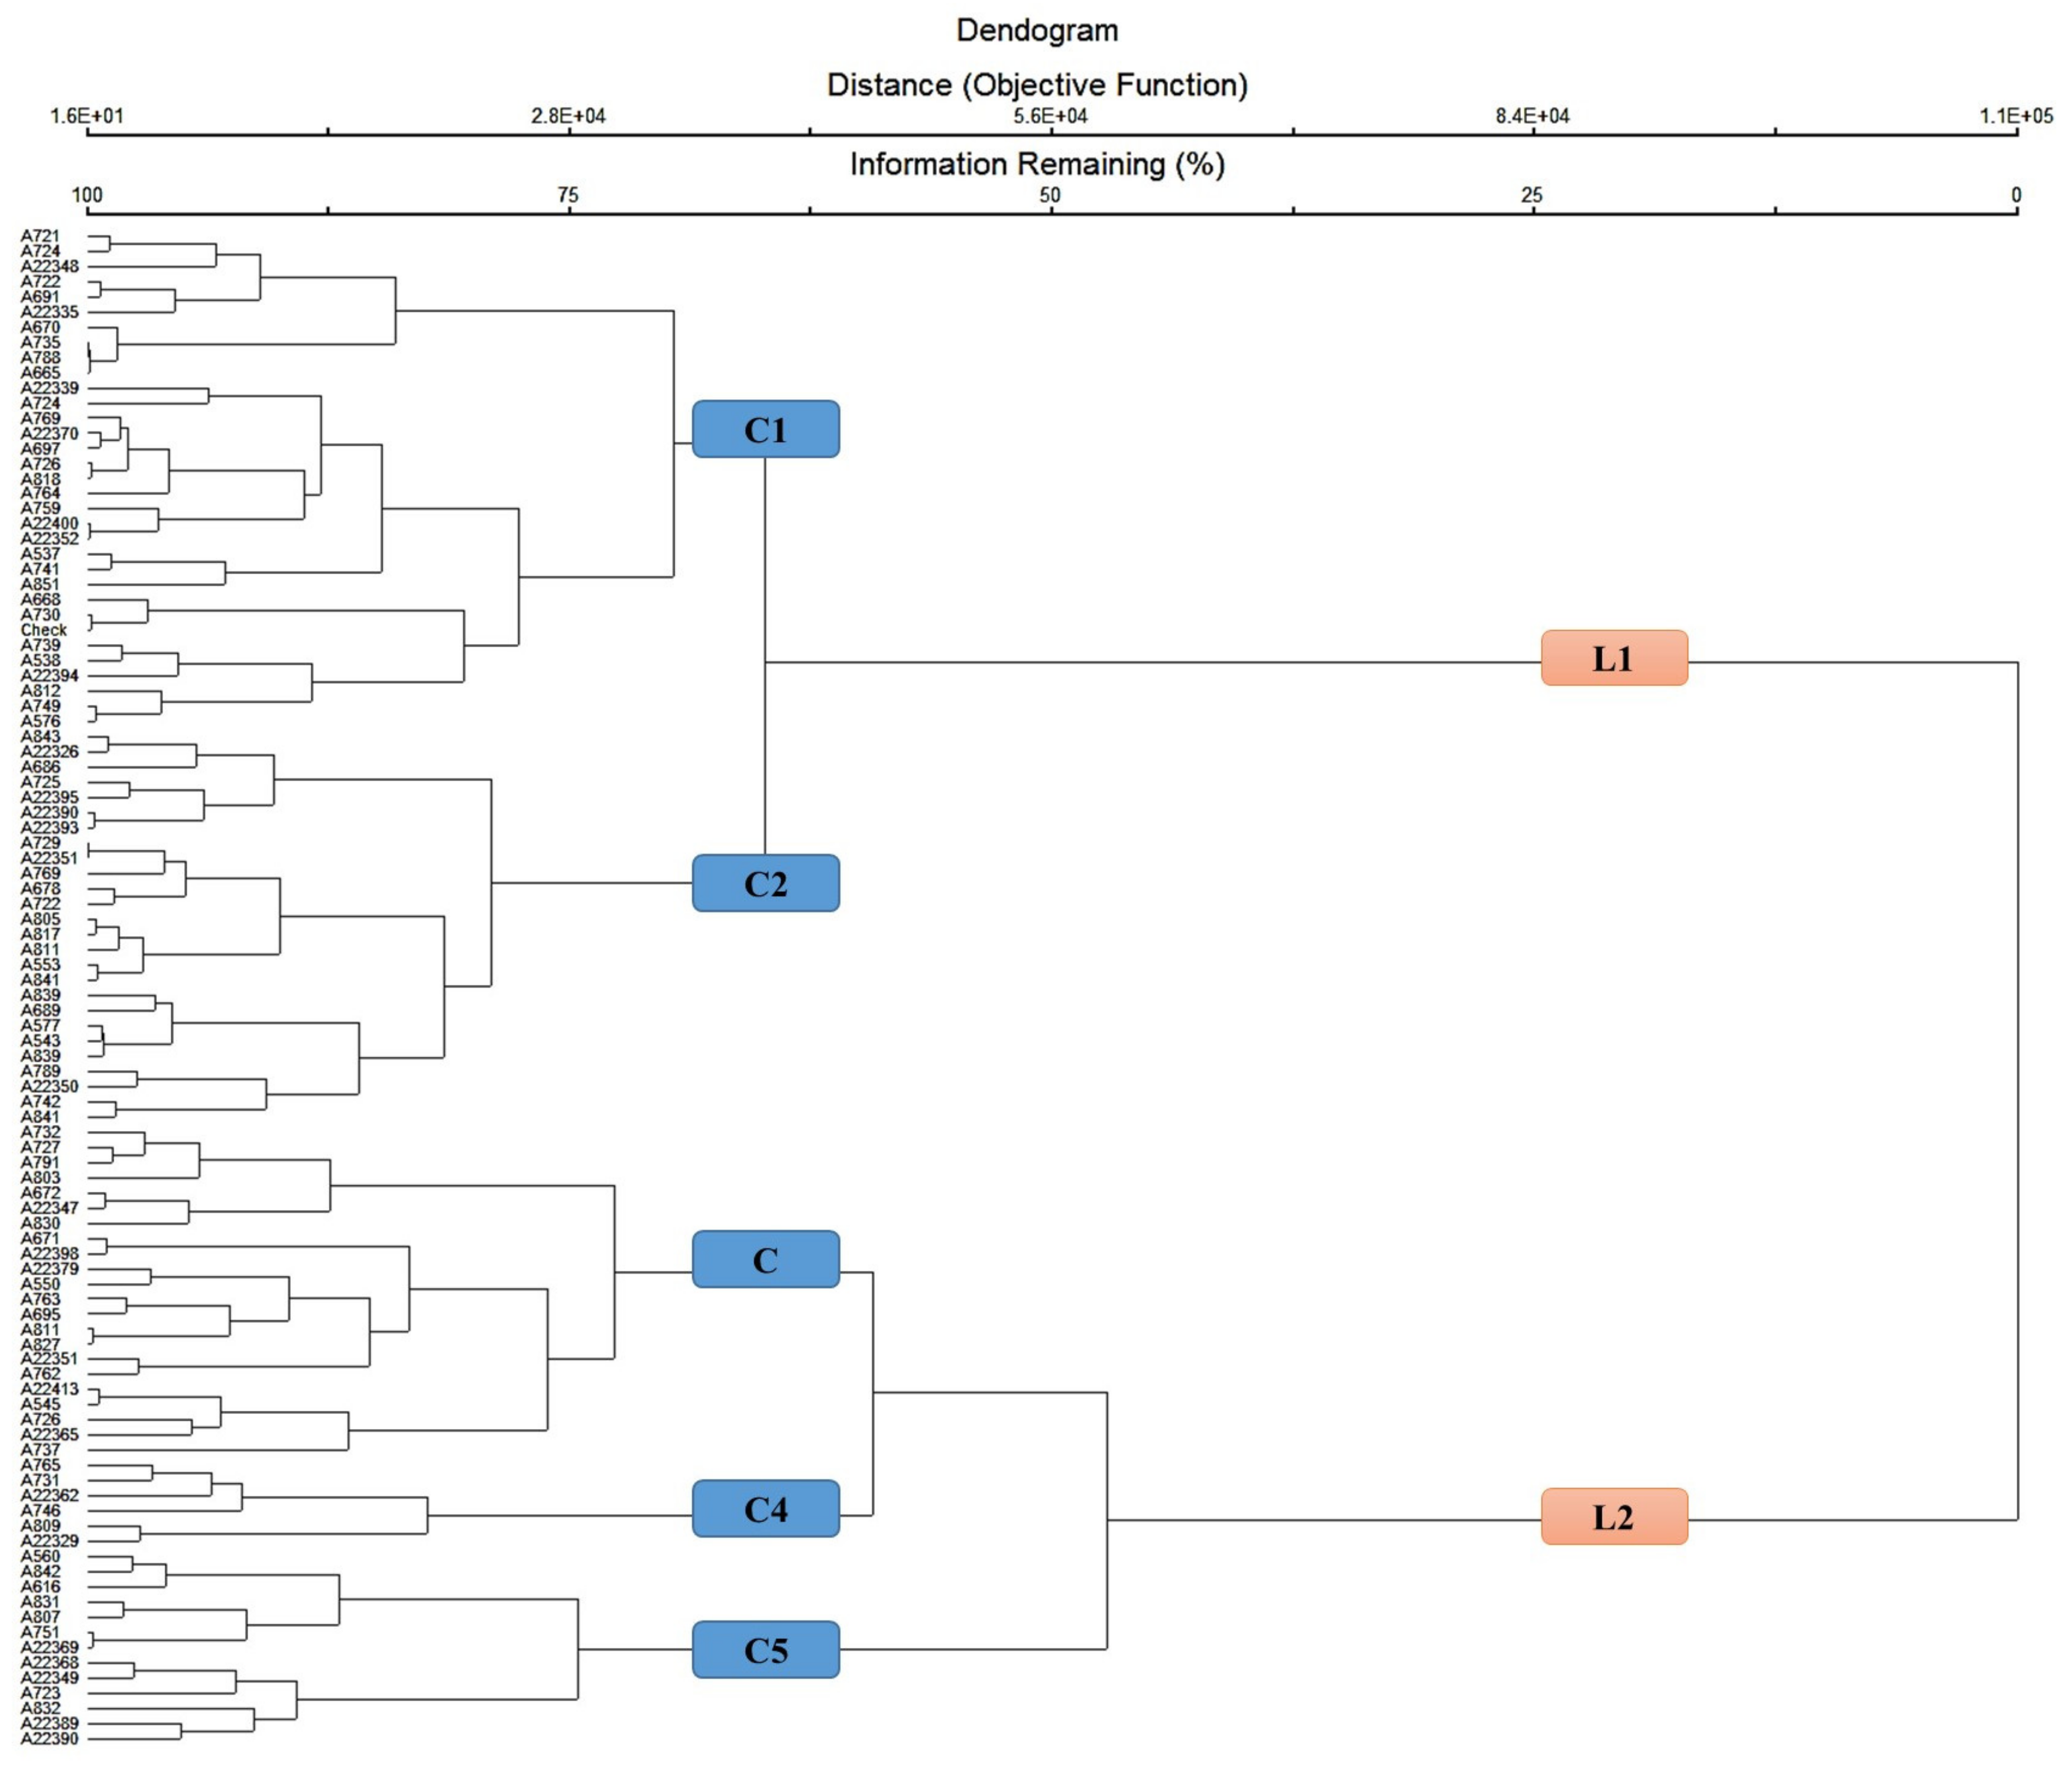
Cluster analysis of the 2nd year (2020) plants demonstrated 100 genotypes which were placed into two main Lineages (lineage1 and lineage 2) at a distance of 25%, which were further subdivided into 5 sub-clusters. Lineage 1 was further divided into 2 sub-clusters while lineage 2 into 3 sub-clusters. The number of genotypes in both lineage 1 and 2 are presented in Figure 4. The passport information of 236 genotypes along with their accessions detail and origin (from Pakistan and the USA) used in the current study has been shown in Table S1 Supplementary Materials).
The mean performance of all traits were calculated for both the years where cluster 6 was found to have the lowest DF and DM value (2019) while in (2020) while the lowest DM were recorded in cluster 4. The high grain yield genotypes were from cluster 1 (2019) with a mean value of 38.2 ± 0.2 g, followed by cluster 3 genotypes with a mean value of 22.16 ± 5.71, whereas in 2020, the highest grain yield was found in cluster 2, which may be selected in future breeding practices of the oat plant. In cluster 2, the highest BM mean value = 122.5 ± 9.55 was recorded (Table 4 and Table 5).

3.5. Total Seed Storage Protein

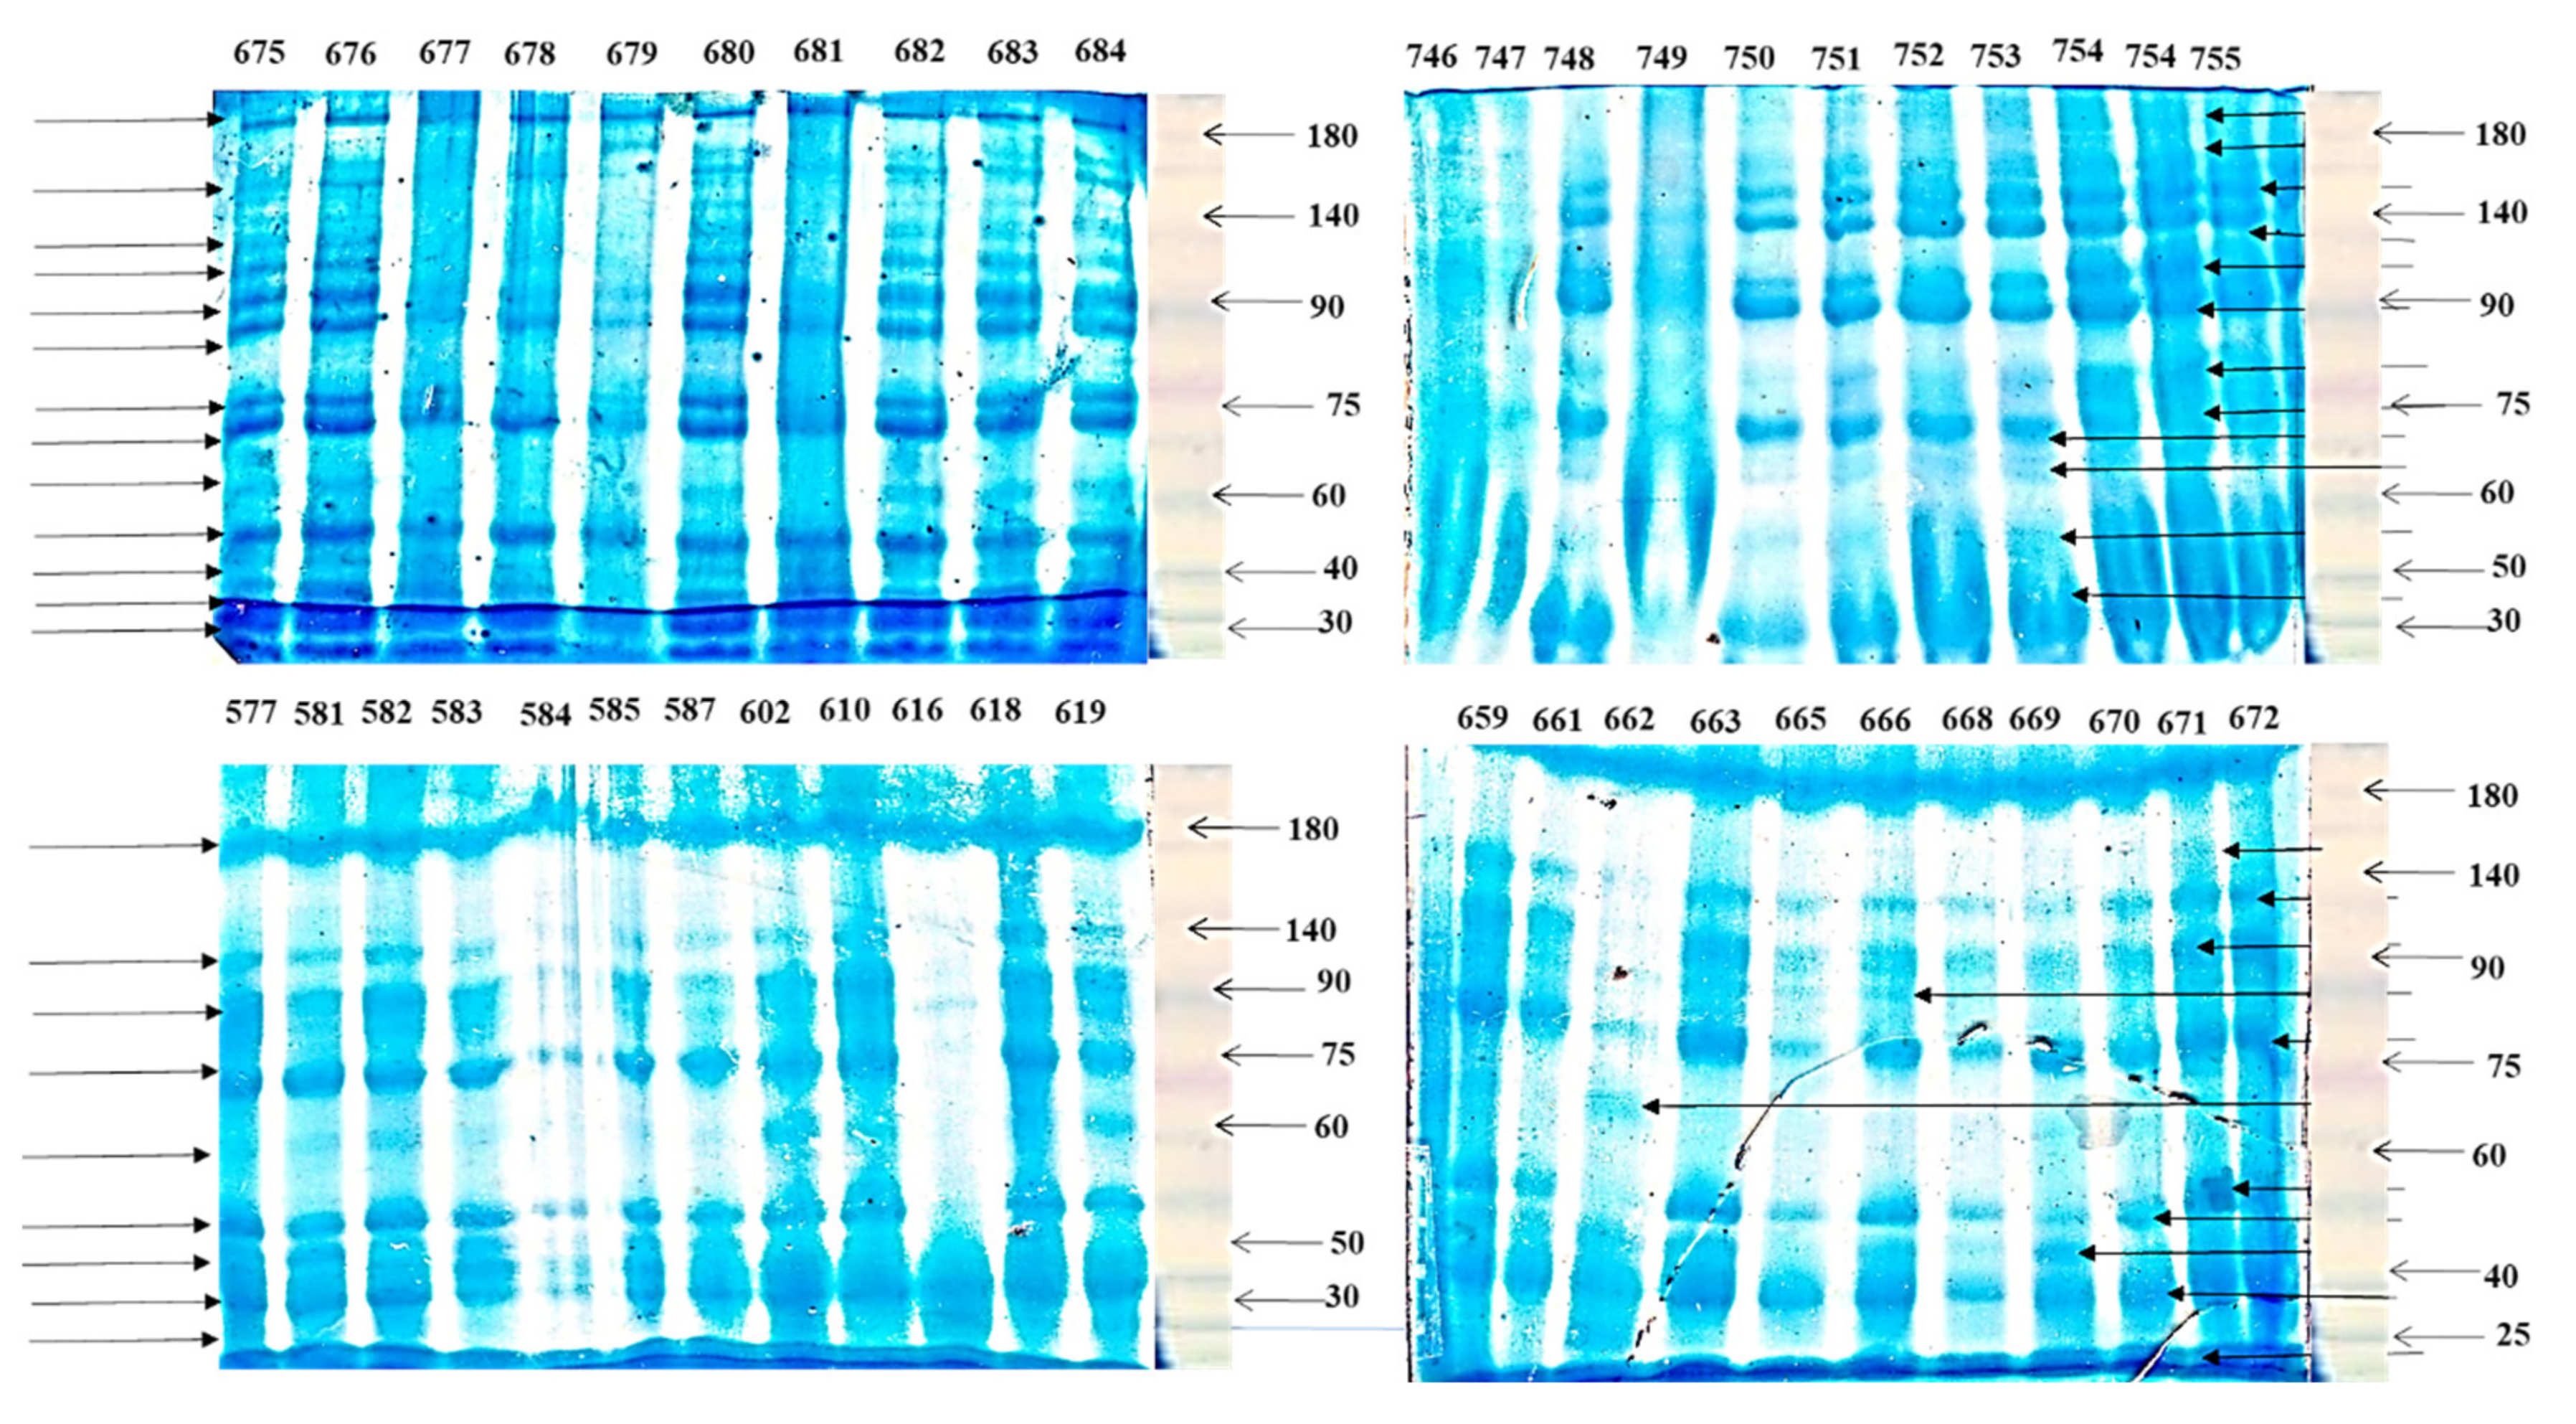
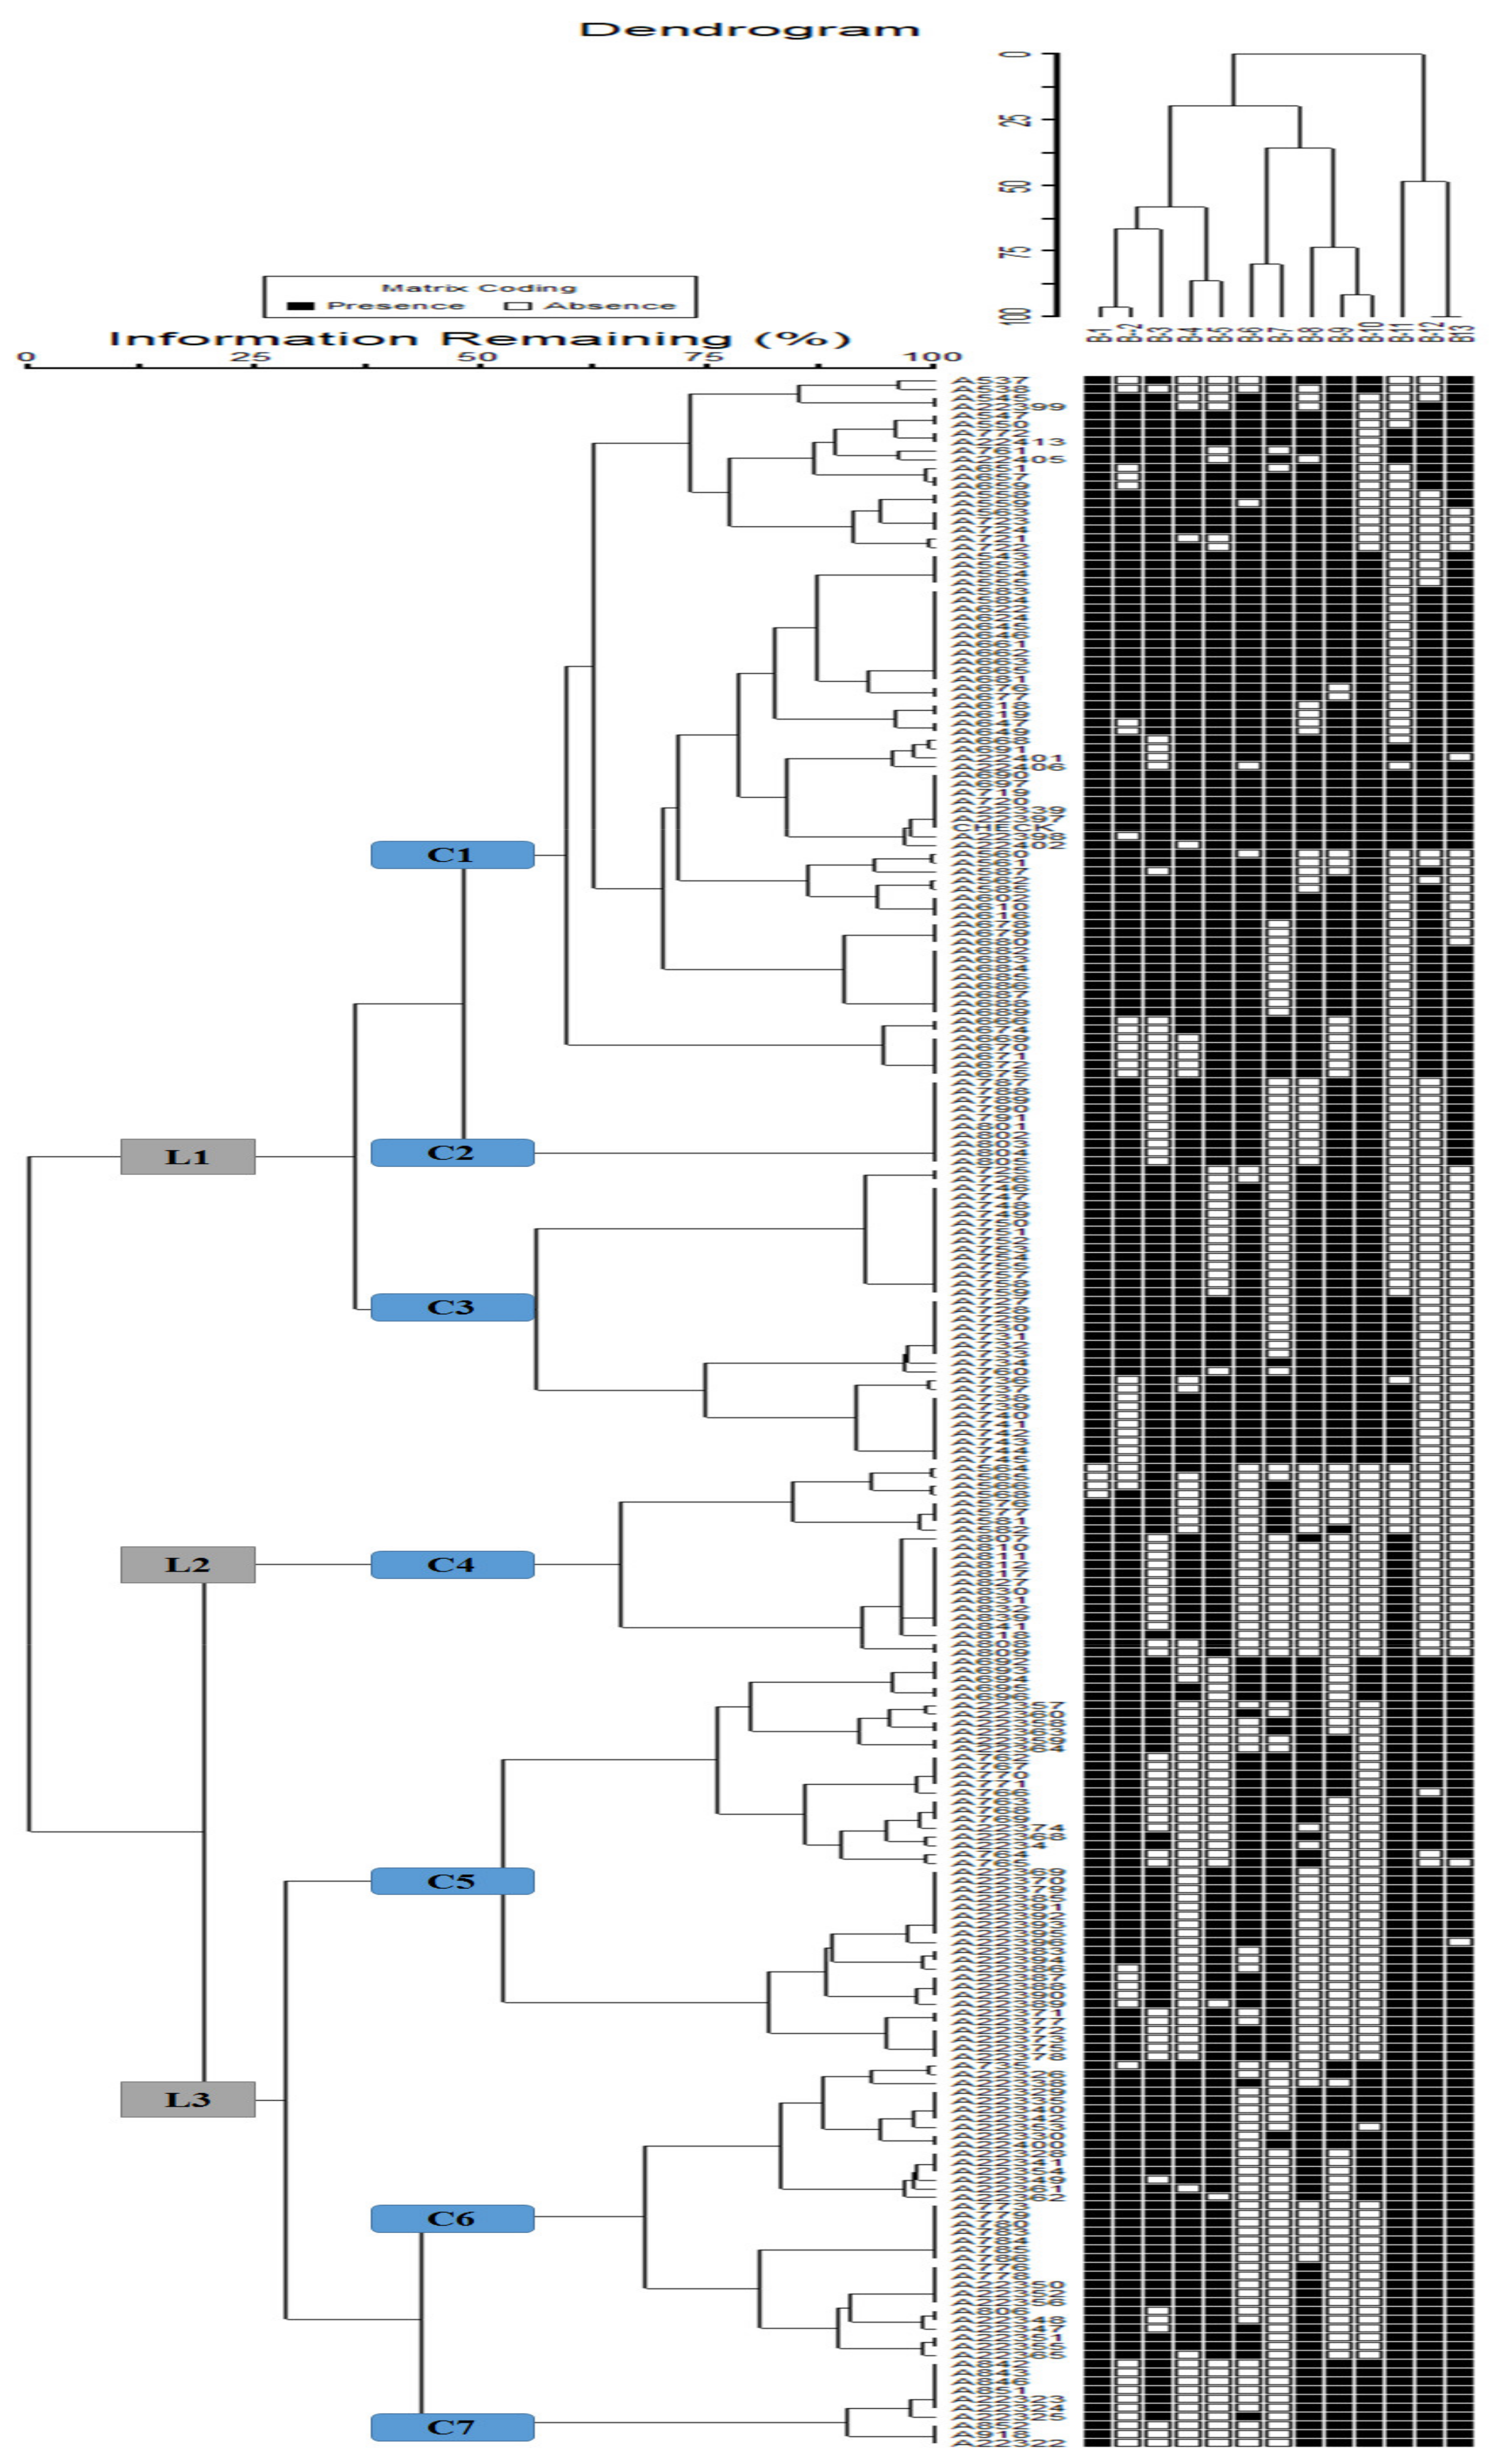
All the genotypes were investigated for total seed storage proteins using SDS-PAGE, where 13 polymorphic bands were observed with the molecular weight ranging from 25 to 180 kDA (Figure 5). The highest genetic diversity was observed in Band 7 (19.39%) with the frequency distribution of 128, followed by Band 10 (17.95%) with a frequency distribution of 136 while the minimum genetic variance was recorded in Band 1 (0.72%) with a frequency distribution of 232. The genetic diversity and frequency distribution of 13 Bands are presented in Table S2 Supplementary Materials).
Based on the cluster dendrogram all the 236 genotypes were grouped into 3 main lineages (lineage 1, lineage 2 and lineage 3) at a distance of 25% which were further subdivided into subgroups at a distance of 50%. The 1st lineage is divided into 3 sub-clusters, 2nd into 1 sub-cluster while the 3rd into 3 sub-clusters. The maximum number of genotypes 33.23% were found in cluster 1 followed by cluster 5 with 19.49% genotypes while a minimum of 4.23% genotypes were observed in cluster 2. The 1st sub-cluster of lineage 1 was consist of 80 genotypes in which 7 genotypes were of USA origin and 73 from Pakistan origin. The 2nd sub-cluster of the same lineage was consist of 10 genotypes of USA origin. The 3rd sub-cluster of 1st lineage is composed of 34 genotypes of USA origin. The 4th cluster of lineage 2 consists of a total of 22 genotypes from which 8 genotypes were of Pakistan origin and 14 from the USA. Sub-cluster 5 comprises 46 genotypes of which 10 were of USA origin and 36 from Pakistan. Sub-cluster 6 was consist of 34 genotypes of which 10 genotypes were of USA origin and 24 from Pakistan. Similarly, cluster 7 was comprised of 10 genotypes of which 2 genotypes were from the USA and 8 from Pakistan origin (Figure 6).

4. Discussion

For improvement in any breeding program, there is always need to evaluate the material available to find out the good lines for breeding purposes. Different agronomic traits have been used as a prime objective to evolve new breeding materials. Determination of correlation helps in taking the decision related to selection strategies. In breeding programs, the studies on diversity are the key factors to bring genetic improvement in a given population. This path analysis further helps in determining the direct and indirect effect on the traits of interest. All these traits are affected by genetic and environmental factors [21]. Genetic variation within and between population crops species is of major interest for plant breeders. An estimate of the extent of variation within and between populations of a species is useful in analysing the genetic structure of germplasm. Ahmad et al. [22] studied clustering patterns in 75 germplasms of oat to get high yield varieties with desired traits.
The extent of genetic diversity in genetic materials paves the way for any program of genetic improvement and genetic heterogeneity is measured in different ways, and the most commonly used approach is multivariate analysis [23]. Multivariate analyses like morphological and biochemical differences along with the response of a plant towards molecular markers are employed to determine genetic differences among the population of a given plant. Based on morphological differences, one can pick and preserve genotypes for future use [18]. Unfortunately, morphological parameters are strongly influenced by the climate, which may positively or negatively affect a given plant and data for every locality around the globe is necessary for successful breeding of the given plant in a given locality [24].
For most of the traits studied significant differences between the genotypes were observed such as days to flowering, days to maturity, plant height and the number of tiller plant1, yield plant1, total biomass and 1000 seed weight. Early flowering initiation was observed in genotypes 543, 657, 661, 663 and 736 with days to flowering less than 150 days which is a good sign for breeders. The other important factor in breeding practices is the time taken to maturity which for 4 genotypes was found to be less than 175 days. Similar results have been reported previously by other investigators as well [25,26,27,28] where they observed significant variation for days to flowering and days to maturity in various oat germplasm. Green fodder yield is highly dependent on the number of tillers plant-1, which is certainly the most important factor. The maximum number of tillers per plant 14.2 was found for accession 727 while the minimum of 3.40 was recorded for accession 602. Our result is in close agreement with that of Wagh et al., [25] and Naeem et al., [27] where the authors found significant variations for the number of tillers per plant. A maximum plant height of 145.20 cm was recorded for the accession 804 while the minimum was 59.60 for 22,355. Our results are in close agreement with that of Bibi et al. [29] where the researchers found significant differences for days to 50% flowering, days to 50% maturity and plant height. The number of leaves plays an important role in plant development and growth which directly affect the yield both for cereal and fodder plants. The number of leaves per plant has a direct effect on the yield of fodder crops. Accession 22,389 with a maximum number of leaves 10 was the most successful genotype while the minimum number of leaves 4 were recorded for accession 687 and 746. The same character with the same trend although for different accession have been studied by other investigators as well [30,31]. Ahmad et al. [32] suggest in their study that diversity in leaf and other traits in various germplasm at different areas may be also recognised to have variation in genetic makeup, soil nutrients and environmental conditions. Higher fodder yields in oat genotypes can be due to their bigger leaf area, which results in higher photosynthetic activities and a high ability to retain assimilative photosynthesis products [33]. The most important characteristic of a seed-producing plant is its seed yield per plant as the seed is the edible part with high nutritive values. Significant variations were found with respect to seed yield in the genotypes studied whereas the mean value calculated was 20.78 ± 5.17. Maximum Y/P 38.20 g were recorded for the accession 22,350 (Pakistan) and 728, for 723 (USA)—22,324–22,347 the grain yield were (34 g), while for accession 22,390 (Pakistan) the seed yield was (35.6 g) and for 737 (USA) the yield of (36.4g) was recorded. Similar results have been obtained by other investigators as well [27,34]. The knowledge of the relationship between yield and its component characteristics is paramount to make the best use of these relationships in the selection of promising plant types.
In the studied qualitative traits, a number of useful variations were observed. Among the genotypes, with regard to stem thickness, the plant was categorised into three groups: thin (10.25%), intermediate (40.25%) and thick (49.15%) stem plants. Previously, significant variation in stem thickness and other important agro morphological traits have been reported by Kaur et al. and are in close agreement with our study [35]. Chakraborty [36] have evaluated 180 genotypes of Oat for different morphological traits and have found significant variation in growth habit, foliage, plant stature panicle shape and awn. Sumathi and Balamurugan [37] have evaluated 11 Oat varieties and have found significant variation in various traits.
Correlation analysis is another criterion for selecting a plant for successful breeding practices. The findings of this current study are comparable with the reported studies [30,38,39,40] where the contributors found a significant correlation for plant height, 1000 seed weight and filling period. Ahmad et al. [32] reported in their study that plant height were found a positive association with culm diameter, leaf stem ratio, number of tillers and 1000 seed weight and seed length. It can be assumed that agro-morphological screening is extremely necessary and that the selection of possible future lines must take into account both positive and negative associations of useful traits to prevent yield depression or any other quality trait [41].
Moreover, the clustering revealed that genetic diversity and the geographical area were not clustered together since the accessions collected from the same geographical region were divided into separate clusters and those collected from different geographical regions tended to be clustered together and were directly related. The studied genotypes of A. sativa were placed into three main lineages (lineage 1, lineage 2 and lineage 3) and 9 sub-clusters after applying cluster analysis. In a given group variations among the plants were minimum but considerably high when compared to other group plants. In the hybridization program, these varieties would be used to achieve desirable characteristic’s plants at least in the locality where the study has been performed. Our results are comparable with the reported study in literature [35] where the authors have found significant divergence in 96 oat genotypes and have divided them into 6 clusters. The maximum number of germplasm in a single group shows that these genotypes are more nearly related to one another and having less divergence among them. It can be inferred from the study that the heterogeneity observed within the 236 genotypes could not only be due to their geographical origin or environment but also due to their genetic makeup as predicted by cluster and biochemical analysis. Such clustering helps in selecting desirable individuals with specific traits for the crossing program. Days to maturity, plant height, number of spikelets, spike length, leaf length and width, biomass, yield/plant, harvest index and seed weight has contributed more towards divergence, while peduncle length, number of leaves and teller per plant shows less contribution toward divergence, so the direct selection from these traits would be helpful. Similar results have been reported by Ahmed et al. [22].
The biochemical analysis using SDS-PAGE has a great contribution to the estimation of genetic diversity. For the past few decades, biochemical analysis has been getting popular, while determining the genetic diversities among the given plant germplasms and are more beneficial as compared to classical morphological analysis [42]. For protein profiling, SDS-PAGE is one of the most helpful techniques, which is widely used to study genetic differences among different crops [43]. The seed storage protein profiling were made and all the genotypes were grouped into three main lineages which were then further divided into 7 sub-clusters. Among the studied genotypes, the 1st group consist of 4 accessions, the 2nd consist of 16 genotypes while the 3rd is comprised of 34 genotypes. Similarly, a greater degree of polymorphism has been observed by Mirza et al., [44] in Avena fatua where the authors found different polymorphic bands. Similarly, a barely greater degree of polymorphism has been recorded [45] where the contributor found a total of 12 bands.

5. Conclusions

The diversity reported in a considerable number of A. sativa germplasm originating from diverse agro-ecologies are exploited by the plant breeders for genetic improvement of this plant. To get an improved variety of given germplasm the differences in morphological and biochemical parameters are investigated which are the basic criterion for successful breeders. In this study, 236 genotypes were studied for differences in morphological and biochemical traits. Based on seed yield as a nutritive parameter, accession 22,350, 728, 737, 22,390, 22,347, 22,324, 723 and 22,395 was the best genotypes among the studied genotypes. The selected accessions can be used as breeding material to improve the nutritional value of high-yielding oat cultivars. Accession 22,348, 722, 686, 22,335, 843, 664 and 788 as high yield fodder in terms of biomass was the most successful accession. The studied parameters in terms of correlation showed significantly positive associations with each other and thus have the potential to be used in future for the breeding program while selecting the high candidates’ lines. Based on cluster analysis accessions 537 early maturing and 728 based on high yielding were the most appropriate genotypes to be grown on a large scale which would increase per acre production of the selected plant.

Supplementary Materials

The following are available online at https://www.mdpi.com/article/10.3390/agronomy11091713/s1.

Author Contributions

M.I. carried out plants collection and experimental work. M.I. and N.N. carried out a literature search and wrote the manuscript. M.N. and N.N. supervised the work. A.G. carried out identification of the plant. N.N. and A.A.K.K. help in the experiment. A.A.K.K., A.G., A.K., R.U. and A.B.S. carried out the formal analysis and editing of the manuscript. M.N, N.N. and M.Z. finalised the manuscript for publication and help in revisions. All authors have read and approved the manuscript and ensure that this is the case.

Funding

Taif University Researchers Supporting Project number (TURSP-2020/68), Taif University, Taif, Saudi Arabia.

Institutional Review Board Statement

Not Applicable.

Informed Consent Statement

Not Applicable.

Data Availability Statement

All related data are within the manuscript.

Acknowledgments

Taif University Researchers Supporting Project number (TURSP-2020/68), Taif University, Taif, Saudi Arabia. The authors also would like to thank the Director, Bio-Resources Conservation Institute (BCI), National Agriculture Research Centre, Islamabad for providing the seeds and facilitate to conduct the present research work.

Conflicts of Interest

The authors declare no competing interests.

References

  1. Boczkowska, M.; Nowosielski, J.; Nowosielska, D.; Podyma, W. Assessing genetic diversity in 23 early Polish oat cultivars based on molecular and morphological studies. Genet. Resour. Crop. Evol. 2014, 61, 927–941. [Google Scholar] [CrossRef] [Green Version]
  2. FAOSTAT, F. FAOSTAT. 20 December. Available online: http://faostat3.fao.Org/home (accessed on 1 December 2015).
  3. Sterna, V.; Zute, S.; Brunava, L. Oat grain composition and its nutrition benefice. Agric. Agric. Sci. Procedia. 2016, 8, 252–256. [Google Scholar] [CrossRef] [Green Version]
  4. Rana, M.; Gupta, S.; Kumar, N.; Ranjan, R.; Sah, R.P.; Gajghate, R.; Dwivedi, K.K.; Ahmed, S. Genetic architecture and population structure of Oat Landraces (Avena sativa L.) using molecular and morphological descriptors. J. Tradit. Knowl. 2019, 18, 439–450. [Google Scholar]
  5. Al-Ajmi, M.H.; AL-Refai, S.I. Effect of early planting dates on the growth and yield of two varieties of oat (Avena sativa L.). Plant. Arch. 2020, 20, 124–127. [Google Scholar]
  6. Menon, R.; Gonzalez, T.; Ferruzzi, M.; Jackson, E.; Winderl, D.; Watson, J. Oats from farm to fork. Adv. Food Nutr. Res. 2016, 77, 1–55. [Google Scholar]
  7. Sarantis, S.D.; Eren, N.M.; Kowalcyk, B.; Jimenez–Flores, R.; Alvarez, V.B. Thermodynamic interactions of micellar casein and oat β-glucan in a model food system. Food Hydrocoll. 2021, 115, 106559. [Google Scholar] [CrossRef]
  8. Rasane, P.; Jha, A.; Sabikhi, L.; Kumar, A.; Unnikrishnan, V.S. Nutritional advantages of oats and opportunities for its processing as value added foods-a review. J. Food Sci. Technol. 2015, 52, 662–675. [Google Scholar] [CrossRef] [Green Version]
  9. EFSA Panel on Dietetic Products, Nutrition and Allergies (NDA). Scientific Opinion on the evaluation of allergenic foods and food ingredients for labelling purposes. EFSA J. 2014, 12, 3894. [Google Scholar]
  10. Li, X.; Cai, X.; Ma, X.; Jing, L.; Gu, J.; Bao, L.; Li, J.; Xu, M.; Zhang, Z.; Li, Y. Short-and long-term effects of wholegrain oat intake on weight management and glucolipid metabolism in overweight type-2 diabetics: A randomized control trial. Nutrients 2016, 8, 549. [Google Scholar] [CrossRef] [PubMed] [Green Version]
  11. Arabzai, M.G.; Gul, H. Application Techniques of Molecular Marker and Achievement of Marker Assisted Selection (MAS) in Three Major Crops Rice, Wheat and Maize. IJASBT 2021, 8, 82–93. [Google Scholar]
  12. Sohail, S.; Ansar, M.; Skalicky, M.; Wasaya, A.; Soufan, W.; Ahmad, Y.T.; El-Shehawi, A.M.; Brestic, M.; Sohidul, I.M.; Ali, R.M.; et al. Influence of Tillage Systems and Cereals–Legume Mixture on Fodder Yield, Quality and Net Returns under Rainfed Conditions. Sustainability 2021, 13, 2172. [Google Scholar] [CrossRef]
  13. Niazi, I.A.; Akhtar, S.; Kohli, S.; Naveed, A.; Rauf, S.; Shehzad, M. Oat (Avena sativa L.) advanced lines outperform existing cultivars for forage yield and its components under terminal heat stress. Pakistan J. Agric. Sci. 2020, 57, 327–331. [Google Scholar]
  14. Muhammad, U.H.; Gurmani, Z.A.; Khan, S.; Bakhsh, A. PARC Oat: A new Lodging-resistant, Late-maturing and High-yielding Variety of Oats (Avena sativa L.) for Pakistan. Pak. J. Agric. Sci. 2020, 33, 601. [Google Scholar]
  15. Kaur, R.; Kapoor, R.; Vikal, Y.; Kaur, K. Assessing genetic diversity in dual purpose oat (Avena sativa L.) cultivars based on morphological and quality traits. Int. J. Curr. Microbiol. Appl. Sci. 2018, 7, 1574–1586. [Google Scholar] [CrossRef] [Green Version]
  16. Canales, F.J.; Montilla-Bascón, G.; Bekele, W.A.; Howarth, C.J.; Langdon, T.; Rispail, N.; Tinker, N.A.; Prats, E. Population genomics of Mediterranean oat (Asativa) reveals high genetic diversity and three loci for heading date. Theor. Appl. Genet. 2021, 26, 1–5. [Google Scholar]
  17. Ruwali, Y.; Verma, J.S.; Kumar, L. Comparative genetic diversity analysis of oat (Avena sativa L.) by microsatellite markers and morphological rainfed expressions. Afr. J. Biotechnol. 2013, 12, 3414–3424. [Google Scholar]
  18. Jan, M.; Nisar, M.; Ihsan, M.; Farhatullah; Jan, G.; Hanci, F. Genetic diversity in Pakistani soybean genotypes and North American ancestral lines using agro morphological and rapid markers. Fresenius Environ. Bull. 2019, 28, 2927–2936. [Google Scholar]
  19. Ghafoor, A.; Ahmad, Z.; Qureshi, A.S.; Bashir, M. Genetic relationship in Vigna mungo (L.) Hepper and V. radiata (L.) R. Wilczek based on morphological traits and SDS-PAGE. Euphytica 2002, 123, 367–378. [Google Scholar] [CrossRef]
  20. Nisar, M.; Ghafoor, A.; Khan, M.R.; Subhan, M. Genetic similarity of Pakistani pea (Pisum sativum L.) germplasm with world collection using cluster analysis and jaccard’s similarity index. J. Chem. Soc. Pak. 2009, 31, 138–144. [Google Scholar]
  21. Achleitner, A.; Tinker, N.A.; Zechner, E.; Buerstmayr, H. Genetic diversity among oat varieties of worldwide origin and associations of AFLP markers with quantitative traits. Theor. Appl. Genet. 2008, 117, 1041–1053. [Google Scholar] [CrossRef]
  22. Ahmed, S.; Roy, A.K.; Majumdar, A.B. Genetic diversity and variability analysis in oat (Avena sativa L.). Range Mgmt. Agrofor. 2011, 32, 96–99. [Google Scholar]
  23. Kumar, V.; Lade, S.; Yadav, H.K. Evaluation of genetic diversity in Lepidium sativum L. germplasm based on multivariate analysis. Genet. Resour. Crop. Evol. 2021, 68, 809–820. [Google Scholar] [CrossRef]
  24. Nikoloudakis, N.; Bladenopoulos, K.; Katsiotis, A. Structural patterns and genetic diversity among oat (Avena) landraces assessed by microsatellite markers and morphological analysis. Genet. Resour. Crop. Evol. 2016, 63, 801–811. [Google Scholar] [CrossRef]
  25. Gupta, K.; Mehta, A.K. Genetic variability studies of advanced generation mutant oat (Avena sativa L.) lines for yield, fodder traits and proline content. Range Mange. Agro. For. 2020, 41, 52–59. [Google Scholar]
  26. Wagh, V.R.; Sonone, A.H.; Damame, S.V. Assessment of genetic variability correlation and path coefficient analysis in forage oat (Avena sativa L.). Forage Res. 2018, 44, 172–175. [Google Scholar]
  27. Naeem, M.; Chohan, M.S.M.; Khan, A.H.; Kainth, R.A. Green fodder yield performance of oats varieties under irrigated conditions. J. Agric. Res. 2006, 44, 197–201. [Google Scholar]
  28. Naeem, M.; Kainth, R.A.; Chohan, M.S.M.; Khan, A.H. Study on Fodder Yield Potential of Different Oats Varieties under Irrigated Conditions. Pak. J. Agric. Sci. 2005, 43, 27–31. [Google Scholar]
  29. Bibi, A.; Shahzad, A.N.; Sadaqat, H.A.; Tahir, M.H.N.; Fatima, B. Genetic characterization and inheritance studies of oats (Avena sativa L.) for green fodder yield. IJBPAS 2012, 1, 450–460. [Google Scholar]
  30. Singh, A.; Vyas, R.P.; Kumar, S.; Singh, H.C.; Deep, A.; Malik, P.; Singh, A. Genetic variability and correlation of seed yield and related characters in oat (Avena sativa L.). IJCS 2018, 6, 1532–1537. [Google Scholar]
  31. Ņečajeva, J.; Bleidere, M.; Jansone, Z.; Gailīte, A.; Ruņģis, D. Variability of Seed Germination and Dormancy Characteristics and Genetic Analysis of Latvian Avena fatua Populations. Plants 2021, 10, 235. [Google Scholar] [CrossRef]
  32. Ahmad, M.; Zaffar, G.; Dar, Z.A.; Habib, M.A. review on Oat (Avena sativa L.) as a dual-purpose crop. Sci. Res. Ess. 2014, 9, 52–59. [Google Scholar]
  33. Amanullah, P.S.; Zada, K.; Perveen, S. Growth characters and productivity of oat varieties at Peshawar. Sarhad J. Agric. 2004, 20, 5–10. [Google Scholar]
  34. Ayub, M.; Shehzad, M.; Nadeem, M.A.; Pervez, M.; Naeem, M.; Sarwar, N. Comparative study on forage yield and quality of different oat (Avena sativa L.) varieties under agro-ecological conditions of Faisalabad, Pakistan. Afr. J. Agric. Res. 2011, 6, 3388–3391. [Google Scholar]
  35. Sheikhehpour, S.; Bahraminejad, S.; Cheghamirza, K. Morphological and molecular genetic variations of oat genotypes grown in Kermanshah. Iran. Mol. Biol. Res. 2014, 41, 4023–4030. [Google Scholar] [CrossRef]
  36. Chakraborty, J.A.Y.E.E.T.A.; Arora, R.N.; Joshi, U.N.; Chhabra, A.K. Evaluation of Avena species for yield, quality attributes and disease reaction. Forage Res. 2014, 39, 179–184. [Google Scholar]
  37. Sumathi, S.; Balamurugan, P. Usefulness of morphological characters for varietal identification in oats (Avena sativa L.). Int. J. Plant. Sci. 2014, 9, 7–12. [Google Scholar]
  38. Ahmed, S.; Roy, A.K.; Majumdar, A.B. Correlation and Path Coefficient Analysis for Fodder and Grain Yield Related. Ann. Biol. 2013, 29, 75–78. [Google Scholar]
  39. Sahu, M.; Tiwari, A. Genetic Variability and Association Analysis of Oat (Avena sativa L.) Genotypes for Green Forage Yield and Other Components. Curr. J. Appl. Sci. Tech. 2020, 39, 133–141. [Google Scholar] [CrossRef]
  40. Poonia, A.T.M.A.N.; Phogat, D.S.; Pahuja, S.K.; Bhuker, A.X.A.Y.; Khatri, R.S. Variability, Character Association and Path Coefficient Analysis in fodder Oat for yield and quality traits. Forage Res. 2017, 43, 239–243. [Google Scholar]
  41. Kadam, S.S.; Solanki, N.S.; Arif, M.; Dashora, L.N.; Mundra, S.L.; Upadhyay, B. Productivity and quality of fodder oats (Avena sativa L.) as influenced by sowing time, cutting schedules and nitrogen levels. Indian J. Anim. Nutr. 2019, 36, 179–186. [Google Scholar] [CrossRef]
  42. Nisar, M.; Wadood, S.F.; Iqbal, A.; Nausheen, A.; Ghafoor, A. Intra and inter specific profiling of Pakistani Quercus species growing in the hilly areas of District Dir Khyber Pakhtunkhwa. Pak. J. Bot 2016, 48, 263–270. [Google Scholar]
  43. Ghafoor, A.; Ahmad, Z. Diversity of agronomic traits and total seed protein in black gram Vigna mungo (L.) Hepper. Acta Biol. Crac. Ser. Bot 2005, 47, 69–75. [Google Scholar]
  44. Mirza, B.; Shoaib, M.; Ahmad, M.; Fu, Y.B. Genetic diversity in Pakistani population of Avena fatua revealed by seed storage protein polymorphism. Commun. Biometry Crop. Sci. 2007, 2, 41–48. [Google Scholar]
  45. Tahir, N.A.R. Comparison of RAPD–PCR and SDS–PAGE techniques to evaluate genetic variation among nine barley varieties (Hordeum spp). Malays. Appl. Biol. 2014, 43, 109–119. [Google Scholar]
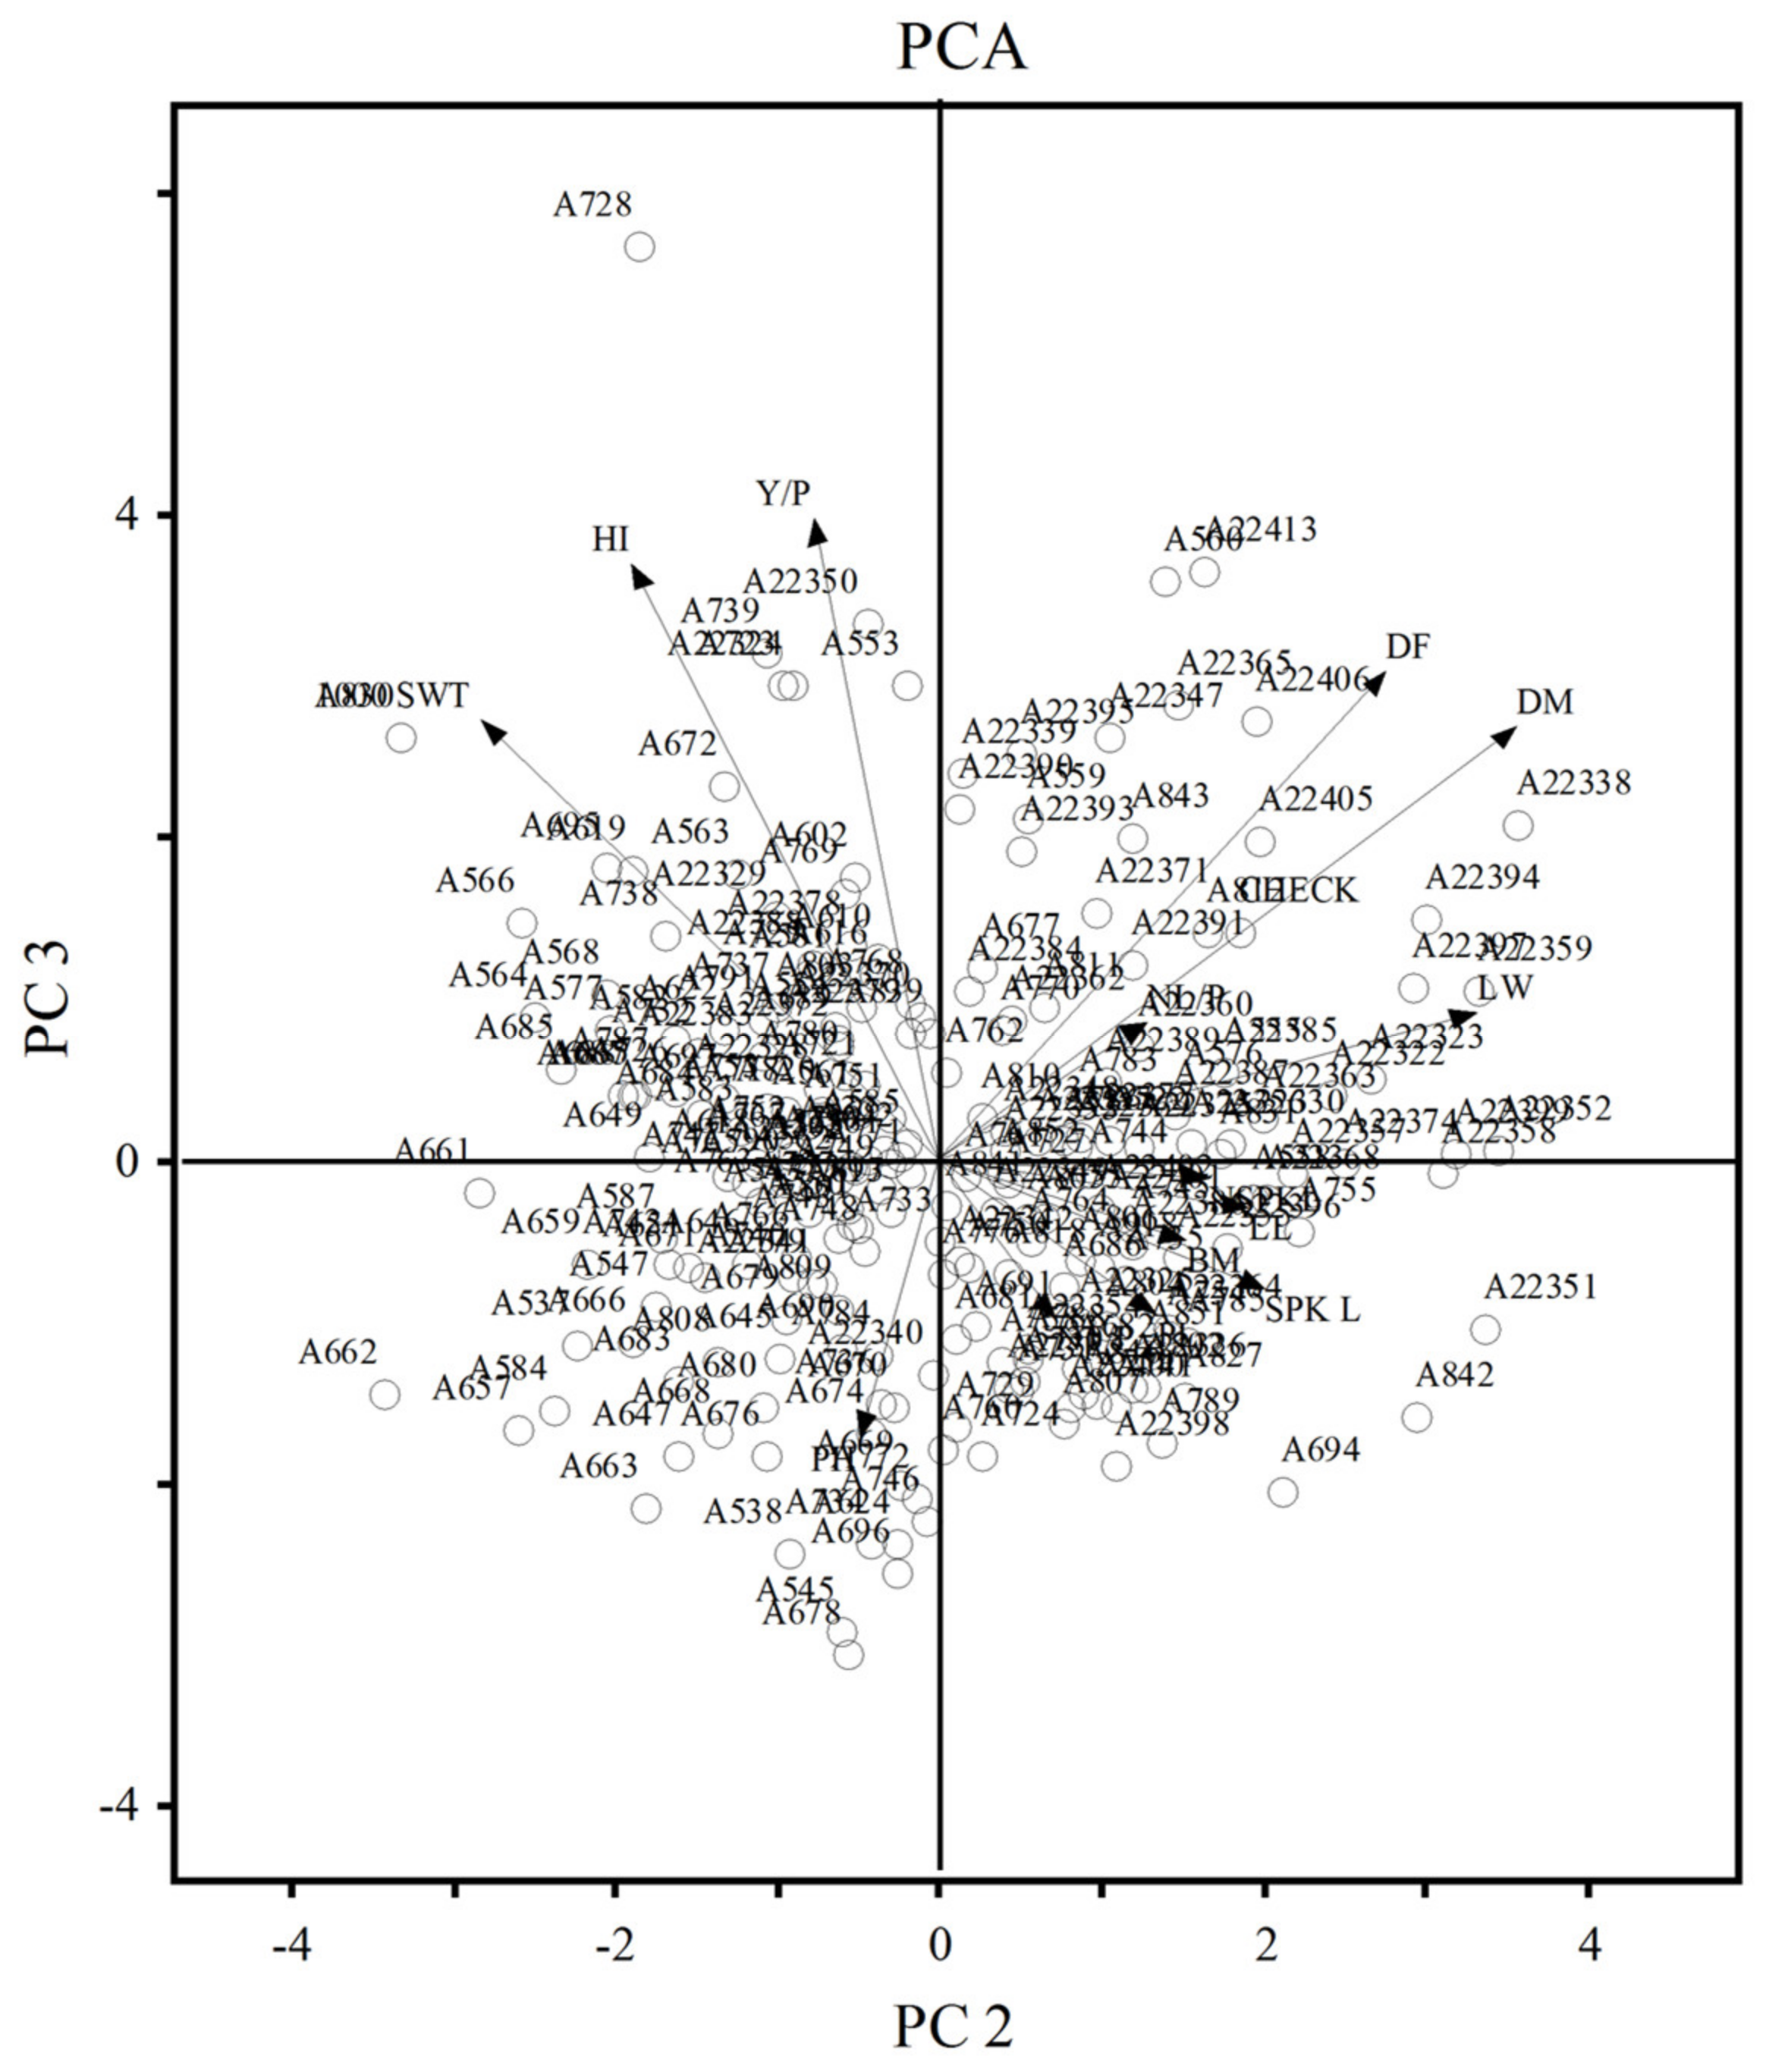
Figure 1. Scatter plot diagram of principal component analysis using different quantitative traits of Oat (Avena sativa L.) germplasm 2019.
Agronomy 11 01713 g001
Figure 2. Scatter plot diagram of principal component analysis using different quantitative traits of Oat (Avena Sativa L.) germplasm 2020.
Agronomy 11 01713 g002
Figure 3. Cluster dendrogram of 236 genotypes of Oat (Avena sativa) based on 14 quantitative traits during 2019.
Agronomy 11 01713 g003
Figure 4. Cluster dendrogram of 100 genotypes of Oat (Avena sativa) based on 14 quantitative traits during 2020.
Agronomy 11 01713 g004
Figure 5. The gel picture shows polymorphic subunits of different Oat (Avena sativa) genotypes of the present study.
Agronomy 11 01713 g005
Figure 6. Cluster Dendrogram showing the relationship between different groups and genotypes of A. sativa based on SDS-PAGE of total seed proteins.
Agronomy 11 01713 g006
Table 1. Range, mean, standard deviation and C.V% of 14 quantitative traits of Oat (Avena sativa) genotypes.
TraitsYearRangeMean ± SDCV %
Days to Flowering2019142–167152.56 ± 4.673.06
2020144–165150.55 ± 4.543.02
Plant Height (cm)201959.6–145.2106.81 ± 18.4317.25
202069.2–140.0108.99 ± 19.9018.26
Number of Tiller/Plant20193.4–14.27.42 ± 1.7924.13
20204.2–117.245 ± 1.4620.18
Number of Leaves/Plant20194.1–106.51 ± 1.3019.95
20204.2–15.27.95 ± 2.0125.29
Leaf Length (cm)201917.3–49.833.102 ± 6.1018.43
202020.0–48.033.63 ± 7.1821.34
Leaf Width (cm)20190.8–2.41.72 ± 0.2715.71
20200.94–2.481.74 ± 0.3117.88
Peduncle Length (cm)201912.4–23.617.8 6± 2.1411.99
202012.8–3019.34 ± 2.9715.35
Spike Length (cm)201914.8–25.419.96 ± 2.2211.13
202014.0–28.821.83 ± 3.5616.31
Number of Spikelet20194.6–158.55 ± 1.7120.00
20206–14.29 ± 1.9521.72
Plant Biomass201951.6–14595.49 ± 5.1723.43
202061.2–146111.59 ± 22.5220.17
Days to Maturity2019172–196182.29 ± 5.042.76
2020174–188179.8 ± 4.602.56
Yield/Plant20198.8–38.220.78 ± 5.1724.85
202012–38.324.844 ± 5.5221.79
1000 Seed weight201915.4–37.220.78 ± 4.9319.89
202015.0–31.825.18 ± 4.1516.48
Harvest Index201910.11–50.8220.78 ± 6.6929.50
202010.11–54.5623.18 ± 7.1230.73
Table 2. Correlation analysis of 14 quantitative traits of 236 genotypes of Oat (Avena sativa) genotype.
TraitsYearDFDMNTPNLPPHNSPKLPLSPKLLLLWBMYPHITSWT
DM20190.52 **
DM20200.86 **
NTP2019−0.23 **−0.23 **
NTP20200.070.09
NLP20190.07−0.010.30 **
NLP20200.110.090.20 *
PH2019−0.36 **−0.39 **0.50 **0.12 *
PH2020−0.011−0.130.25 *0.09
NSPKL2019−0.014 *0.050.20 **0.11 *0.21 **
NSPKL20200.050.070.20 *−0.06−0.01
PL20190.02−0.030.070.040.050.03
PL2020−0.08−0.100.03−0.070.1070.06
SPKL2019−0.010.070.22 **0.050.34 **0.19 **0.35 **
SPKL2020−0.02−0.030.15−0.050.21 *0.080.22 *
LL2019−0.13 *−0.030.46 **0.20 **0.46 **0.32 **−0.010.20 **
LL20200.02−0.060.090.050.060.100.180.12
LW20190.15 *0.20 **0.16 **0.12 *0.060.15 **−0.020.090.28 **
LW2020−0.16−0.090.29 **0.150.26 **0.090.180.24 *0.011
BM20190.070.080.090.050.04−0.040.070.040.11 *−0.02
BM2020−0.01−0.030.38 **0.150.52 **0.130.150.190.39 **0.27 **
YP20190.010.030.21 **0.14 *0.20 **0.12 *0.010.10 *0.21 **0.060.28 **
YP2020−0.09−0.170.20 *0.24 *0.01−0.16−0.060.110.090.24 *0.15
HI2019−0.06−0.040.12 *0.080.15 **0.012 *−0.070.030.100.09−0.58 **0.57 **
HI2020−0.06−0.11−0.150.02−0.40 **−0.21 *−0.13−0.09−0.21 *−0.04−0.64 **0.62 **
TSWT2019−0.04−0.17 **0.060.040.11 *−0.07−0.03−0.030.01−0.23 **0.17 **0.53 **0.28 **
TSWT2020−0.08−0.06−0.010.05−0.09−0.20 *0.06−0.060.13−0.03−0.060.160.16
*. Correlation is significant at the 0.05 level, **. Correlation is significant at the 0.01 level. DF—days to flowering, DM—days to maturity, NTP—number of tiller/plant, NLP—number of leaves/plant, PH—plant height, NSPKL—number of spikelet, PL—peduncle length, SPKL—spike length, LL—leaf length, LW—leaf width, BM—biomass, YP-yield/plant, HI—harvest index, TSWT—1000 seed weight.
Table 3. Principal components analysis of the 14 agro-morphological traits of Oat (Avena sativa) 2019–2020.
PCA 2019PCA 2020
TraitsPC1PC2PC3PC4PC1PC2PC3PC4
DF0.230.330.40−0.09−0.050.520.390.04
DM0.200.430.380.01−0.050.540.370.02
NT/P−0.430.10−0.13−0.030.320.010.31−0.20
NL/P−0.200.160.12−0.030.10−0.040.430.14
PH−0.45−0.04−0.23−0.010.41−0.06−0.070.14
NSPKL−0.250.210.000.200.25−0.080.03−0.30
PL−0.070.19−0.10−0.170.22−0.10−0.130.02
SPK L−0.230.28−0.07−0.050.31−0.210.17−0.29
LL−0.390.25−0.020.030.26−0.010.070.34
LW−0.120.410.140.250.170.19−0.10−0.47
BM−0.030.20−0.05−0.710.02−0.420.49−0.08
Y/P−0.31−0.130.50−0.250.510.040.040.20
HI−0.24−0.280.460.40−0.39−0.340.33−0.21
1000 Seed weight−0.17−0.380.32−0.37−0.06−0.210.140.56
% of Variance20.6613.1412.5511.2519.8315.3912.558.66
Cum. % of Variance20.6633.8046.3557.6019.8335.2247.7756.43
DF—days to flowering, DM—days to maturity, NTP—number of tiller/plant, NLP—number of leaves/plant, PH—plant height, NSPKL—number of spikelet, PL—peduncle length, SPKL—spike length, LL—leaf length, LW—leaf width, BM—biomass, YP—yield/plant, HI—harvest index, TSWT—1000 seed weight.
Table 4. Clustering mean based analysis of 14 quantitative traits of Oat (Avena sativa) genotypes for the year 2019.
Traits ± SD ClusterCluster 1Cluster 2Cluster 3Cluster 4Cluster 5Cluster 6Cluster 7Cluster 8Cluster 9
DF153.7 ± 4.3151.7 ± 3.6150.9 ± 3.3152.3 ± 4.2151.1 ± 3.6150.9 ± 3.7153 ± 5.2158.7 ± 5.8165 ± 2
DM182.7 ± 4.6181.3 ± 3.7180.9 ± 3.9182.8 ± 5.4181.3 ± 4180.5 ± 3.5189.4 ± 3.4188.3 ± 5.6181 ± 2
NT/P6.6 ± 1.47.9 ± 1.58.02 ± 1.57.2 ± 1.57.6 ± 1.37.8 ± 1.56.5 ± 1.35.9 ± 1.28.2 ± 0.2
NL/P6.2 ± 1.16.6 ± 1.36.5 ± 1.16.5 ± 1.26.5 ± 1.26.6 ± 1.36 ± 1.016.3 ± 1.17.8 ± 0.2
PH96.7 ± 10.1110.8 ± 9.3115.7 ± 12.1104.5 ± 15.8109.7 ± 10.6116.5 ± 1283.2 ± 5.874.2 ± 7.695.8 ± 0.2
NSPKL7.8 ± 1.68.5 ± 1.78.8 ± 1.68.6 ± 1.68.7 ± 1.68.8 ± 1.69.6 ± 28.2 ± 1.57 ± 0.2
PL17.5 ± 2.418.1 ± 2.118.2 ± 2.218.2 ± 2.218.1 ± 2.118 ± 116.6 ± 2.518.1 ± 1.516.8 ± 0.2
SPK L19.3 ± 2.120.1 ± 2.0120.5 ± 1.919.9 ± 2.220 ± 220.3 ± 220.3 ± 1.718.9 ± 218 ± 0.2
LL31.4 ± 6.534.4 ± 5.235.03 ± 1.832.6 ± 5.7834 ± 5.234.3 ± 4.932 ± 5.927.1 ± 4.629.4 ± 0.2
LW1.7 ± 0.21.7 ± 0.21.7 ± 0.261.7 ± 0.21.6 ± 0.21.6 ± 28.31.9 ± 0.21.8 ± 0.231.6 ± 1.2
BM92.7 ± 12.6122.5 ± 9.5116 ± 8.3117.5 ± 7.7119.5 ± 8.591.5 ± 23.861.1 ± 4.783 ± 1078 ± 2
YP20.7 ± 5.621.2 ± 5.422.1 ± 5.721.1 ± 5.621.7 ± 5.720.6 ± 5.117.9 ± 2.619.5 ± 4.638.2 ± 0.2
HI22.3 ± 4.817.3 ± 4.119 ± 4.517.9 ± 4.118.1 ± 4.123.7 ± 7.629.4 ± 523.5 ± 4.648.9 ± 0.7
TSWT25.3 ± 5.225 ± 4.826.1 ± 5.124.8 ± 5.125.7 ± 524.6 ± 4.821.6 ± 323.8 ± 4.135 ± 0.2
DF—days to flowering, DM—days to maturity, NTP—number of tiller/plant, NLP—number of leaves/plant, PH—plant height, NSPKL—number of spikelet, PL—peduncle length, SPKL—spike length, LL—leaf length, LW—leaf width, BM—biomass, YP—yield/plant, HI—harvest index, TSWT—1000 seed weight.
Table 5. Clustering mean based analysis of 100 genotypes of 14 quantitative traits of Oat (Avena sativa) for the year 2020.
TraitsCL1CL2CL3CL4CL5
DF150.6 ± 4.9150.7 ± 4.6150.7 ± 4150 ± 3.8151.1 ± 5.1
DM180.2 ± 4.7180 ± 4.52180 ± 5.1179.3 ± 4.6179.7 ± 5.4
NTP7 ± 1.37.44 ± 1.46.6 ± 1.56.4 ± 1.16.8 ± 1.4
NLP8 ± 1.78.48 ± 2.57.6 ± 2.17.2 ± 27.8 ± 1.6
PH110.8 ± 11.9126.19 ± 144.2787.9 ± 8.996.2 ± 20.983 ± 5.2
NSPKL9.3 ± 1.98.97 ± 28.7 ± 1.58.1 ± 19 ± 2.1
PL18.9 ± 2.620.9 ± 3.618.2 ± 2.618 ± 3.219.4 ± 2.3
SPKL20.8 ± 1323.83 ± 2.821.6 ± 3.520.3 ± 420.9 ± 4
LL35.9 ± 6.235.37 ± 7.230.4 ± 6.630.2 ± 6.635.9 ± 7.1
LW1.7 ± 0.21.9 ± 3.11.6 ± .3.61.5 ± .41.6 ± .2.4
BM123.6 ± 12.9125.9 ± 11.879.4 ± .976.5 ± 7.4115.2 ± 12.4
YP23.3 ± 0.326.3 ± 6.2425.3 ± 6.525 ± 6.525.8 ± 4.3
HI19.1 ± 4.820.9 ± 4.432. ± 8.133.2 ± 10.122.4 ± 3.4
TSWT24.9 ± 4.424.7 ± 3.825.2. ± 4.426.6 ± 2.925.2 ± 4.4
DF—days to flowering, DM—days to maturity, NTP—number of tiller/plant, NLP—number of leaves/plant, PH—plant height, NSPKL—number of spikelet, PL—peduncle length, SPKL—spike length, LL—leaf length, LW—leaf width, BM—biomass, YP—yield/plant, HI—harvest index, TSWT—1000 seed weight.
Publisher’s Note: MDPI stays neutral with regard to jurisdictional claims in published maps and institutional affiliations.